1. Six Sigma Simplified
for Service Organizations
Best Practice Approach
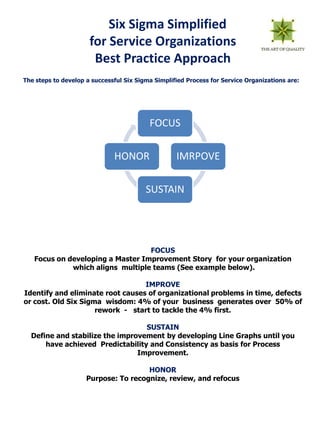
The steps to develop a successful Six Sigma Simplified Process for Service Organizations are:
FOCUS
HONOR IMRPOVE
SUSTAIN
FOCUS
Focus on developing a Master Improvement Story for your organization
which aligns multiple teams (See example below).
IMPROVE
Identify and eliminate root causes of organizational problems in time, defects
or cost. Old Six Sigma wisdom: 4% of your business generates over 50% of
rework - start to tackle the 4% first.
SUSTAIN
Define and stabilize the improvement by developing Line Graphs until you
have achieved Predictability and Consistency as basis for Process
Improvement.
HONOR
Purpose: To recognize, review, and refocus
2. SIX SIGMA SCORECARD
MASTER IMPROVEMENT STORY
Long-Term Short-Term Measures Targets
Increase
Frequency of
VISION Customer Applicant
Acceptance
Sale
% increase
Increase
Customer
Customer % increase
Satisfaction
Satisfaction
Increase Hiring
“Perfect Fit”
“Perfect Fit” % increase
Achieved Rate
Rate
Financial Increase Task # of Task
% increase
Order Size Order
Growth
Increase
# of Customers % increase
Customers
Increase
Frequency % increase
Frequency
Reduce Cycle
Six Sigma’s Quality Time
Cycle Time % reduction
Operational
Focus # and % of
Reduce Defects % reduction
Drives Defects
Financial
Growth and Reduce Costs
Cost of Waste
% reduction
& Rework
Customer
Satisfaction
Learning & Increase Core
Training % increase
Growth Skills
Increase Opt
Opt System
Systems % reduction
Unavailability
Availability
3. ROADMAP to
LEAN SIX SIGMA SUCCESS
for Service Organizations
SET BIG GOALS
After you have identifed your key measurements and Early Warning
Indicators for each of these goals, go ahead and SET BIG GOALS like 50% less
defects in processing jobs. (You get 50% more bigger Ideas, forget the 10% here!)
DON’T DELEGATE
Only start team approach with outlock of success and after you have already
valuable Data collected and available
KEY SIX SIGMA TOOLS
Use Line Graphs, Pareto/Fishbone and Cause and Effect Charts to focus and
analyze problems. Measure daily, weekly or monthly, where and what occurs
Develop your “Yardsticks” your EARLY WARNING INDICATORS (Example below)
“QUALITY” “PROCESS”
Requirement Indicator Early Warning Indicator
Percent of Defective Amount of rework per step
Number of defects per step
Missed Committments Time per process step Delay
(Idle, rework time)
Value Cost of waste and rework
Paycheck errors For ex.: timesheet errors
% timesheet late
Cost of missed committment Number of Task orders lost
4. AVOID PITFALLS
• Don’t use formulas and other to complicated tools in service business
• Devide between Control Charts for COMMON CAUSE and SPECIAL
CAUSE
• Choose THE RIGHT CONTROL CHARTS:
Use horizontal (X Axis)for day, week or month
Use vertical (Y Axis) for number or percent defective, time, lenghts…
100%
80%
60% UCL
40% CL
LCL
20%
0%
week 1 week 2 week 3 week 4
Explanation:
UCL: Upper Control Limits
CL: Center Line
LCL: Lower Control Limits
You see how often data is collected (X axis)
You see the number or percentage of defects (Y axis)
The center line makes it happen to evaluate the process stability !
Take the UCL / LCL for your absolute customer requirements limits
Define the scale from UCL to LCL in scale points from 1-10
Measure “Out of Control” processes and stabilize them with
Preventive Actions !