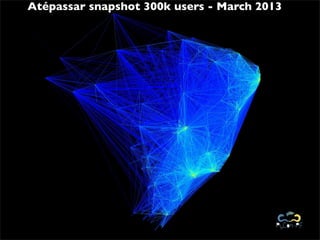
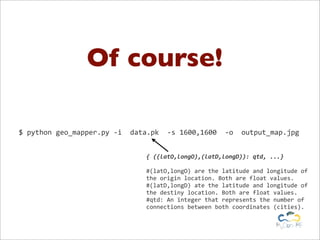
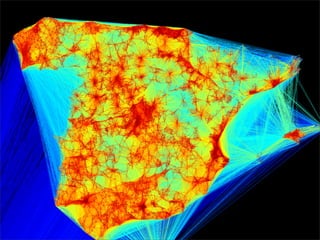
GeoLocation Friends
    Visualizer
    Plotting your location social network data


Marcel Caraciolo
@marcelcaraciolo
Developer, Cientist, contributor to the Crab recsys project,
works with Python for 6 years, interested at mobile,
education, machine learning and dataaaaa!
Recife, Brazil - http://aimotion.blogspot.com
How your friends
 are connected ?
How your friends
 are connected ?


Where are they ?
Atépassar snapshot 300k users - March 2013
Can I use it ???


    Please!
Of course!

https://github.com/marcelcaraciolo/Geo-Friendship-Visualization
Of course!
if	
  __name__	
  ==	
  '__main__':


  parser	
  =	
  OptionParser(usage=SUPPRESS_USAGE)


  print	
  'geocialMapper	
  v.%snBy	
  %sn'	
  %(__version__,__author__)


  print	
  "Type	
  -­‐-­‐help	
  parameter	
  for	
  help.n"


  parser.add_option('-­‐i','-­‐-­‐input-­‐file',dest='input_file',


  help='Pickle	
  object	
  file	
  with	
  coordinates	
  and	
  quantity')


  parser.add_option('-­‐s','-­‐-­‐size',dest='size',


  help='image	
  dimmensions	
  height,width')


  parser.add_option('-­‐o',	
  '-­‐-­‐output-­‐file',	
  dest='output_file',	
  default=	
  'map.jpg',


  help='Output	
  file	
  for	
  saving	
  the	
  image')


  parser.add_option('-­‐c',	
  '-­‐-­‐colormap',	
  dest='mode',	
  default='wb',


  help='Mode	
  of	
  colormap	
  used:	
  wb,	
  all')


  parser.add_option('-­‐p',	
  '-­‐-­‐connection',	
  dest='n_connections',	
  default=0,	
  type='int',


  help=	
  'Threshold	
  for	
  the	
  number	
  of	
  interconnections	
  between	
  cities')


  (options,args)	
  =	
  parser.parse_args()


  if	
  not	
  options.input_file:


  parser.error('You	
  must	
  specifiy	
  a	
  valid	
  pickle	
  object	
  to	
  load	
  data	
  (-­‐i	
  parameter)	
  !')


  if	
  not	
  options.size:


  parser.error('You	
  must	
  specifiy	
  the	
  dimmensions	
  of	
  the	
  image	
  (-­‐s	
  parameter)	
  !')


  run_main(options)
Of course!

$	
  python	
  geo_mapper.py	
  -­‐i	
  	
  data.pk	
  	
  -­‐s	
  1600,1600	
  	
  -­‐o	
  	
  output_map.jpg


                                                  {	
  ((latO,longO),(latD,longD)):	
  qtd,	
  ...}

                                                  #(latO,longO)	
  are	
  the	
  latitude	
  and	
  longitude	
  of	
  
                                                  the	
  origin	
  location.	
  Both	
  are	
  float	
  values.
                                                  #(latD,longD)	
  ate	
  the	
  latitude	
  and	
  longitude	
  of	
  
                                                  the	
  destiny	
  location.	
  Both	
  are	
  float	
  values.
                                                  #qtd:	
  An	
  integer	
  that	
  represents	
  the	
  number	
  of	
  
                                                  connections	
  between	
  both	
  coordinates	
  (cities).
Code available!

https://github.com/marcelcaraciolo/Geo-Friendship-Visualization
GeoLocation Friends
    Visualizer
    Plotting your location social network data


Marcel Caraciolo
@marcelcaraciolo
Developer, Cientist, contributor to the Crab recsys project,
works with Python for 6 years, interested at mobile,
education, machine learning and dataaaaa!
Recife, Brazil - http://aimotion.blogspot.com

GeoMapper, Python Script for Visualizing Data on Social Networks with Geo-location data

  • 1.
    GeoLocation Friends Visualizer Plotting your location social network data Marcel Caraciolo @marcelcaraciolo Developer, Cientist, contributor to the Crab recsys project, works with Python for 6 years, interested at mobile, education, machine learning and dataaaaa! Recife, Brazil - http://aimotion.blogspot.com
  • 2.
    How your friends are connected ?
  • 3.
    How your friends are connected ? Where are they ?
  • 4.
    Atépassar snapshot 300kusers - March 2013
  • 6.
    Can I useit ??? Please!
  • 7.
  • 8.
    Of course! if  __name__  ==  '__main__':        parser  =  OptionParser(usage=SUPPRESS_USAGE)        print  'geocialMapper  v.%snBy  %sn'  %(__version__,__author__)        print  "Type  -­‐-­‐help  parameter  for  help.n"        parser.add_option('-­‐i','-­‐-­‐input-­‐file',dest='input_file',                                              help='Pickle  object  file  with  coordinates  and  quantity')        parser.add_option('-­‐s','-­‐-­‐size',dest='size',                                              help='image  dimmensions  height,width')        parser.add_option('-­‐o',  '-­‐-­‐output-­‐file',  dest='output_file',  default=  'map.jpg',                                              help='Output  file  for  saving  the  image')        parser.add_option('-­‐c',  '-­‐-­‐colormap',  dest='mode',  default='wb',                                              help='Mode  of  colormap  used:  wb,  all')        parser.add_option('-­‐p',  '-­‐-­‐connection',  dest='n_connections',  default=0,  type='int',                                              help=  'Threshold  for  the  number  of  interconnections  between  cities')        (options,args)  =  parser.parse_args()        if  not  options.input_file:                parser.error('You  must  specifiy  a  valid  pickle  object  to  load  data  (-­‐i  parameter)  !')        if  not  options.size:                parser.error('You  must  specifiy  the  dimmensions  of  the  image  (-­‐s  parameter)  !')        run_main(options)
  • 9.
    Of course! $  python  geo_mapper.py  -­‐i    data.pk    -­‐s  1600,1600    -­‐o    output_map.jpg {  ((latO,longO),(latD,longD)):  qtd,  ...} #(latO,longO)  are  the  latitude  and  longitude  of   the  origin  location.  Both  are  float  values. #(latD,longD)  ate  the  latitude  and  longitude  of   the  destiny  location.  Both  are  float  values. #qtd:  An  integer  that  represents  the  number  of   connections  between  both  coordinates  (cities).
  • 11.
  • 12.
    GeoLocation Friends Visualizer Plotting your location social network data Marcel Caraciolo @marcelcaraciolo Developer, Cientist, contributor to the Crab recsys project, works with Python for 6 years, interested at mobile, education, machine learning and dataaaaa! Recife, Brazil - http://aimotion.blogspot.com