APM Welcome, APM North West Network Conference, Synergies Across Sectors
Cross Tabs
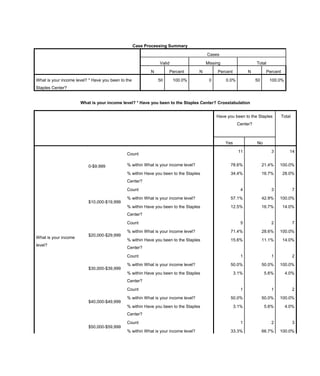
1. Case Processing Summary
Cases
Valid Missing Total
N Percent N Percent N Percent
What is your income level? * Have you been to the
Staples Center?
50 100.0% 0 0.0% 50 100.0%
What is your income level? * Have you been to the Staples Center? Crosstabulation
Have you been to the Staples
Center?
Total
Yes No
What is your income
level?
0-$9,999
Count
11 3 14
% within What is your income level? 78.6% 21.4% 100.0%
% within Have you been to the Staples
Center?
34.4% 16.7% 28.0%
$10,000-$19,999
Count 4 3 7
% within What is your income level? 57.1% 42.9% 100.0%
% within Have you been to the Staples
Center?
12.5% 16.7% 14.0%
$20,000-$29,999
Count 5 2 7
% within What is your income level? 71.4% 28.6% 100.0%
% within Have you been to the Staples
Center?
15.6% 11.1% 14.0%
$30,000-$39,999
Count 1 1 2
% within What is your income level? 50.0% 50.0% 100.0%
% within Have you been to the Staples
Center?
3.1% 5.6% 4.0%
$40,000-$49,999
Count 1 1 2
% within What is your income level? 50.0% 50.0% 100.0%
% within Have you been to the Staples
Center?
3.1% 5.6% 4.0%
$50,000-$59,999
Count 1 2 3
% within What is your income level? 33.3% 66.7% 100.0%
2. % within Have you been to the Staples
Center?
3.1% 11.1% 6.0%
$60,000-$69,999
Count 0 1 1
% within What is your income level? 0.0% 100.0% 100.0%
% within Have you been to the Staples
Center?
0.0% 5.6% 2.0%
$70,000-$79,999
Count 0 1 1
% within What is your income level? 0.0% 100.0% 100.0%
% within Have you been to the Staples
Center?
0.0% 5.6% 2.0%
$80,000-$89,999
Count 4 3 7
% within What is your income level? 57.1% 42.9% 100.0%
% within Have you been to the Staples
Center?
12.5% 16.7% 14.0%
$90,000-$99,999
Count 1 1 2
% within What is your income level? 50.0% 50.0% 100.0%
% within Have you been to the Staples
Center?
3.1% 5.6% 4.0%
$100,000 and over
Count 4 0 4
% within What is your income level? 100.0% 0.0% 100.0%
% within Have you been to the Staples
Center?
12.5% 0.0% 8.0%
Total
Count
32 18 50
% within What is your income level? 64.0% 36.0% 100.0%
% within Have you been to the Staples
Center?
100.0% 100.0% 100.0%
Case Processing Summary
Cases
Valid Missing Total
N Percent N Percent N Percent
What age group do you belong to? * Favorite types of
entertainment
50 100.0% 0 0.0% 50 100.0%
3. What age group do you belong to? * Favorite types of entertainment Crosstabulation
Favorite types of entertainment Total
attendin
g
sporting
events
watchin
g
sporting
events
dining Bars/nigh
t clubs
shoppin
g
bowlin
g
sightseein
g
going
to the
movies
9.00
What
age
group
do
you
belon
g to?
16-
20
Count 2 1 1 0 4 1 0 1 1 11
% within
What age
group do you
belong to?
18.2% 9.1% 9.1% 0.0% 36.4% 9.1% 0.0% 9.1% 9.1% 100.0
%
% within
Favorite
types of
entertainmen
t
16.7% 12.5% 14.3% 0.0% 50.0% 33.3% 0.0% 50.0% 100.0
%
22.0%
21-
25
Count 3 1 2 1 2 0 1 0 0 10
% within
What age
group do you
belong to?
30.0% 10.0% 20.0% 10.0% 20.0% 0.0% 10.0% 0.0% 0.0% 100.0
%
% within
Favorite
types of
entertainmen
t
25.0% 12.5% 28.6% 14.3% 25.0% 0.0% 50.0% 0.0% 0.0% 20.0%
26-
30
Count 2 0 2 2 1 0 1 0 0 8
% within
What age
group do you
belong to?
25.0% 0.0% 25.0% 25.0% 12.5% 0.0% 12.5% 0.0% 0.0% 100.0
%
% within
Favorite
types of
entertainmen
t
16.7% 0.0% 28.6% 28.6% 12.5% 0.0% 50.0% 0.0% 0.0% 16.0%
31- Count 0 1 0 0 0 0 0 0 0 1
4. 35 % within
What age
group do you
belong to?
0.0% 100.0% 0.0% 0.0% 0.0% 0.0% 0.0% 0.0% 0.0% 100.0
%
% within
Favorite
types of
entertainmen
t
0.0% 12.5% 0.0% 0.0% 0.0% 0.0% 0.0% 0.0% 0.0% 2.0%
41-
45
Count 1 0 0 2 1 0 0 0 0 4
% within
What age
group do you
belong to?
25.0% 0.0% 0.0% 50.0% 25.0% 0.0% 0.0% 0.0% 0.0% 100.0
%
% within
Favorite
types of
entertainmen
t
8.3% 0.0% 0.0% 28.6% 12.5% 0.0% 0.0% 0.0% 0.0% 8.0%
46-
50
Count 1 1 1 1 0 1 0 0 0 5
% within
What age
group do you
belong to?
20.0% 20.0% 20.0% 20.0% 0.0% 20.0% 0.0% 0.0% 0.0% 100.0
%
% within
Favorite
types of
entertainmen
t
8.3% 12.5% 14.3% 14.3% 0.0% 33.3% 0.0% 0.0% 0.0% 10.0%
50
and
ove
r
Count 3 4 1 1 0 1 0 1 0 11
% within
What age
group do you
belong to?
27.3% 36.4% 9.1% 9.1% 0.0% 9.1% 0.0% 9.1% 0.0% 100.0
%
% within
Favorite
types of
entertainmen
t
25.0% 50.0% 14.3% 14.3% 0.0% 33.3% 0.0% 50.0% 0.0% 22.0%
5. Total
Count 12 8 7 7 8 3 2 2 1 50
% within
What age
group do you
belong to?
24.0% 16.0% 14.0% 14.0% 16.0% 6.0% 4.0% 4.0% 2.0% 100.0
%
% within
Favorite
types of
entertainmen
t
100.0% 100.0% 100.0
%
100.0% 100.0% 100.0
%
100.0% 100.0
%
100.0
%
100.0
%
Case Processing Summary
Cases
Valid Missing Total
N Percent N Percent N Percent
What is your gender? * What is your favorite sport to
watch?
50 100.0% 0 0.0% 50 100.0%
What is your gender? * What is your favorite sport to watch? Crosstabulation
What is your favorite sport to watch? Total
Hockey Basketball Baseball Soccer
What is your gender?
Male
Count 3 9 16 1 29
% within What is your gender? 10.3% 31.0% 55.2% 3.4% 100.0%
% within What is your favorite sport to watch? 60.0% 40.9% 76.2% 50.0% 58.0%
Female
Count 2 13 5 1 21
% within What is your gender? 9.5% 61.9% 23.8% 4.8% 100.0%
% within What is your favorite sport to watch? 40.0% 59.1% 23.8% 50.0% 42.0%
Total
Count 5 22 21 2 50
% within What is your gender? 10.0% 44.0% 42.0% 4.0% 100.0%
% within What is your favorite sport to watch? 100.0% 100.0% 100.0% 100.0% 100.0%
Case Processing Summary
Cases
Valid Missing Total
6. N Percent N Percent N Percent
What age group do you belong to? * What is your
favorite sport to watch?
50 100.0% 0 0.0% 50 100.0%
What age group do you belong to? * What is your favorite sport to watch? Crosstabulation
What is your favorite sport to watch? Total
Hockey Basketball Baseball Soccer
What age group do you belong
to?
16-20
Count 2 6 3 0 11
% within What age group do you belong
to?
18.2% 54.5% 27.3% 0.0% 100.0%
% within What is your favorite sport to
watch?
40.0% 27.3% 14.3% 0.0% 22.0%
21-25
Count 1 4 4 1 10
% within What age group do you belong
to?
10.0% 40.0% 40.0% 10.0% 100.0%
% within What is your favorite sport to
watch?
20.0% 18.2% 19.0% 50.0% 20.0%
26-30
Count 0 7 1 0 8
% within What age group do you belong
to?
0.0% 87.5% 12.5% 0.0% 100.0%
% within What is your favorite sport to
watch?
0.0% 31.8% 4.8% 0.0% 16.0%
31-35
Count 0 0 1 0 1
% within What age group do you belong
to?
0.0% 0.0% 100.0% 0.0% 100.0%
% within What is your favorite sport to
watch?
0.0% 0.0% 4.8% 0.0% 2.0%
41-45
Count 1 1 1 1 4
% within What age group do you belong
to?
25.0% 25.0% 25.0% 25.0% 100.0%
% within What is your favorite sport to
watch?
20.0% 4.5% 4.8% 50.0% 8.0%
46-50
Count 1 2 2 0 5
% within What age group do you belong
to?
20.0% 40.0% 40.0% 0.0% 100.0%
7. % within What is your favorite sport to
watch?
20.0% 9.1% 9.5% 0.0% 10.0%
50 and
over
Count 0 2 9 0 11
% within What age group do you belong
to?
0.0% 18.2% 81.8% 0.0% 100.0%
% within What is your favorite sport to
watch?
0.0% 9.1% 42.9% 0.0% 22.0%
Total
Count 5 22 21 2 50
% within What age group do you belong
to?
10.0% 44.0% 42.0% 4.0% 100.0%
% within What is your favorite sport to
watch?
100.0% 100.0% 100.0% 100.0% 100.0%
Case Processing Summary
Cases
Valid Missing Total
N Percent N Percent N Percent
What age group do you belong to? * Which statement
is the closest reflection of your opinion of the L.A.
Clippers?
50 100.0% 0 0.0% 50 100.0%
What age group do you belong to? * Which statement is the closest reflection of your opinion of the L.A. Clippers?
Crosstabulation
Which statement is the closest reflection of your opinion of the L.A. Clippers? Total
They
are my
favorite
team; I
actively
follow
them
I am
starting to
follow
them
since they
have
been
improving
I like
Clipper
Darrell
I watch
a game
when
nothing
else is
on.
They
play
well.
I do not
like
them
I have never
heard of the
Clippers/have
no opinion of
them
I have
never
watched
a
Clippers
game
Other
What 16- Count 0 0 1 0 0 3 0 7 0 11
8. age
group
do you
belong
to?
20 % within
What age
group do
you
belong to?
0.0% 0.0% 9.1% 0.0% 0.0% 27.3% 0.0% 63.6% 0.0% 100.0%
% within
Which
statement
is the
closest
reflection
of your
opinion of
the L.A.
Clippers?
0.0% 0.0% 33.3% 0.0% 0.0% 37.5% 0.0% 43.8% 0.0% 22.0%
21-
25
Count 0 1 0 0 3 2 0 3 1 10
% within
What age
group do
you
belong to?
0.0% 10.0% 0.0% 0.0% 30.0% 20.0% 0.0% 30.0% 10.0% 100.0%
% within
Which
statement
is the
closest
reflection
of your
opinion of
the L.A.
Clippers?
0.0% 11.1% 0.0% 0.0% 37.5% 25.0% 0.0% 18.8% 33.3% 20.0%
26-
30
Count 0 3 0 1 0 2 0 1 1 8
% within
What age
group do
you
belong to?
0.0% 37.5% 0.0% 12.5% 0.0% 25.0% 0.0% 12.5% 12.5% 100.0%
9. % within
Which
statement
is the
closest
reflection
of your
opinion of
the L.A.
Clippers?
0.0% 33.3% 0.0% 100.0% 0.0% 25.0% 0.0% 6.3% 33.3% 16.0%
31-
35
Count 1 0 0 0 0 0 0 0 0 1
% within
What age
group do
you
belong to?
100.0% 0.0% 0.0% 0.0% 0.0% 0.0% 0.0% 0.0% 0.0% 100.0%
% within
Which
statement
is the
closest
reflection
of your
opinion of
the L.A.
Clippers?
100.0% 0.0% 0.0% 0.0% 0.0% 0.0% 0.0% 0.0% 0.0% 2.0%
41-
45
Count 0 1 0 0 1 0 0 2 0 4
% within
What age
group do
you
belong to?
0.0% 25.0% 0.0% 0.0% 25.0% 0.0% 0.0% 50.0% 0.0% 100.0%
10. % within
Which
statement
is the
closest
reflection
of your
opinion of
the L.A.
Clippers?
0.0% 11.1% 0.0% 0.0% 12.5% 0.0% 0.0% 12.5% 0.0% 8.0%
46-
50
Count 0 0 2 0 1 0 0 2 0 5
% within
What age
group do
you
belong to?
0.0% 0.0% 40.0% 0.0% 20.0% 0.0% 0.0% 40.0% 0.0% 100.0%
% within
Which
statement
is the
closest
reflection
of your
opinion of
the L.A.
Clippers?
0.0% 0.0% 66.7% 0.0% 12.5% 0.0% 0.0% 12.5% 0.0% 10.0%
50
and
over
Count 0 4 0 0 3 1 1 1 1 11
% within
What age
group do
you
belong to?
0.0% 36.4% 0.0% 0.0% 27.3% 9.1% 9.1% 9.1% 9.1% 100.0%
11. % within
Which
statement
is the
closest
reflection
of your
opinion of
the L.A.
Clippers?
0.0% 44.4% 0.0% 0.0% 37.5% 12.5% 100.0% 6.3% 33.3% 22.0%
Total
Count 1 9 3 1 8 8 1 16 3 50
% within
What age
group do
you
belong to?
2.0% 18.0% 6.0% 2.0% 16.0% 16.0% 2.0% 32.0% 6.0% 100.0%
% within
Which
statement
is the
closest
reflection
of your
opinion of
the L.A.
Clippers?
100.0% 100.0% 100.0% 100.0% 100.0% 100.0% 100.0% 100.0% 100.0% 100.0%
Statistics
What do you
like about
the Staples
Center?
What do you
dislike about
the Staples
Center?
Which statement
is the closest
reflection of your
opinion of the L.A.
Clippers?
Have you
been to the
Staples
Center?
Why do
you attend
sporting
events?
What is
your
favorite
sport to
watch?
Opinion
of Los
Angeles
Favorite types
of
entertainment
N
Valid 50 50 50 50 50 50 50 50
Missing 0 0 0 0 0 0 0 0
What do you like about the Staples Center?
12. Frequency Percent Valid Percent Cumulative
Percent
Valid
.00 16 32.0 32.0 32.0
L.A. Live/Surrounding entertainment 13 26.0 26.0 58.0
The Arena Club 1 2.0 2.0 60.0
Drinks/Bars 4 8.0 8.0 68.0
Concession stands 1 2.0 2.0 70.0
The team store 1 2.0 2.0 72.0
Safety 1 2.0 2.0 74.0
The fun atmosphere 11 22.0 22.0 96.0
Exclusive dining 1 2.0 2.0 98.0
The seating arrangement 1 2.0 2.0 100.0
Total 50 100.0 100.0
Have you been to the Staples Center?
Frequency Percent Valid Percent Cumulative
Percent
Valid
Yes 32 64.0 64.0 64.0
No 18 36.0 36.0 100.0
Total 50 100.0 100.0
Why do you attend sporting events?
Frequency Percent Valid Percent Cumulative
Percent
Valid
The competition 6 12.0 12.0 12.0
Get out of the house/entertainment 9 18.0 18.0 30.0
I only go to see my favorite teams 7 14.0 14.0 44.0
I go for the sport in general, no matter who's playing 2 4.0 4.0 48.0
Family bonding 4 8.0 8.0 56.0
Social activity 17 34.0 34.0 90.0
The ambiance/fan fare 4 8.0 8.0 98.0
I go to see the cheerleaders/half time show 1 2.0 2.0 100.0
Total 50 100.0 100.0
13. What is your favorite sport to watch?
Frequency Percent Valid Percent Cumulative
Percent
Valid
Hockey 5 10.0 10.0 10.0
Basketball 22 44.0 44.0 54.0
Baseball 21 42.0 42.0 96.0
Soccer 2 4.0 4.0 100.0
Total 50 100.0 100.0
Opinion of Los Angeles
Frequency Percent Valid Percent Cumulative
Percent
Valid
I love the atmosphere 8 16.0 16.0 16.0
I hate L.A. 3 6.0 6.0 22.0
The traffice and one way signs are frustrating 15 30.0 30.0 52.0
There is a good selection of restaurants and bars 4 8.0 8.0 60.0
L.A. is overpopulated/too crowded 5 10.0 10.0 70.0
It's too dirty 3 6.0 6.0 76.0
It's too expensive 3 6.0 6.0 82.0
I like the sightseeing/ tourist spots 2 4.0 4.0 86.0
There is a lot of entertainment appeal 7 14.0 14.0 100.0
Total 50 100.0 100.0
Favorite types of entertainment
Frequency Percent Valid Percent Cumulative
Percent
Valid
attending sporting events 12 24.0 24.0 24.0
watching sporting events 8 16.0 16.0 40.0
dining 7 14.0 14.0 54.0
Bars/night clubs 7 14.0 14.0 68.0
shopping 8 16.0 16.0 84.0
bowling 3 6.0 6.0 90.0
sightseeing 2 4.0 4.0 94.0
14. going to the movies 2 4.0 4.0 98.0
9.00 1 2.0 2.0 100.0
Total 50 100.0 100.0
Case Processing Summary
Cases
Valid Missing Total
N Percent N Percent N Percent
What age group do you belong to? * What do you like
about the Staples Center?
50 100.0% 0 0.0% 50 100.0%
What age group do you belong to? * What do you like about the Staples Center? Crosstabulation
What do you like about the Staples Center? Total
.
0
0
L.A.
Live/Surround
ing
entertainment
The
Arena
Club
Drinks/B
ars
Concessi
on
stands
The
team
store
Safet
y
The fun
atmosph
ere
Exclusi
ve
dining
The
seating
arrangem
ent
What
age
grou
p do
you
belon
g to?
16-
20
Count 1 5 0 0 0 1 0 4 0 0 11
% within What
age group do
you belong
to?
9
.
1
%
45.5% 0.0% 0.0% 0.0% 9.1% 0.0% 36.4% 0.0% 0.0% 100.0
%
% within What
do you like
about the
Staples
Center?
6
.
3
%
38.5% 0.0% 0.0% 0.0% 100.0
%
0.0% 36.4% 0.0% 0.0% 22.0
%
21-
25
Count 3 3 0 1 0 0 0 3 0 0 10
% within What
age group do
you belong
to?
3
0
.
0
%
30.0% 0.0% 10.0% 0.0% 0.0% 0.0% 30.0% 0.0% 0.0% 100.0
%
15. % within What
do you like
about the
Staples
Center?
1
8
.
8
%
23.1% 0.0% 25.0% 0.0% 0.0% 0.0% 27.3% 0.0% 0.0% 20.0
%
26-
30
Count 1 4 1 0 0 0 0 1 1 0 8
% within What
age group do
you belong
to?
1
2
.
5
%
50.0% 12.5
%
0.0% 0.0% 0.0% 0.0% 12.5% 12.5% 0.0% 100.0
%
% within What
do you like
about the
Staples
Center?
6
.
3
%
30.8% 100.0
%
0.0% 0.0% 0.0% 0.0% 9.1% 100.0% 0.0% 16.0
%
31-
35
Count 0 0 0 1 0 0 0 0 0 0 1
% within What
age group do
you belong
to?
0
.
0
%
0.0% 0.0% 100.0% 0.0% 0.0% 0.0% 0.0% 0.0% 0.0% 100.0
%
% within What
do you like
about the
Staples
Center?
0
.
0
%
0.0% 0.0% 25.0% 0.0% 0.0% 0.0% 0.0% 0.0% 0.0% 2.0%
41-
45
Count 3 0 0 0 1 0 0 0 0 0 4
% within What
age group do
you belong
to?
7
5
.
0
%
0.0% 0.0% 0.0% 25.0% 0.0% 0.0% 0.0% 0.0% 0.0% 100.0
%
% within What
do you like
about the
Staples
Center?
1
8
.
8
%
0.0% 0.0% 0.0% 100.0% 0.0% 0.0% 0.0% 0.0% 0.0% 8.0%
46- Count 0 0 0 2 0 0 1 2 0 0 5
16. 50 % within What
age group do
you belong
to?
0
.
0
%
0.0% 0.0% 40.0% 0.0% 0.0% 20.0
%
40.0% 0.0% 0.0% 100.0
%
% within What
do you like
about the
Staples
Center?
0
.
0
%
0.0% 0.0% 50.0% 0.0% 0.0% 100.0
%
18.2% 0.0% 0.0% 10.0
%
50
an
d
ov
er
Count 8 1 0 0 0 0 0 1 0 1 11
% within What
age group do
you belong
to?
7
2
.
7
%
9.1% 0.0% 0.0% 0.0% 0.0% 0.0% 9.1% 0.0% 9.1% 100.0
%
% within What
do you like
about the
Staples
Center?
5
0
.
0
%
7.7% 0.0% 0.0% 0.0% 0.0% 0.0% 9.1% 0.0% 100.0% 22.0
%
Total
Count
1
6
13 1 4 1 1 1 11 1 1 50
% within What
age group do
you belong
to?
3
2
.
0
%
26.0% 2.0% 8.0% 2.0% 2.0% 2.0% 22.0% 2.0% 2.0% 100.0
%
% within What
do you like
about the
Staples
Center?
1
0
0
.
0
%
100.0% 100.0
%
100.0% 100.0% 100.0
%
100.0
%
100.0% 100.0% 100.0% 100.0
%
Case Processing Summary
Cases
Valid Missing Total
17. N Percent N Percent N Percent
What age group do you belong to? * What do you
dislike about the Staples Center?
50 100.0% 0 0.0% 50 100.0%
What age group do you belong to? * What do you dislike about the Staples Center? Crosstabulation
What do you dislike about the Staples Center? Total
.00 Parking
availability
Parking
Price
Crowds The
discomfort
of the seats
Food/drink
prices
I feel
unsafe
Traffice
getting to
venue
What age
group do
you
belong
to?
16-
20
Count 1 2 3 2 0 0 0 3 11
% within
What age
group do
you belong
to?
9.1% 18.2% 27.3% 18.2% 0.0% 0.0% 0.0% 27.3% 100.0%
% within
What do you
dislike about
the Staples
Center?
6.3% 33.3% 50.0% 28.6% 0.0% 0.0% 0.0% 25.0% 22.0%
21-
25
Count 3 1 0 2 0 0 0 4 10
% within
What age
group do
you belong
to?
30.0% 10.0% 0.0% 20.0% 0.0% 0.0% 0.0% 40.0% 100.0%
% within
What do you
dislike about
the Staples
Center?
18.8% 16.7% 0.0% 28.6% 0.0% 0.0% 0.0% 33.3% 20.0%
26-
30
Count 1 1 0 0 1 1 1 3 8
% within
What age
group do
you belong
to?
12.5% 12.5% 0.0% 0.0% 12.5% 12.5% 12.5% 37.5% 100.0%
18. % within
What do you
dislike about
the Staples
Center?
6.3% 16.7% 0.0% 0.0% 100.0% 100.0% 100.0% 25.0% 16.0%
31-
35
Count 0 0 0 0 0 0 0 1 1
% within
What age
group do
you belong
to?
0.0% 0.0% 0.0% 0.0% 0.0% 0.0% 0.0% 100.0% 100.0%
% within
What do you
dislike about
the Staples
Center?
0.0% 0.0% 0.0% 0.0% 0.0% 0.0% 0.0% 8.3% 2.0%
41-
45
Count 3 0 0 1 0 0 0 0 4
% within
What age
group do
you belong
to?
75.0% 0.0% 0.0% 25.0% 0.0% 0.0% 0.0% 0.0% 100.0%
% within
What do you
dislike about
the Staples
Center?
18.8% 0.0% 0.0% 14.3% 0.0% 0.0% 0.0% 0.0% 8.0%
46-
50
Count 0 1 1 2 0 0 0 1 5
% within
What age
group do
you belong
to?
0.0% 20.0% 20.0% 40.0% 0.0% 0.0% 0.0% 20.0% 100.0%
% within
What do you
dislike about
the Staples
Center?
0.0% 16.7% 16.7% 28.6% 0.0% 0.0% 0.0% 8.3% 10.0%
50 Count 8 1 2 0 0 0 0 0 11
19. and
over
% within
What age
group do
you belong
to?
72.7% 9.1% 18.2% 0.0% 0.0% 0.0% 0.0% 0.0% 100.0%
% within
What do you
dislike about
the Staples
Center?
50.0% 16.7% 33.3% 0.0% 0.0% 0.0% 0.0% 0.0% 22.0%
Total
Count 16 6 6 7 1 1 1 12 50
% within
What age
group do
you belong
to?
32.0% 12.0% 12.0% 14.0% 2.0% 2.0% 2.0% 24.0% 100.0%
% within
What do you
dislike about
the Staples
Center?
100.0% 100.0% 100.0% 100.0% 100.0% 100.0% 100.0% 100.0% 100.0%