SlideShare a Scribd company logo
1 of 29
RUNNING HEAD: Descriptive Statistics and Interpretation 2
Oliver Jackson Iv
DESCRIPTIVE STATISTICS AND INTERPRETATION
QNT/561
9/8/2014
Joseph Hamel
Descriptive Statistics
Sales (in USD)
The distribution is normally distributed.
Central Tendency:
Mean = 42.84 dollars.
Dispersion:
Standard deviation = 9.073 dollars.
Count:
100
Min/Max:
Min is $23.00; Max is $64.00
Confidence Interval (alpha = 0.05):
$41.06 to $44.62
The histogram is present in Appendix A; the descriptive
statistics are present in Appendix B.
Age
The distribution is not normally distributed.
Central Tendency:
Median = 35 years
Dispersion:
Interquartile Range = 12 years / 2 = ± 6 years
Count:
100
Min/Max:
Min is 25 years; Max is 45 years
Confidence Interval:
The data is not normally distributed, therefore there is no
confidence interval
The histogram is present in Appendix A; the descriptive
statistics are present in Appendix B; the scatterplot relating age
and sales is in Appendix C.
ID On Display
Thirty-four percent of the people sampled did not have their ID
on display while sixty-six percent of people sampled had their
ID on display. The bar chart is in Appendix E.
Descriptive Statistics Interpretation
Sales
One hundred people were randomly selected, and their
sales were measured. Their sales were observed between $23.00
and $64.00. The average sales were $42.84, with a standard
deviation of $9.07. Approximately half or more of the data
values are above $42.84. There is enough evidence to say that
the population sales amount lies between $41.06 and $44.62
with 95% confidence.
Age
The data is not normally distributed and is skewed to the
left. One hundred people were randomly selected, and their ages
were measured. Their ages were between 25 and 45 years, with
a variation of ± 6 years. Half of the people’s ages lie above 35
years. The middle half of the peoples’ ages are between 28 and
40 years. The mode, or the most frequent age, was 25 years.
APPENDIX A
Sales and Age Histograms
APPENDIX B
Descriptive Statistics on Sales and Age
APPENDIX C
Scatterplot of Age versus Sales
APPENDIX D
Sales vs. Ages Regression Information
APPENDIX E
Bar chart for ID on Display
Bin
Frequency
0
34
1
66
More
0
Key:
0-1 represents 0, or not on display
1-2 represents 1, or on display
Sales vs. Age
35.0 26.0 31.0 42.0 41.0 26.0 25.0 33.0 40.0 42.0 37.0 28.0
28.0 25.0 36.0 41.0 45.0 42.0 26.0 33.0 35.0 41.0 36.0
41.0 26.0 29.0 30.0 41.0 42.0 39.0 28.0 25.0 45.0 32.0
38.0 26.0 29.0 41.0 25.0 28.0 45.0 35.0 39.0 37.0 29.0
28.0 42.0 26.0 37.0 35.0 28.0 26.0 29.0 30.0 35.0 39.0
45.0 42.0 43.0 38.0 37.0 25.0 25.0 36.0 38.0 45.0 41.0
40.0 40.0 30.0 30.0 32.0 37.0 26.0 28.0 29.0 25.0 32.0
26.0 25.0 41.0 45.0 28.0 27.0 32.0 30.0 40.0 40.0 36.0
37.0 25.0 28.0 40.0 43.0 36.0 25.0 29.0 25.0 30.0 40.0
44.0 53.0 56.0 26.0 43.0 53.0 43.0 31.0 43.0 36.0 39.0
47.0 47.0 44.0 33.0 50.0 49.0 51.0 33.0 59.0 49.0 39.0
39.0 37.0 48.0 45.0 29.0 41.0 53.0 41.0 33.0 38.0 41.0
37.0 38.0 26.0 52.0 33.0 52.0 23.0 43.0 44.0 40.0 30.0
37.0 37.0 41.0 47.0 47.0 49.0 60.0 28.0 45.0 38.0 48.0
53.0 55.0 34.0 59.0 31.0 54.0 57.0 38.0 53.0 35.0 43.0
34.0 33.0 27.0 47.0 49.0 44.0 36.0 49.0 59.0 54.0 41.0
55.0 37.0 34.0 54.0 35.0 40.0 40.0 42.0 46.0 28.0 37.0
42.0 55.0 38.0 51.0 55.0 39.0 40.0 34.0 64.0 48.0 27.0
50.0
ID On Display
0-1 1-2* 34.0 66.0
Sales
0-10 10-20* 20-30 30-40 40-50 50-60 60-70
70-80 80-90 90-100 10 0-110 0.0 0.0
0.0 9.0 34.0 34.0 22.0 1.0 0.0 0.0 0.0
Range of sales
Frequency of sales
Ages
0-20 20-25 25-30 35-40 40-45 45-50 0.0
11.0 31.0 12.0 24.0 22.0
Age Range
Frequency of Age
DataIDOn Display?SalesAgeIDOn Display?SalesAgeIDOn
Display?SalesAge1yes$44.003538no$33.004175yes$59.00282ye
s$53.002639yes$52.002576yes$54.00293no$56.003140no$23.00
2877yes$41.00254yes$26.004241yes$43.004578yes$55.00325ye
s$43.004142yes$44.003579no$37.00266no$53.002643no$40.00
3980yes$34.00257yes$43.002544no$30.003781yes$54.00418yes
$31.003345yes$37.002982yes$35.00459yes$43.004046yes$37.0
02883no$40.002810yes$36.004247no$41.004284yes$40.002711
yes$39.003748no$47.002685no$42.003212yes$47.002849yes$4
7.003786no$46.003013yes$47.002850no$49.003587yes$28.004
014no$44.002551yes$60.002888no$37.004015yes$33.003652no
$28.002689no$42.003616yes$50.004153yes$45.002990yes$55.0
03717no$49.004554no$38.003091no$38.002518yes$51.004255n
o$48.003592yes$51.002819yes$33.002656yes$53.003993no$55.
004020yes$59.003357yes$55.004594no$39.004321yes$49.0035
58yes$34.004295yes$40.003622yes$39.004159yes$59.004396no
$34.002523yes$39.003660no$31.003897yes$64.002924yes$37.0
04161yes$54.003798yes$48.002525yes$48.002662yes$57.00259
9yes$27.003026yes$45.002963yes$38.0025100no$50.004027yes
$29.003064yes$53.003628no$41.004165yes$35.003829no$53.0
04266no$43.004530yes$41.003967yes$34.004131yes$33.00286
8yes$33.004032no$38.002569yes$27.004033yes$41.004570no$
47.003034yes$37.003271no$49.003035no$38.003872yes$44.00
3236yes$26.002673no$36.003737yes$52.002974yes$49.0026
There are multiple pages to this excel file (on the bottom)
IDOn Display?Bin Rangeyes10BinFrequencyyes110-134no01-
2*66yes1More0yes1no0yes1yes1yes1yes1yes1yes1yes1no0yes1
yes1no0yes1yes1yes1yes1yes1yes1yes1yes1yes1yes1no0no0yes
1yes1no0yes1yes1no0yes1yes1no0yes1no0yes1yes1no0no0yes1
yes1no0no0yes1no0yes1no0yes1no0no0yes1yes1yes1yes1no0ye
s1yes1yes1yes1yes1no0yes1yes1yes1no0no0yes1no0yes1yes1ye
s1yes1yes1no0yes1yes1yes1no0yes1no0no0yes1no0no0yes1no0
yes1no0no0yes1no0yes1yes1yes1no0
ID On Display
0-1 1-2* 34.0 66.0
Sales HistogramSalesBin
Range$44.000BinFrequencyMean$42.84$53.00100-100Standard
Deviation9.0729033808$56.002010-20*0Count100$26.003020-
300Min$23.00$43.004030-409Max$64.00$53.005040-
5034Confidence Interval1.7782563862$43.006050-6034Lower
bound$41.06$31.007060-7022Upper bound$44.62$43.008070-
801$36.009080-900$39.0010090-1000$47.00100-
1100$47.00$44.00$33.00$50.00$49.00$51.00$33.00$59.00$49.0
0$39.00$39.00$37.00$48.00$45.00$29.00$41.00$53.00$41.00$3
3.00$38.00$41.00$37.00$38.00$26.00$52.00$33.00$52.00$23.0
0$43.00$44.00$40.00$30.00$37.00$37.00$41.00$47.00$47.00$4
9.00$60.00$28.00$45.00$38.00$48.00$53.00$55.00$34.00$59.0
0$31.00$54.00$57.00$38.00$53.00$35.00$43.00$34.00$33.00$2
7.00$47.00$49.00$44.00$36.00$49.00$59.00$54.00$41.00$55.0
0$37.00$34.00$54.00$35.00$40.00$40.00$42.00$46.00$28.00$3
7.00$42.00$55.00$38.00$51.00$55.00$39.00$40.00$34.00$64.0
0$48.00$27.00$50.00
Sales
0-10 10-20* 20-30 30-40 40-50 50-60 60-70
70-80 80-90 90-100 100-110 0.0 0.0 0.0
9.0 34.0 34.0 22.0 1.0 0.0 0.0 0.0
Range of sales
Frequency of sales
Sales StatisticsDescriptive Statistics on
SalesMean42.84Standard
Error0.9072903381Median42.5Mode37Standard
Deviation9.0729033808Sample
Variance82.3175757576Kurtosis-
0.6786889916Skewness0.0426735853Range41Minimum23Maxi
mum64Sum4284Count100Confidence
Level(95.0%)1.8002608688
Age HistogramAgeBin
Range3520Mean33.91BinFrequency2625Standard
Deviation6.53675698790-2003130Count 10020-
25114235Min2525-30314140Max4535-40122645Confidence
Interval1.281180827240-452425Lower Bound32.628819172845-
502233Upper
Bound35.1911808272More040Median3542Quartile
12837Quartile
34028IQR628Mode2525364145422633354136412629304142392
82545323826294125284535393729284226373528262930353945
42433837252536384541404030303237262829253226254145282
732304040363725284043362529253040
Ages
0-20 20-25 25-30 35-40 40-45 45-50 0.0
11.0 31.0 12.0 24.0 22.0
Age Range
Frequency of Age
Age StatisticsDescriptive Statistics on AgeMean33.91Standard
Error0.6536756988Median35Mode25Standard
Deviation6.5367569879Sample
Variance42.7291919192Kurtosis-
1.4102268595Skewness0.0951789272Range20Minimum25Maxi
mum45Sum3391Count100Confidence
Level(95.0%)1.2970344024
ScatterplotAgeSalesSUMMARY
OUTPUT35$44.0026$53.00Regression
Statistics31$56.00Multiple R0.052191722942$26.00R
Square0.002723975941$43.00Adjusted R Square-
0.0074523126$53.00Standard
Error9.106647673725$43.00Observations10033$31.0040$43.00
ANOVA42$36.00dfSSMSFSignificance
F37$39.00Regression122.198878442822.19887844280.2676787
9220.606058972728$47.00Residual988127.241121557282.9310
31852628$47.00Total998149.4425$44.0036$33.00CoefficientsS
tandard Errort StatP-valueLower 95%Upper 95%Lower
95.0%Upper
95.0%41$50.00Intercept45.29648077274.83449744159.3694290
505035.702577941254.890383604335.702577941254.89038360
4345$49.00X Variable 1-0.07244119060.1400163001-
0.51737683770.6060589727-0.35029898130.2054166001-
0.35029898130.205416600142$51.0026$33.0033$59.0035$49.0
041$39.0036$39.0041$37.0026$48.0029$45.0030$29.0041$41.0
042$53.0039$41.0028$33.0025$38.0045$41.0032$37.0038$38.0
026$26.0029$52.0041$33.0025$52.0028$23.0045$43.0035$44.0
039$40.0037$30.0029$37.0028$37.0042$41.0026$47.0037$47.0
035$49.0028$60.0026$28.0029$45.0030$38.0035$48.0039$53.0
045$55.0042$34.0043$59.0038$31.0037$54.0025$57.0025$38.0
036$53.0038$35.0045$43.0041$34.0040$33.0040$27.0030$47.0
030$49.0032$44.0037$36.0026$49.0028$59.0029$54.0025$41.0
032$55.0026$37.0025$34.0041$54.0045$35.0028$40.0027$40.0
032$42.0030$46.0040$28.0040$37.0036$42.0037$55.0025$38.0
028$51.0040$55.0043$39.0036$40.0025$34.0029$64.0025$48.0
030$27.0040$50.00
Sales vs. Age
35.0 26.0 31.0 42.0 41.0 26.0 25.0 33.0 40.0 42.0 37.0 28.0
28.0 25.0 36.0 41.0 45.0 42.0 26.0 33.0 35.0 41.0 36.0
41.0 26.0 29.0 30.0 41.0 42.0 39.0 28.0 25.0 45.0 32.0
38.0 26.0 29.0 41.0 25.0 28.0 45.0 35.0 39.0 37.0 29.0
28.0 42.0 26.0 37.0 35.0 28.0 26.0 29.0 30.0 35.0 39.0
45.0 42.0 43.0 38.0 37.0 25.0 25.0 36.0 38.0 45.0 41.0
40.0 40.0 30.0 30.0 32.0 37.0 26.0 28.0 29.0 25.0 32.0
26.0 25.0 41.0 45.0 28.0 27.0 32.0 30.0 40.0 40.0 36.0
37.0 25.0 28.0 40.0 43.0 36.0 25.0 29.0 25.0 30.0 40.0
44.0 53.0 56.0 26.0 43.0 53.0 43.0 31.0 43.0 36.0 39.0
47.0 47.0 44.0 33.0 50.0 49.0 51.0 33.0 59.0 49.0 39.0
39.0 37.0 48.0 45.0 29.0 41.0 53.0 41.0 33.0 38.0 41.0
37.0 38.0 26.0 52.0 33.0 52.0 23.0 43.0 44.0 40.0 30.0
37.0 37.0 41.0 47.0 47.0 49.0 60.0 28.0 45.0 38.0 48.0
53.0 55.0 34.0 59.0 31.0 54.0 57.0 38.0 53.0 35.0 43.0
34.0 33.0 27.0 47.0 49.0 44.0 36.0 49.0 59.0 54.0 41.0
55.0 37.0 34.0 54.0 35.0 40.0 40.0 42.0 46.0 28.0 37.0
42.0 55.0 38.0 51.0 55.0 39.0 40.0 34.0 64.0 48.0 27.0
50.0
SHORT TITLE OF PAPER
1
Running head: DESCRIPTIVE STATISTICS
1Descriptive Statistics & InterpretationChristina
TorresQNT/561
9/8/14
Joseph Hamel
Descriptive Statistics and Interpretation
Interpretation Phrases
Central Tendency:
Mean = 159.63 (average of data set)
Median = 109.5
Mode = 0
Range = 9
Dispersion:
Standard Deviation = 17.61
Confidences Interval = 95%
Normal, p—value > .05
Descriptive Statistics
See Appendix A, B, C, and D.
Distribution is not normally distributed
Cases
The cases of products produced on January 21st in the second
shift provide a mean of 159.63 along with a standard deviation
of 17.61. The variance is notated at 310.27. The confidence
level is at 95% and contains an upper confidence limit of
161.590 and a lower confidence limit of 157.670.
APPENDIX A
APPENDIX B
SHAPE * MERGEFORMAT
APPENDIX C
APPENDIX D
Date
TimeNumber of casesNumber of workers
1500-160010818
1600-1700107
1700-1800105
1800-1900109
1900-2000110
2000-2100112
2100-2200104
2200-2300103
Cases of Product from 1500 through 2300
21-Jan
SHORT TITLE OF PAPER
1
Running head: DESCRIPTIVE STATISTICS
1Descriptive StatisticsJaime MargariaQNT/561
September 8, 2014
Joseph HamelDescriptive Statistics
For the current sample, I have chosen two random days and
shifts to compile information on how they are producing. In
this example I have used Shift 1 on January 21 and their results
of cases per shift as well as Shift 2 on March 21 and their
results of cases per shift. This will give me a good idea as to
how the two groups are producing on any given day.
Shift 1 on January 21
Central Tendency: Mean = 136.63 cases
Dispersion: Standard Deviation = 11.89 cases
Number:8
Min/Max: 122 cases to 156 cases
Confidence Interval: 41.952 cases to 231.308 cases
See the histogram in Appendix A, and descriptive statistics in
Appendix B.
Shift 2 on March 21
Central Tendency: Mean =138 cases
Dispersion: Standard Deviation = 13.44 cases
Number: 8
Min/Max: 123 cases to 159 cases
Confidence Interval: 42.373 cases to 233.627 cases
See the histogram in Appendix A, and descriptive statistics in
Appendix B. A scatter plot is in Appendix C.
Descriptive Statistics Interpretation
Shift 1 on January 21
Our first variable is the results of how many cases shift one
completed on January 21. The average number of cases
produced was 136.63 cases with a variation of plus or minus
11.89 cases. There is 95% confidence that the population
average is between 41.952 cases to 231.308 cases.
Shift 2 on March 21
Our second variable is the results of how many cases shift two
completed on March 21. The average number of cases produced
was 138 cases with a variation of plus or minus 13.44 cases.
There is 95% confidence that the population average is between
42.373 cases to 233.627 cases.
Appendix A
Histogram of Shift 1 on January 21
Histogram of Shift 2 on March 21
Shift 1
Shift 2
Shift 3
Cases of Product from 0700 through 1500
Cases of Product from 1500 through 2300
Cases of Product from 2300 through 0700
Date
21-Jan
Date
21-Jan
Date
21-Jan
Time
Number of cases
Time
Number of cases
Time
Number of cases
0700-0800
129
1500-1600
108
2300-2400
159
0800-0900
125
1600-1700
107
2400-0100
156
0900-1000
137
1700-1800
105
0100-0200
153
1000-1100
136
1800-1900
109
0200-0300
156
1100-1200
137
1900-2000
110
0300-0400
159
1200-1300
156
2000-2100
112
0400-0500
181
1300-1400
151
2100-2200
104
0500-0600
128
1400-1500
122
2200-2300
103
0600-0700
185
Date
21-Feb
Date
21-Feb
Date
21-Feb
Time
Number of cases
Time
Number of cases
Time
Number of cases
0700-0800
133
1500-1600
115
2300-2400
162
0800-0900
135
1600-1700
118
2400-0100
168
0900-1000
137
1700-1800
119
0100-0200
169
1000-1100
136
1800-1900
117
0200-0300
168
1100-1200
138
1900-2000
115
0300-0400
159
1200-1300
139
2000-2100
116
0400-0500
182
1300-1400
138
2100-2200
118
0500-0600
182
1400-1500
137
2200-2300
119
0600-0700
185
Date
21-Mar
Date
21-Mar
Date
21-Mar
Time
Number of cases
Time
Number of cases
Time
Number of cases
0700-0800
128
1500-1600
123
2300-2400
193
0800-0900
145
1600-1700
129
2400-0100
121
0900-1000
146
1700-1800
151
0100-0200
112
1000-1100
146
1800-1900
151
0200-0300
106
1100-1200
146
1900-2000
129
0300-0400
159
1200-1300
146
2000-2100
131
0400-0500
181
1300-1400
135
2100-2200
131
0500-0600
169
1400-1500
138
2200-2300
159
0600-0700
185
Appendix B- Raw data used in the Analysis

Appendix C
Charts and Tables
Appendix D
Descriptive Statistics
Descriptive statistics
# 1
# 2
# 3
# 4
# 5
# 6
# 7
# 8
# 9
count
8
8
8
8
8
8
8
8
8
mean
136.63
107.25
159.63
171.88
117.13
136.63
141.25
138.00
153.25
sample standard deviation
11.89
3.11
17.61
9.85
1.64
1.92
6.86
13.44
35.08
sample variance
141.41
9.64
310.27
96.98
2.70
3.70
47.07
180.57
1,230.50
minimum
122
103
128
159
115
133
128
123
106
maximum
156
112
185
185
119
139
146
159
193
range
34
9
57
26
4
6
18
36
87
Descriptive statistics
Shift 1
Number of cases
count
8
mean
136.63
sample standard deviation
11.89
sample variance
141.41
minimum
122
maximum
156
range
34
Descriptive statistics
Shift 2
Number of cases
count
8
mean
138.00
sample standard deviation
13.44
sample variance
180.57
minimum
123
maximum
159
range
36
Shift 1Cases of Product from 0700 through 1500Date21-
JanTimeNumber of casesNumber of workers0700-
0800129180800-09001250900-10001371000-11001361100-
12001371200-13001561300-14001511031851400-
150012282Date21-FebTimeNumber of casesNumber of
workers0700-0800133180800-09001350900-10001371000-
11001361100-12001381200-13001391300-14001381400-
1500137Date21-MarTimeNumber of casesNumber of
workers0700-0800128180800-09001450900-10001461000-
11001461100-12001461200-13001461300-14001351400-
1500138Results of experience survey Shift
1ParticipantScores1222223321322222233213322222332134222
22332135222223321362222233213722333332138223333321392
23333321310223333321311223333321312223333321313223333
32231422222332231522222332231622222332231722222332131
82222233213
Shift 2Cases of Product from 1500 through 2300Date21-
JanTimeNumber of casesNumber of workers1500-
1600108181600-17001071700-18001051800-19001091900-
20001102000-21001122100-22001042200-2300103Date21-
FebTimeNumber of cases1500-1600115171600-17001181700-
18001191800-19001171900-20001152000-21001162100-
22001182200-2300119Date21-MarTimeNumber of cases191500-
16001231600-17001291700-18001511800-19001511900-
20001292000-21001312100-22001312200-2300159Results of
experience survey Shift
2ParticipantScores1333323322323333233223333332332234333
32332235333444442363333233223733332332238333444442393
33323322310333323322311333444442312333323444413333444
44231433332332231533332332231633344444231733332332231
83333233213
Shift 3Cases of Product from 2300 through 0700Date21-
JanTimeNumber of casesNumber of workers2300-
2400159182400-01001560100-02001530200-03001560300-
04001590400-05001810500-06001280600-0700185Date21-
FebTimeNumber of casesNumber of workers2300-
2400162172400-01001680100-02001690200-03001680300-
04001590400-05001820500-06001820600-0700185Date21-
MarTimeNumber of casesNumber of workers2300-
2400193192400-01001210100-02001120200-03001060300-
04001590400-05001810500-06001690600-0700185Results of
experience survey Shift
3ParticipantScores1333343344323335555555333355555554333
55555555333555555563335555555733355555558333555555593
33555555510333555555511333555555512333555555513333555
55551433355555551533355555551633344444231733332332231
83333233233
StatsAJAX Bottling Corp.OUTPUT MEASUREMENTS BY
SHIFTS AND TOTALMean OutputStandard
DeviationMedianModeRangeVarianceKurtosisSkewednessSkew
DirectionMaxMinsumcountShift
1138.16666666677.96550534261371373463.44927536230.2478
4213510.1379760501R156122331624Shift
2120.791666666715.1714238438117.511556230.17210144931.0
1398611241.2353603902R159103289924Shift
3161.583333333323.680695984716515979560.77536231880.53
29677745-1.0602933912L193106387824All
shifts140.180555555623.500783904713715982552.2868441358-
0.69235405410.401276834R1931031009372SKILL
MEASUREMENTS BY SHIFTS AND TOTALMean
ExperienceStandard
DeviationMedianModeRangeVarianceKurtosisSkewednessSkew
DirectionMaxMinsumcountMean # of workersShift
12.33888888890.61783446732220.3817194289-0.651617953-
0.3706244237L3142118018Shift
22.92222222220.63821990183330.4073246431-0.1802800181-
0.0630801907L4152618018Shift
34.11.02537634465531.051396648-1.584801859-
0.3911300832L5273818018All
shifts3.12037037041.07080441033341.146622085-
0.50598930110.5119186899R51168554018
Shift 1 Mean Experience Median Mode Range
Variance Max Min 2.338888888888889 2 2 2
0.38171942892613286 3 1 Shift 2 Mean
Experience Median Mode Range Variance Max
Min 2.9222222222222221 3 3 3
0.40732464307883265 4 1 Shift 3 Mean
Experience Median Mode Range Variance Max
Min 4.0999999999999996 5 5 3
1.0513966480446917 5 2 All shifts Mean
Experience Median Mode Range Variance Max
Min 3.1203703703703702 3 3 4
1.1466220850480109 5 1 Shift 1 Standard
Deviation Kurtosis Skewedness 0.61783446725327074 -
0.65161795304092029 -0.37062442369954557 Shift 2
Standard Deviation Kurtosis Skewedness
0.63821990181976673 -0.18028001813583305 -
6.308019069477705E-2 Shift 3 Standard Deviation
Kurtosis Skewedness 1.0253763445899713 -
1.5848018589552508 -0.39113008322016157 All shifts
Standard Deviation Kurtosis Skewedness
1.0708044102673517 -0.50598930108774853
0.51191868988962741 Shift 1 Standard Deviation
7.9655053425579263 Shift 2 Standard Deviation
15.171423843834649 Shift 3 Standard Deviation
23.680695984680057 All shifts Standard Deviation
23.50078390470842 Shift 1 Kurtosis Skewedness
0.24784213514024511 0.13797605005114444 Shift 2
Kurtosis Skewedness 1.0139861123716565
1.2353603902121575 Shift 3 Kurtosis Skewedness
0.5329677744665986 -1.0602933911975536 All
shifts Kurtosis Skewedness -0.69235405412266537
0.40127683404587272 Shift 1 Mean Output Median
Mode Range Variance Max Min
138.16666666666666 137 137 34
63.449275362318865 156 122 Shift 2 Mean Output
Median Mode Range Variance Max Min
120.79166666666667 117.5 115 56
230.17210144927452 159 103 Shift 3 Mean Output
Median Mode Range Variance Max Min
161.58333333333334 165 159 79
560.77536231884221 193 106 All shifts Mean Output
Median Mode Range Variance Max Min
140.18055555555554 137 159 82
552.28684413580243 193 103
All shifts - Production
All shifts Mean Output Median Mode Range Max
Min 140.18055555555554 137 159 82 193 103
All shifts - Experience
All shifts Mean Experience Median Mode Range
Max Min 3.1203703703703702 3 3 4 5 1

More Related Content

Similar to RUNNING HEAD Descriptive Statistics and Interpretation 2.docx

Descriptive Analysis in Statistics
Descriptive Analysis in StatisticsDescriptive Analysis in Statistics
Descriptive Analysis in StatisticsAzmi Mohd Tamil
 
Statistics Questionnaire Analysis
Statistics Questionnaire Analysis Statistics Questionnaire Analysis
Statistics Questionnaire Analysis rose4samad
 
Looking for patterns in the data
Looking for patterns in the dataLooking for patterns in the data
Looking for patterns in the dataRay Poynter
 
Data Visualization - Finding Pictures in Numbers
Data Visualization - Finding Pictures in NumbersData Visualization - Finding Pictures in Numbers
Data Visualization - Finding Pictures in NumbersPratap Vardhan
 
e-Portfolio for Lab-Based Statistics (PSYC 3100) part 2 (7.presentation)
e-Portfolio for Lab-Based Statistics (PSYC 3100) part 2 (7.presentation)e-Portfolio for Lab-Based Statistics (PSYC 3100) part 2 (7.presentation)
e-Portfolio for Lab-Based Statistics (PSYC 3100) part 2 (7.presentation)Ella Anwar
 
Appendix B Statistical Tables
Appendix B  Statistical TablesAppendix B  Statistical Tables
Appendix B Statistical TablesClaire Webber
 
statistic project on Hero motocorp
statistic project on Hero motocorpstatistic project on Hero motocorp
statistic project on Hero motocorpYug Bokadia
 
Understanding statistics 1#4 Pie chart, Bar chart, Pareto,Histogram, Steam L...
Understanding statistics 1#4 Pie chart, Bar chart, Pareto,Histogram,  Steam L...Understanding statistics 1#4 Pie chart, Bar chart, Pareto,Histogram,  Steam L...
Understanding statistics 1#4 Pie chart, Bar chart, Pareto,Histogram, Steam L...Florin Neagu
 
Determination and Analysis of Sample size
Determination and Analysis of Sample sizeDetermination and Analysis of Sample size
Determination and Analysis of Sample sizeSudipto Krishna Dutta
 

Similar to RUNNING HEAD Descriptive Statistics and Interpretation 2.docx (13)

Descriptive Analysis in Statistics
Descriptive Analysis in StatisticsDescriptive Analysis in Statistics
Descriptive Analysis in Statistics
 
Statistics Questionnaire Analysis
Statistics Questionnaire Analysis Statistics Questionnaire Analysis
Statistics Questionnaire Analysis
 
Looking for patterns in the data
Looking for patterns in the dataLooking for patterns in the data
Looking for patterns in the data
 
QRM Index
QRM IndexQRM Index
QRM Index
 
Data Visualization - Finding Pictures in Numbers
Data Visualization - Finding Pictures in NumbersData Visualization - Finding Pictures in Numbers
Data Visualization - Finding Pictures in Numbers
 
e-Portfolio for Lab-Based Statistics (PSYC 3100) part 2 (7.presentation)
e-Portfolio for Lab-Based Statistics (PSYC 3100) part 2 (7.presentation)e-Portfolio for Lab-Based Statistics (PSYC 3100) part 2 (7.presentation)
e-Portfolio for Lab-Based Statistics (PSYC 3100) part 2 (7.presentation)
 
Cob 20091210 1
Cob 20091210 1Cob 20091210 1
Cob 20091210 1
 
Appendix B Statistical Tables
Appendix B  Statistical TablesAppendix B  Statistical Tables
Appendix B Statistical Tables
 
statistic project on Hero motocorp
statistic project on Hero motocorpstatistic project on Hero motocorp
statistic project on Hero motocorp
 
Understanding statistics 1#4 Pie chart, Bar chart, Pareto,Histogram, Steam L...
Understanding statistics 1#4 Pie chart, Bar chart, Pareto,Histogram,  Steam L...Understanding statistics 1#4 Pie chart, Bar chart, Pareto,Histogram,  Steam L...
Understanding statistics 1#4 Pie chart, Bar chart, Pareto,Histogram, Steam L...
 
DescriptiveStatistics.pdf
DescriptiveStatistics.pdfDescriptiveStatistics.pdf
DescriptiveStatistics.pdf
 
Determination and Analysis of Sample size
Determination and Analysis of Sample sizeDetermination and Analysis of Sample size
Determination and Analysis of Sample size
 
Assement1
Assement1Assement1
Assement1
 

More from charisellington63520

in addition to these questions also answer the following;Answer .docx
in addition to these questions also answer the following;Answer .docxin addition to these questions also answer the following;Answer .docx
in addition to these questions also answer the following;Answer .docxcharisellington63520
 
In an environment of compliancy laws, regulations, and standards, in.docx
In an environment of compliancy laws, regulations, and standards, in.docxIn an environment of compliancy laws, regulations, and standards, in.docx
In an environment of compliancy laws, regulations, and standards, in.docxcharisellington63520
 
In American politics, people often compare their enemies to Hitler o.docx
In American politics, people often compare their enemies to Hitler o.docxIn American politics, people often compare their enemies to Hitler o.docx
In American politics, people often compare their enemies to Hitler o.docxcharisellington63520
 
In addition to the thread, the student is required to reply to 2 oth.docx
In addition to the thread, the student is required to reply to 2 oth.docxIn addition to the thread, the student is required to reply to 2 oth.docx
In addition to the thread, the student is required to reply to 2 oth.docxcharisellington63520
 
In addition to reading the Announcements, prepare for this d.docx
In addition to reading the Announcements, prepare for this d.docxIn addition to reading the Announcements, prepare for this d.docx
In addition to reading the Announcements, prepare for this d.docxcharisellington63520
 
In Act 4 during the trial scene, Bassanio says the following lin.docx
In Act 4 during the trial scene, Bassanio says the following lin.docxIn Act 4 during the trial scene, Bassanio says the following lin.docx
In Act 4 during the trial scene, Bassanio says the following lin.docxcharisellington63520
 
In a Word document, please respond to the following questions.docx
In a Word document, please respond to the following questions.docxIn a Word document, please respond to the following questions.docx
In a Word document, please respond to the following questions.docxcharisellington63520
 
In a Word document, create A Set of Instructions. (you will want.docx
In a Word document, create A Set of Instructions. (you will want.docxIn a Word document, create A Set of Instructions. (you will want.docx
In a Word document, create A Set of Instructions. (you will want.docxcharisellington63520
 
In a two page response MLA format paperMaria Werner talks about .docx
In a two page response MLA format paperMaria Werner talks about .docxIn a two page response MLA format paperMaria Werner talks about .docx
In a two page response MLA format paperMaria Werner talks about .docxcharisellington63520
 
In a paragraph (150 words minimum), please respond to the follow.docx
In a paragraph (150 words minimum), please respond to the follow.docxIn a paragraph (150 words minimum), please respond to the follow.docx
In a paragraph (150 words minimum), please respond to the follow.docxcharisellington63520
 
In a paragraph form, discuss the belowThe client comes to t.docx
In a paragraph form, discuss the belowThe client comes to t.docxIn a paragraph form, discuss the belowThe client comes to t.docx
In a paragraph form, discuss the belowThe client comes to t.docxcharisellington63520
 
In a minimum of 300 words in APA format.Through the advent o.docx
In a minimum of 300 words in APA format.Through the advent o.docxIn a minimum of 300 words in APA format.Through the advent o.docx
In a minimum of 300 words in APA format.Through the advent o.docxcharisellington63520
 
In a paragraph form, post your initial response after reading th.docx
In a paragraph form, post your initial response after reading th.docxIn a paragraph form, post your initial response after reading th.docx
In a paragraph form, post your initial response after reading th.docxcharisellington63520
 
In a minimum 250-word paragraph, discuss at least one point the auth.docx
In a minimum 250-word paragraph, discuss at least one point the auth.docxIn a minimum 250-word paragraph, discuss at least one point the auth.docx
In a minimum 250-word paragraph, discuss at least one point the auth.docxcharisellington63520
 
In a hostage crisis, is it ethical for a government to agree to gran.docx
In a hostage crisis, is it ethical for a government to agree to gran.docxIn a hostage crisis, is it ethical for a government to agree to gran.docx
In a hostage crisis, is it ethical for a government to agree to gran.docxcharisellington63520
 
In a double-spaced 12 Font paper  How did you immediately feel a.docx
In a double-spaced 12 Font paper  How did you immediately feel a.docxIn a double-spaced 12 Font paper  How did you immediately feel a.docx
In a double-spaced 12 Font paper  How did you immediately feel a.docxcharisellington63520
 
In a follow-up to your IoT discussion with management, you have .docx
In a follow-up to your IoT discussion with management, you have .docxIn a follow-up to your IoT discussion with management, you have .docx
In a follow-up to your IoT discussion with management, you have .docxcharisellington63520
 
In a COVID-19 situation identify the guidelines for ethical use of t.docx
In a COVID-19 situation identify the guidelines for ethical use of t.docxIn a COVID-19 situation identify the guidelines for ethical use of t.docx
In a COVID-19 situation identify the guidelines for ethical use of t.docxcharisellington63520
 
In a 750- to 1,250-word paper, evaluate the implications of Internet.docx
In a 750- to 1,250-word paper, evaluate the implications of Internet.docxIn a 750- to 1,250-word paper, evaluate the implications of Internet.docx
In a 750- to 1,250-word paper, evaluate the implications of Internet.docxcharisellington63520
 
In a 600 word count (EACH bullet point having 300 words each) di.docx
In a 600 word count (EACH bullet point having 300 words each) di.docxIn a 600 word count (EACH bullet point having 300 words each) di.docx
In a 600 word count (EACH bullet point having 300 words each) di.docxcharisellington63520
 

More from charisellington63520 (20)

in addition to these questions also answer the following;Answer .docx
in addition to these questions also answer the following;Answer .docxin addition to these questions also answer the following;Answer .docx
in addition to these questions also answer the following;Answer .docx
 
In an environment of compliancy laws, regulations, and standards, in.docx
In an environment of compliancy laws, regulations, and standards, in.docxIn an environment of compliancy laws, regulations, and standards, in.docx
In an environment of compliancy laws, regulations, and standards, in.docx
 
In American politics, people often compare their enemies to Hitler o.docx
In American politics, people often compare their enemies to Hitler o.docxIn American politics, people often compare their enemies to Hitler o.docx
In American politics, people often compare their enemies to Hitler o.docx
 
In addition to the thread, the student is required to reply to 2 oth.docx
In addition to the thread, the student is required to reply to 2 oth.docxIn addition to the thread, the student is required to reply to 2 oth.docx
In addition to the thread, the student is required to reply to 2 oth.docx
 
In addition to reading the Announcements, prepare for this d.docx
In addition to reading the Announcements, prepare for this d.docxIn addition to reading the Announcements, prepare for this d.docx
In addition to reading the Announcements, prepare for this d.docx
 
In Act 4 during the trial scene, Bassanio says the following lin.docx
In Act 4 during the trial scene, Bassanio says the following lin.docxIn Act 4 during the trial scene, Bassanio says the following lin.docx
In Act 4 during the trial scene, Bassanio says the following lin.docx
 
In a Word document, please respond to the following questions.docx
In a Word document, please respond to the following questions.docxIn a Word document, please respond to the following questions.docx
In a Word document, please respond to the following questions.docx
 
In a Word document, create A Set of Instructions. (you will want.docx
In a Word document, create A Set of Instructions. (you will want.docxIn a Word document, create A Set of Instructions. (you will want.docx
In a Word document, create A Set of Instructions. (you will want.docx
 
In a two page response MLA format paperMaria Werner talks about .docx
In a two page response MLA format paperMaria Werner talks about .docxIn a two page response MLA format paperMaria Werner talks about .docx
In a two page response MLA format paperMaria Werner talks about .docx
 
In a paragraph (150 words minimum), please respond to the follow.docx
In a paragraph (150 words minimum), please respond to the follow.docxIn a paragraph (150 words minimum), please respond to the follow.docx
In a paragraph (150 words minimum), please respond to the follow.docx
 
In a paragraph form, discuss the belowThe client comes to t.docx
In a paragraph form, discuss the belowThe client comes to t.docxIn a paragraph form, discuss the belowThe client comes to t.docx
In a paragraph form, discuss the belowThe client comes to t.docx
 
In a minimum of 300 words in APA format.Through the advent o.docx
In a minimum of 300 words in APA format.Through the advent o.docxIn a minimum of 300 words in APA format.Through the advent o.docx
In a minimum of 300 words in APA format.Through the advent o.docx
 
In a paragraph form, post your initial response after reading th.docx
In a paragraph form, post your initial response after reading th.docxIn a paragraph form, post your initial response after reading th.docx
In a paragraph form, post your initial response after reading th.docx
 
In a minimum 250-word paragraph, discuss at least one point the auth.docx
In a minimum 250-word paragraph, discuss at least one point the auth.docxIn a minimum 250-word paragraph, discuss at least one point the auth.docx
In a minimum 250-word paragraph, discuss at least one point the auth.docx
 
In a hostage crisis, is it ethical for a government to agree to gran.docx
In a hostage crisis, is it ethical for a government to agree to gran.docxIn a hostage crisis, is it ethical for a government to agree to gran.docx
In a hostage crisis, is it ethical for a government to agree to gran.docx
 
In a double-spaced 12 Font paper  How did you immediately feel a.docx
In a double-spaced 12 Font paper  How did you immediately feel a.docxIn a double-spaced 12 Font paper  How did you immediately feel a.docx
In a double-spaced 12 Font paper  How did you immediately feel a.docx
 
In a follow-up to your IoT discussion with management, you have .docx
In a follow-up to your IoT discussion with management, you have .docxIn a follow-up to your IoT discussion with management, you have .docx
In a follow-up to your IoT discussion with management, you have .docx
 
In a COVID-19 situation identify the guidelines for ethical use of t.docx
In a COVID-19 situation identify the guidelines for ethical use of t.docxIn a COVID-19 situation identify the guidelines for ethical use of t.docx
In a COVID-19 situation identify the guidelines for ethical use of t.docx
 
In a 750- to 1,250-word paper, evaluate the implications of Internet.docx
In a 750- to 1,250-word paper, evaluate the implications of Internet.docxIn a 750- to 1,250-word paper, evaluate the implications of Internet.docx
In a 750- to 1,250-word paper, evaluate the implications of Internet.docx
 
In a 600 word count (EACH bullet point having 300 words each) di.docx
In a 600 word count (EACH bullet point having 300 words each) di.docxIn a 600 word count (EACH bullet point having 300 words each) di.docx
In a 600 word count (EACH bullet point having 300 words each) di.docx
 

Recently uploaded

The basics of sentences session 2pptx copy.pptx
The basics of sentences session 2pptx copy.pptxThe basics of sentences session 2pptx copy.pptx
The basics of sentences session 2pptx copy.pptxheathfieldcps1
 
Nutritional Needs Presentation - HLTH 104
Nutritional Needs Presentation - HLTH 104Nutritional Needs Presentation - HLTH 104
Nutritional Needs Presentation - HLTH 104misteraugie
 
Unit-IV; Professional Sales Representative (PSR).pptx
Unit-IV; Professional Sales Representative (PSR).pptxUnit-IV; Professional Sales Representative (PSR).pptx
Unit-IV; Professional Sales Representative (PSR).pptxVishalSingh1417
 
How to Give a Domain for a Field in Odoo 17
How to Give a Domain for a Field in Odoo 17How to Give a Domain for a Field in Odoo 17
How to Give a Domain for a Field in Odoo 17Celine George
 
Ecological Succession. ( ECOSYSTEM, B. Pharmacy, 1st Year, Sem-II, Environmen...
Ecological Succession. ( ECOSYSTEM, B. Pharmacy, 1st Year, Sem-II, Environmen...Ecological Succession. ( ECOSYSTEM, B. Pharmacy, 1st Year, Sem-II, Environmen...
Ecological Succession. ( ECOSYSTEM, B. Pharmacy, 1st Year, Sem-II, Environmen...Shubhangi Sonawane
 
Gardella_Mateo_IntellectualProperty.pdf.
Gardella_Mateo_IntellectualProperty.pdf.Gardella_Mateo_IntellectualProperty.pdf.
Gardella_Mateo_IntellectualProperty.pdf.MateoGardella
 
Key note speaker Neum_Admir Softic_ENG.pdf
Key note speaker Neum_Admir Softic_ENG.pdfKey note speaker Neum_Admir Softic_ENG.pdf
Key note speaker Neum_Admir Softic_ENG.pdfAdmir Softic
 
1029-Danh muc Sach Giao Khoa khoi 6.pdf
1029-Danh muc Sach Giao Khoa khoi  6.pdf1029-Danh muc Sach Giao Khoa khoi  6.pdf
1029-Danh muc Sach Giao Khoa khoi 6.pdfQucHHunhnh
 
Advanced Views - Calendar View in Odoo 17
Advanced Views - Calendar View in Odoo 17Advanced Views - Calendar View in Odoo 17
Advanced Views - Calendar View in Odoo 17Celine George
 
Presentation by Andreas Schleicher Tackling the School Absenteeism Crisis 30 ...
Presentation by Andreas Schleicher Tackling the School Absenteeism Crisis 30 ...Presentation by Andreas Schleicher Tackling the School Absenteeism Crisis 30 ...
Presentation by Andreas Schleicher Tackling the School Absenteeism Crisis 30 ...EduSkills OECD
 
Unit-IV- Pharma. Marketing Channels.pptx
Unit-IV- Pharma. Marketing Channels.pptxUnit-IV- Pharma. Marketing Channels.pptx
Unit-IV- Pharma. Marketing Channels.pptxVishalSingh1417
 
SOCIAL AND HISTORICAL CONTEXT - LFTVD.pptx
SOCIAL AND HISTORICAL CONTEXT - LFTVD.pptxSOCIAL AND HISTORICAL CONTEXT - LFTVD.pptx
SOCIAL AND HISTORICAL CONTEXT - LFTVD.pptxiammrhaywood
 
Grant Readiness 101 TechSoup and Remy Consulting
Grant Readiness 101 TechSoup and Remy ConsultingGrant Readiness 101 TechSoup and Remy Consulting
Grant Readiness 101 TechSoup and Remy ConsultingTechSoup
 
microwave assisted reaction. General introduction
microwave assisted reaction. General introductionmicrowave assisted reaction. General introduction
microwave assisted reaction. General introductionMaksud Ahmed
 
PROCESS RECORDING FORMAT.docx
PROCESS      RECORDING        FORMAT.docxPROCESS      RECORDING        FORMAT.docx
PROCESS RECORDING FORMAT.docxPoojaSen20
 
Web & Social Media Analytics Previous Year Question Paper.pdf
Web & Social Media Analytics Previous Year Question Paper.pdfWeb & Social Media Analytics Previous Year Question Paper.pdf
Web & Social Media Analytics Previous Year Question Paper.pdfJayanti Pande
 
Z Score,T Score, Percential Rank and Box Plot Graph
Z Score,T Score, Percential Rank and Box Plot GraphZ Score,T Score, Percential Rank and Box Plot Graph
Z Score,T Score, Percential Rank and Box Plot GraphThiyagu K
 
Gardella_PRCampaignConclusion Pitch Letter
Gardella_PRCampaignConclusion Pitch LetterGardella_PRCampaignConclusion Pitch Letter
Gardella_PRCampaignConclusion Pitch LetterMateoGardella
 

Recently uploaded (20)

The basics of sentences session 2pptx copy.pptx
The basics of sentences session 2pptx copy.pptxThe basics of sentences session 2pptx copy.pptx
The basics of sentences session 2pptx copy.pptx
 
Advance Mobile Application Development class 07
Advance Mobile Application Development class 07Advance Mobile Application Development class 07
Advance Mobile Application Development class 07
 
Nutritional Needs Presentation - HLTH 104
Nutritional Needs Presentation - HLTH 104Nutritional Needs Presentation - HLTH 104
Nutritional Needs Presentation - HLTH 104
 
Unit-IV; Professional Sales Representative (PSR).pptx
Unit-IV; Professional Sales Representative (PSR).pptxUnit-IV; Professional Sales Representative (PSR).pptx
Unit-IV; Professional Sales Representative (PSR).pptx
 
How to Give a Domain for a Field in Odoo 17
How to Give a Domain for a Field in Odoo 17How to Give a Domain for a Field in Odoo 17
How to Give a Domain for a Field in Odoo 17
 
Ecological Succession. ( ECOSYSTEM, B. Pharmacy, 1st Year, Sem-II, Environmen...
Ecological Succession. ( ECOSYSTEM, B. Pharmacy, 1st Year, Sem-II, Environmen...Ecological Succession. ( ECOSYSTEM, B. Pharmacy, 1st Year, Sem-II, Environmen...
Ecological Succession. ( ECOSYSTEM, B. Pharmacy, 1st Year, Sem-II, Environmen...
 
Gardella_Mateo_IntellectualProperty.pdf.
Gardella_Mateo_IntellectualProperty.pdf.Gardella_Mateo_IntellectualProperty.pdf.
Gardella_Mateo_IntellectualProperty.pdf.
 
Key note speaker Neum_Admir Softic_ENG.pdf
Key note speaker Neum_Admir Softic_ENG.pdfKey note speaker Neum_Admir Softic_ENG.pdf
Key note speaker Neum_Admir Softic_ENG.pdf
 
1029-Danh muc Sach Giao Khoa khoi 6.pdf
1029-Danh muc Sach Giao Khoa khoi  6.pdf1029-Danh muc Sach Giao Khoa khoi  6.pdf
1029-Danh muc Sach Giao Khoa khoi 6.pdf
 
Advanced Views - Calendar View in Odoo 17
Advanced Views - Calendar View in Odoo 17Advanced Views - Calendar View in Odoo 17
Advanced Views - Calendar View in Odoo 17
 
Mehran University Newsletter Vol-X, Issue-I, 2024
Mehran University Newsletter Vol-X, Issue-I, 2024Mehran University Newsletter Vol-X, Issue-I, 2024
Mehran University Newsletter Vol-X, Issue-I, 2024
 
Presentation by Andreas Schleicher Tackling the School Absenteeism Crisis 30 ...
Presentation by Andreas Schleicher Tackling the School Absenteeism Crisis 30 ...Presentation by Andreas Schleicher Tackling the School Absenteeism Crisis 30 ...
Presentation by Andreas Schleicher Tackling the School Absenteeism Crisis 30 ...
 
Unit-IV- Pharma. Marketing Channels.pptx
Unit-IV- Pharma. Marketing Channels.pptxUnit-IV- Pharma. Marketing Channels.pptx
Unit-IV- Pharma. Marketing Channels.pptx
 
SOCIAL AND HISTORICAL CONTEXT - LFTVD.pptx
SOCIAL AND HISTORICAL CONTEXT - LFTVD.pptxSOCIAL AND HISTORICAL CONTEXT - LFTVD.pptx
SOCIAL AND HISTORICAL CONTEXT - LFTVD.pptx
 
Grant Readiness 101 TechSoup and Remy Consulting
Grant Readiness 101 TechSoup and Remy ConsultingGrant Readiness 101 TechSoup and Remy Consulting
Grant Readiness 101 TechSoup and Remy Consulting
 
microwave assisted reaction. General introduction
microwave assisted reaction. General introductionmicrowave assisted reaction. General introduction
microwave assisted reaction. General introduction
 
PROCESS RECORDING FORMAT.docx
PROCESS      RECORDING        FORMAT.docxPROCESS      RECORDING        FORMAT.docx
PROCESS RECORDING FORMAT.docx
 
Web & Social Media Analytics Previous Year Question Paper.pdf
Web & Social Media Analytics Previous Year Question Paper.pdfWeb & Social Media Analytics Previous Year Question Paper.pdf
Web & Social Media Analytics Previous Year Question Paper.pdf
 
Z Score,T Score, Percential Rank and Box Plot Graph
Z Score,T Score, Percential Rank and Box Plot GraphZ Score,T Score, Percential Rank and Box Plot Graph
Z Score,T Score, Percential Rank and Box Plot Graph
 
Gardella_PRCampaignConclusion Pitch Letter
Gardella_PRCampaignConclusion Pitch LetterGardella_PRCampaignConclusion Pitch Letter
Gardella_PRCampaignConclusion Pitch Letter
 

RUNNING HEAD Descriptive Statistics and Interpretation 2.docx

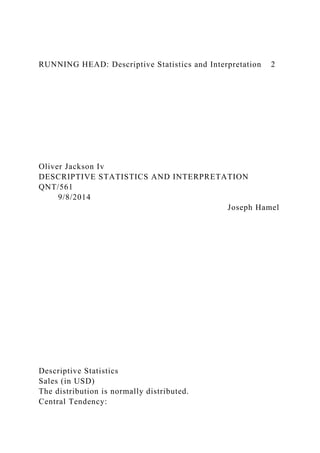
  • 1. RUNNING HEAD: Descriptive Statistics and Interpretation 2 Oliver Jackson Iv DESCRIPTIVE STATISTICS AND INTERPRETATION QNT/561 9/8/2014 Joseph Hamel Descriptive Statistics Sales (in USD) The distribution is normally distributed. Central Tendency:
  • 2. Mean = 42.84 dollars. Dispersion: Standard deviation = 9.073 dollars. Count: 100 Min/Max: Min is $23.00; Max is $64.00 Confidence Interval (alpha = 0.05): $41.06 to $44.62 The histogram is present in Appendix A; the descriptive statistics are present in Appendix B. Age The distribution is not normally distributed. Central Tendency: Median = 35 years Dispersion: Interquartile Range = 12 years / 2 = ± 6 years Count: 100 Min/Max: Min is 25 years; Max is 45 years Confidence Interval: The data is not normally distributed, therefore there is no confidence interval The histogram is present in Appendix A; the descriptive statistics are present in Appendix B; the scatterplot relating age and sales is in Appendix C. ID On Display Thirty-four percent of the people sampled did not have their ID on display while sixty-six percent of people sampled had their ID on display. The bar chart is in Appendix E. Descriptive Statistics Interpretation Sales One hundred people were randomly selected, and their sales were measured. Their sales were observed between $23.00
  • 3. and $64.00. The average sales were $42.84, with a standard deviation of $9.07. Approximately half or more of the data values are above $42.84. There is enough evidence to say that the population sales amount lies between $41.06 and $44.62 with 95% confidence. Age The data is not normally distributed and is skewed to the left. One hundred people were randomly selected, and their ages were measured. Their ages were between 25 and 45 years, with a variation of ± 6 years. Half of the people’s ages lie above 35 years. The middle half of the peoples’ ages are between 28 and 40 years. The mode, or the most frequent age, was 25 years. APPENDIX A Sales and Age Histograms APPENDIX B Descriptive Statistics on Sales and Age APPENDIX C Scatterplot of Age versus Sales
  • 4. APPENDIX D Sales vs. Ages Regression Information APPENDIX E Bar chart for ID on Display Bin Frequency 0 34 1 66 More 0
  • 5. Key: 0-1 represents 0, or not on display 1-2 represents 1, or on display Sales vs. Age 35.0 26.0 31.0 42.0 41.0 26.0 25.0 33.0 40.0 42.0 37.0 28.0 28.0 25.0 36.0 41.0 45.0 42.0 26.0 33.0 35.0 41.0 36.0 41.0 26.0 29.0 30.0 41.0 42.0 39.0 28.0 25.0 45.0 32.0 38.0 26.0 29.0 41.0 25.0 28.0 45.0 35.0 39.0 37.0 29.0 28.0 42.0 26.0 37.0 35.0 28.0 26.0 29.0 30.0 35.0 39.0 45.0 42.0 43.0 38.0 37.0 25.0 25.0 36.0 38.0 45.0 41.0 40.0 40.0 30.0 30.0 32.0 37.0 26.0 28.0 29.0 25.0 32.0 26.0 25.0 41.0 45.0 28.0 27.0 32.0 30.0 40.0 40.0 36.0 37.0 25.0 28.0 40.0 43.0 36.0 25.0 29.0 25.0 30.0 40.0 44.0 53.0 56.0 26.0 43.0 53.0 43.0 31.0 43.0 36.0 39.0 47.0 47.0 44.0 33.0 50.0 49.0 51.0 33.0 59.0 49.0 39.0 39.0 37.0 48.0 45.0 29.0 41.0 53.0 41.0 33.0 38.0 41.0 37.0 38.0 26.0 52.0 33.0 52.0 23.0 43.0 44.0 40.0 30.0 37.0 37.0 41.0 47.0 47.0 49.0 60.0 28.0 45.0 38.0 48.0 53.0 55.0 34.0 59.0 31.0 54.0 57.0 38.0 53.0 35.0 43.0 34.0 33.0 27.0 47.0 49.0 44.0 36.0 49.0 59.0 54.0 41.0 55.0 37.0 34.0 54.0 35.0 40.0 40.0 42.0 46.0 28.0 37.0 42.0 55.0 38.0 51.0 55.0 39.0 40.0 34.0 64.0 48.0 27.0 50.0 ID On Display 0-1 1-2* 34.0 66.0
  • 6. Sales 0-10 10-20* 20-30 30-40 40-50 50-60 60-70 70-80 80-90 90-100 10 0-110 0.0 0.0 0.0 9.0 34.0 34.0 22.0 1.0 0.0 0.0 0.0 Range of sales Frequency of sales Ages 0-20 20-25 25-30 35-40 40-45 45-50 0.0 11.0 31.0 12.0 24.0 22.0 Age Range Frequency of Age DataIDOn Display?SalesAgeIDOn Display?SalesAgeIDOn Display?SalesAge1yes$44.003538no$33.004175yes$59.00282ye s$53.002639yes$52.002576yes$54.00293no$56.003140no$23.00 2877yes$41.00254yes$26.004241yes$43.004578yes$55.00325ye s$43.004142yes$44.003579no$37.00266no$53.002643no$40.00 3980yes$34.00257yes$43.002544no$30.003781yes$54.00418yes $31.003345yes$37.002982yes$35.00459yes$43.004046yes$37.0 02883no$40.002810yes$36.004247no$41.004284yes$40.002711 yes$39.003748no$47.002685no$42.003212yes$47.002849yes$4 7.003786no$46.003013yes$47.002850no$49.003587yes$28.004 014no$44.002551yes$60.002888no$37.004015yes$33.003652no $28.002689no$42.003616yes$50.004153yes$45.002990yes$55.0 03717no$49.004554no$38.003091no$38.002518yes$51.004255n o$48.003592yes$51.002819yes$33.002656yes$53.003993no$55. 004020yes$59.003357yes$55.004594no$39.004321yes$49.0035 58yes$34.004295yes$40.003622yes$39.004159yes$59.004396no $34.002523yes$39.003660no$31.003897yes$64.002924yes$37.0
  • 7. 04161yes$54.003798yes$48.002525yes$48.002662yes$57.00259 9yes$27.003026yes$45.002963yes$38.0025100no$50.004027yes $29.003064yes$53.003628no$41.004165yes$35.003829no$53.0 04266no$43.004530yes$41.003967yes$34.004131yes$33.00286 8yes$33.004032no$38.002569yes$27.004033yes$41.004570no$ 47.003034yes$37.003271no$49.003035no$38.003872yes$44.00 3236yes$26.002673no$36.003737yes$52.002974yes$49.0026 There are multiple pages to this excel file (on the bottom) IDOn Display?Bin Rangeyes10BinFrequencyyes110-134no01- 2*66yes1More0yes1no0yes1yes1yes1yes1yes1yes1yes1no0yes1 yes1no0yes1yes1yes1yes1yes1yes1yes1yes1yes1yes1no0no0yes 1yes1no0yes1yes1no0yes1yes1no0yes1no0yes1yes1no0no0yes1 yes1no0no0yes1no0yes1no0yes1no0no0yes1yes1yes1yes1no0ye s1yes1yes1yes1yes1no0yes1yes1yes1no0no0yes1no0yes1yes1ye s1yes1yes1no0yes1yes1yes1no0yes1no0no0yes1no0no0yes1no0 yes1no0no0yes1no0yes1yes1yes1no0 ID On Display 0-1 1-2* 34.0 66.0 Sales HistogramSalesBin Range$44.000BinFrequencyMean$42.84$53.00100-100Standard Deviation9.0729033808$56.002010-20*0Count100$26.003020- 300Min$23.00$43.004030-409Max$64.00$53.005040- 5034Confidence Interval1.7782563862$43.006050-6034Lower bound$41.06$31.007060-7022Upper bound$44.62$43.008070- 801$36.009080-900$39.0010090-1000$47.00100- 1100$47.00$44.00$33.00$50.00$49.00$51.00$33.00$59.00$49.0 0$39.00$39.00$37.00$48.00$45.00$29.00$41.00$53.00$41.00$3 3.00$38.00$41.00$37.00$38.00$26.00$52.00$33.00$52.00$23.0 0$43.00$44.00$40.00$30.00$37.00$37.00$41.00$47.00$47.00$4 9.00$60.00$28.00$45.00$38.00$48.00$53.00$55.00$34.00$59.0 0$31.00$54.00$57.00$38.00$53.00$35.00$43.00$34.00$33.00$2 7.00$47.00$49.00$44.00$36.00$49.00$59.00$54.00$41.00$55.0
  • 8. 0$37.00$34.00$54.00$35.00$40.00$40.00$42.00$46.00$28.00$3 7.00$42.00$55.00$38.00$51.00$55.00$39.00$40.00$34.00$64.0 0$48.00$27.00$50.00 Sales 0-10 10-20* 20-30 30-40 40-50 50-60 60-70 70-80 80-90 90-100 100-110 0.0 0.0 0.0 9.0 34.0 34.0 22.0 1.0 0.0 0.0 0.0 Range of sales Frequency of sales Sales StatisticsDescriptive Statistics on SalesMean42.84Standard Error0.9072903381Median42.5Mode37Standard Deviation9.0729033808Sample Variance82.3175757576Kurtosis- 0.6786889916Skewness0.0426735853Range41Minimum23Maxi mum64Sum4284Count100Confidence Level(95.0%)1.8002608688 Age HistogramAgeBin Range3520Mean33.91BinFrequency2625Standard Deviation6.53675698790-2003130Count 10020- 25114235Min2525-30314140Max4535-40122645Confidence Interval1.281180827240-452425Lower Bound32.628819172845- 502233Upper Bound35.1911808272More040Median3542Quartile 12837Quartile 34028IQR628Mode2525364145422633354136412629304142392 82545323826294125284535393729284226373528262930353945 42433837252536384541404030303237262829253226254145282 732304040363725284043362529253040 Ages 0-20 20-25 25-30 35-40 40-45 45-50 0.0 11.0 31.0 12.0 24.0 22.0 Age Range
  • 9. Frequency of Age Age StatisticsDescriptive Statistics on AgeMean33.91Standard Error0.6536756988Median35Mode25Standard Deviation6.5367569879Sample Variance42.7291919192Kurtosis- 1.4102268595Skewness0.0951789272Range20Minimum25Maxi mum45Sum3391Count100Confidence Level(95.0%)1.2970344024 ScatterplotAgeSalesSUMMARY OUTPUT35$44.0026$53.00Regression Statistics31$56.00Multiple R0.052191722942$26.00R Square0.002723975941$43.00Adjusted R Square- 0.0074523126$53.00Standard Error9.106647673725$43.00Observations10033$31.0040$43.00 ANOVA42$36.00dfSSMSFSignificance F37$39.00Regression122.198878442822.19887844280.2676787 9220.606058972728$47.00Residual988127.241121557282.9310 31852628$47.00Total998149.4425$44.0036$33.00CoefficientsS tandard Errort StatP-valueLower 95%Upper 95%Lower 95.0%Upper 95.0%41$50.00Intercept45.29648077274.83449744159.3694290 505035.702577941254.890383604335.702577941254.89038360 4345$49.00X Variable 1-0.07244119060.1400163001- 0.51737683770.6060589727-0.35029898130.2054166001- 0.35029898130.205416600142$51.0026$33.0033$59.0035$49.0 041$39.0036$39.0041$37.0026$48.0029$45.0030$29.0041$41.0 042$53.0039$41.0028$33.0025$38.0045$41.0032$37.0038$38.0 026$26.0029$52.0041$33.0025$52.0028$23.0045$43.0035$44.0 039$40.0037$30.0029$37.0028$37.0042$41.0026$47.0037$47.0 035$49.0028$60.0026$28.0029$45.0030$38.0035$48.0039$53.0 045$55.0042$34.0043$59.0038$31.0037$54.0025$57.0025$38.0 036$53.0038$35.0045$43.0041$34.0040$33.0040$27.0030$47.0 030$49.0032$44.0037$36.0026$49.0028$59.0029$54.0025$41.0
  • 10. 032$55.0026$37.0025$34.0041$54.0045$35.0028$40.0027$40.0 032$42.0030$46.0040$28.0040$37.0036$42.0037$55.0025$38.0 028$51.0040$55.0043$39.0036$40.0025$34.0029$64.0025$48.0 030$27.0040$50.00 Sales vs. Age 35.0 26.0 31.0 42.0 41.0 26.0 25.0 33.0 40.0 42.0 37.0 28.0 28.0 25.0 36.0 41.0 45.0 42.0 26.0 33.0 35.0 41.0 36.0 41.0 26.0 29.0 30.0 41.0 42.0 39.0 28.0 25.0 45.0 32.0 38.0 26.0 29.0 41.0 25.0 28.0 45.0 35.0 39.0 37.0 29.0 28.0 42.0 26.0 37.0 35.0 28.0 26.0 29.0 30.0 35.0 39.0 45.0 42.0 43.0 38.0 37.0 25.0 25.0 36.0 38.0 45.0 41.0 40.0 40.0 30.0 30.0 32.0 37.0 26.0 28.0 29.0 25.0 32.0 26.0 25.0 41.0 45.0 28.0 27.0 32.0 30.0 40.0 40.0 36.0 37.0 25.0 28.0 40.0 43.0 36.0 25.0 29.0 25.0 30.0 40.0 44.0 53.0 56.0 26.0 43.0 53.0 43.0 31.0 43.0 36.0 39.0 47.0 47.0 44.0 33.0 50.0 49.0 51.0 33.0 59.0 49.0 39.0 39.0 37.0 48.0 45.0 29.0 41.0 53.0 41.0 33.0 38.0 41.0 37.0 38.0 26.0 52.0 33.0 52.0 23.0 43.0 44.0 40.0 30.0 37.0 37.0 41.0 47.0 47.0 49.0 60.0 28.0 45.0 38.0 48.0 53.0 55.0 34.0 59.0 31.0 54.0 57.0 38.0 53.0 35.0 43.0 34.0 33.0 27.0 47.0 49.0 44.0 36.0 49.0 59.0 54.0 41.0 55.0 37.0 34.0 54.0 35.0 40.0 40.0 42.0 46.0 28.0 37.0 42.0 55.0 38.0 51.0 55.0 39.0 40.0 34.0 64.0 48.0 27.0 50.0 SHORT TITLE OF PAPER 1 Running head: DESCRIPTIVE STATISTICS 1Descriptive Statistics & InterpretationChristina TorresQNT/561 9/8/14
  • 11. Joseph Hamel Descriptive Statistics and Interpretation Interpretation Phrases Central Tendency: Mean = 159.63 (average of data set) Median = 109.5 Mode = 0 Range = 9 Dispersion: Standard Deviation = 17.61 Confidences Interval = 95% Normal, p—value > .05 Descriptive Statistics See Appendix A, B, C, and D. Distribution is not normally distributed Cases The cases of products produced on January 21st in the second shift provide a mean of 159.63 along with a standard deviation of 17.61. The variance is notated at 310.27. The confidence level is at 95% and contains an upper confidence limit of 161.590 and a lower confidence limit of 157.670. APPENDIX A
  • 12. APPENDIX B SHAPE * MERGEFORMAT APPENDIX C APPENDIX D Date TimeNumber of casesNumber of workers 1500-160010818 1600-1700107 1700-1800105 1800-1900109 1900-2000110 2000-2100112 2100-2200104 2200-2300103 Cases of Product from 1500 through 2300 21-Jan SHORT TITLE OF PAPER 1 Running head: DESCRIPTIVE STATISTICS 1Descriptive StatisticsJaime MargariaQNT/561 September 8, 2014 Joseph HamelDescriptive Statistics
  • 13. For the current sample, I have chosen two random days and shifts to compile information on how they are producing. In this example I have used Shift 1 on January 21 and their results of cases per shift as well as Shift 2 on March 21 and their results of cases per shift. This will give me a good idea as to how the two groups are producing on any given day. Shift 1 on January 21 Central Tendency: Mean = 136.63 cases Dispersion: Standard Deviation = 11.89 cases Number:8 Min/Max: 122 cases to 156 cases Confidence Interval: 41.952 cases to 231.308 cases See the histogram in Appendix A, and descriptive statistics in Appendix B. Shift 2 on March 21 Central Tendency: Mean =138 cases Dispersion: Standard Deviation = 13.44 cases Number: 8 Min/Max: 123 cases to 159 cases Confidence Interval: 42.373 cases to 233.627 cases See the histogram in Appendix A, and descriptive statistics in Appendix B. A scatter plot is in Appendix C. Descriptive Statistics Interpretation Shift 1 on January 21 Our first variable is the results of how many cases shift one completed on January 21. The average number of cases produced was 136.63 cases with a variation of plus or minus 11.89 cases. There is 95% confidence that the population average is between 41.952 cases to 231.308 cases. Shift 2 on March 21 Our second variable is the results of how many cases shift two completed on March 21. The average number of cases produced
  • 14. was 138 cases with a variation of plus or minus 13.44 cases. There is 95% confidence that the population average is between 42.373 cases to 233.627 cases. Appendix A Histogram of Shift 1 on January 21 Histogram of Shift 2 on March 21 Shift 1 Shift 2 Shift 3 Cases of Product from 0700 through 1500 Cases of Product from 1500 through 2300 Cases of Product from 2300 through 0700 Date 21-Jan Date 21-Jan Date 21-Jan Time Number of cases Time Number of cases Time Number of cases
  • 17. Time Number of cases Time Number of cases Time Number of cases 0700-0800 133 1500-1600 115 2300-2400 162 0800-0900 135 1600-1700 118 2400-0100 168 0900-1000 137 1700-1800 119 0100-0200 169 1000-1100 136 1800-1900
  • 19. Date 21-Mar Date 21-Mar Date 21-Mar Time Number of cases Time Number of cases Time Number of cases 0700-0800 128 1500-1600 123 2300-2400 193 0800-0900 145 1600-1700 129 2400-0100 121 0900-1000 146 1700-1800
  • 21. 1400-1500 138 2200-2300 159 0600-0700 185 Appendix B- Raw data used in the Analysis Appendix C Charts and Tables Appendix D Descriptive Statistics Descriptive statistics
  • 22. # 1 # 2 # 3 # 4 # 5 # 6 # 7 # 8 # 9 count 8 8 8 8 8 8 8 8 8
  • 25. Number of cases count 8 mean 136.63 sample standard deviation 11.89 sample variance 141.41 minimum 122 maximum 156 range 34 Descriptive statistics Shift 2 Number of cases count 8 mean
  • 26. 138.00 sample standard deviation 13.44 sample variance 180.57 minimum 123 maximum 159 range 36 Shift 1Cases of Product from 0700 through 1500Date21- JanTimeNumber of casesNumber of workers0700- 0800129180800-09001250900-10001371000-11001361100- 12001371200-13001561300-14001511031851400- 150012282Date21-FebTimeNumber of casesNumber of workers0700-0800133180800-09001350900-10001371000- 11001361100-12001381200-13001391300-14001381400- 1500137Date21-MarTimeNumber of casesNumber of workers0700-0800128180800-09001450900-10001461000- 11001461100-12001461200-13001461300-14001351400- 1500138Results of experience survey Shift 1ParticipantScores1222223321322222233213322222332134222 22332135222223321362222233213722333332138223333321392 23333321310223333321311223333321312223333321313223333 32231422222332231522222332231622222332231722222332131 82222233213 Shift 2Cases of Product from 1500 through 2300Date21- JanTimeNumber of casesNumber of workers1500- 1600108181600-17001071700-18001051800-19001091900- 20001102000-21001122100-22001042200-2300103Date21- FebTimeNumber of cases1500-1600115171600-17001181700- 18001191800-19001171900-20001152000-21001162100- 22001182200-2300119Date21-MarTimeNumber of cases191500- 16001231600-17001291700-18001511800-19001511900-
  • 27. 20001292000-21001312100-22001312200-2300159Results of experience survey Shift 2ParticipantScores1333323322323333233223333332332234333 32332235333444442363333233223733332332238333444442393 33323322310333323322311333444442312333323444413333444 44231433332332231533332332231633344444231733332332231 83333233213 Shift 3Cases of Product from 2300 through 0700Date21- JanTimeNumber of casesNumber of workers2300- 2400159182400-01001560100-02001530200-03001560300- 04001590400-05001810500-06001280600-0700185Date21- FebTimeNumber of casesNumber of workers2300- 2400162172400-01001680100-02001690200-03001680300- 04001590400-05001820500-06001820600-0700185Date21- MarTimeNumber of casesNumber of workers2300- 2400193192400-01001210100-02001120200-03001060300- 04001590400-05001810500-06001690600-0700185Results of experience survey Shift 3ParticipantScores1333343344323335555555333355555554333 55555555333555555563335555555733355555558333555555593 33555555510333555555511333555555512333555555513333555 55551433355555551533355555551633344444231733332332231 83333233233 StatsAJAX Bottling Corp.OUTPUT MEASUREMENTS BY SHIFTS AND TOTALMean OutputStandard DeviationMedianModeRangeVarianceKurtosisSkewednessSkew DirectionMaxMinsumcountShift 1138.16666666677.96550534261371373463.44927536230.2478 4213510.1379760501R156122331624Shift 2120.791666666715.1714238438117.511556230.17210144931.0 1398611241.2353603902R159103289924Shift 3161.583333333323.680695984716515979560.77536231880.53 29677745-1.0602933912L193106387824All shifts140.180555555623.500783904713715982552.2868441358- 0.69235405410.401276834R1931031009372SKILL MEASUREMENTS BY SHIFTS AND TOTALMean
  • 28. ExperienceStandard DeviationMedianModeRangeVarianceKurtosisSkewednessSkew DirectionMaxMinsumcountMean # of workersShift 12.33888888890.61783446732220.3817194289-0.651617953- 0.3706244237L3142118018Shift 22.92222222220.63821990183330.4073246431-0.1802800181- 0.0630801907L4152618018Shift 34.11.02537634465531.051396648-1.584801859- 0.3911300832L5273818018All shifts3.12037037041.07080441033341.146622085- 0.50598930110.5119186899R51168554018 Shift 1 Mean Experience Median Mode Range Variance Max Min 2.338888888888889 2 2 2 0.38171942892613286 3 1 Shift 2 Mean Experience Median Mode Range Variance Max Min 2.9222222222222221 3 3 3 0.40732464307883265 4 1 Shift 3 Mean Experience Median Mode Range Variance Max Min 4.0999999999999996 5 5 3 1.0513966480446917 5 2 All shifts Mean Experience Median Mode Range Variance Max Min 3.1203703703703702 3 3 4 1.1466220850480109 5 1 Shift 1 Standard Deviation Kurtosis Skewedness 0.61783446725327074 - 0.65161795304092029 -0.37062442369954557 Shift 2 Standard Deviation Kurtosis Skewedness 0.63821990181976673 -0.18028001813583305 - 6.308019069477705E-2 Shift 3 Standard Deviation Kurtosis Skewedness 1.0253763445899713 - 1.5848018589552508 -0.39113008322016157 All shifts Standard Deviation Kurtosis Skewedness 1.0708044102673517 -0.50598930108774853 0.51191868988962741 Shift 1 Standard Deviation 7.9655053425579263 Shift 2 Standard Deviation 15.171423843834649 Shift 3 Standard Deviation 23.680695984680057 All shifts Standard Deviation
  • 29. 23.50078390470842 Shift 1 Kurtosis Skewedness 0.24784213514024511 0.13797605005114444 Shift 2 Kurtosis Skewedness 1.0139861123716565 1.2353603902121575 Shift 3 Kurtosis Skewedness 0.5329677744665986 -1.0602933911975536 All shifts Kurtosis Skewedness -0.69235405412266537 0.40127683404587272 Shift 1 Mean Output Median Mode Range Variance Max Min 138.16666666666666 137 137 34 63.449275362318865 156 122 Shift 2 Mean Output Median Mode Range Variance Max Min 120.79166666666667 117.5 115 56 230.17210144927452 159 103 Shift 3 Mean Output Median Mode Range Variance Max Min 161.58333333333334 165 159 79 560.77536231884221 193 106 All shifts Mean Output Median Mode Range Variance Max Min 140.18055555555554 137 159 82 552.28684413580243 193 103 All shifts - Production All shifts Mean Output Median Mode Range Max Min 140.18055555555554 137 159 82 193 103 All shifts - Experience All shifts Mean Experience Median Mode Range Max Min 3.1203703703703702 3 3 4 5 1