The Wall
•
0 likes•71 views

Results from a 2016 survey on U.S. perspectives on legal and illegal immigration. San Francisco Bay Area centric survey. No surprise, but results were very immigrant friendly. Main takeaway is that the U.S. is a massively divided country and immigration will have to be addressed imminently by the next President

Recommended
More Related Content
What's hot
What's hot (15)
Viewers also liked
Viewers also liked (20)
Similar to The Wall
Similar to The Wall (20)
Recently uploaded
Recently uploaded (20)
The Wall
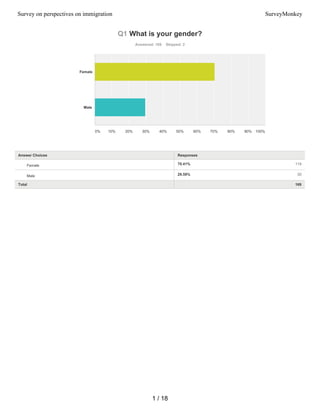
- 1. 70.41% 119 29.59% 50 Q1 What is your gender? Answered: 169 Skipped: 2 Total 169 Female Male 0% 10% 20% 30% 40% 50% 60% 70% 80% 90% 100% Answer Choices Responses Female Male 1 / 18 Survey on perspectives on immigration SurveyMonkey
- 2. 2.37% 4 15.98% 27 28.40% 48 36.09% 61 13.02% 22 2.96% 5 1.18% 2 Q2 What is your age? Answered: 169 Skipped: 2 Total 169 18 to 24 25 to 34 35 to 44 45 to 54 55 to 64 65 to 74 75 or older 0% 10% 20% 30% 40% 50% 60% 70% 80% 90% 100% Answer Choices Responses 18 to 24 25 to 34 35 to 44 45 to 54 55 to 64 65 to 74 75 or older 2 / 18 Survey on perspectives on immigration SurveyMonkey
- 3. 85.21% 144 14.79% 25 Q3 Are you a citizen of the United States? Answered: 169 Skipped: 2 Total 169 Yes No 0% 10% 20% 30% 40% 50% 60% 70% 80% 90% 100% Answer Choices Responses Yes No 3 / 18 Survey on perspectives on immigration SurveyMonkey
- 4. 5.39% 9 60.48% 101 23.95% 40 10.18% 17 Q4 Generally speaking, do you usually think of yourself as a Republican, a Democrat, an Independent, or something else? Answered: 167 Skipped: 4 Total 167 Republican Democrat Independent Something else 0% 10% 20% 30% 40% 50% 60% 70% 80% 90% 100% Answer Choices Responses Republican Democrat Independent Something else 4 / 18 Survey on perspectives on immigration SurveyMonkey
- 5. 0.00% 0 0.59% 1 7.10% 12 2.37% 4 28.40% 48 61.54% 104 Q5 What is the highest level of school you have completed or the highest degree you have received? Answered: 169 Skipped: 2 Total 169 Less than high school degree High school degree or... Some college but no degree Associate degree Bachelor degree Graduate degree 0% 10% 20% 30% 40% 50% 60% 70% 80% 90% 100% Answer Choices Responses Less than high school degree High school degree or equivalent (e.g., GED) Some college but no degree Associate degree Bachelor degree Graduate degree 5 / 18 Survey on perspectives on immigration SurveyMonkey
- 6. 64.67% 108 0.60% 1 1.20% 2 27.54% 46 0.00% 0 5.99% 10 Q6 Are you White, Black or African- American, American Indian or Alaska Native, Asian, Native Hawaiian or other Pacific islander, or some other or multiple races? Answered: 167 Skipped: 4 Total 167 White – A person havin... Black or African... American Indian or... Asian – A person havin... Native Hawaiian or... From other or multiple races 0% 10% 20% 30% 40% 50% 60% 70% 80% 90% 100% Answer Choices Responses White – A person having origins in any of the original peoples of Europe, the Middle East, or North Africa Black or African American – A person having origins in any of the Black racial groups of Africa American Indian or Alaska Native – A person having origins in any of the original peoples of North and South America (including Central America) and who maintains tribal affiliation or community attachment Asian – A person having origins in any of the original peoples of the Far East, Southeast Asia, or the Indian subcontinent including, for example, Cambodia, China, India, Japan, Korea, Malaysia, Pakistan, the Philippine Islands, Thailand, and Vietnam Native Hawaiian or Other Pacific Islander – A person having origins in any of the original peoples of Hawaii, Guam, Samoa, or other Pacific Islands From other or multiple races 6 / 18 Survey on perspectives on immigration SurveyMonkey
- 7. 3.73% 6 96.27% 155 Q7 What is your ethnicity? Answered: 161 Skipped: 10 Total Respondents: 161 Hispanic or Latino (A... Not Hispanic or Latino 0% 10% 20% 30% 40% 50% 60% 70% 80% 90% 100% Answer Choices Responses Hispanic or Latino (A person of Cuban, Mexican, Puerto Rican, South or Central American, or other Spanish culture or origin, regardless of race) Not Hispanic or Latino 7 / 18 Survey on perspectives on immigration SurveyMonkey
- 8. Q8 In what ZIP code is your home located? (enter 5-digit ZIP code; for example, 00544 or 94305) Answered: 164 Skipped: 7 8 / 18 Survey on perspectives on immigration SurveyMonkey
- 9. 65.27% 109 34.73% 58 Q9 Were you born in the U.S.? Answered: 167 Skipped: 4 Total 167 Yes No 0% 10% 20% 30% 40% 50% 60% 70% 80% 90% 100% Answer Choices Responses Yes No 9 / 18 Survey on perspectives on immigration SurveyMonkey
- 10. 92.59% 150 1.85% 3 5.56% 9 Q10 Do you agree that immigrants generally (legal and illegal) make American society better in the long-run Answered: 162 Skipped: 9 Total 162 Agree Disagree Neutral 0% 10% 20% 30% 40% 50% 60% 70% 80% 90% 100% Answer Choices Responses Agree Disagree Neutral 10 / 18 Survey on perspectives on immigration SurveyMonkey
- 11. 37.89% 61 18.63% 30 43.48% 70 Q11 Do you agree that illegal immigrants make American society better in the long- run Answered: 161 Skipped: 10 Total 161 Agree Disagree Neutral 0% 10% 20% 30% 40% 50% 60% 70% 80% 90% 100% Answer Choices Responses Agree Disagree Neutral 11 / 18 Survey on perspectives on immigration SurveyMonkey
- 12. 4.38% 7 10.00% 16 85.63% 137 Q12 What impact do you think immigrants generally (legal and illegal) have on crime? Answered: 160 Skipped: 11 Total 160 Make it worse Make it better Not much effect 0% 10% 20% 30% 40% 50% 60% 70% 80% 90% 100% Answer Choices Responses Make it worse Make it better Not much effect 12 / 18 Survey on perspectives on immigration SurveyMonkey
- 13. 16.35% 26 3.77% 6 79.87% 127 Q13 What impact do you think illegal immigrants have on crime? Answered: 159 Skipped: 12 Total 159 Make it worse Make it better Not much effect 0% 10% 20% 30% 40% 50% 60% 70% 80% 90% 100% Answer Choices Responses Make it worse Make it better Not much effect 13 / 18 Survey on perspectives on immigration SurveyMonkey
- 14. 2.50% 4 89.38% 143 8.13% 13 Q14 What impact do you think immigrants generally (legal and illegal) have on the economy Answered: 160 Skipped: 11 Total 160 Make it worse Make it better Not much effect 0% 10% 20% 30% 40% 50% 60% 70% 80% 90% 100% Answer Choices Responses Make it worse Make it better Not much effect 14 / 18 Survey on perspectives on immigration SurveyMonkey
- 15. 5.03% 8 54.09% 86 40.88% 65 Q15 What impact do you think immigrants generally (legal and illegal) have on social and moral values? Answered: 159 Skipped: 12 Total 159 Make it worse Make it better Not much effect 0% 10% 20% 30% 40% 50% 60% 70% 80% 90% 100% Answer Choices Responses Make it worse Make it better Not much effect 15 / 18 Survey on perspectives on immigration SurveyMonkey
- 16. 1.24% 2 72.67% 117 26.09% 42 Q16 What impact do you think immigrants generally (legal and illegal) have on science and technology? Answered: 161 Skipped: 10 Total 161 Make it worse Make it better Not much effect 0% 10% 20% 30% 40% 50% 60% 70% 80% 90% 100% Answer Choices Responses Make it worse Make it better Not much effect 16 / 18 Survey on perspectives on immigration SurveyMonkey
- 17. 1.23% 2 90.12% 146 8.64% 14 Q17 What impact do you think immigrants generally (legal and illegal) have on food, music, and arts? Answered: 162 Skipped: 9 Total 162 Make it worse Make it better Not much effect 0% 10% 20% 30% 40% 50% 60% 70% 80% 90% 100% Answer Choices Responses Make it worse Make it better Not much effect 17 / 18 Survey on perspectives on immigration SurveyMonkey
- 18. 14.81% 24 67.28% 109 17.90% 29 Q18 Do you agree that illegal immigrants should be asked to leave the country? Answered: 162 Skipped: 9 Total 162 Agree Disagree Neutral 0% 10% 20% 30% 40% 50% 60% 70% 80% 90% 100% Answer Choices Responses Agree Disagree Neutral 18 / 18 Survey on perspectives on immigration SurveyMonkey