Download as KEY, PPTX

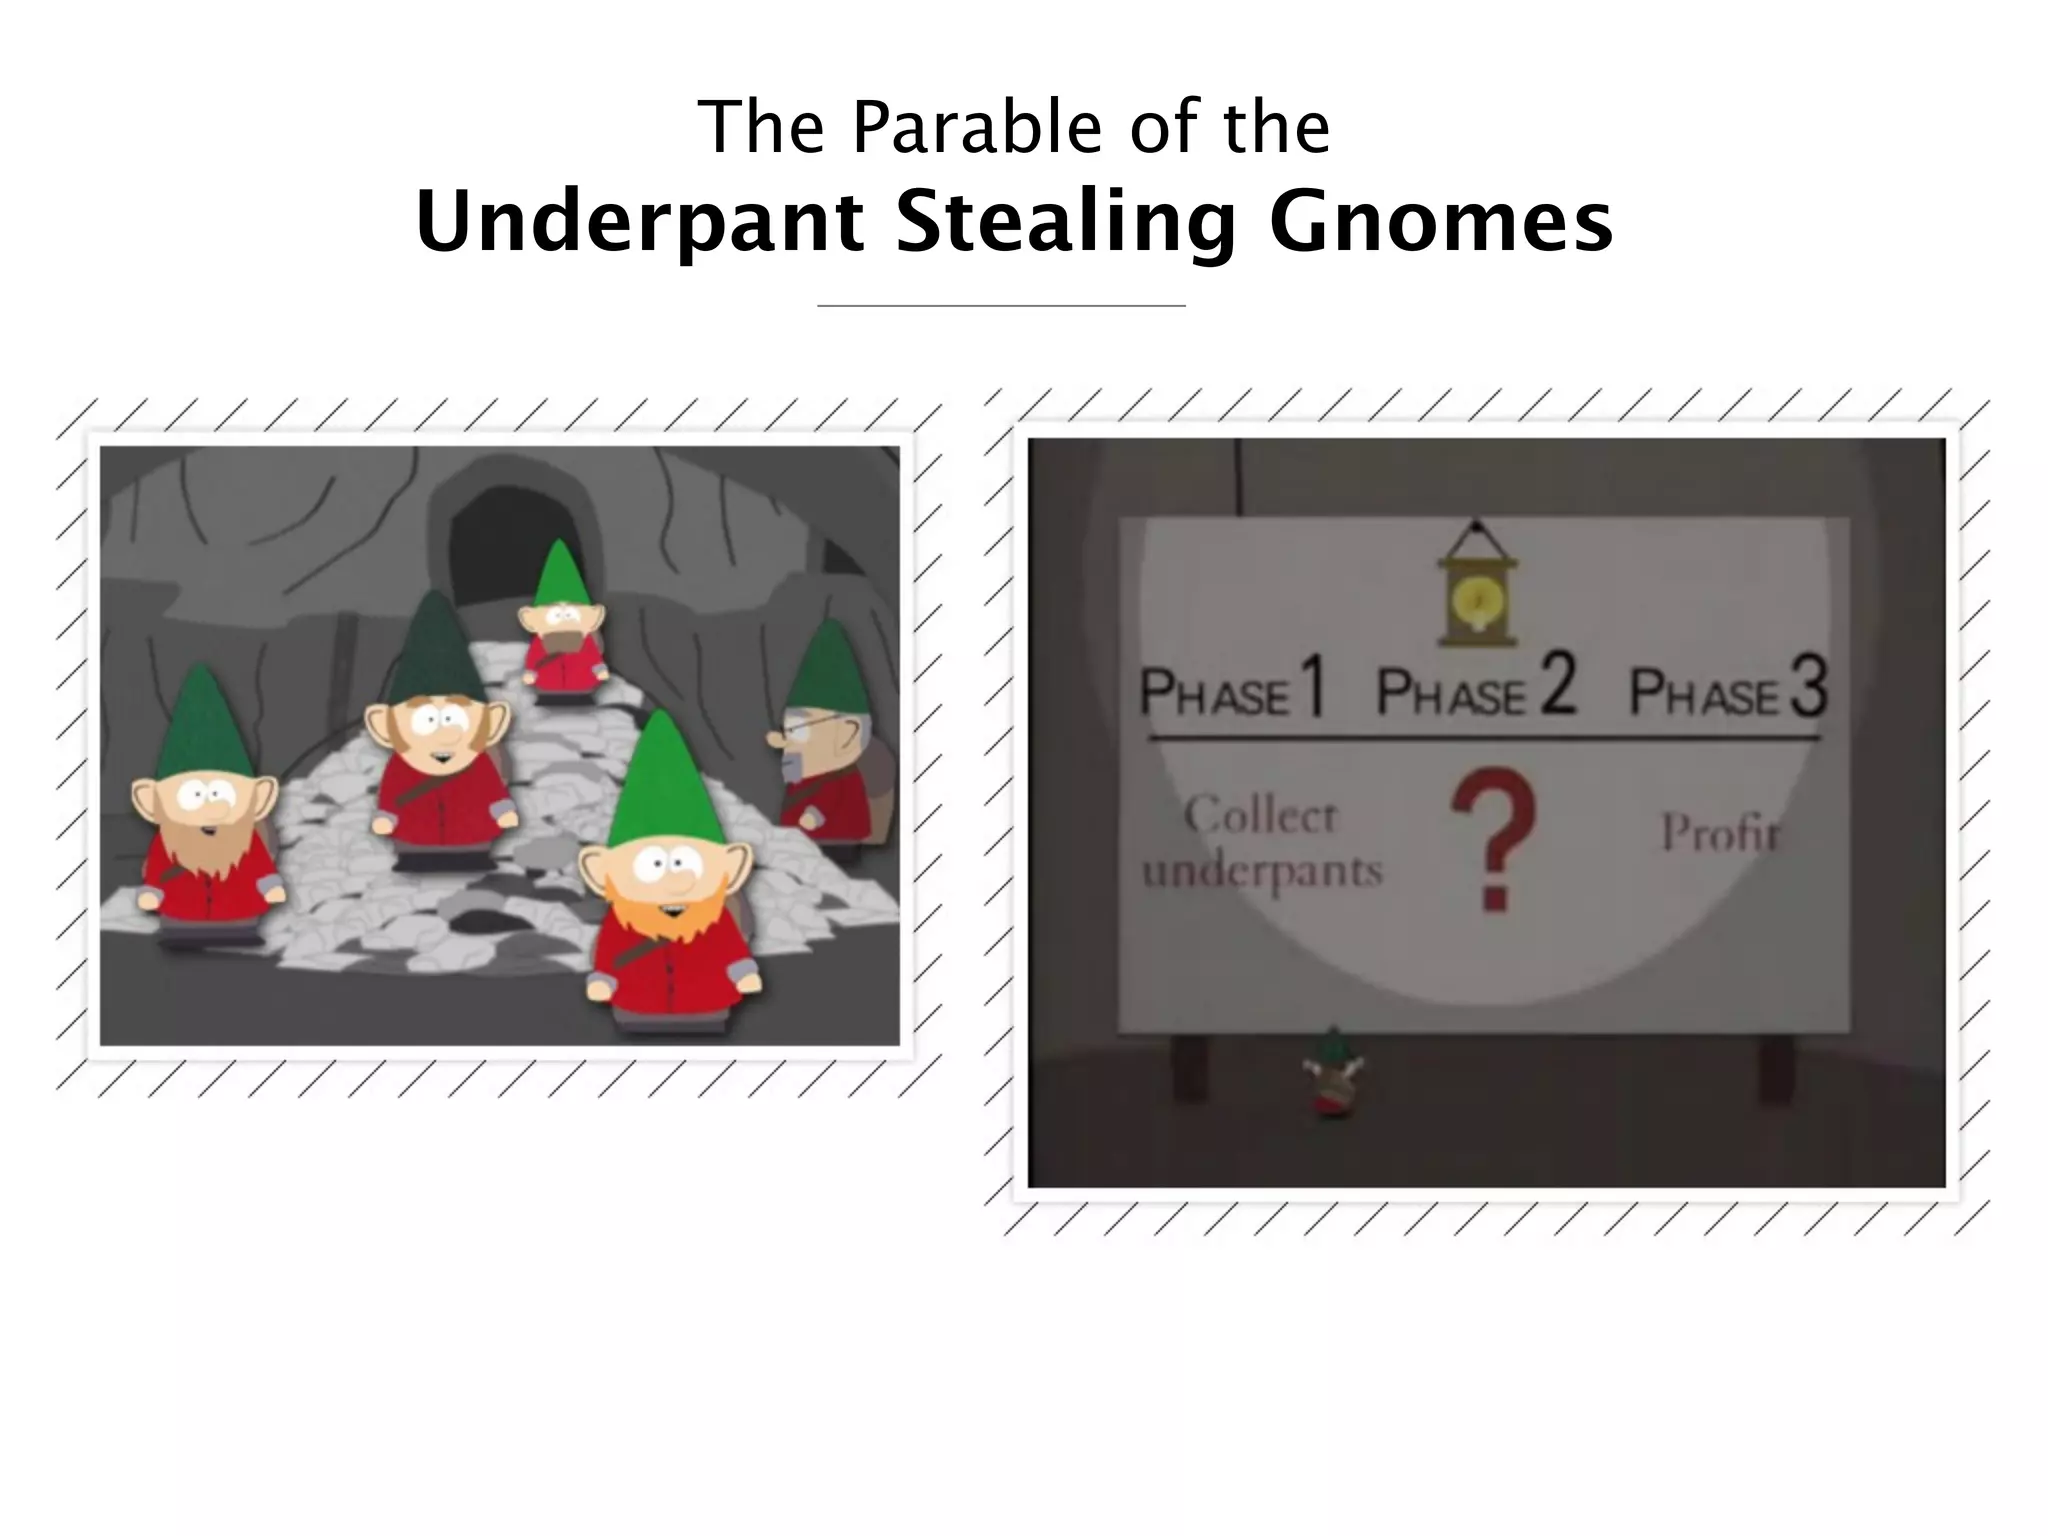
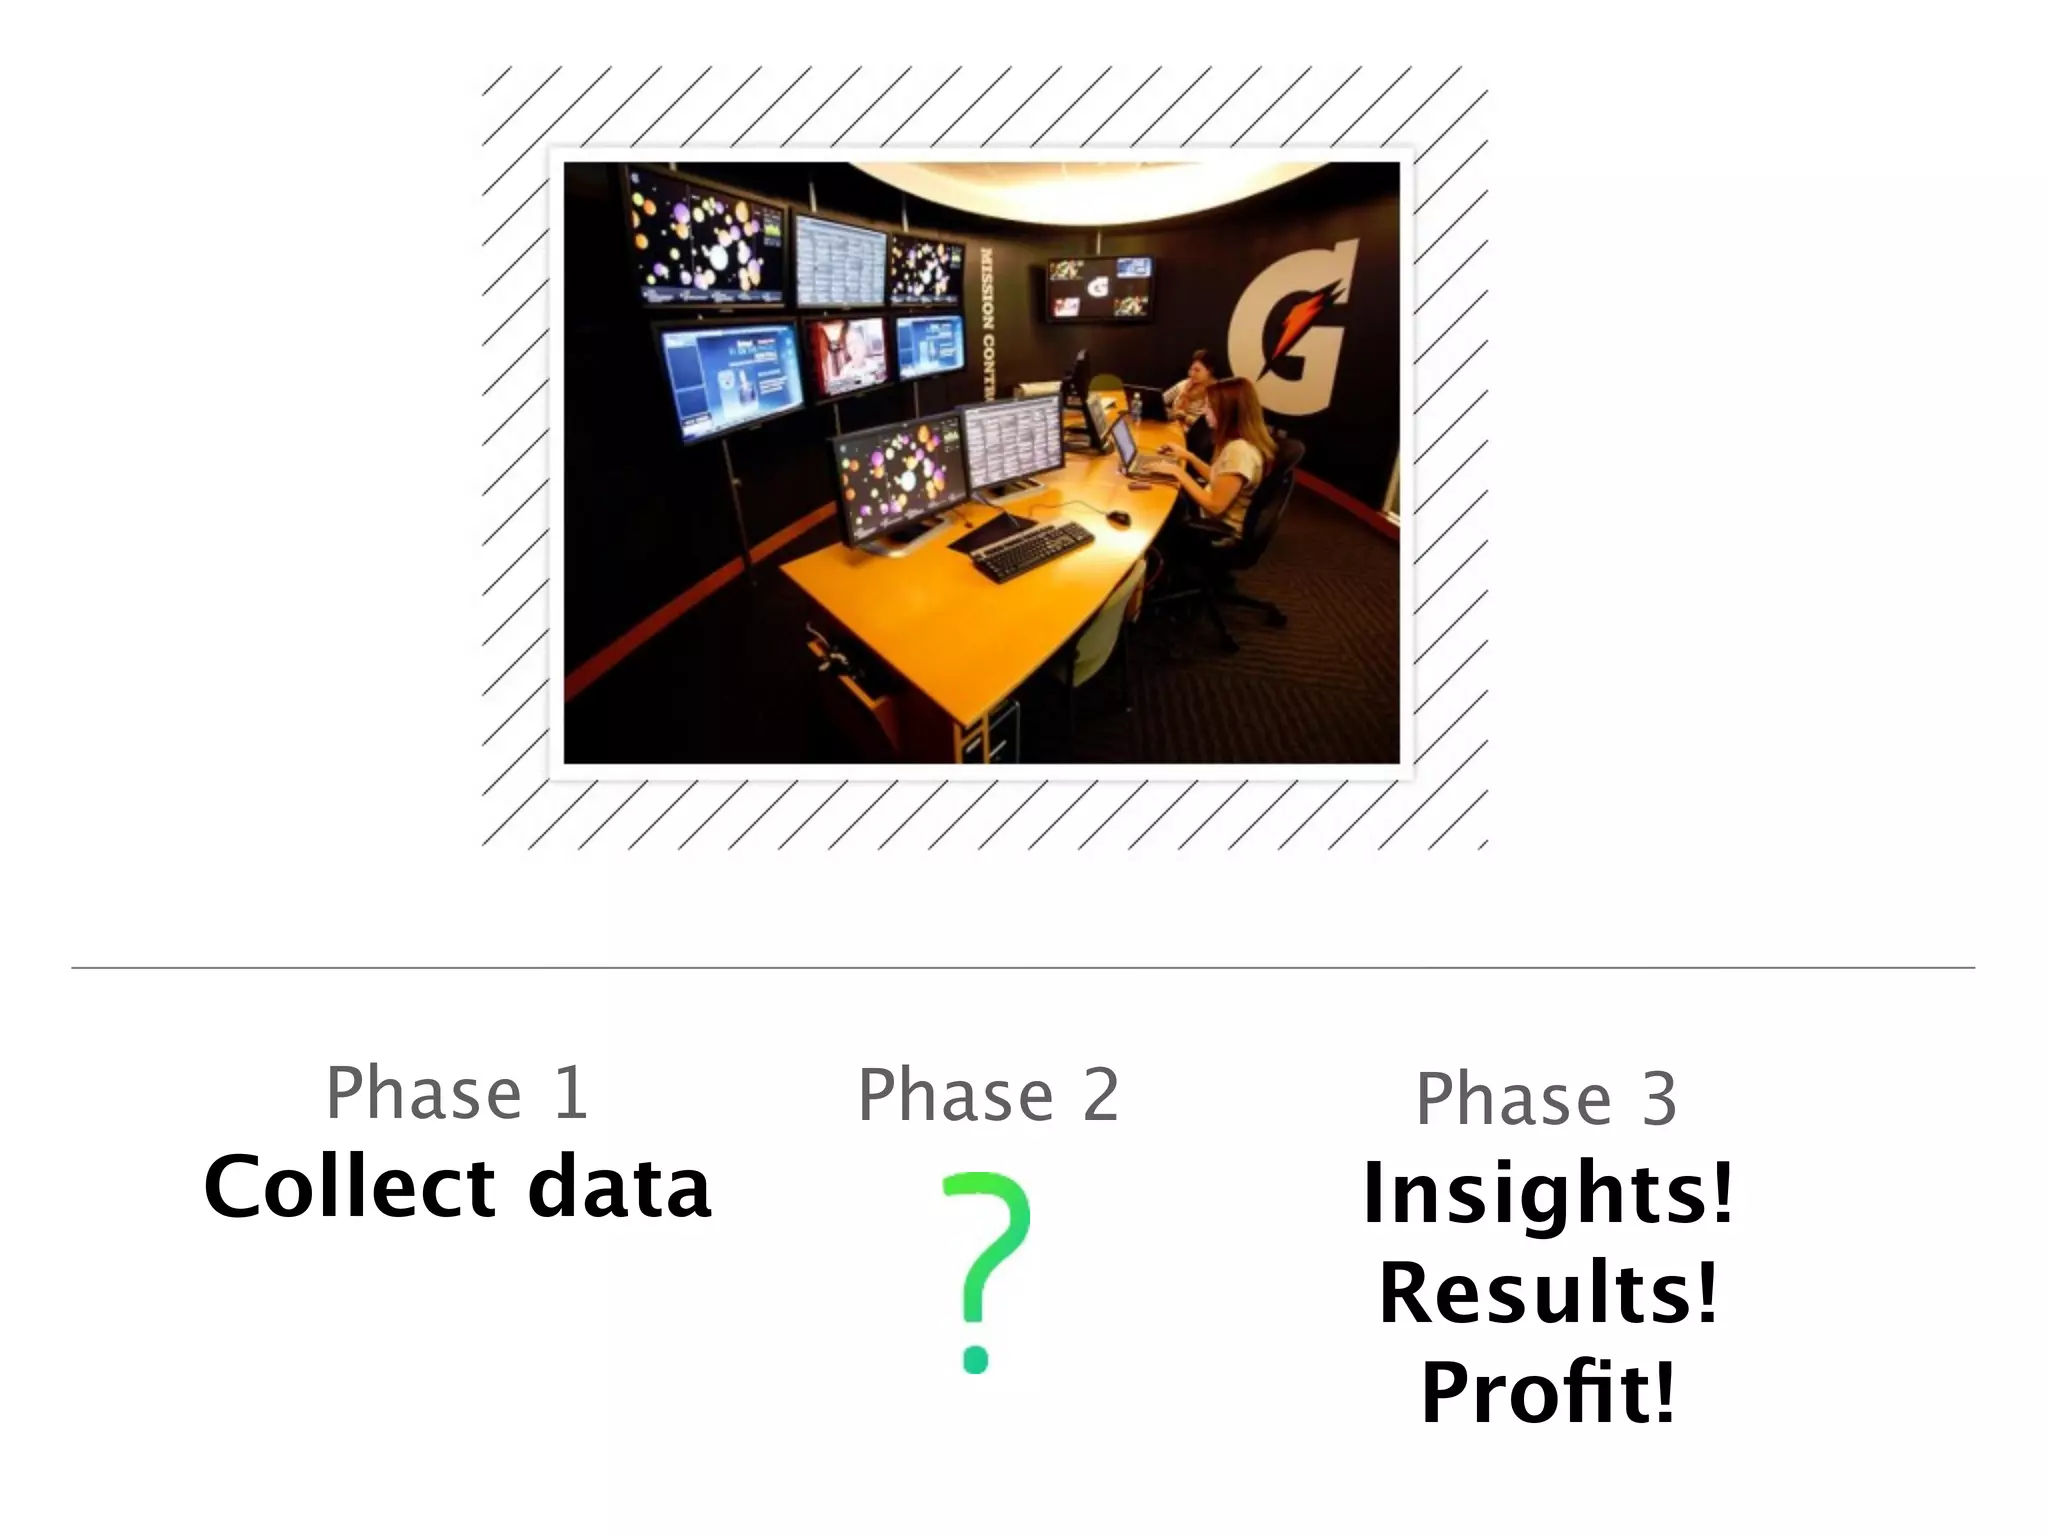
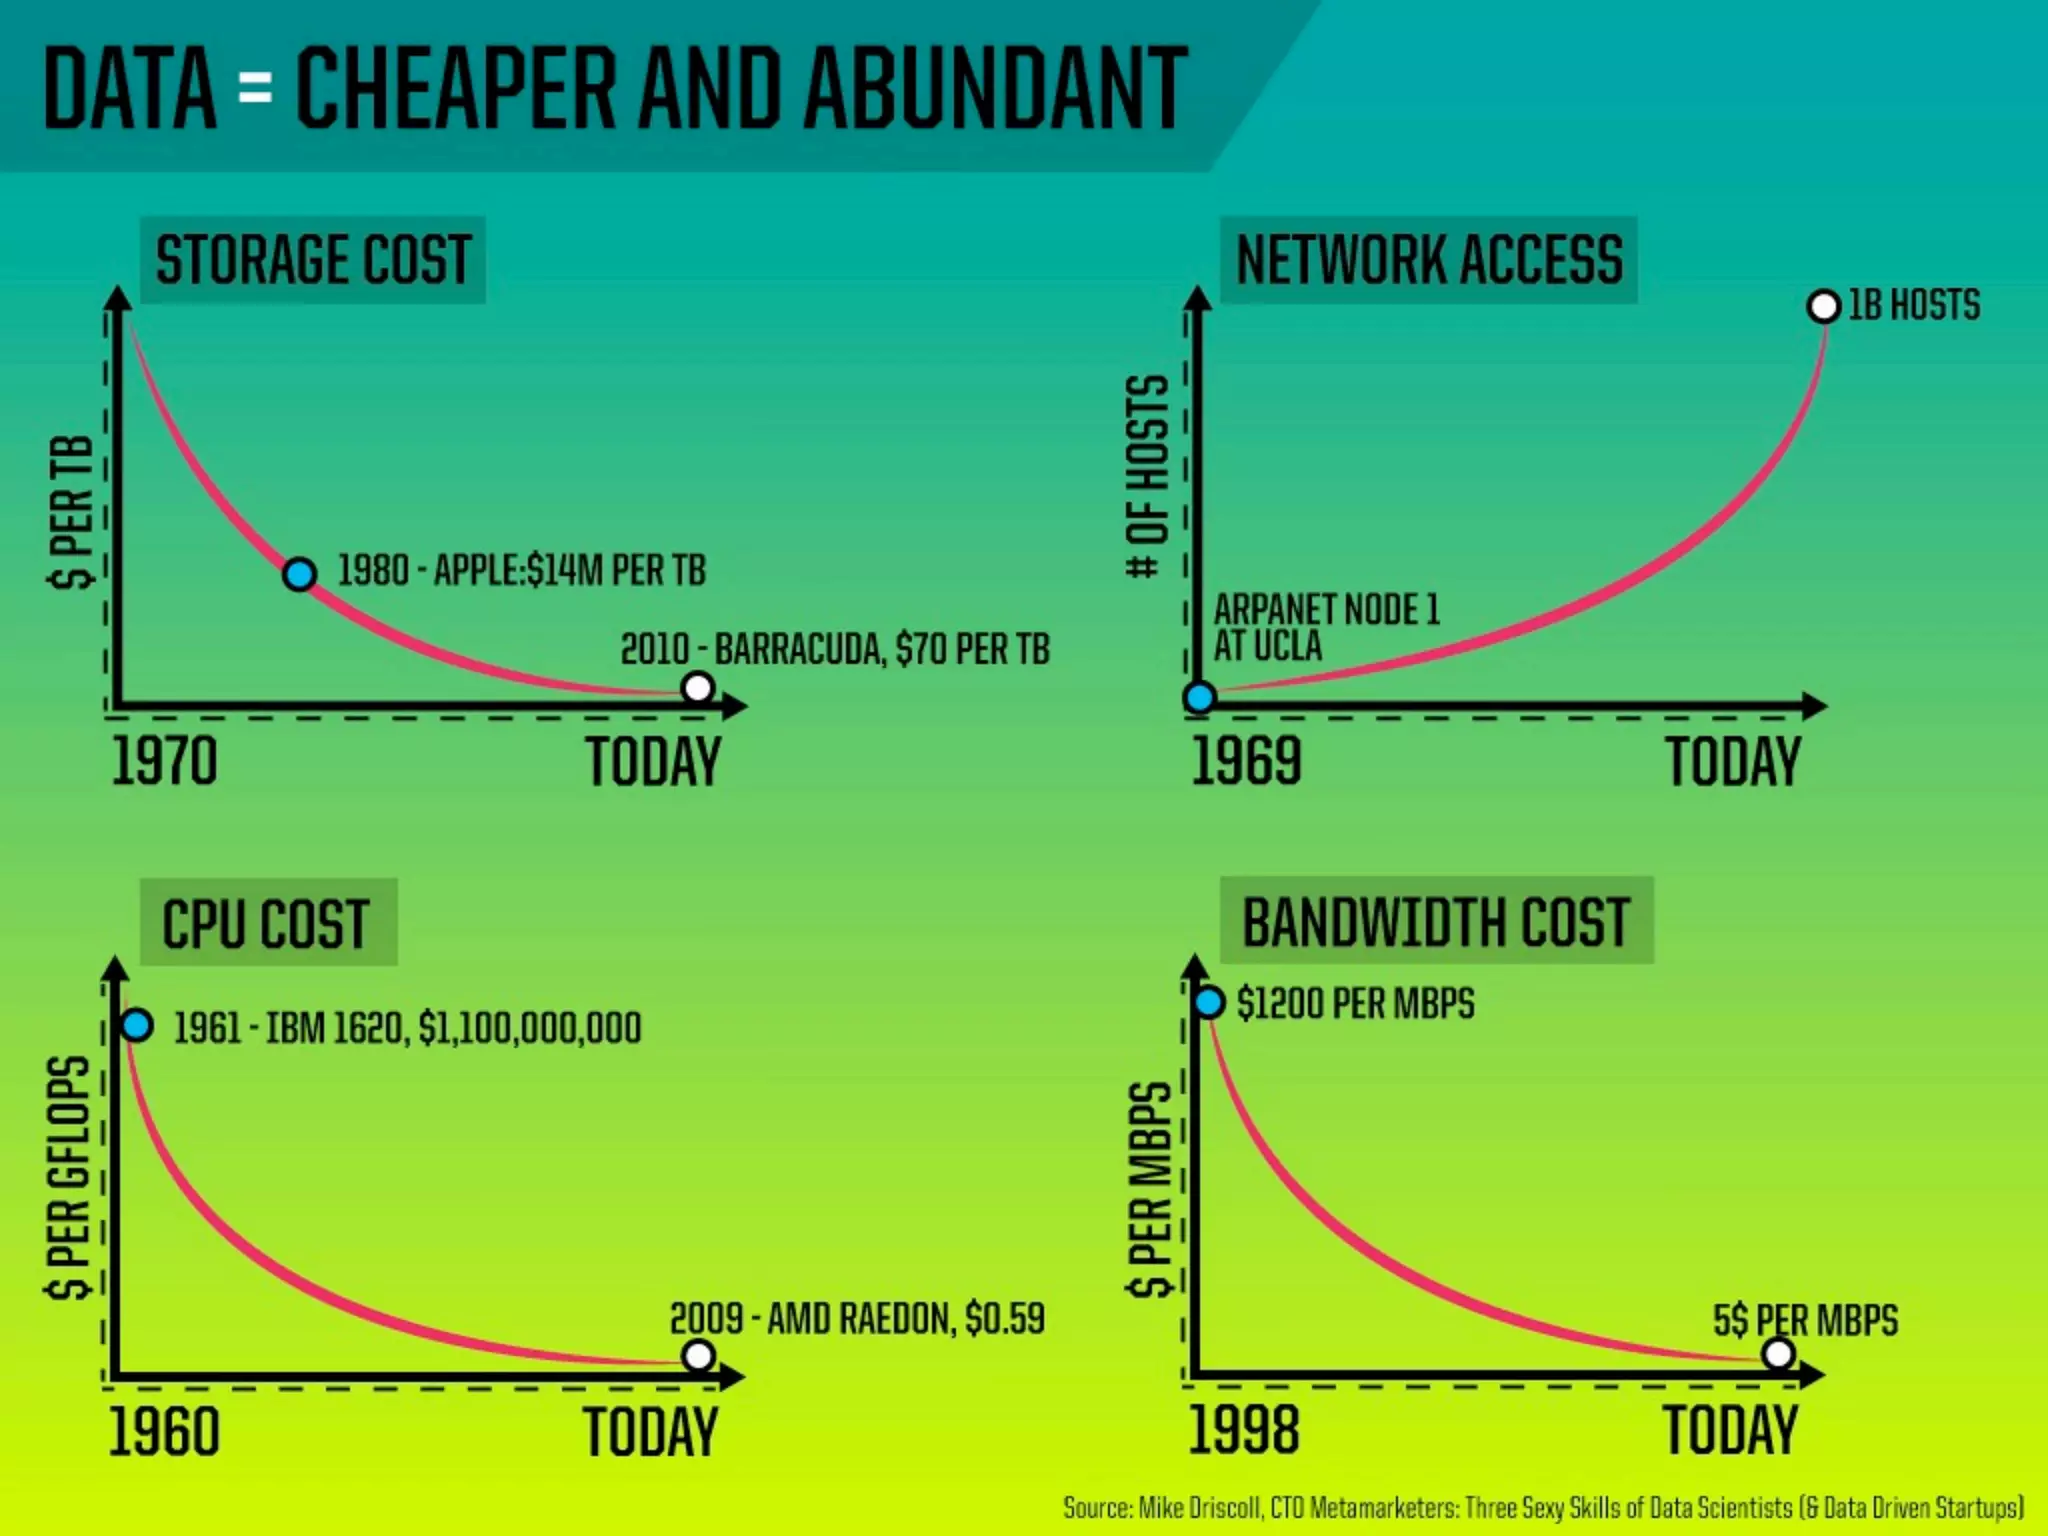
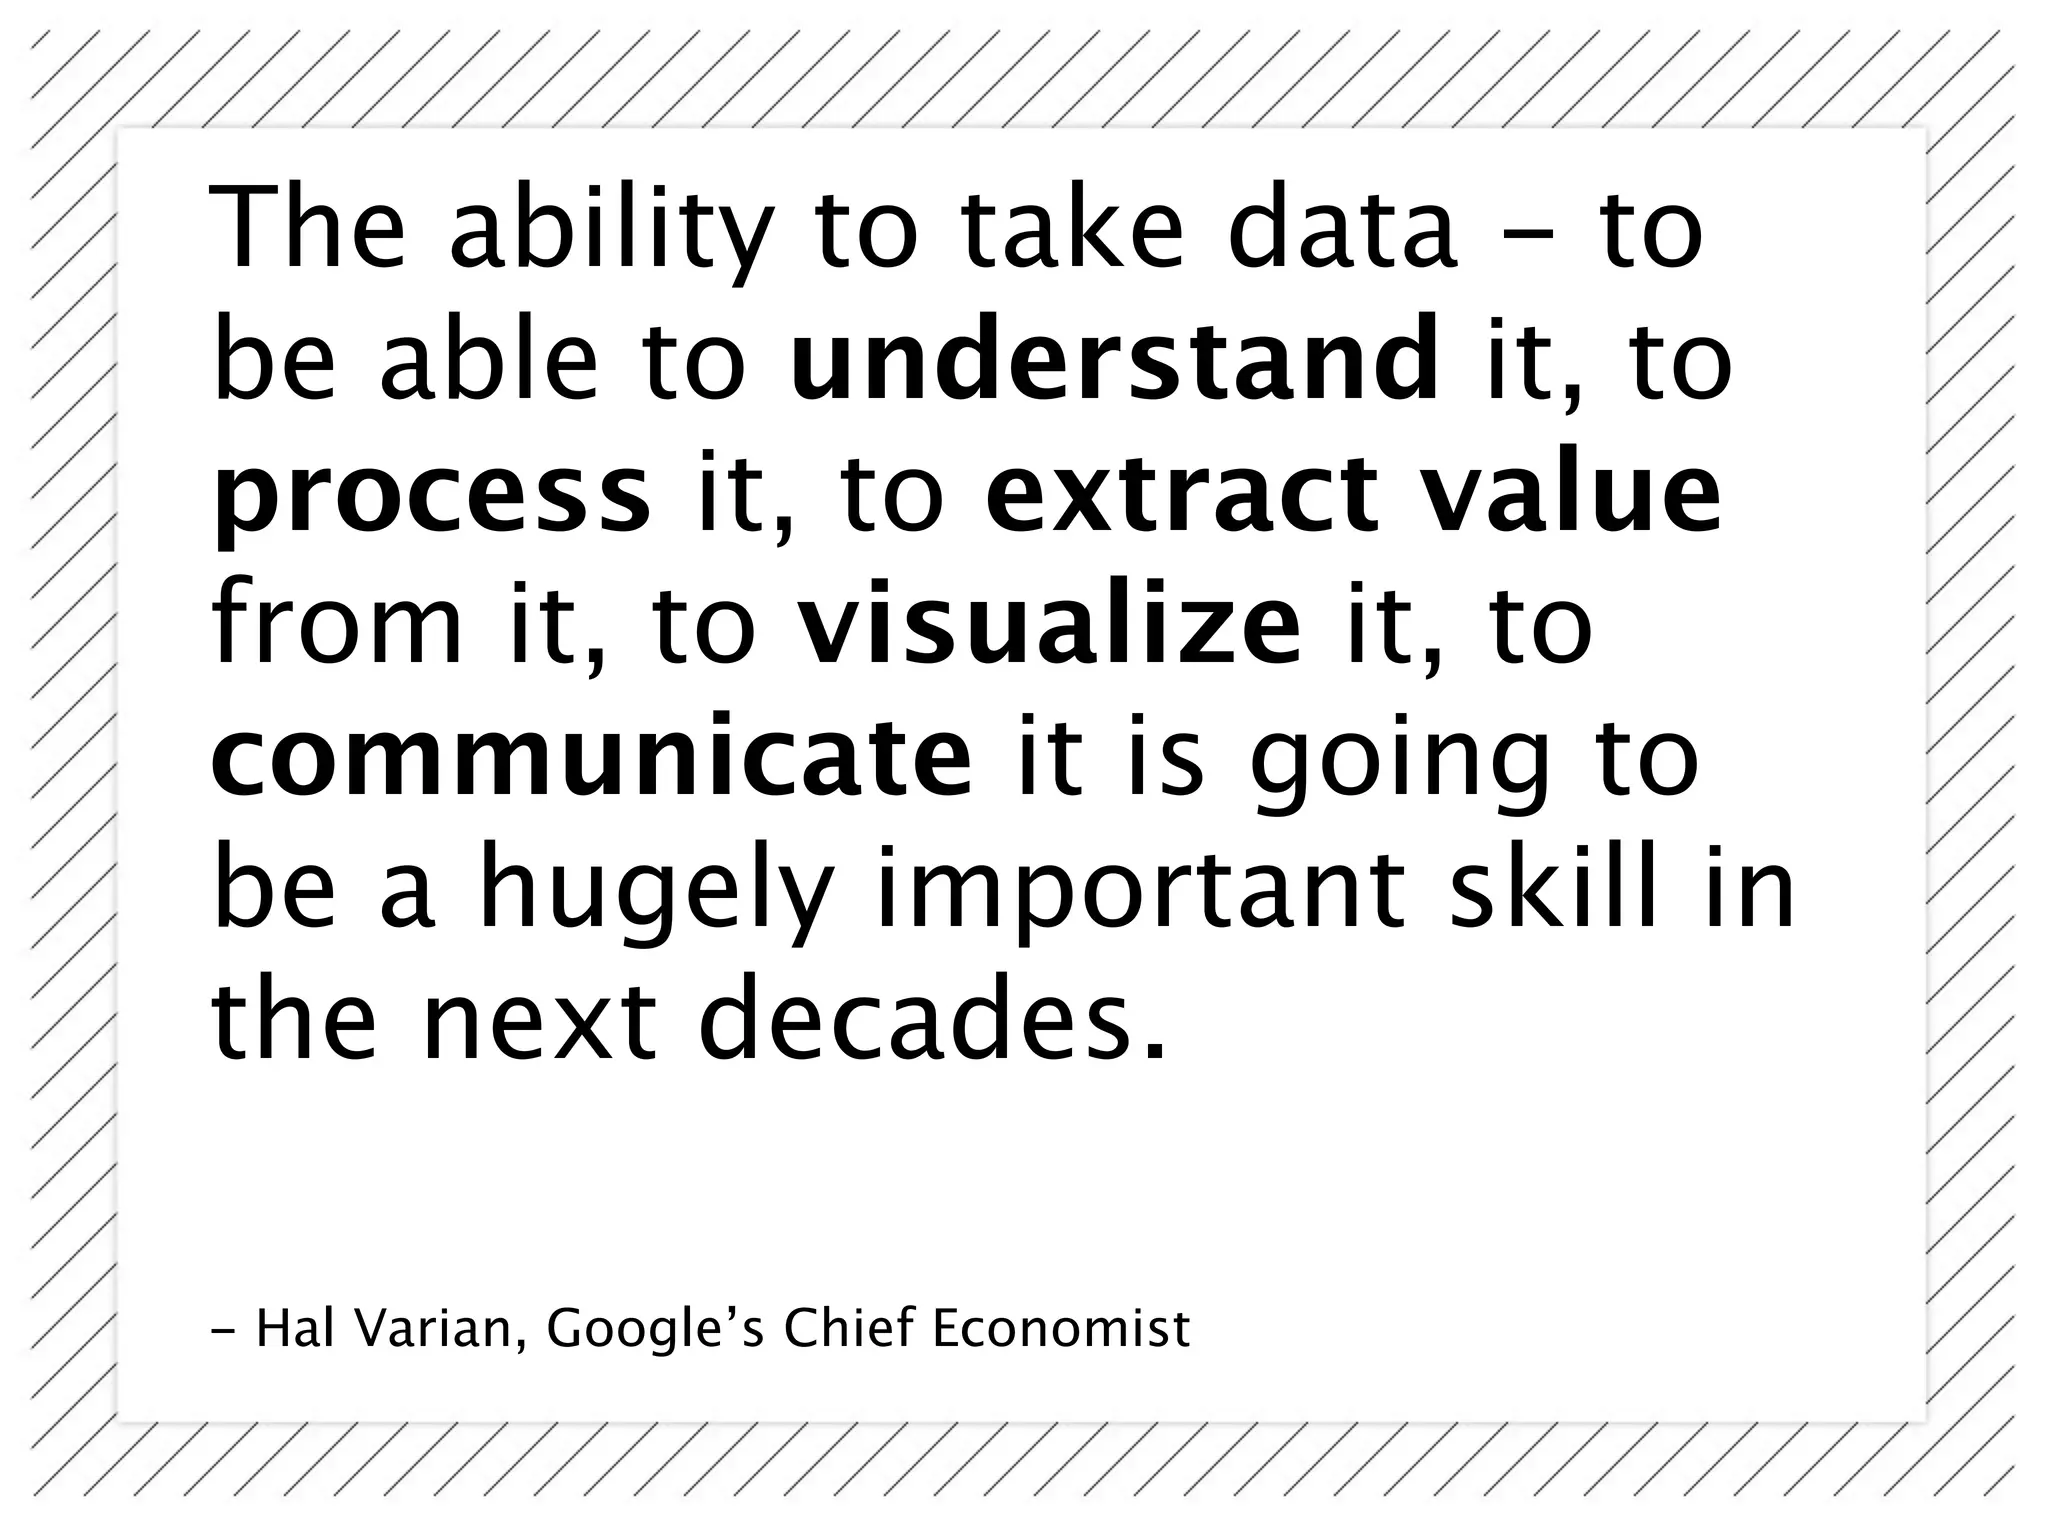
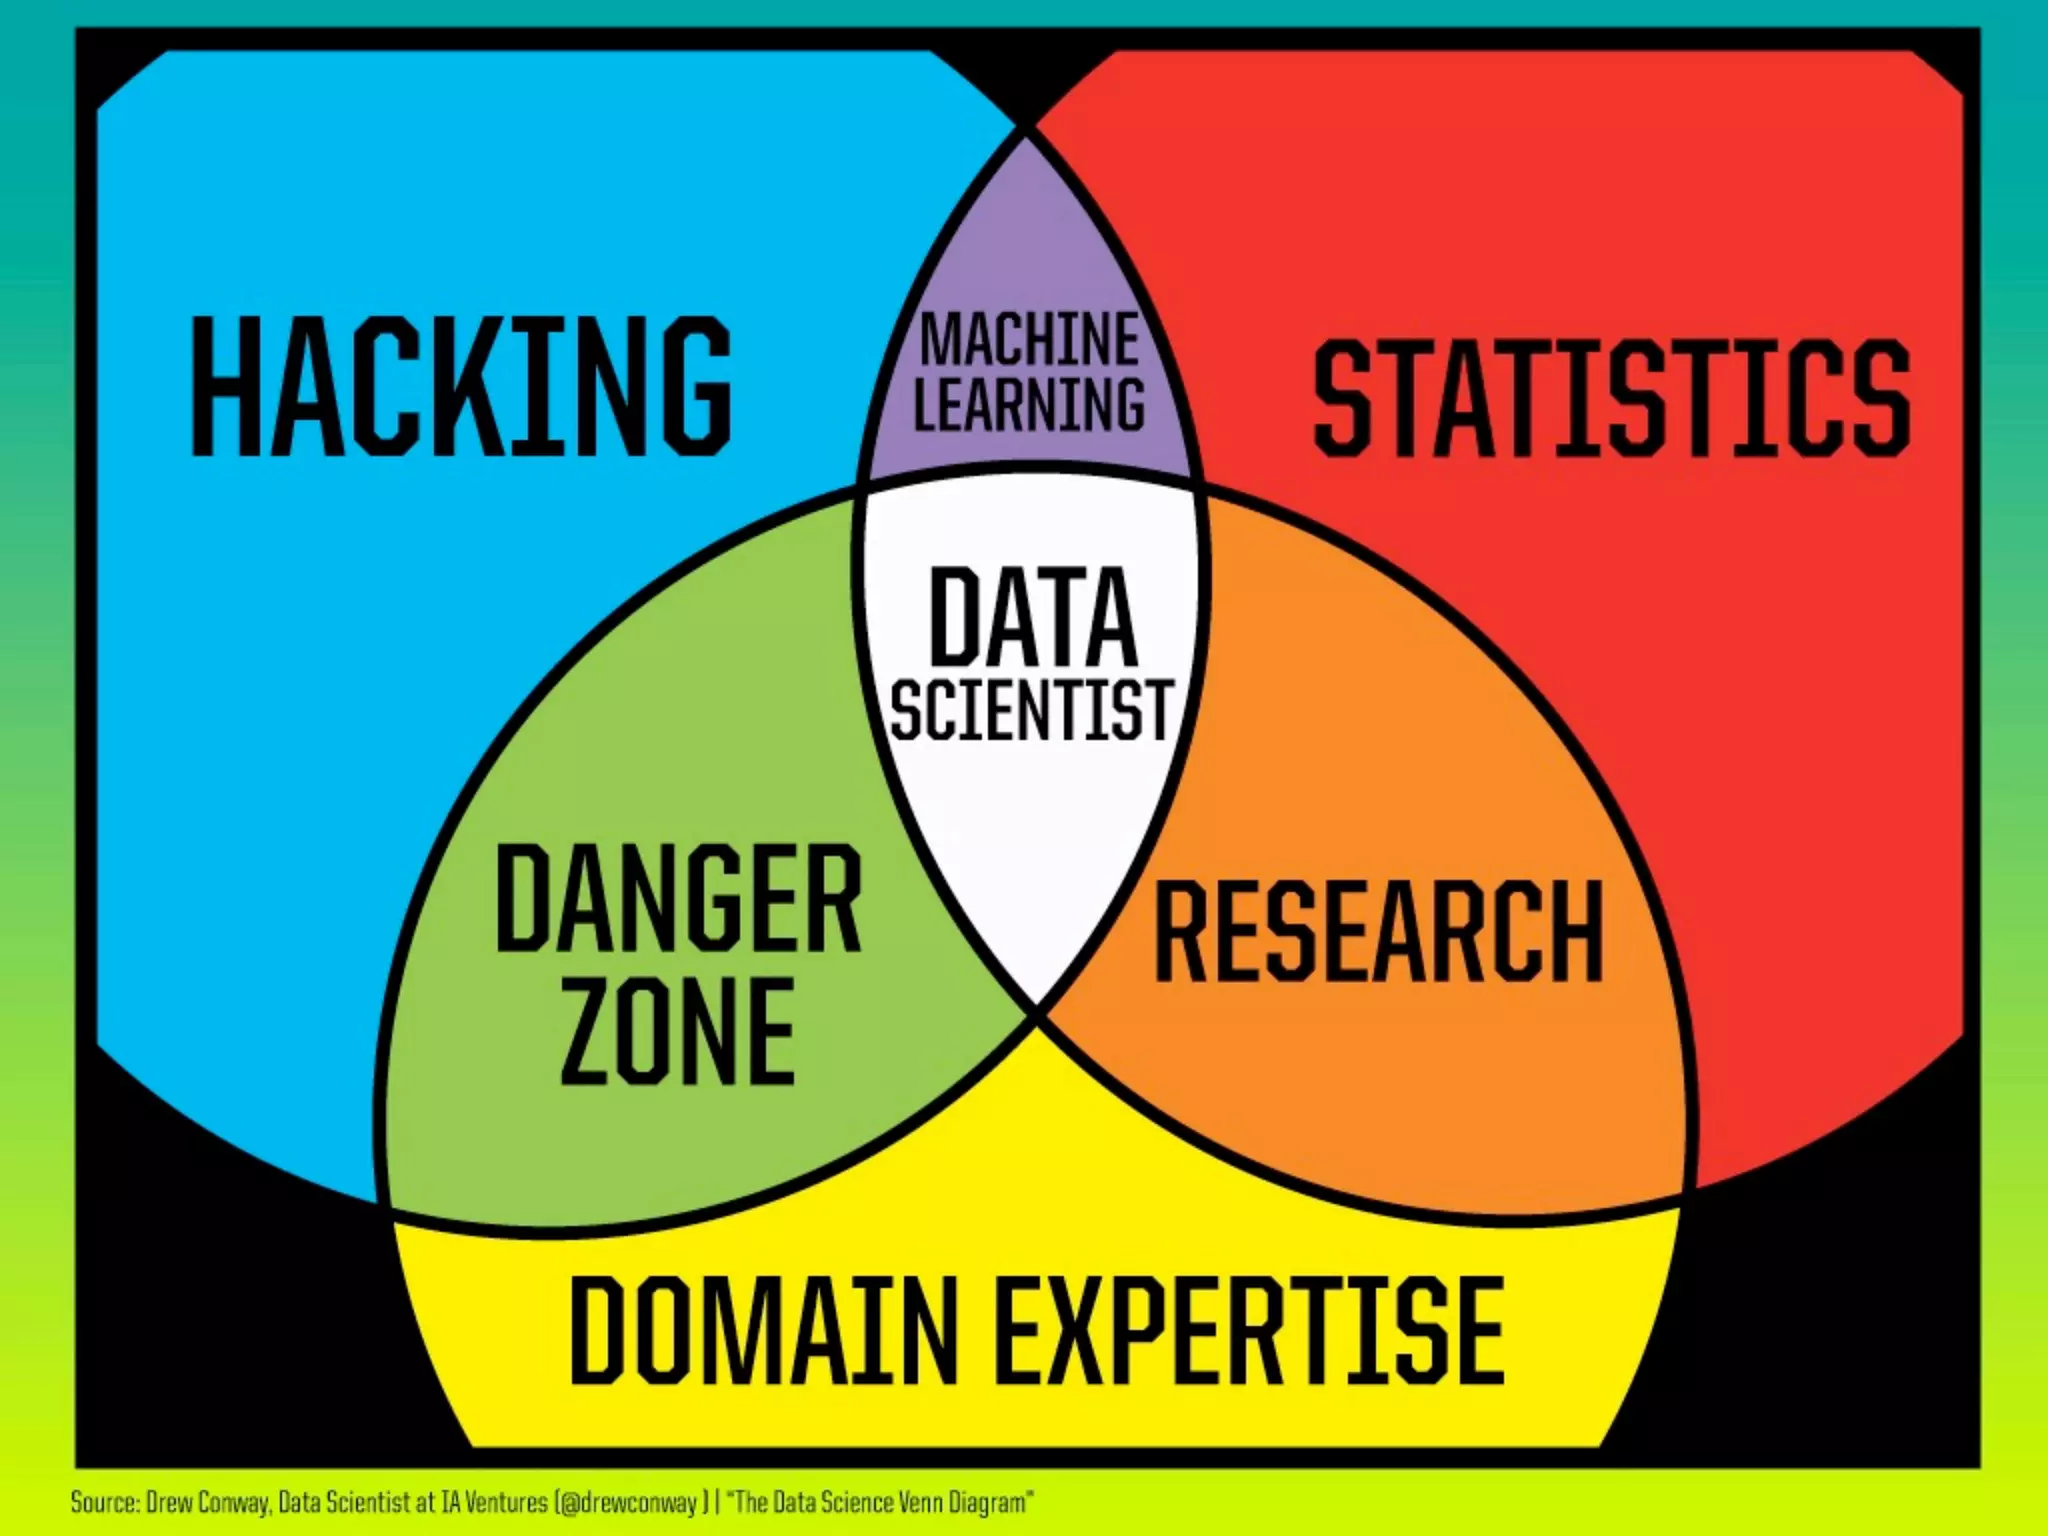
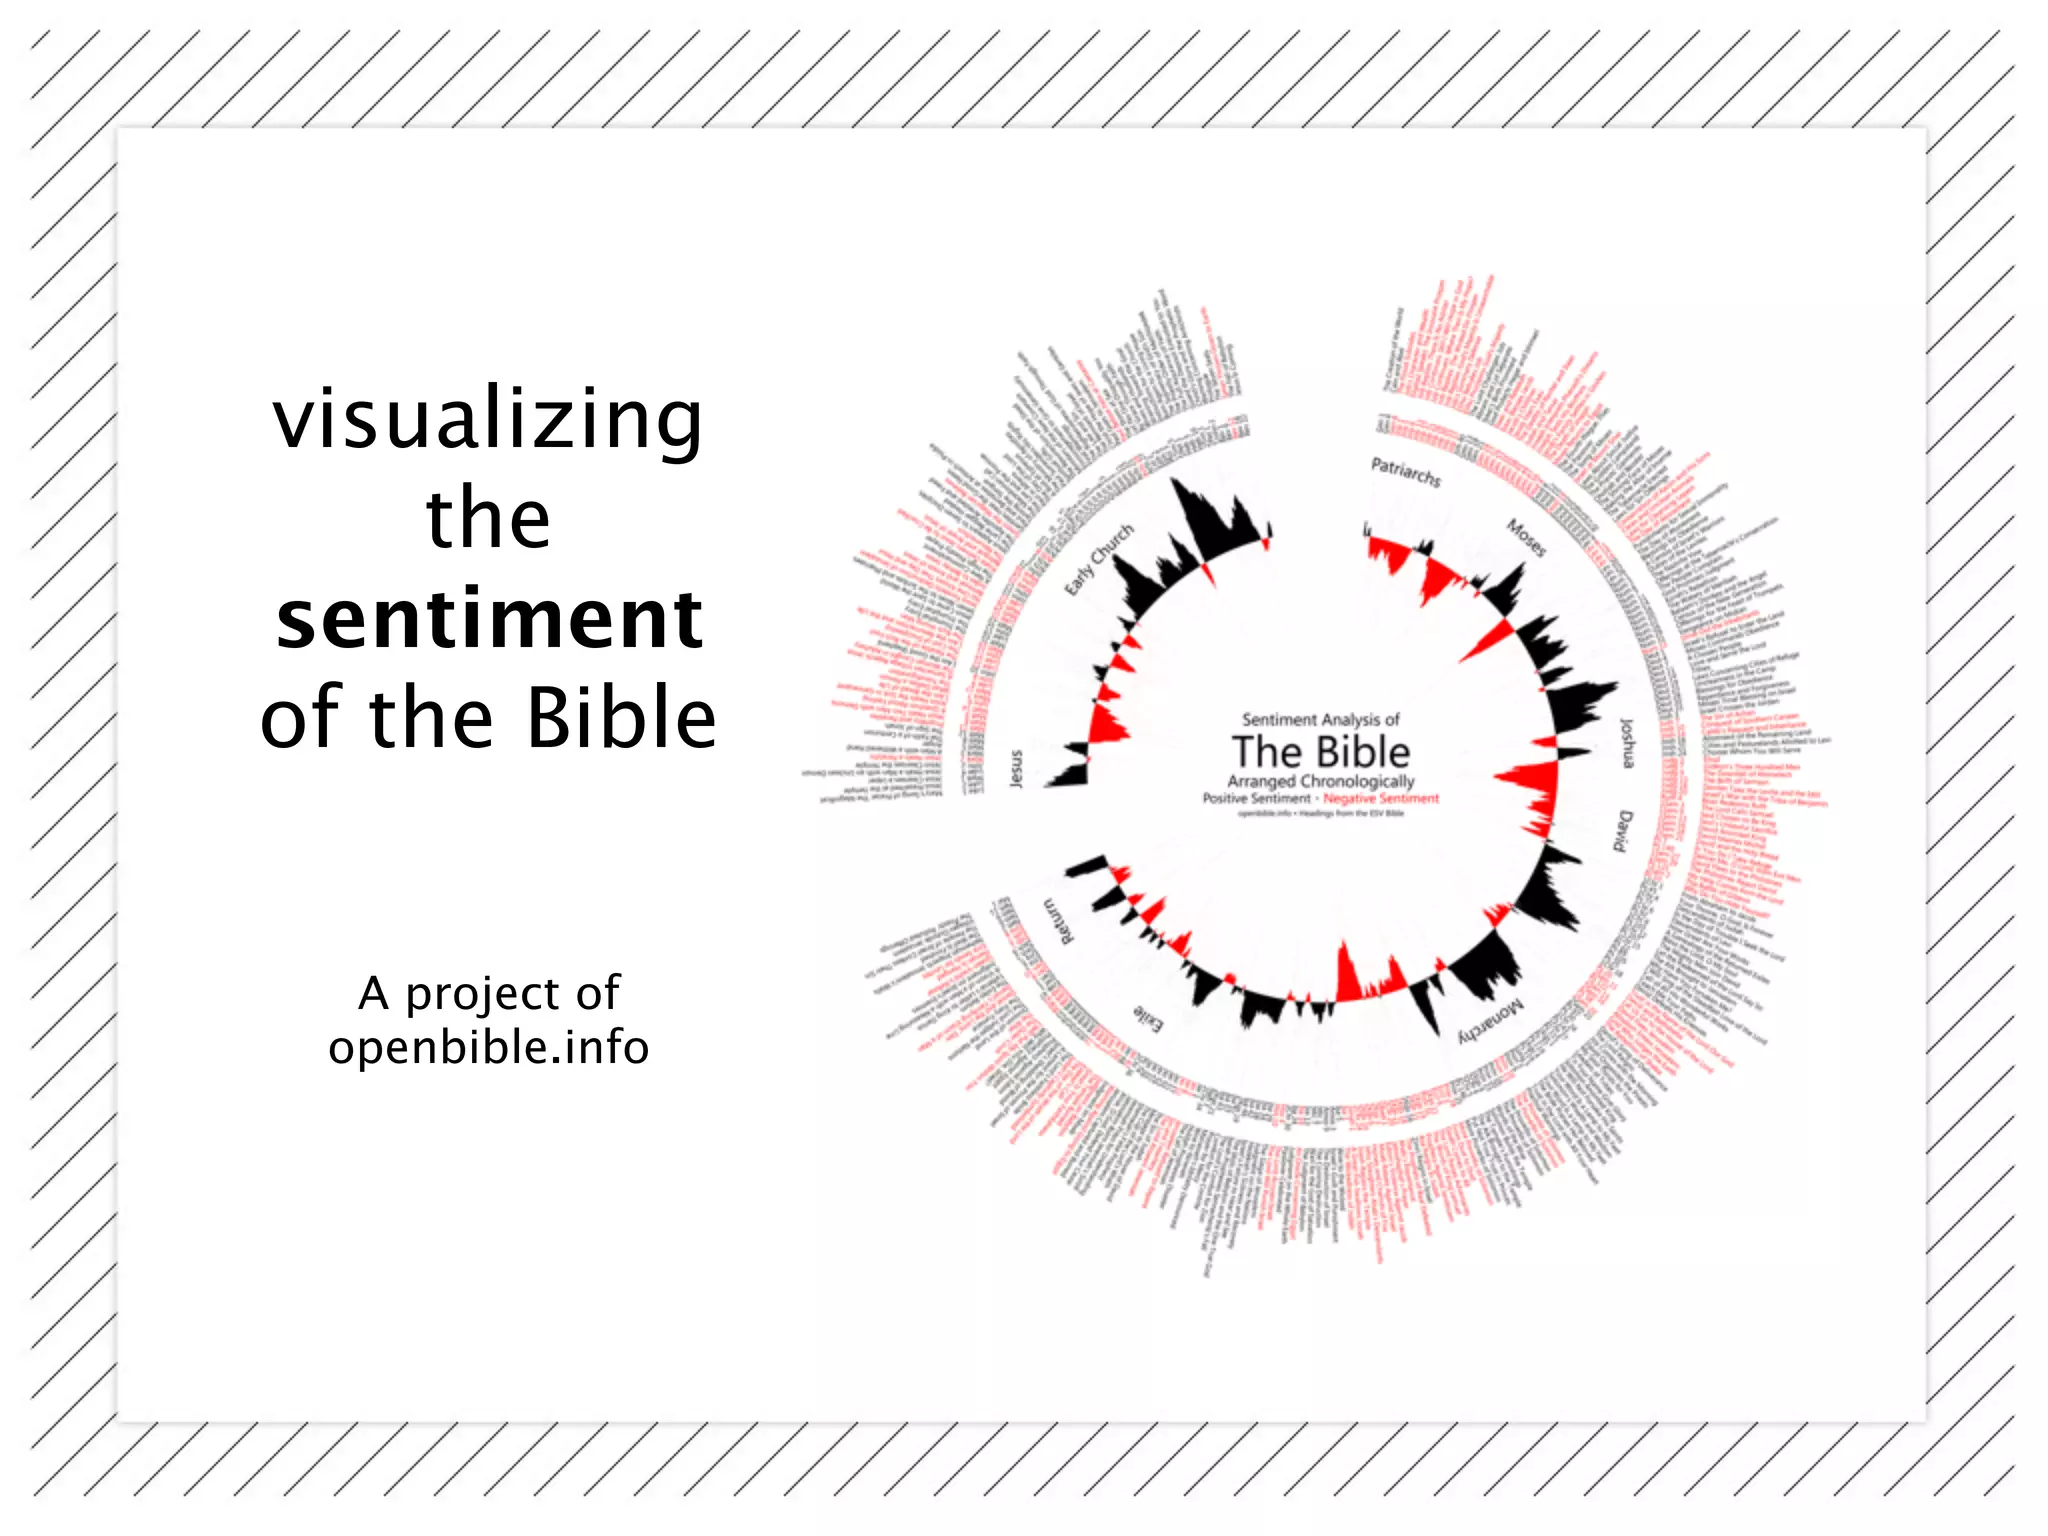
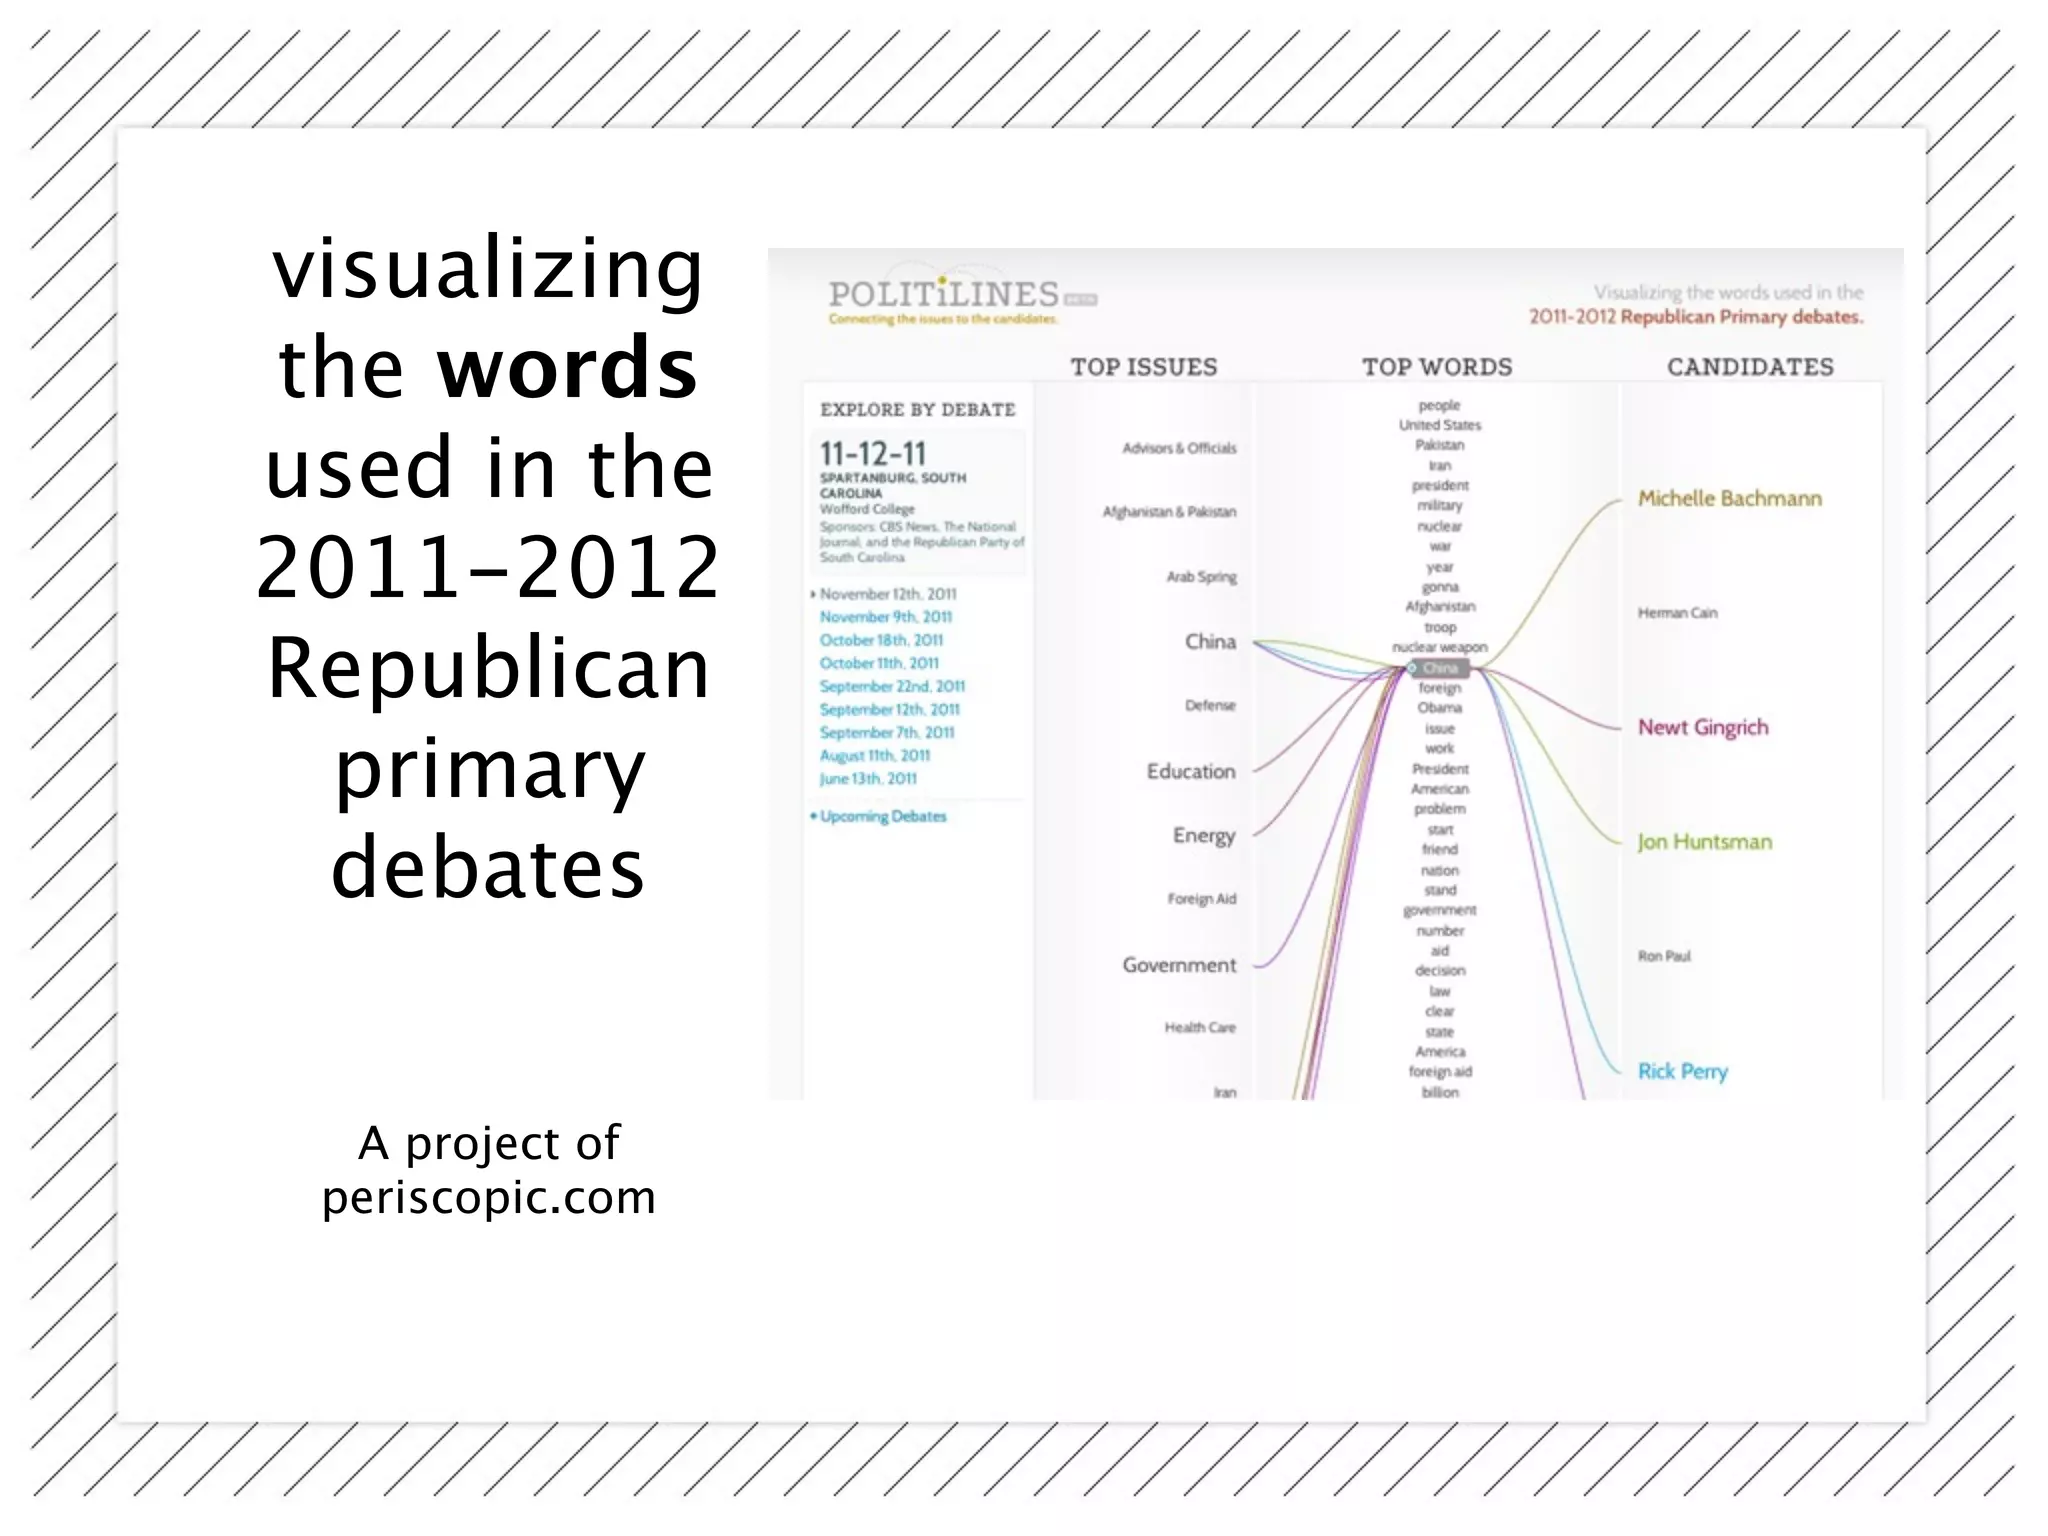
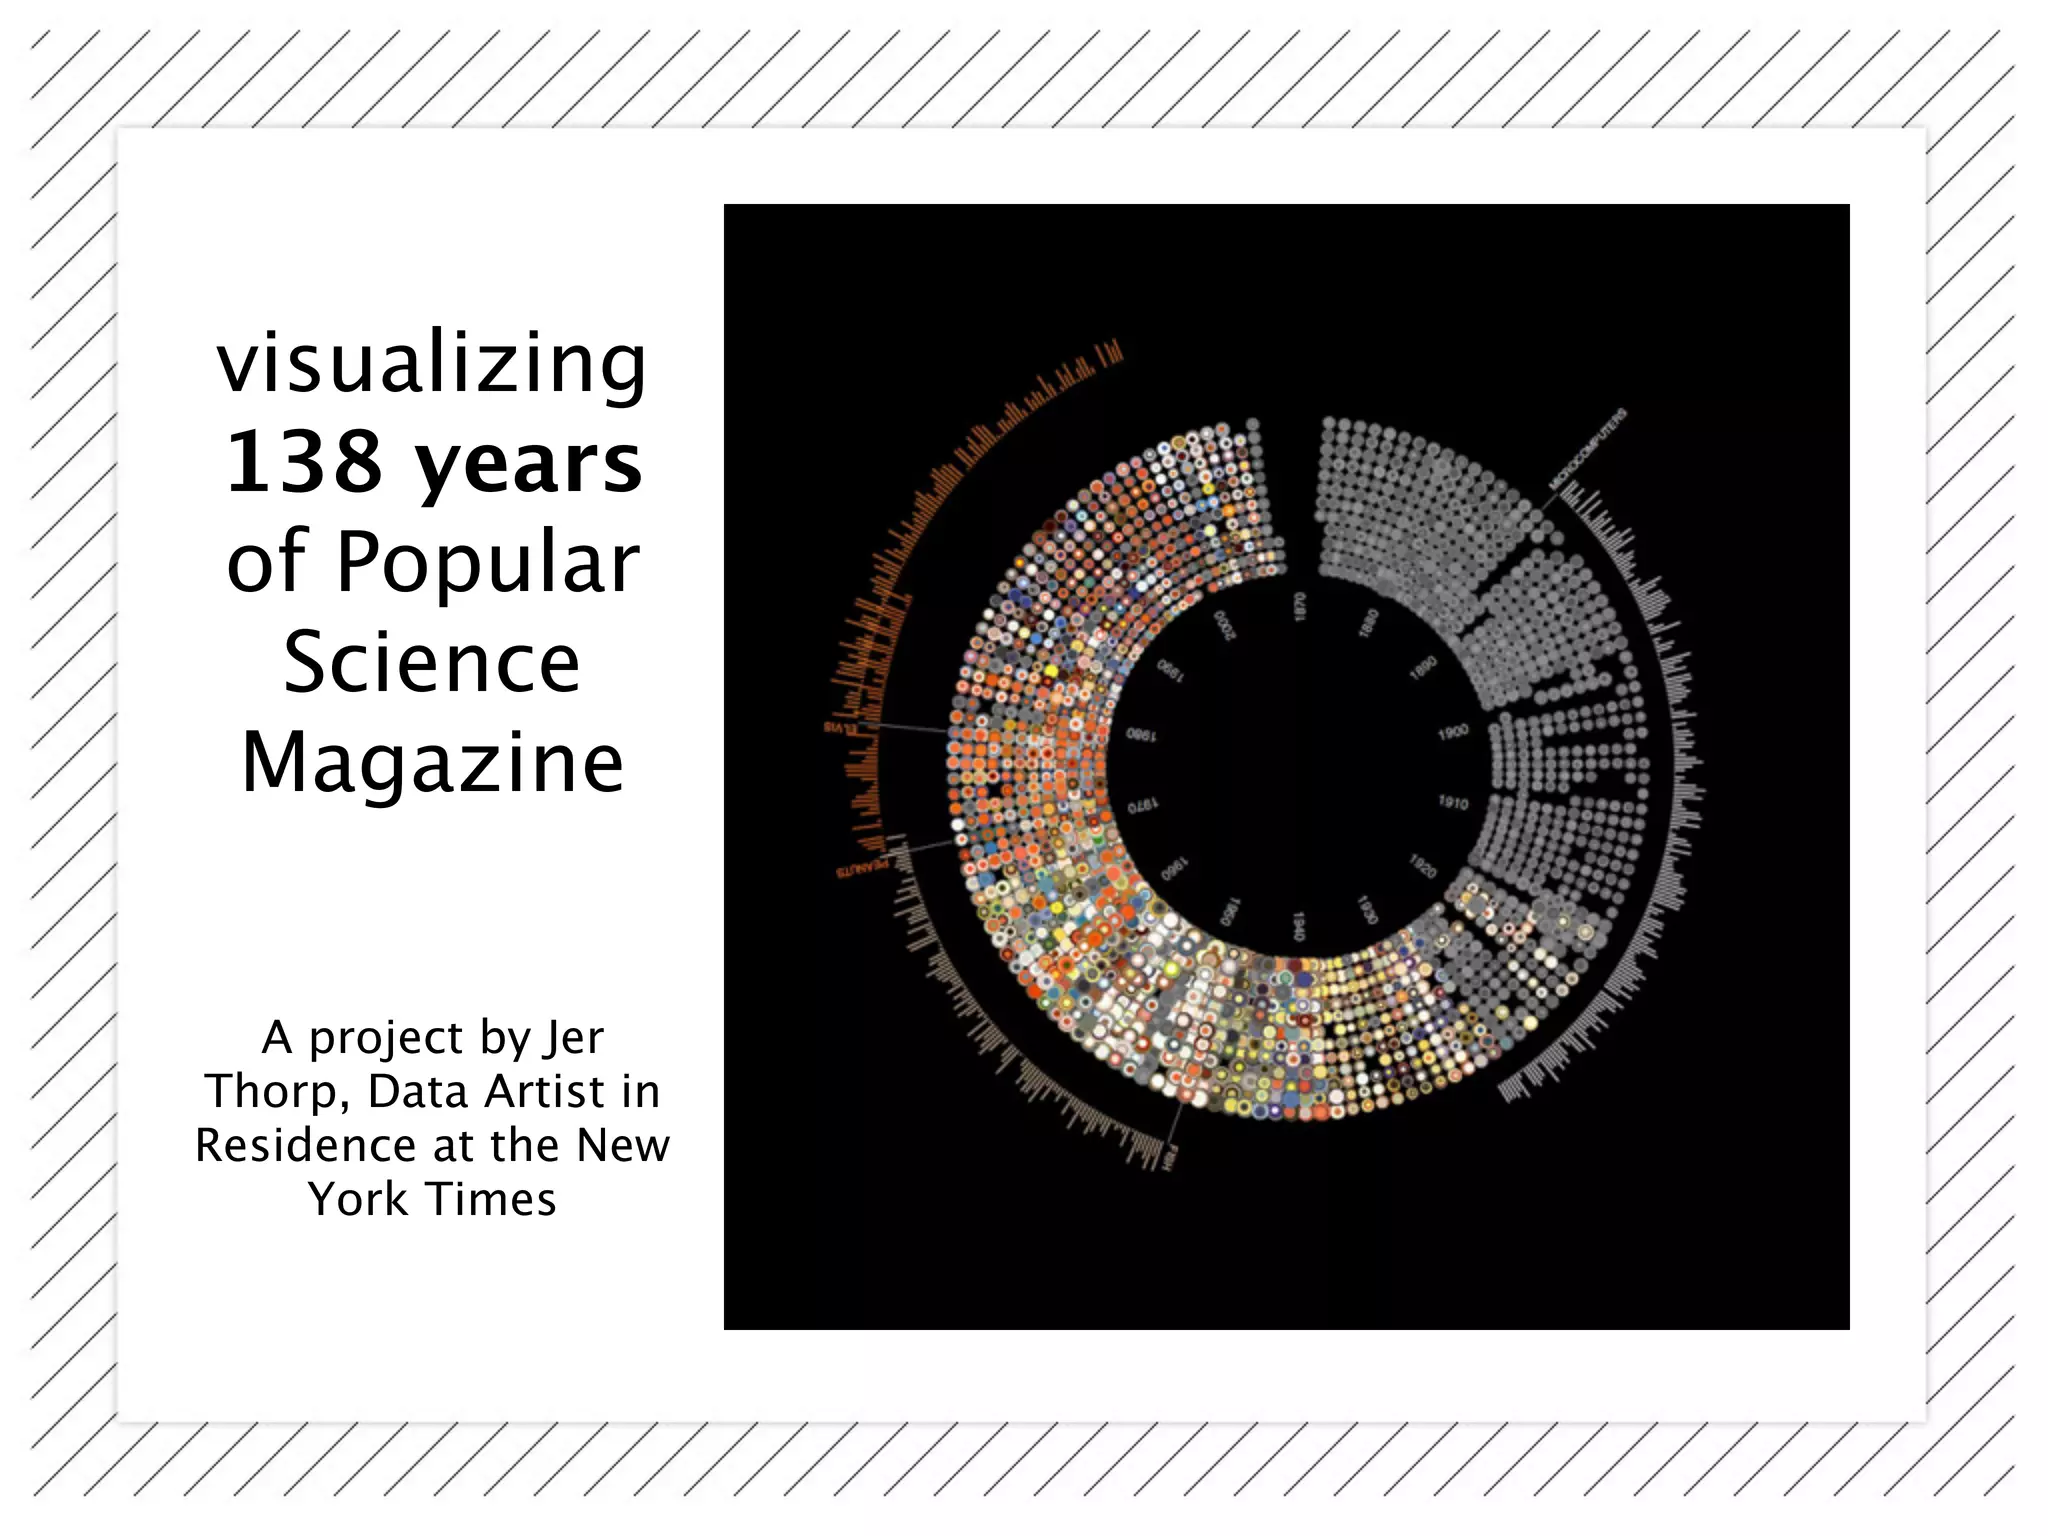
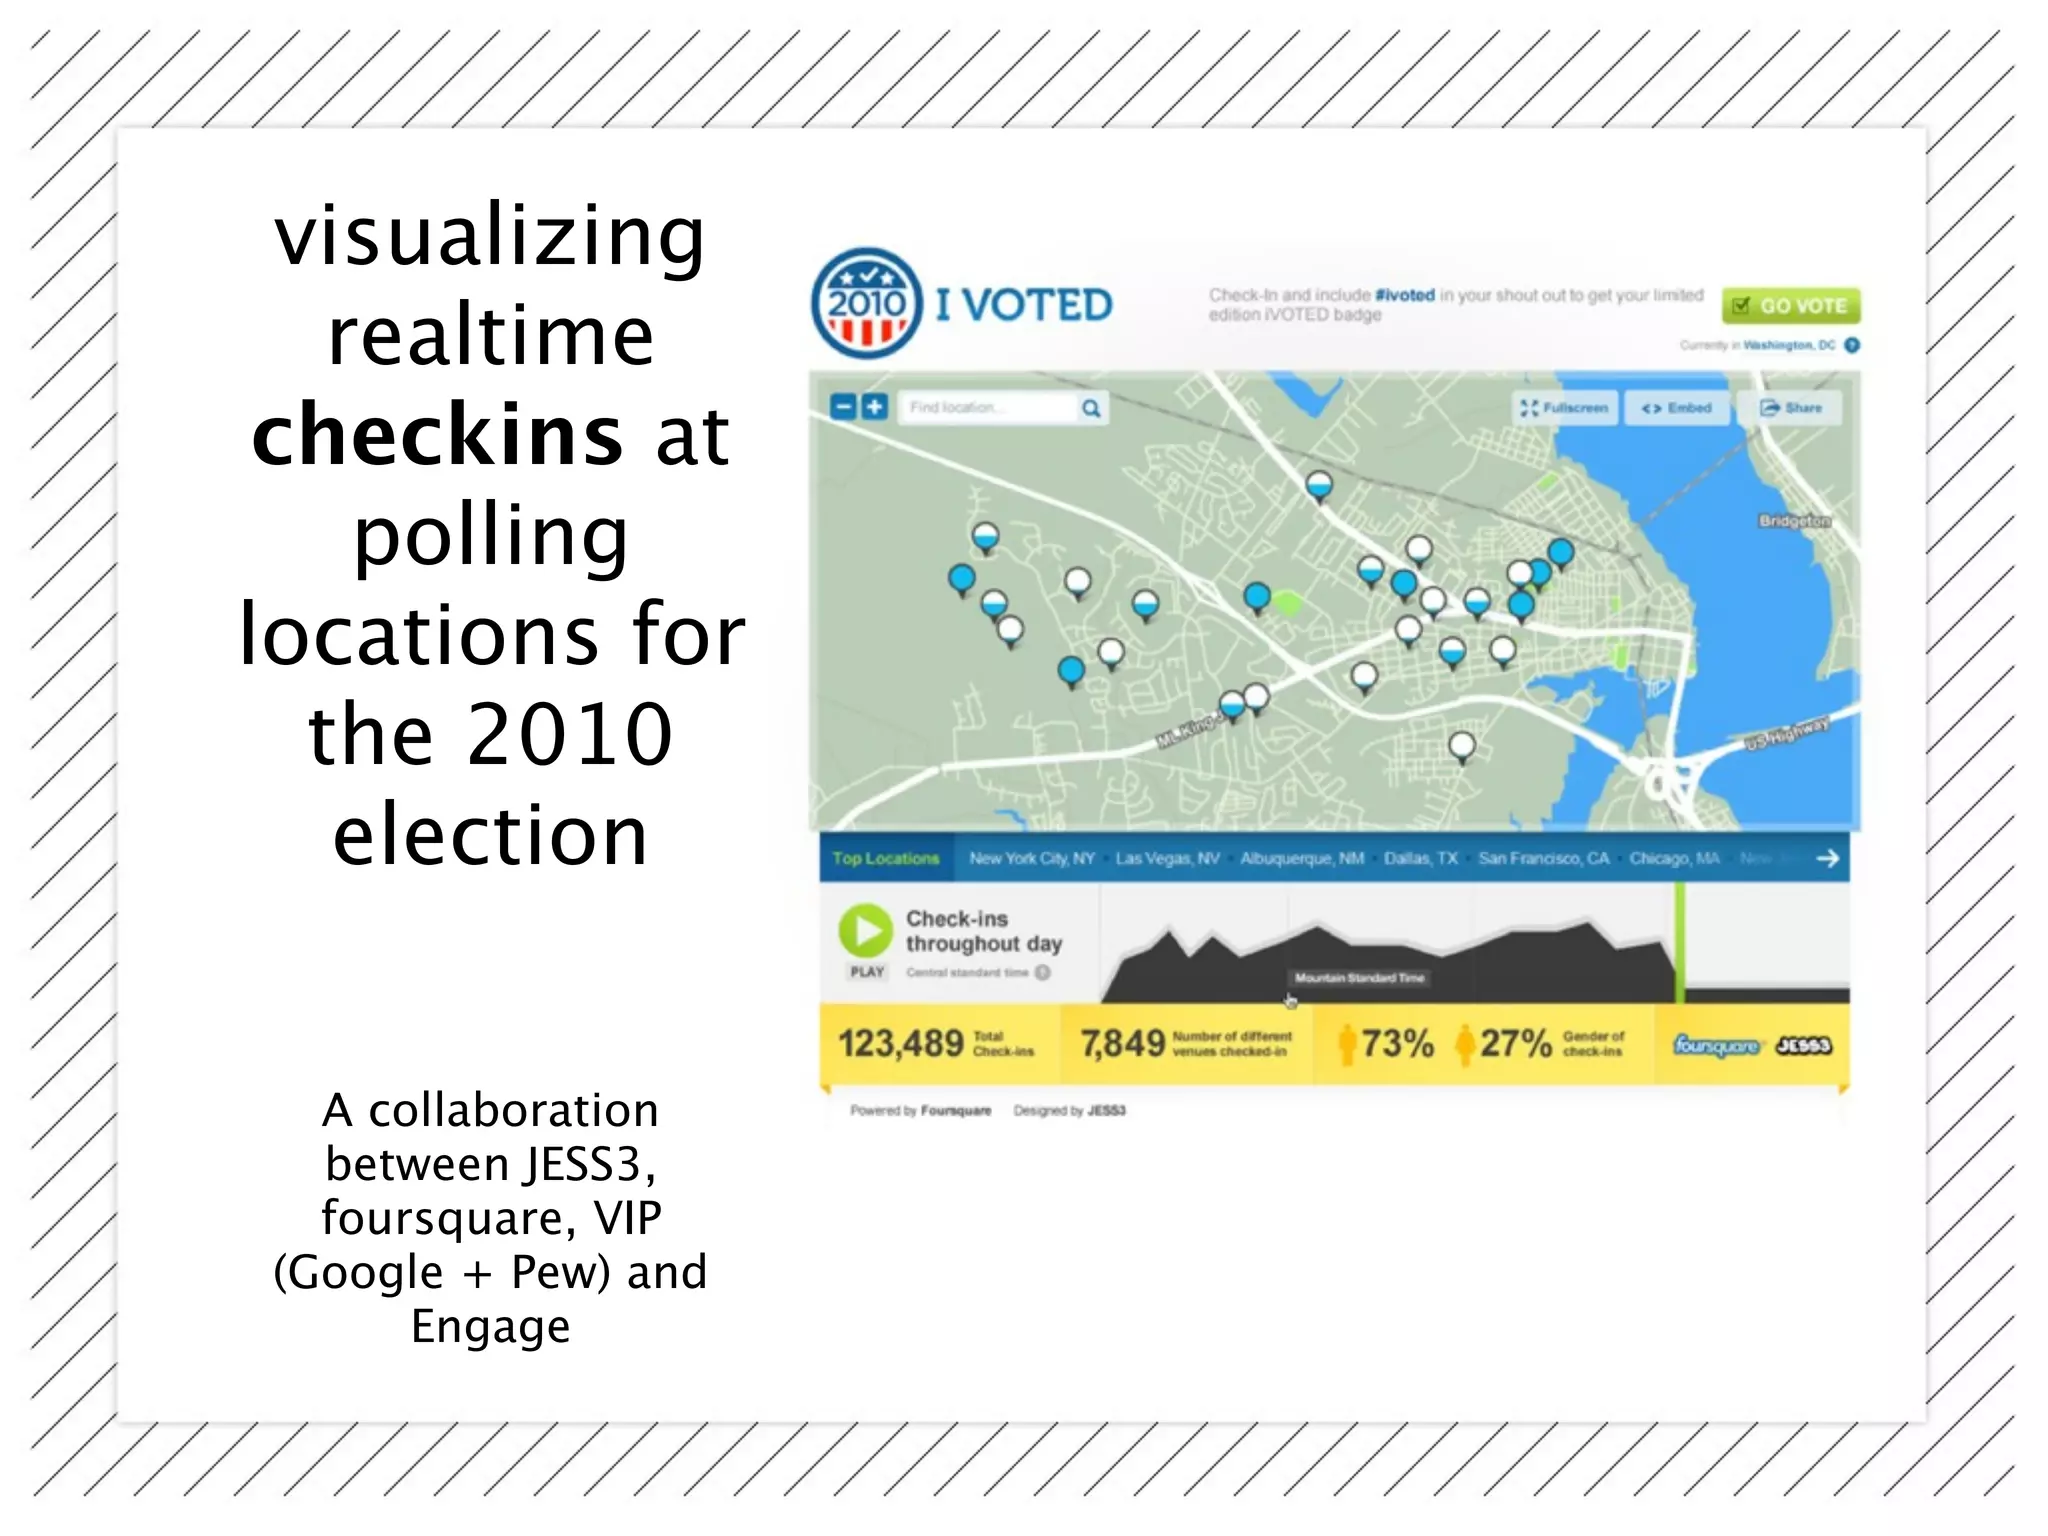
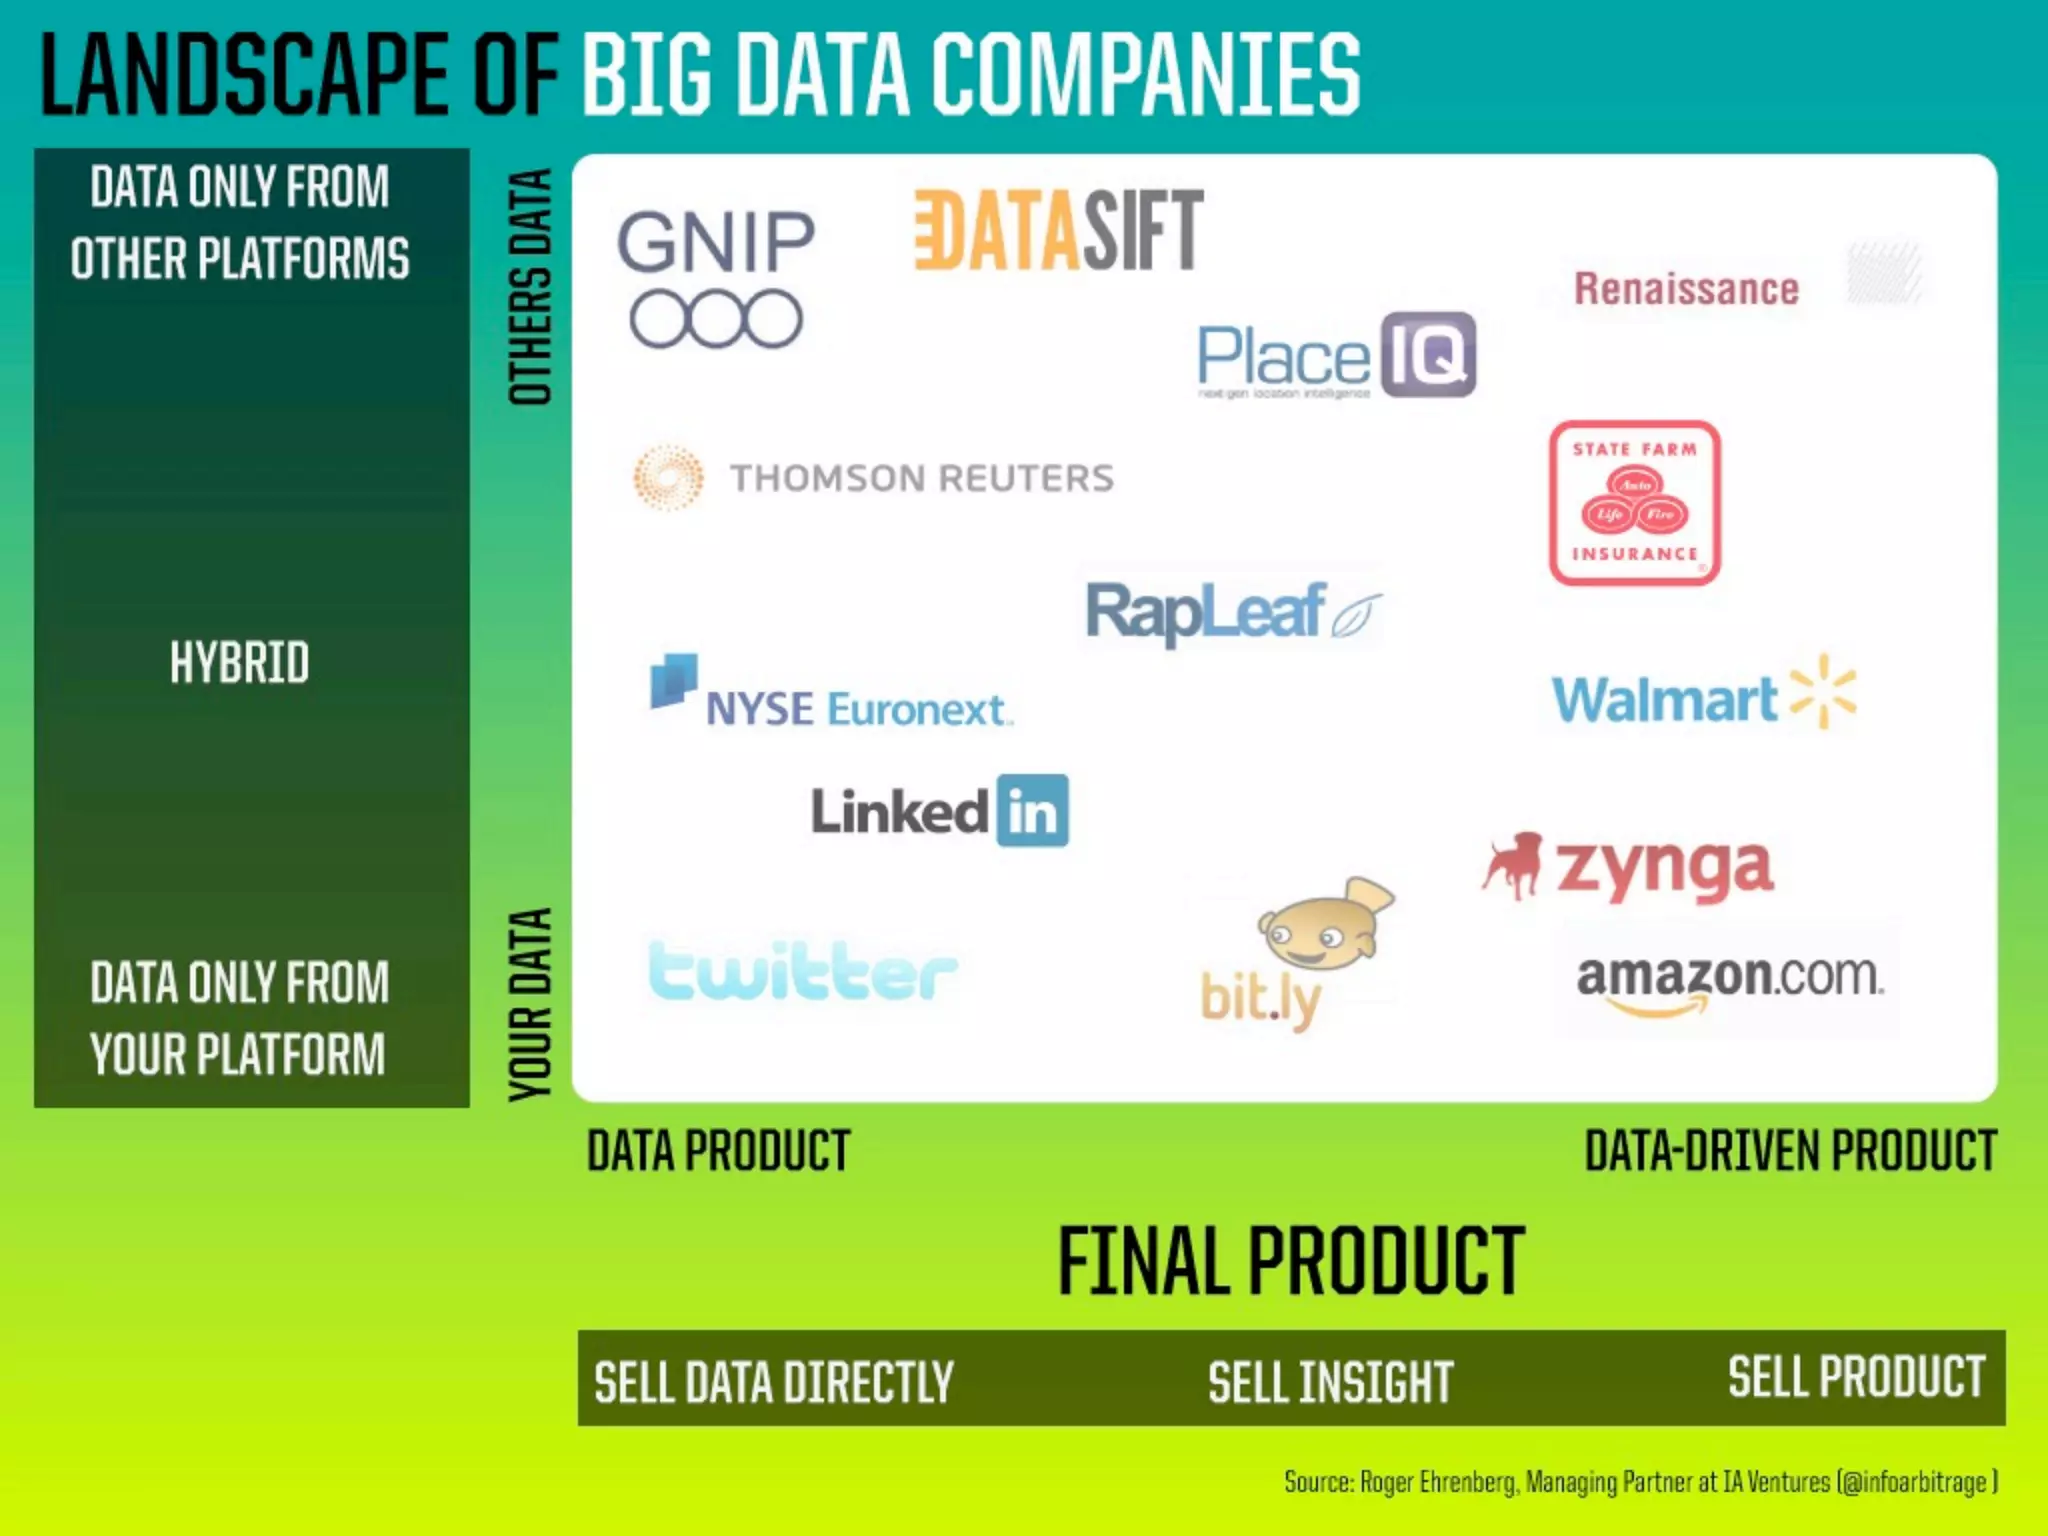
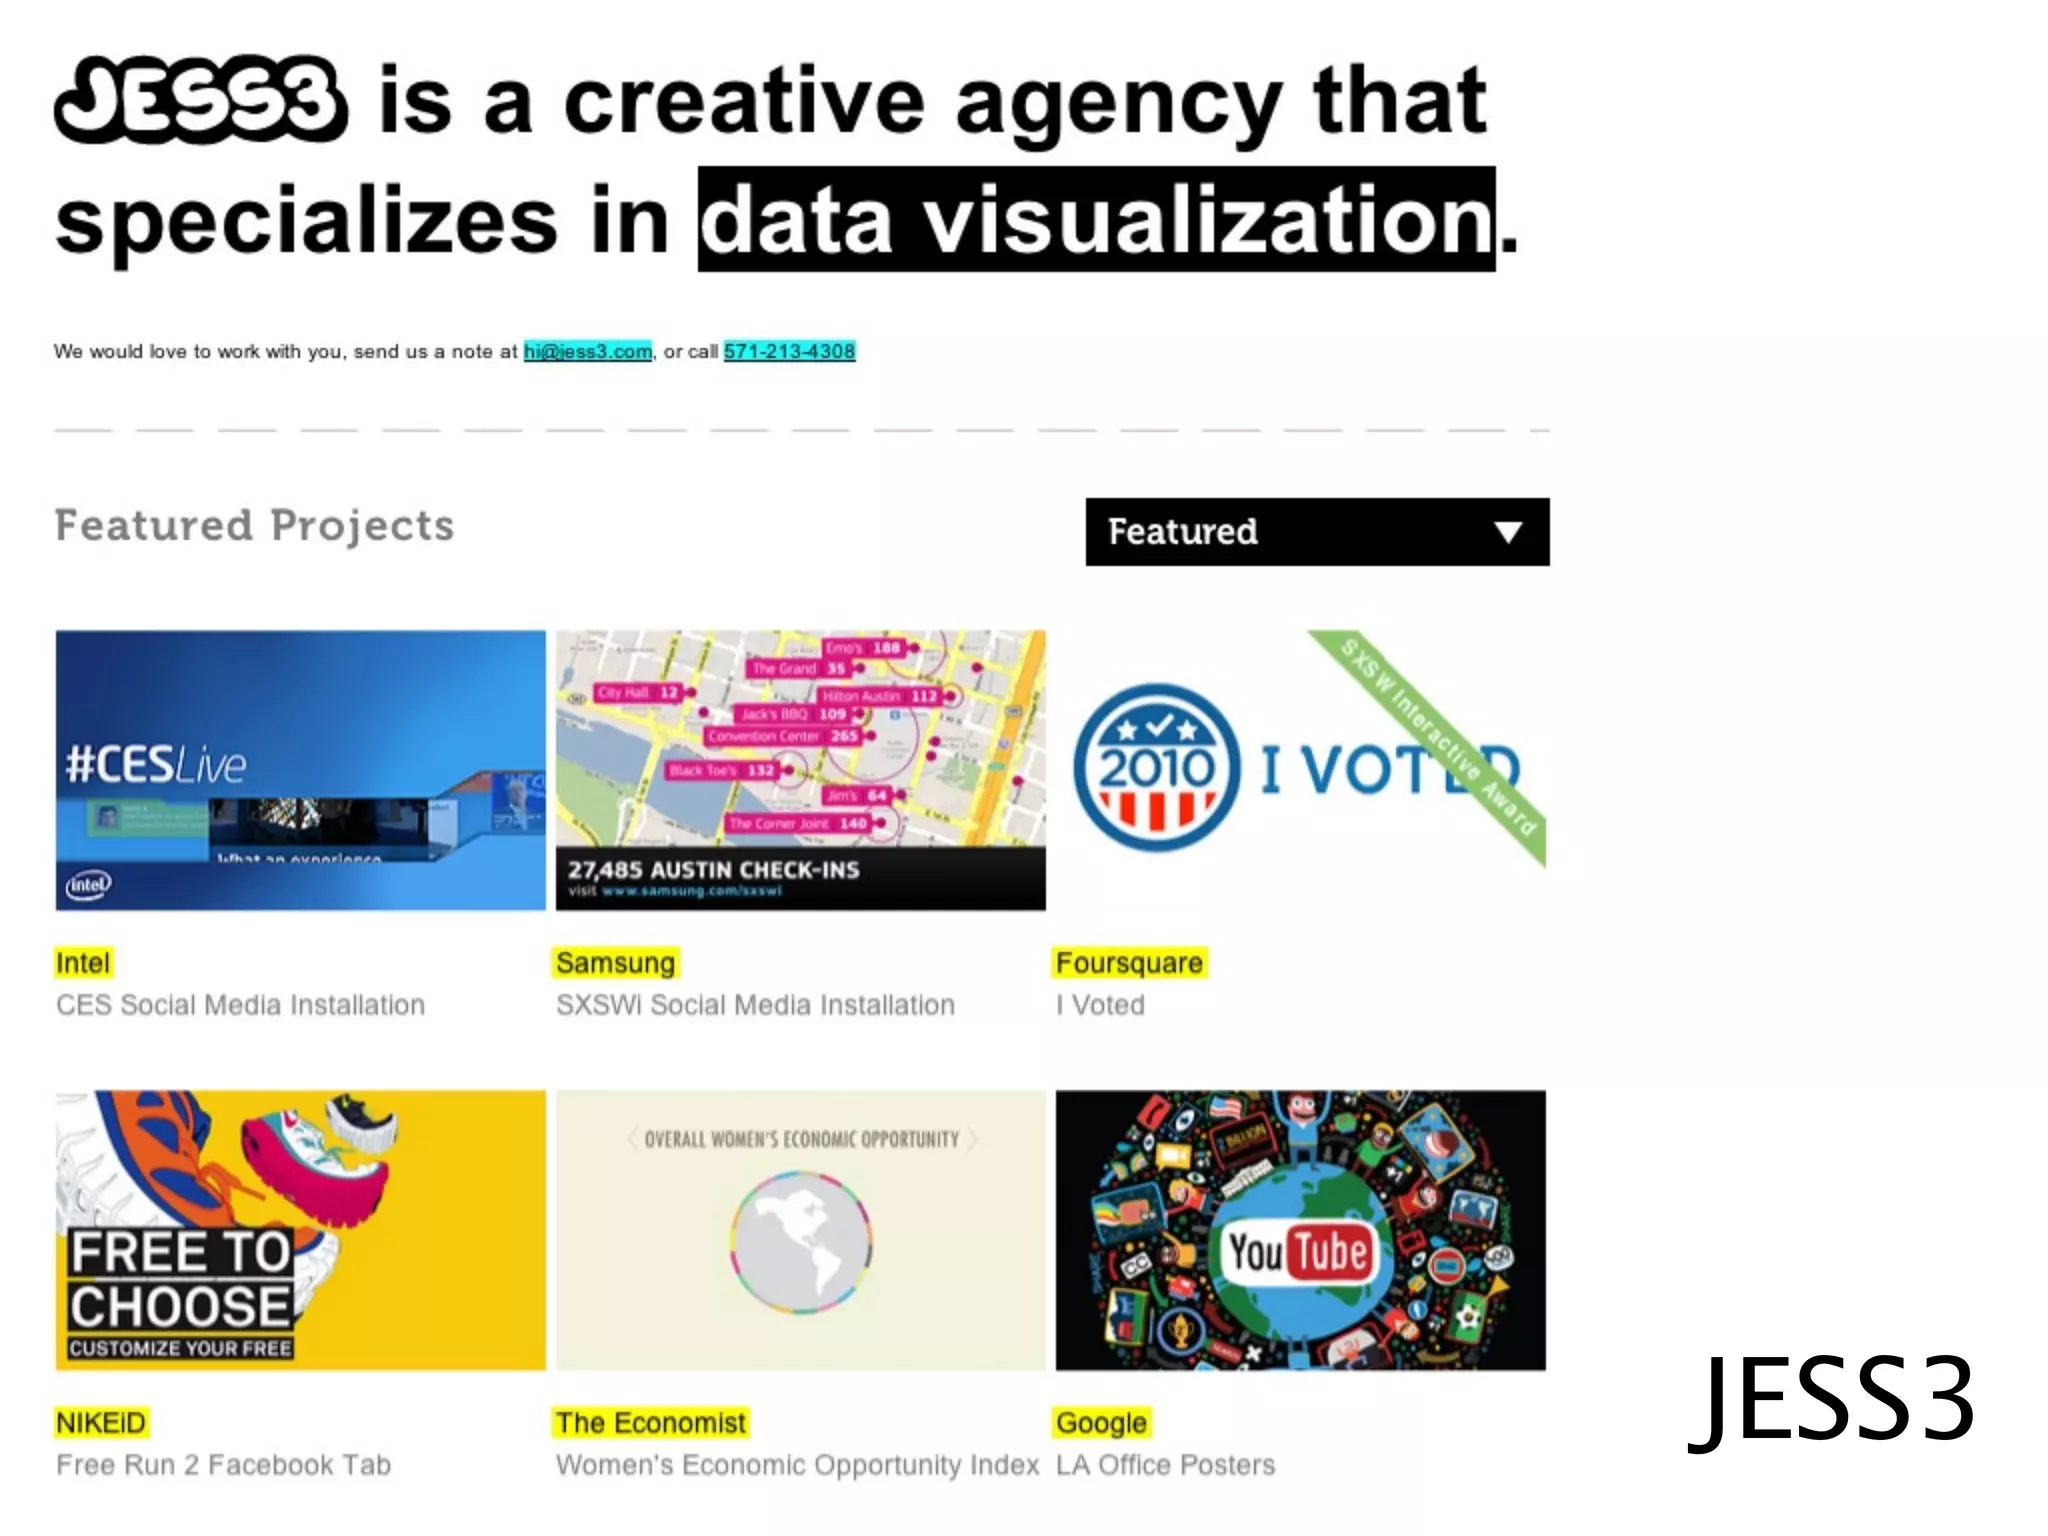
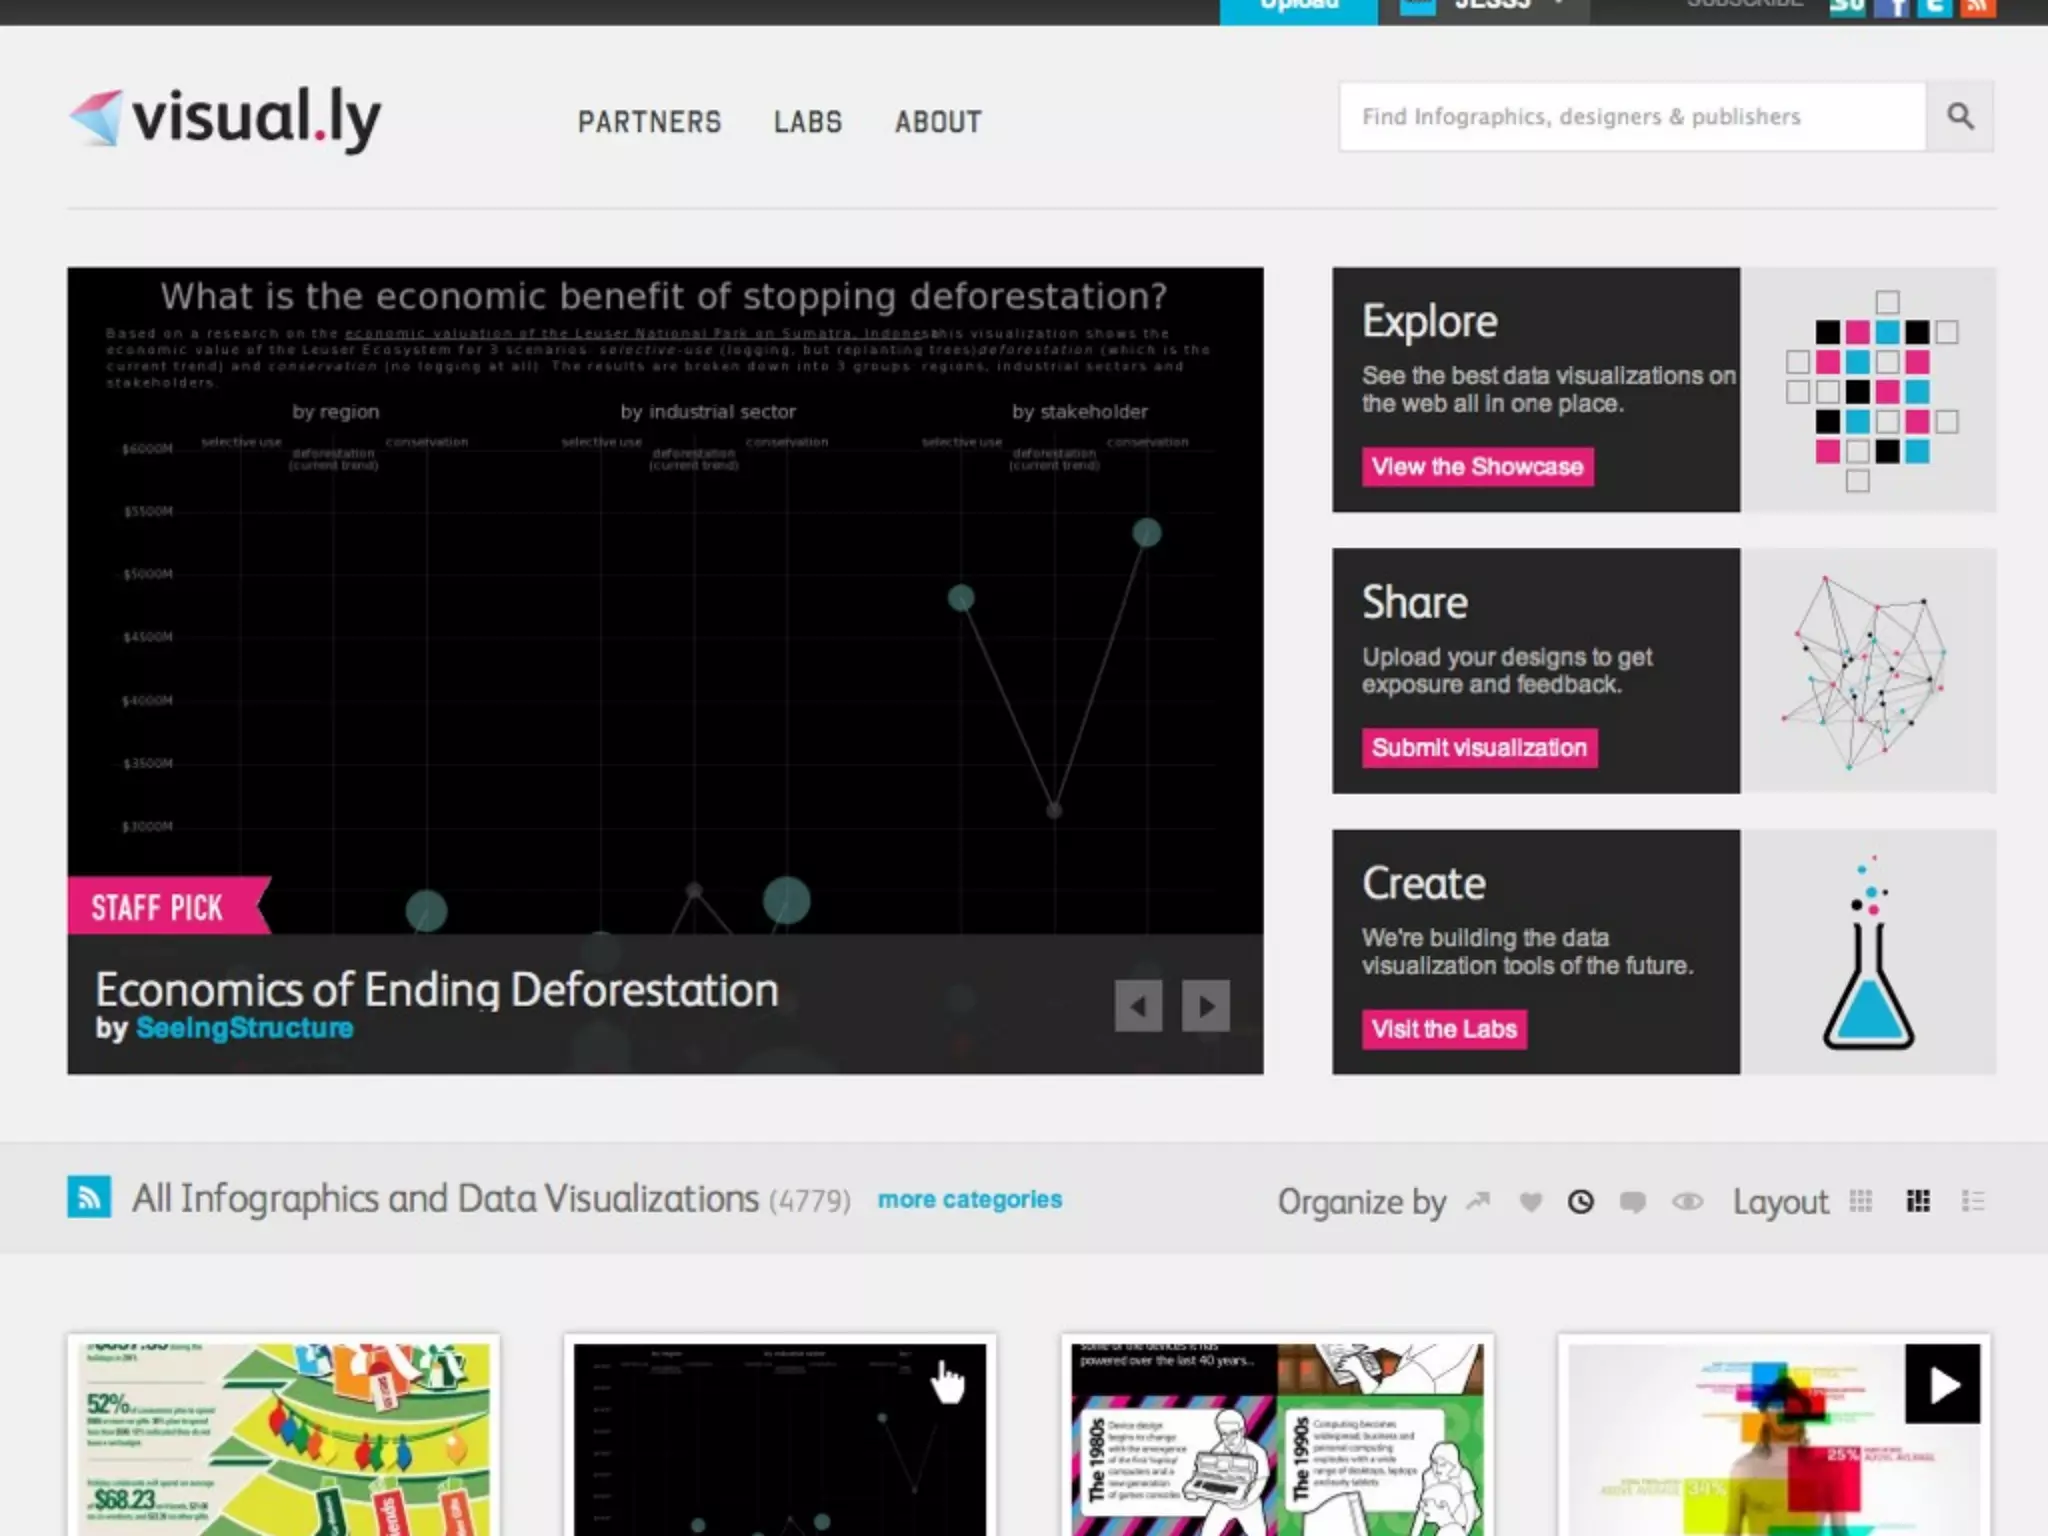
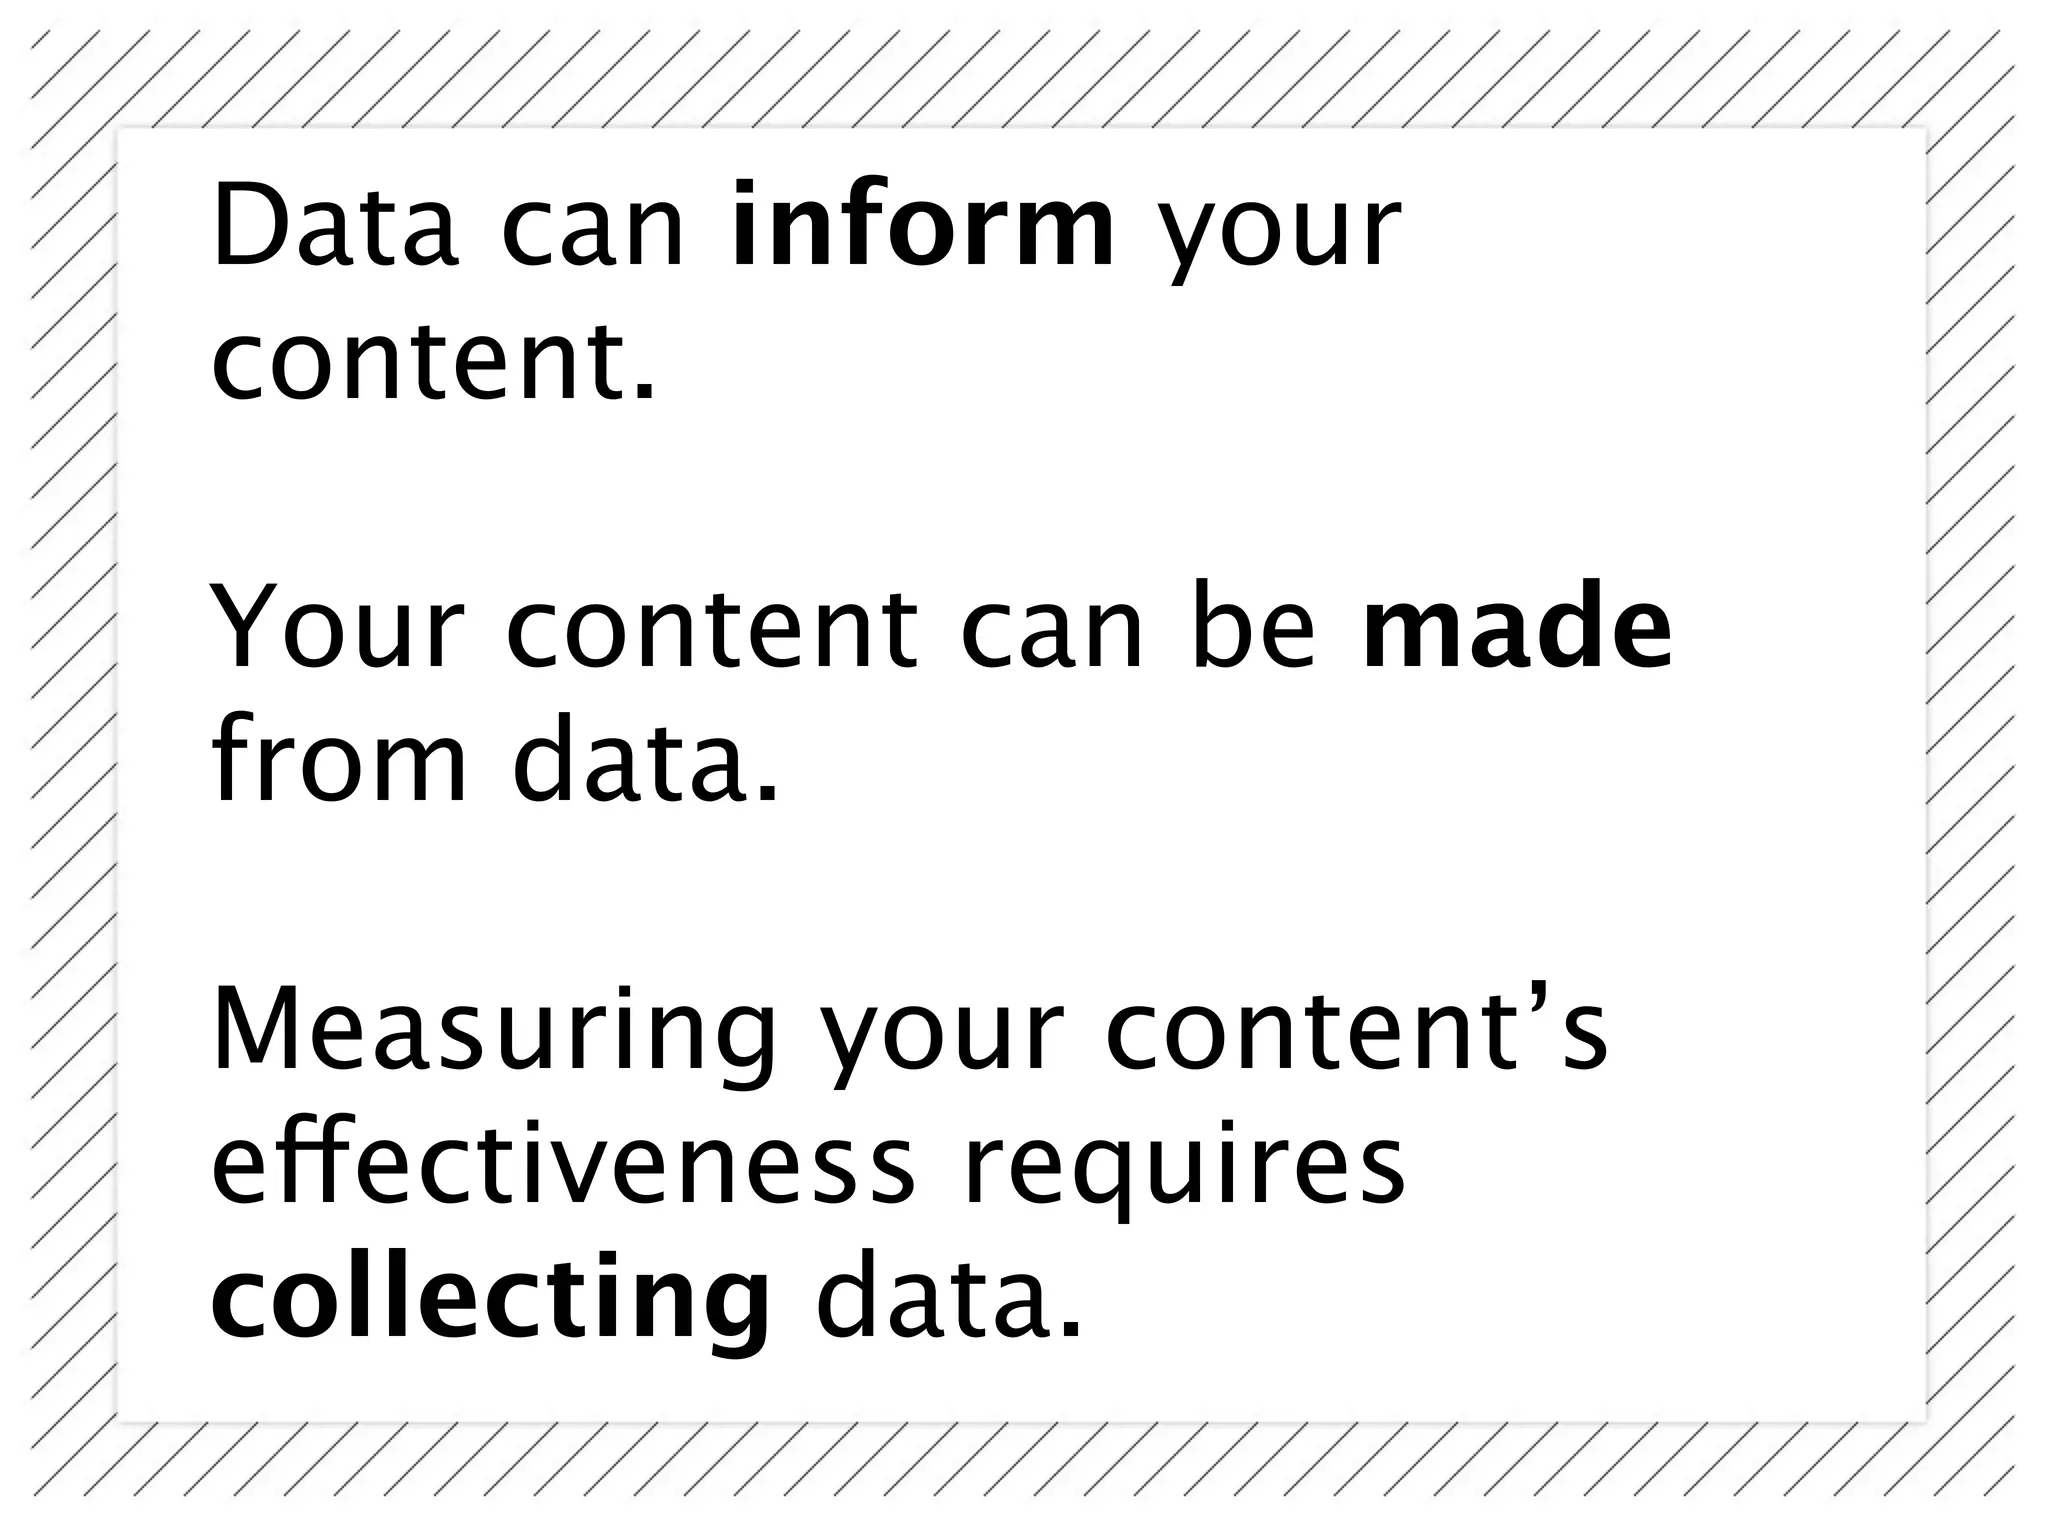
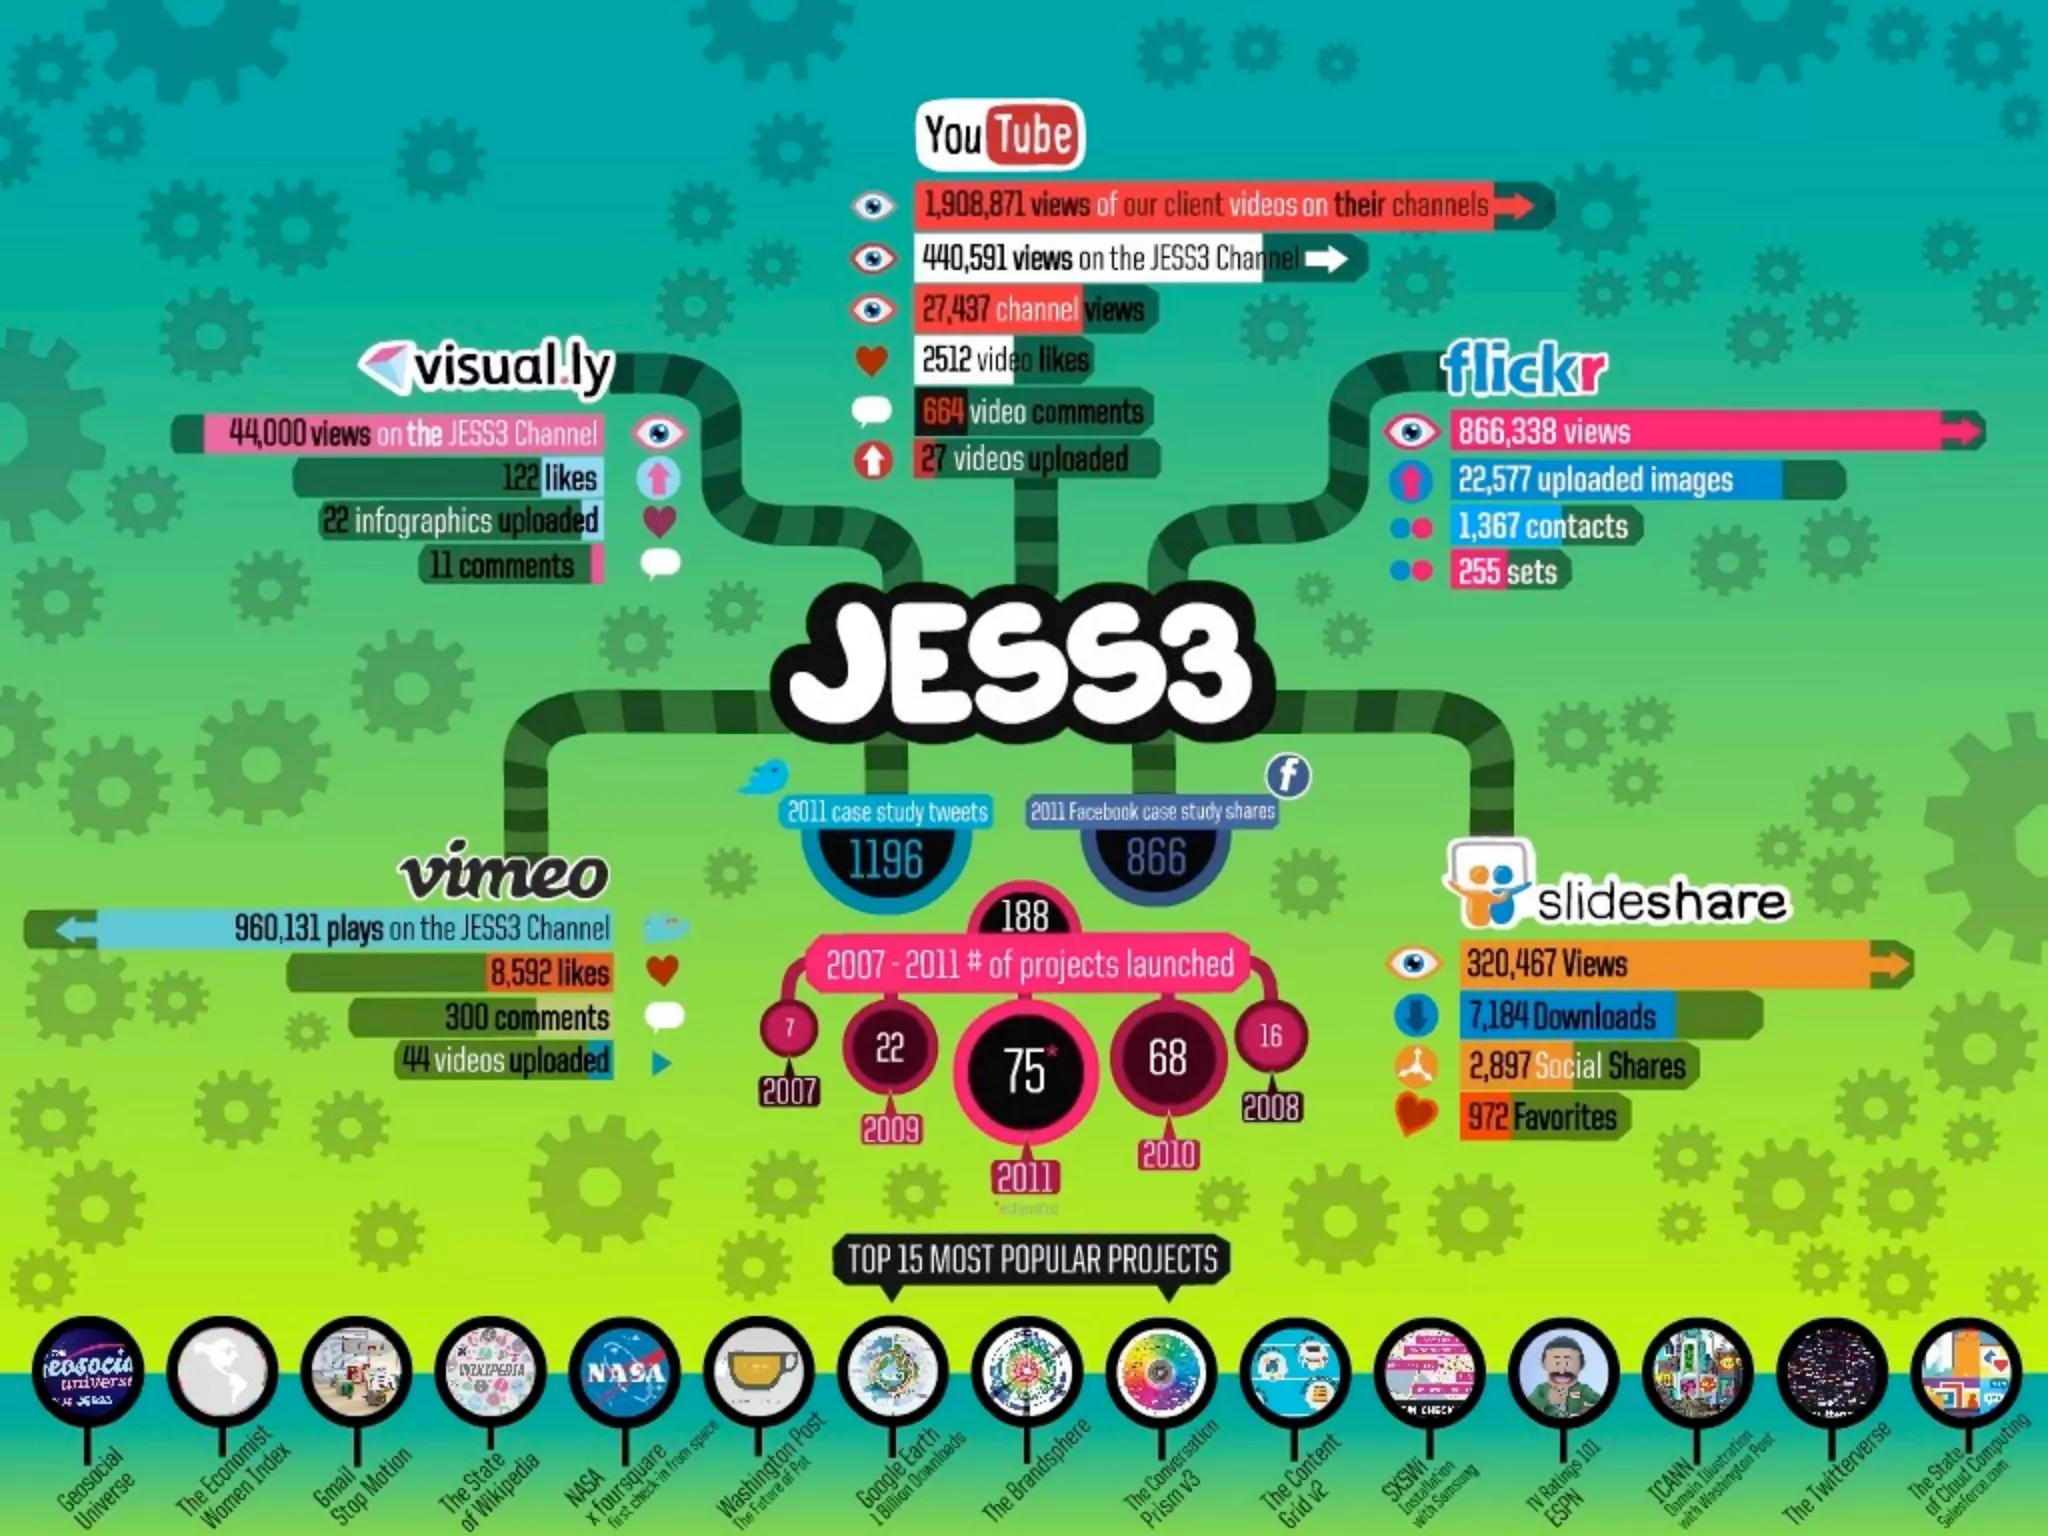
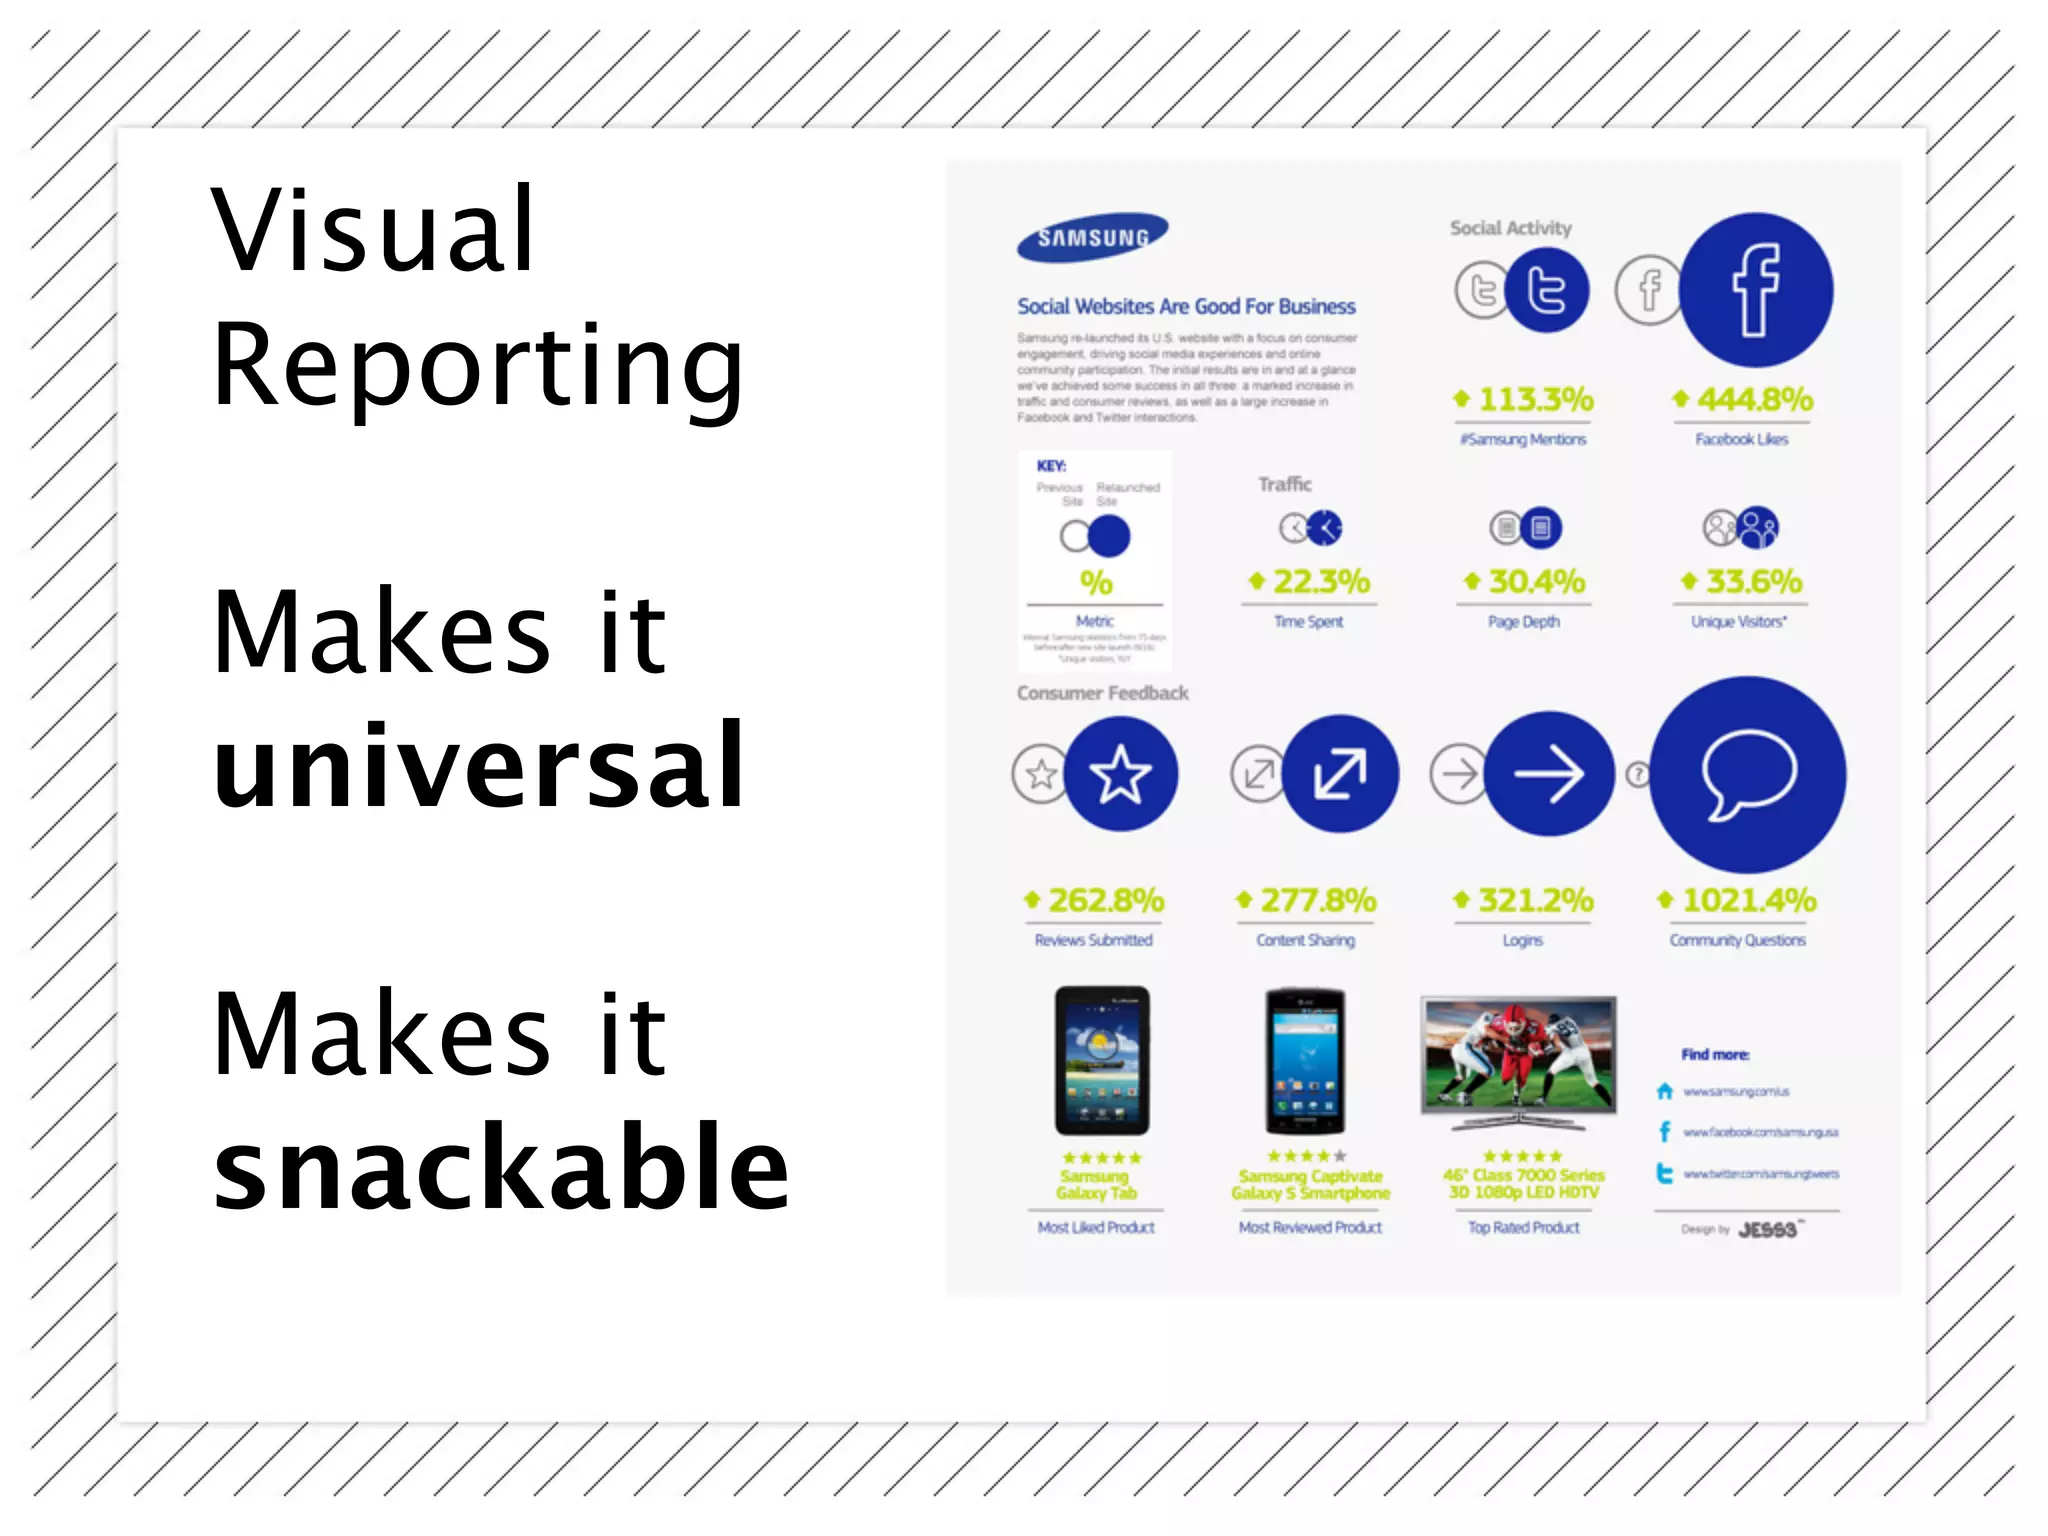


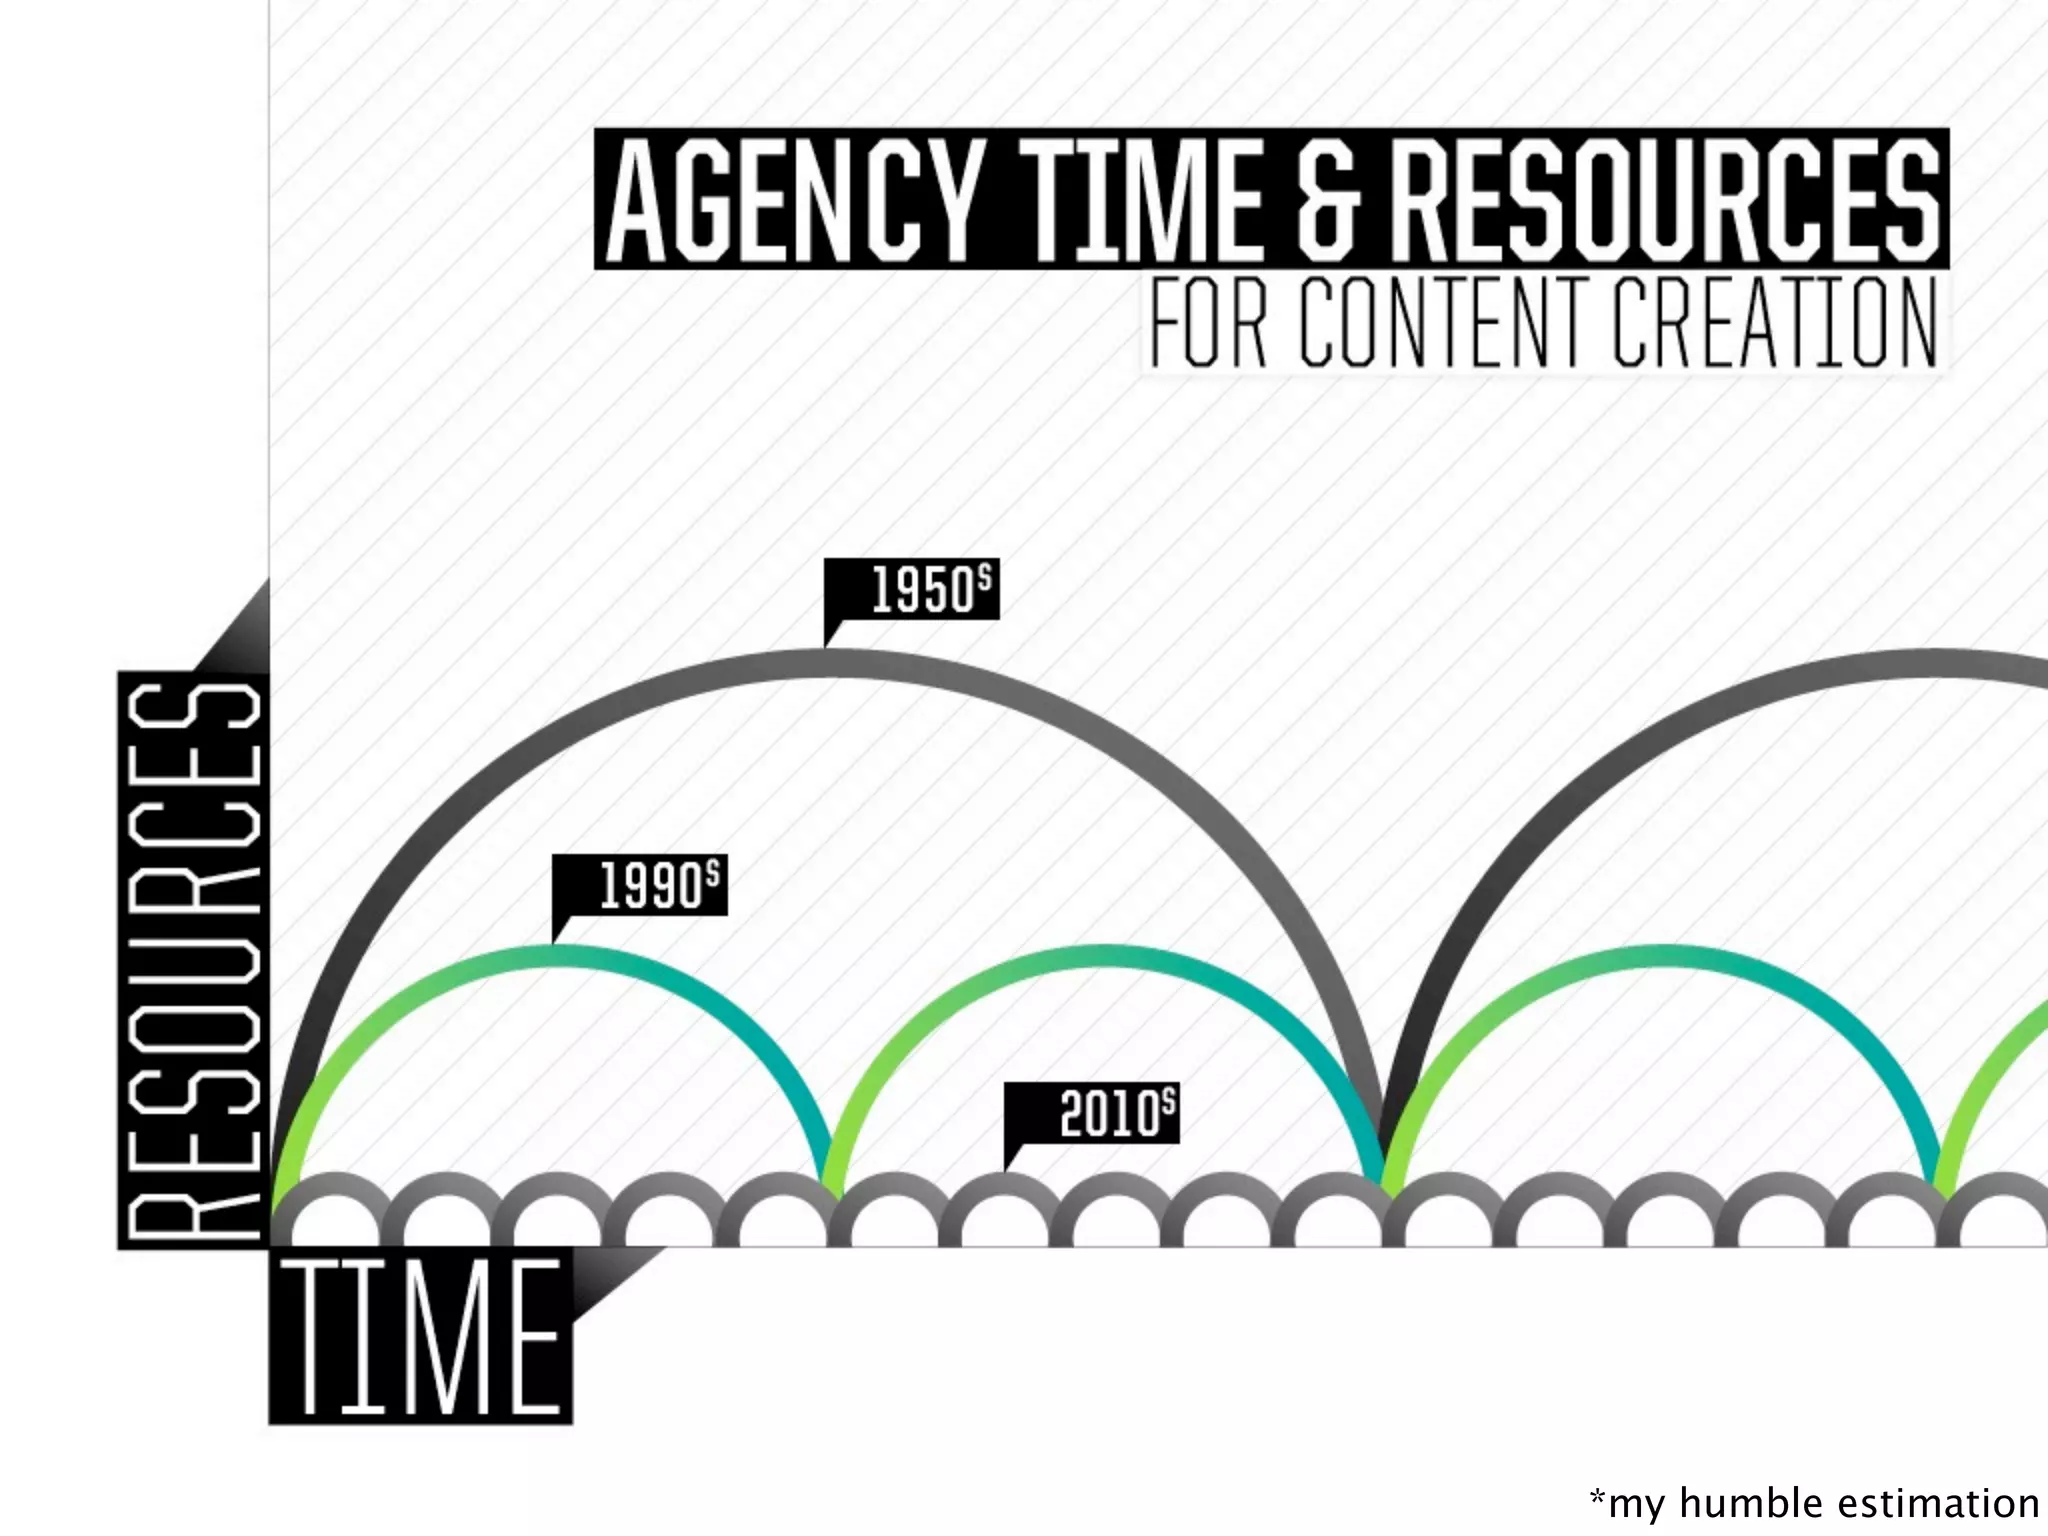
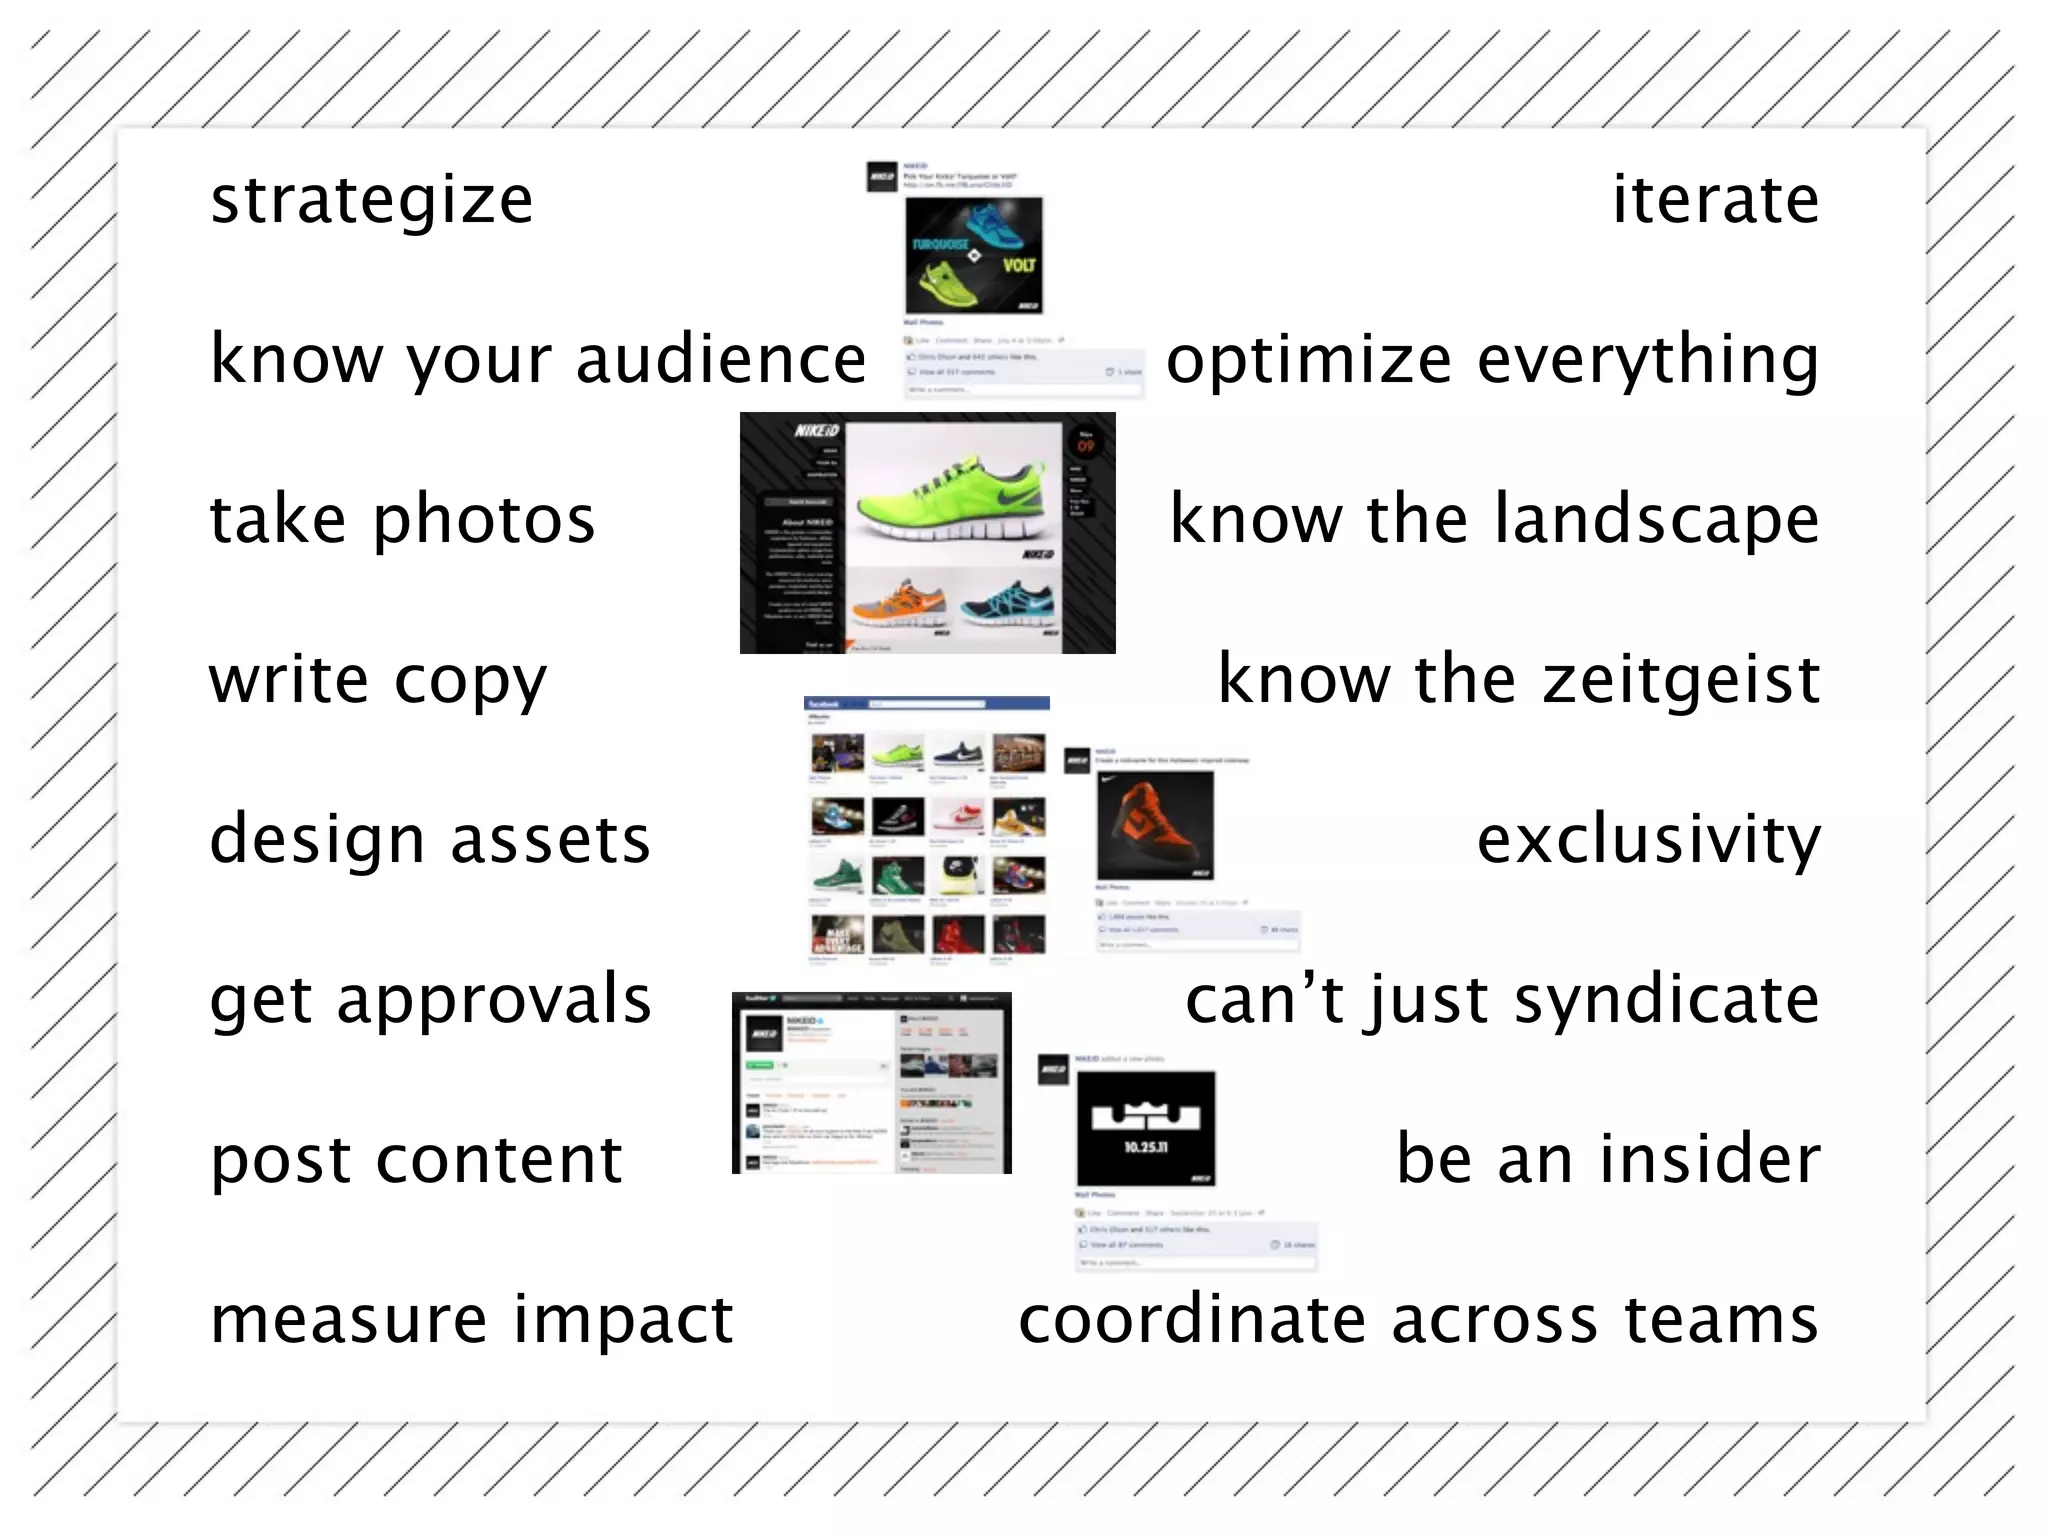
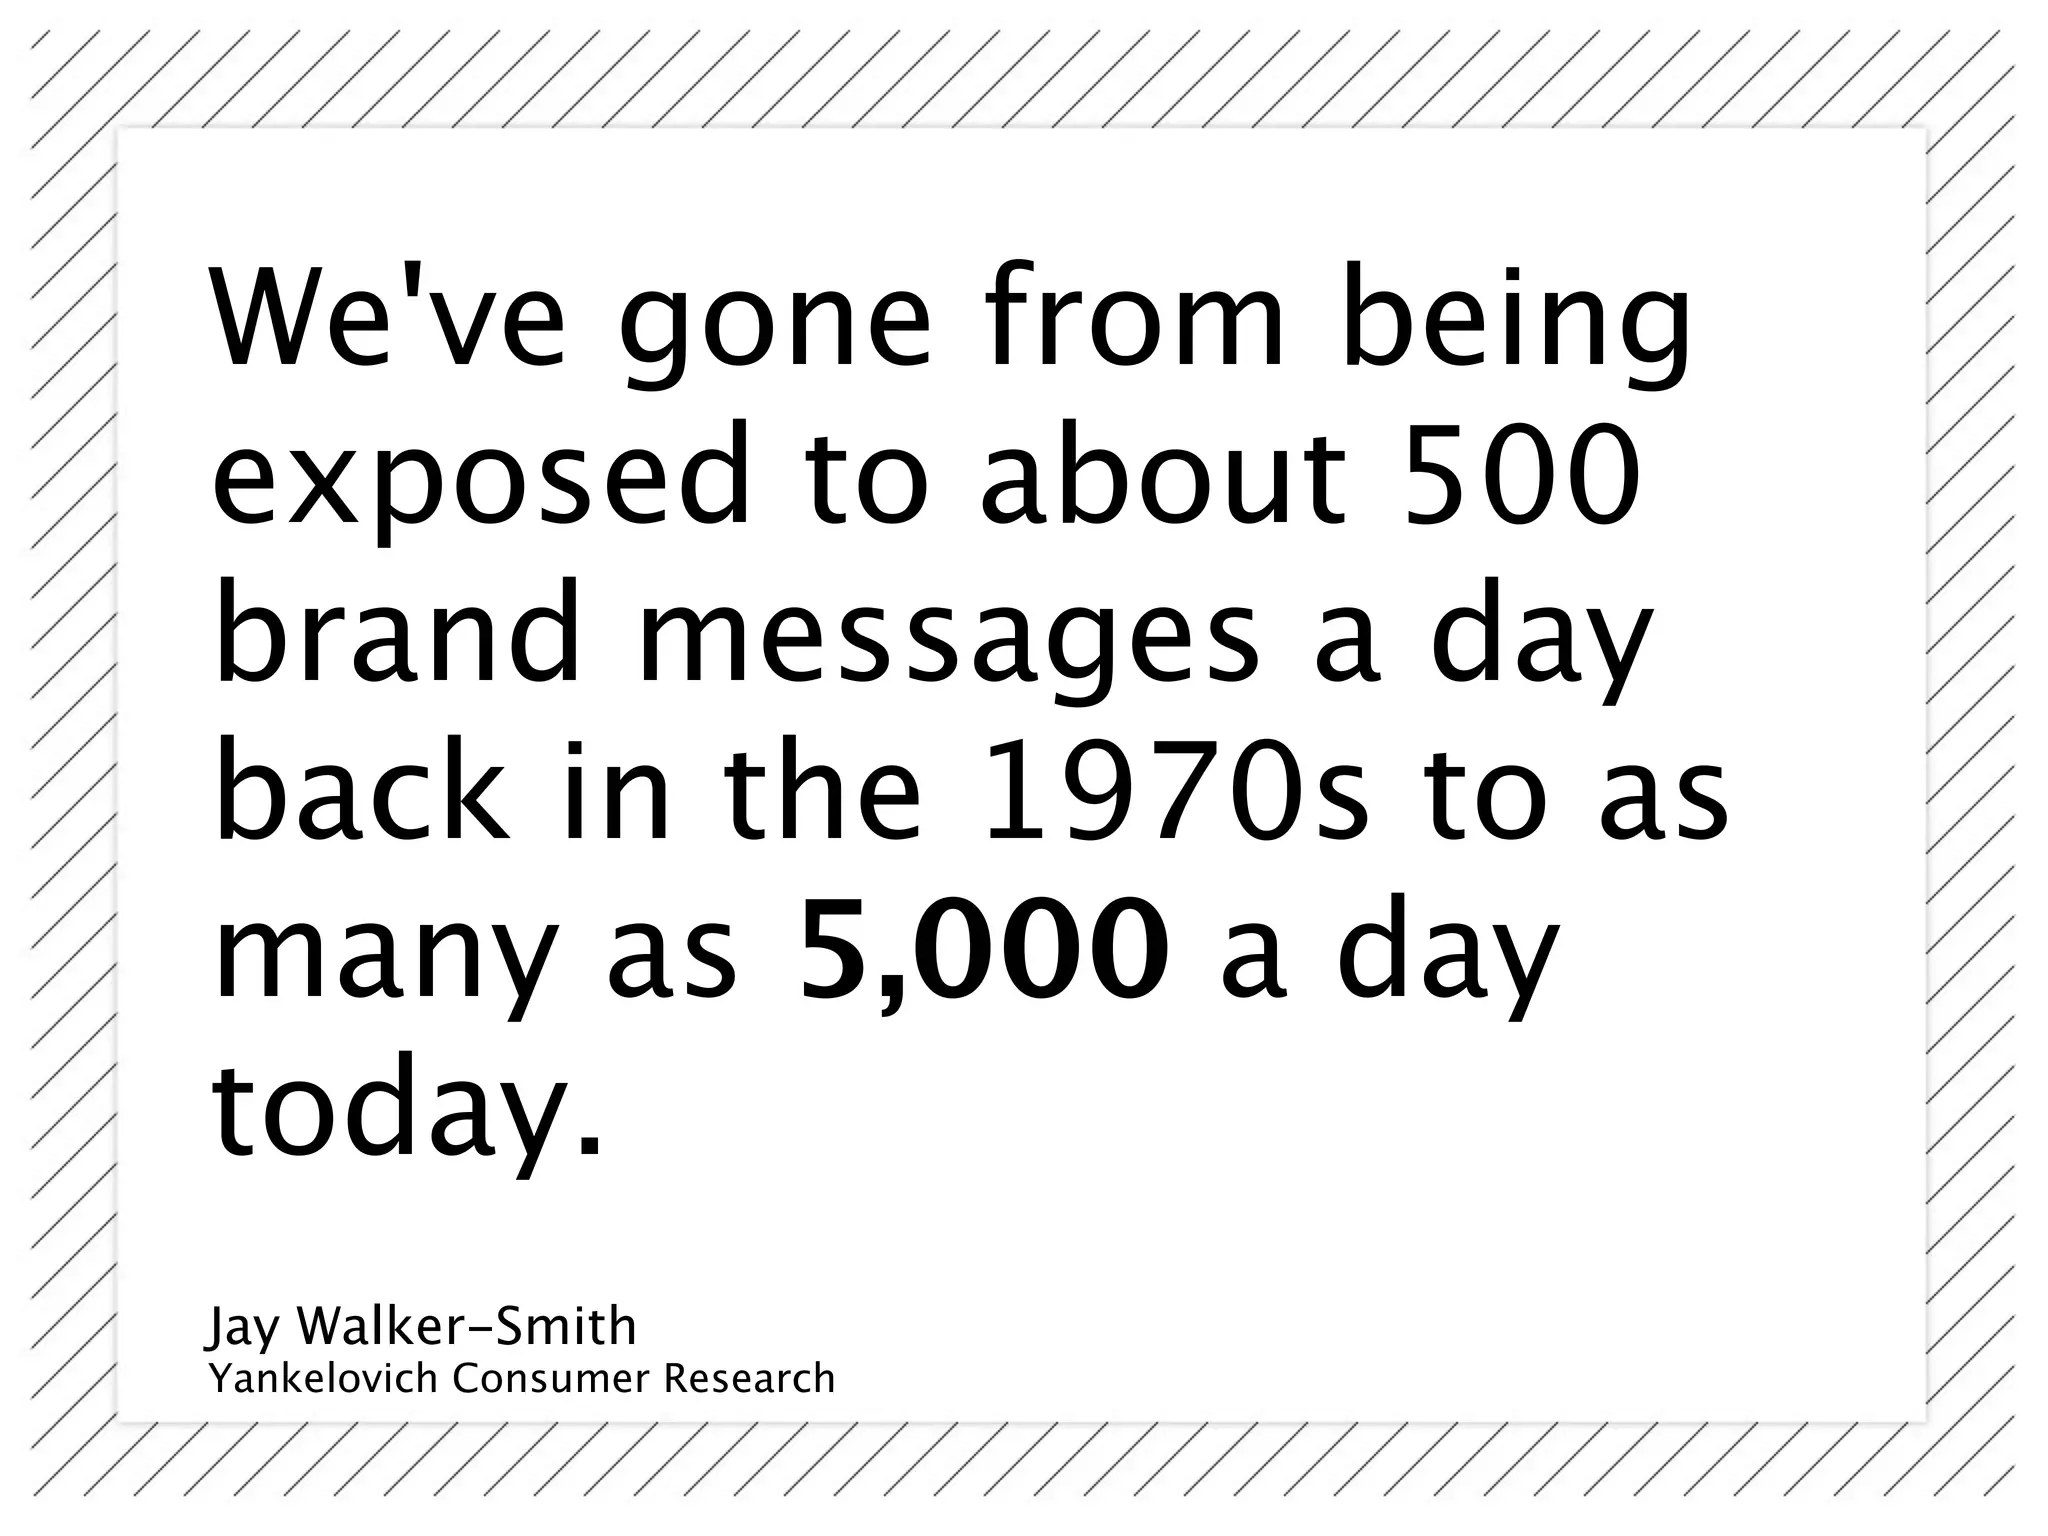
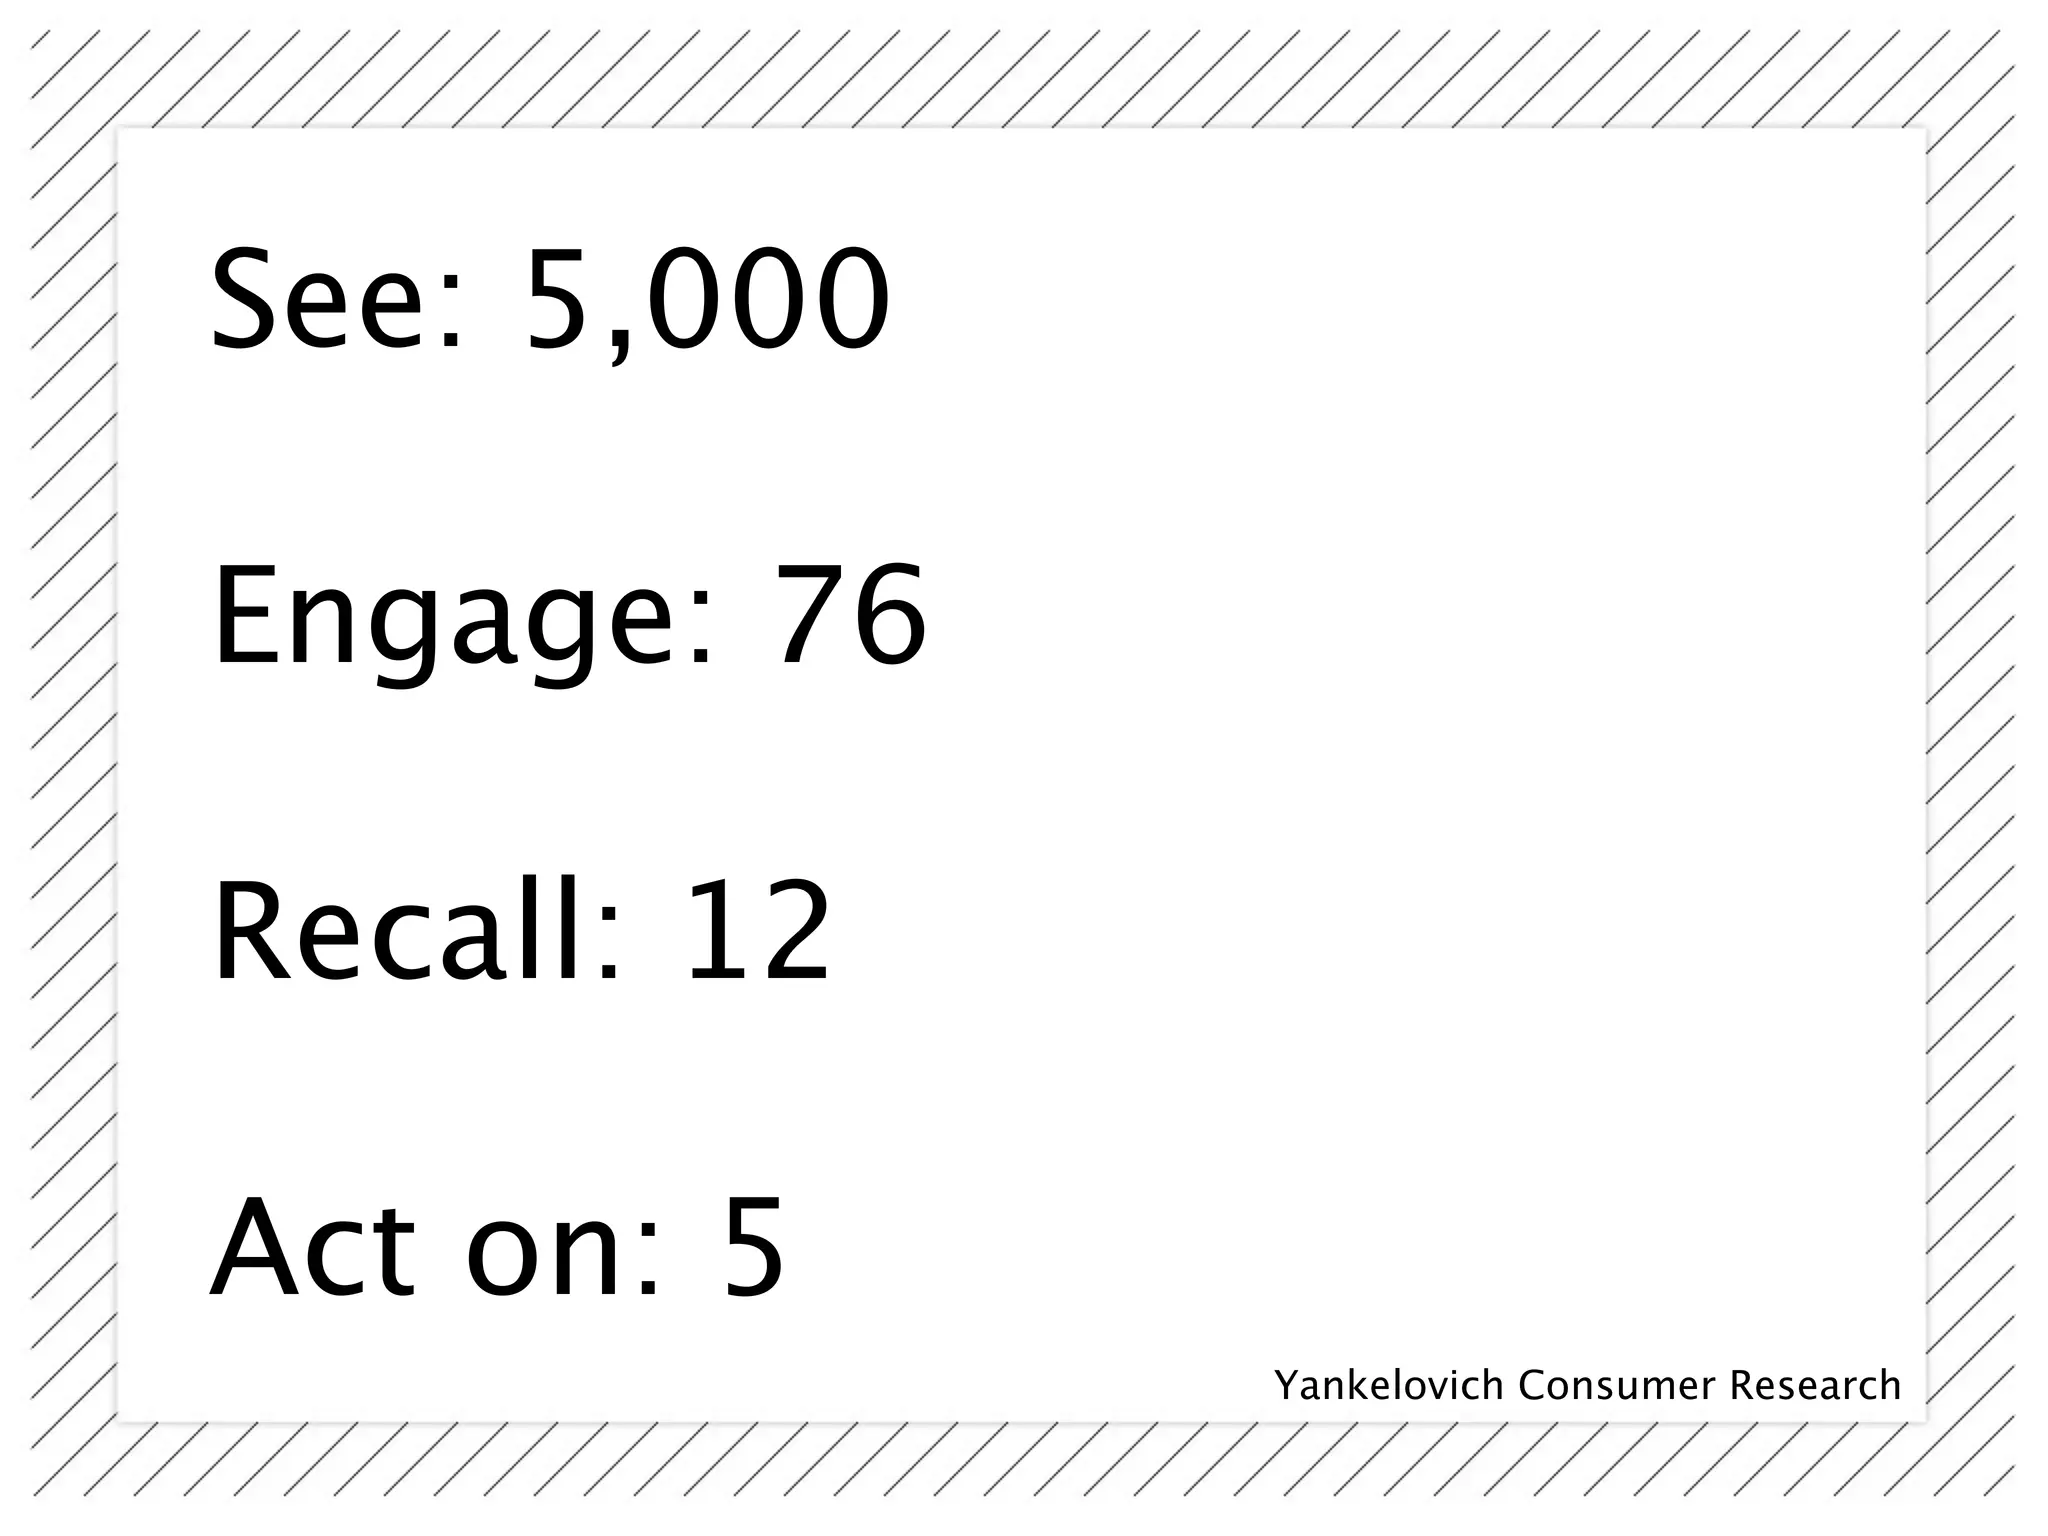

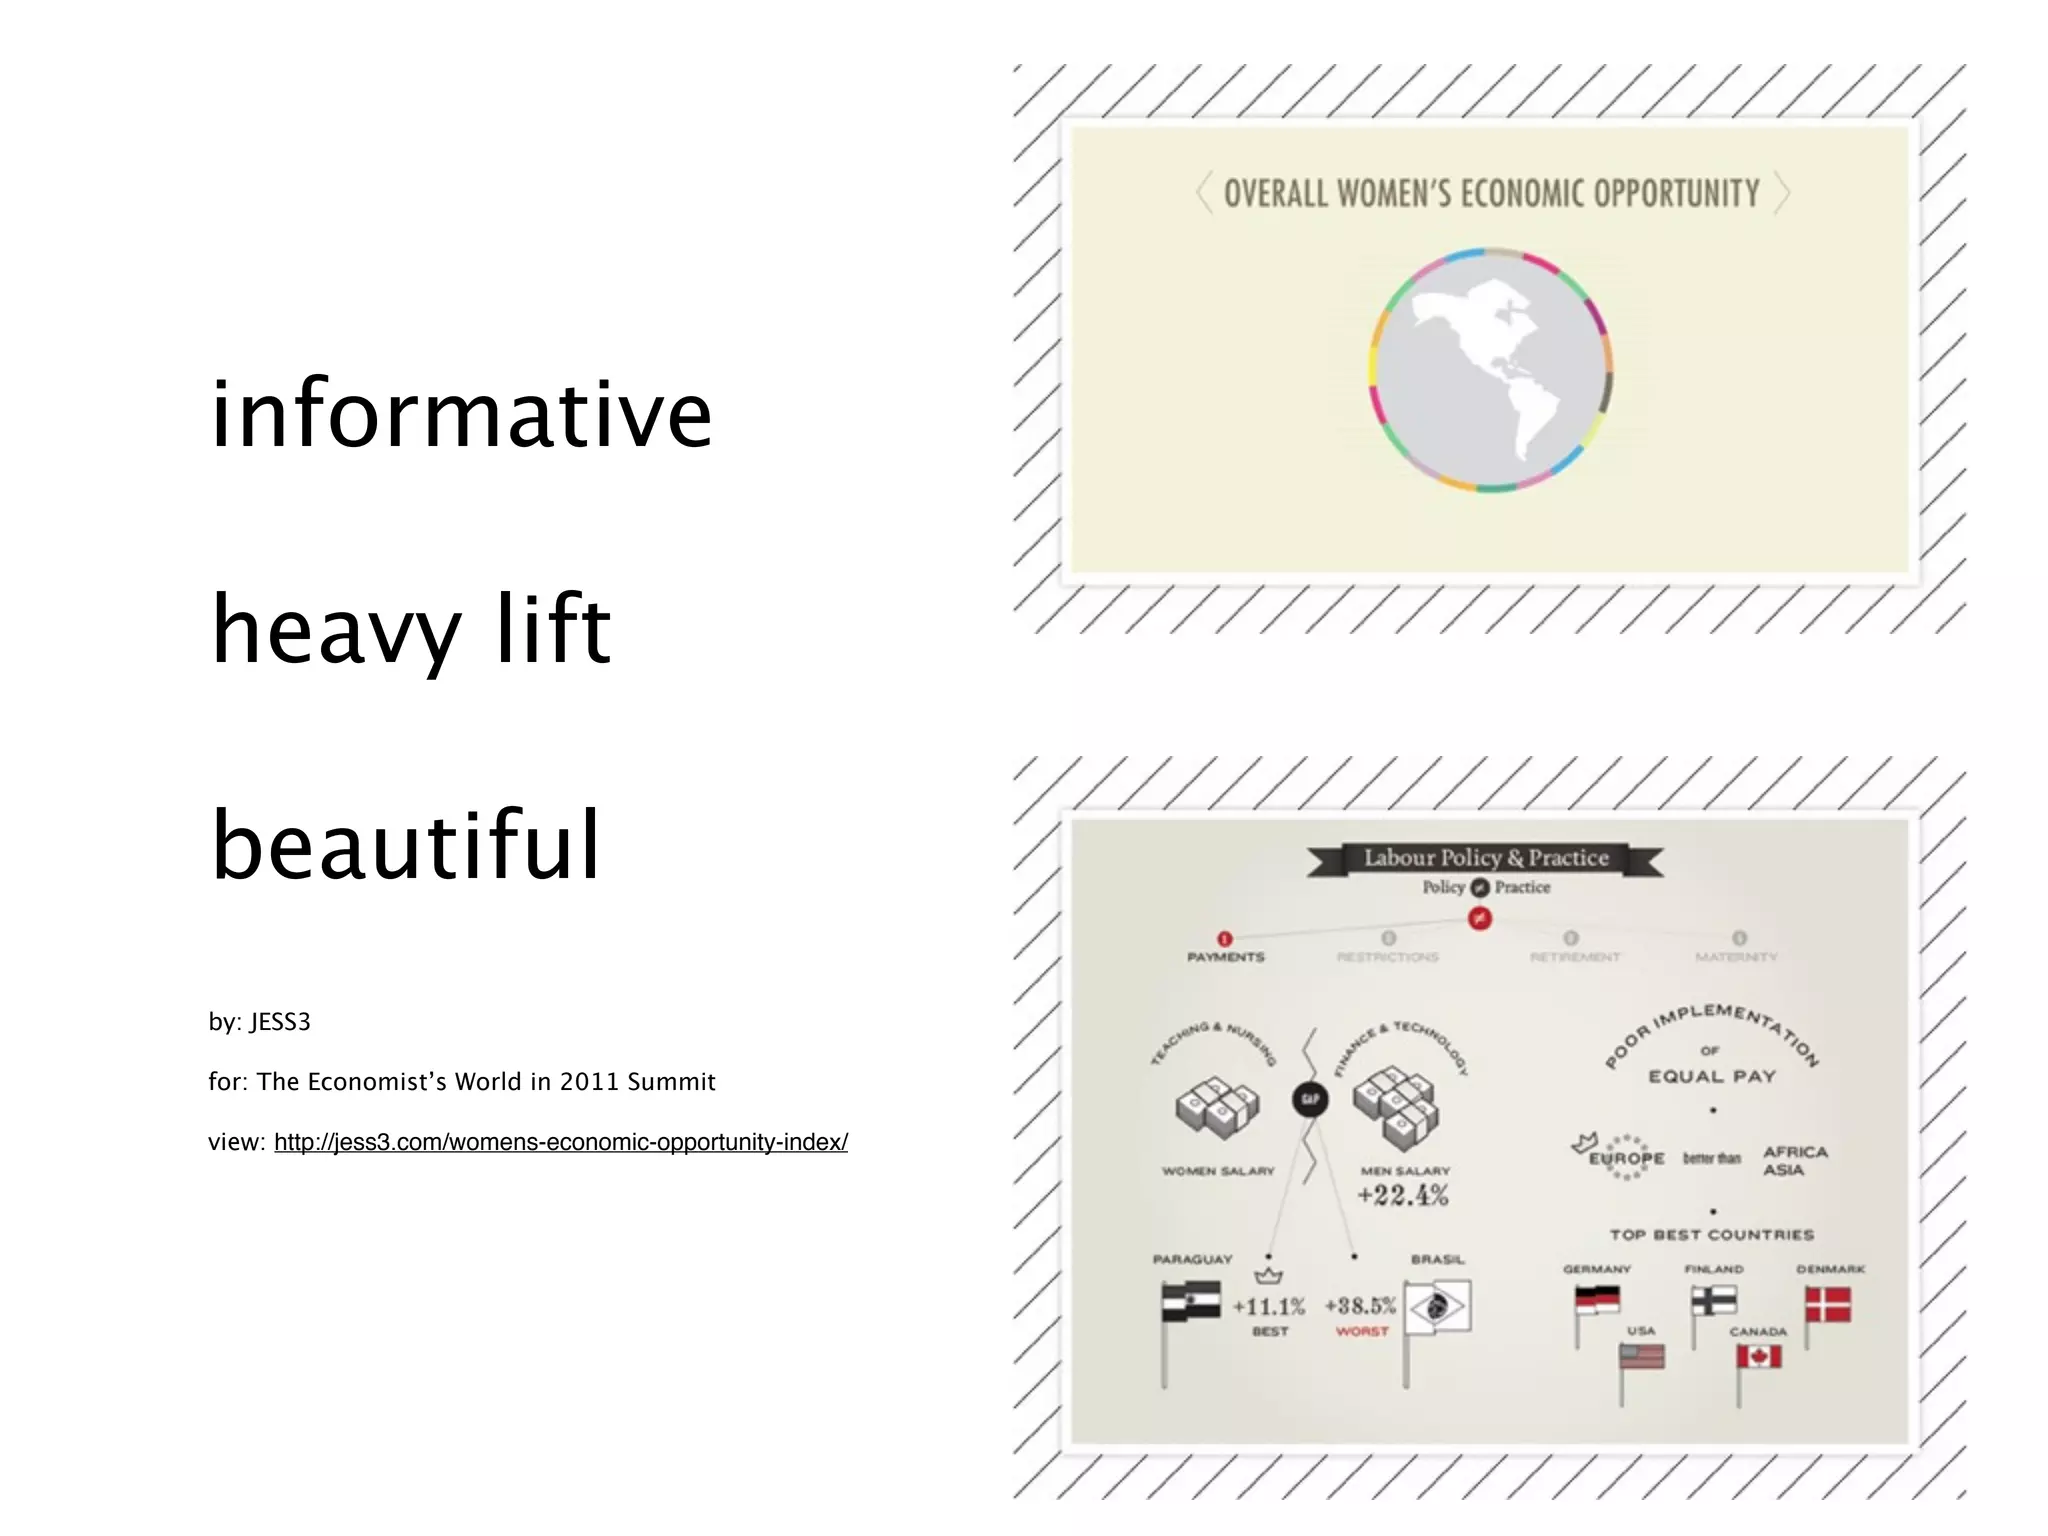


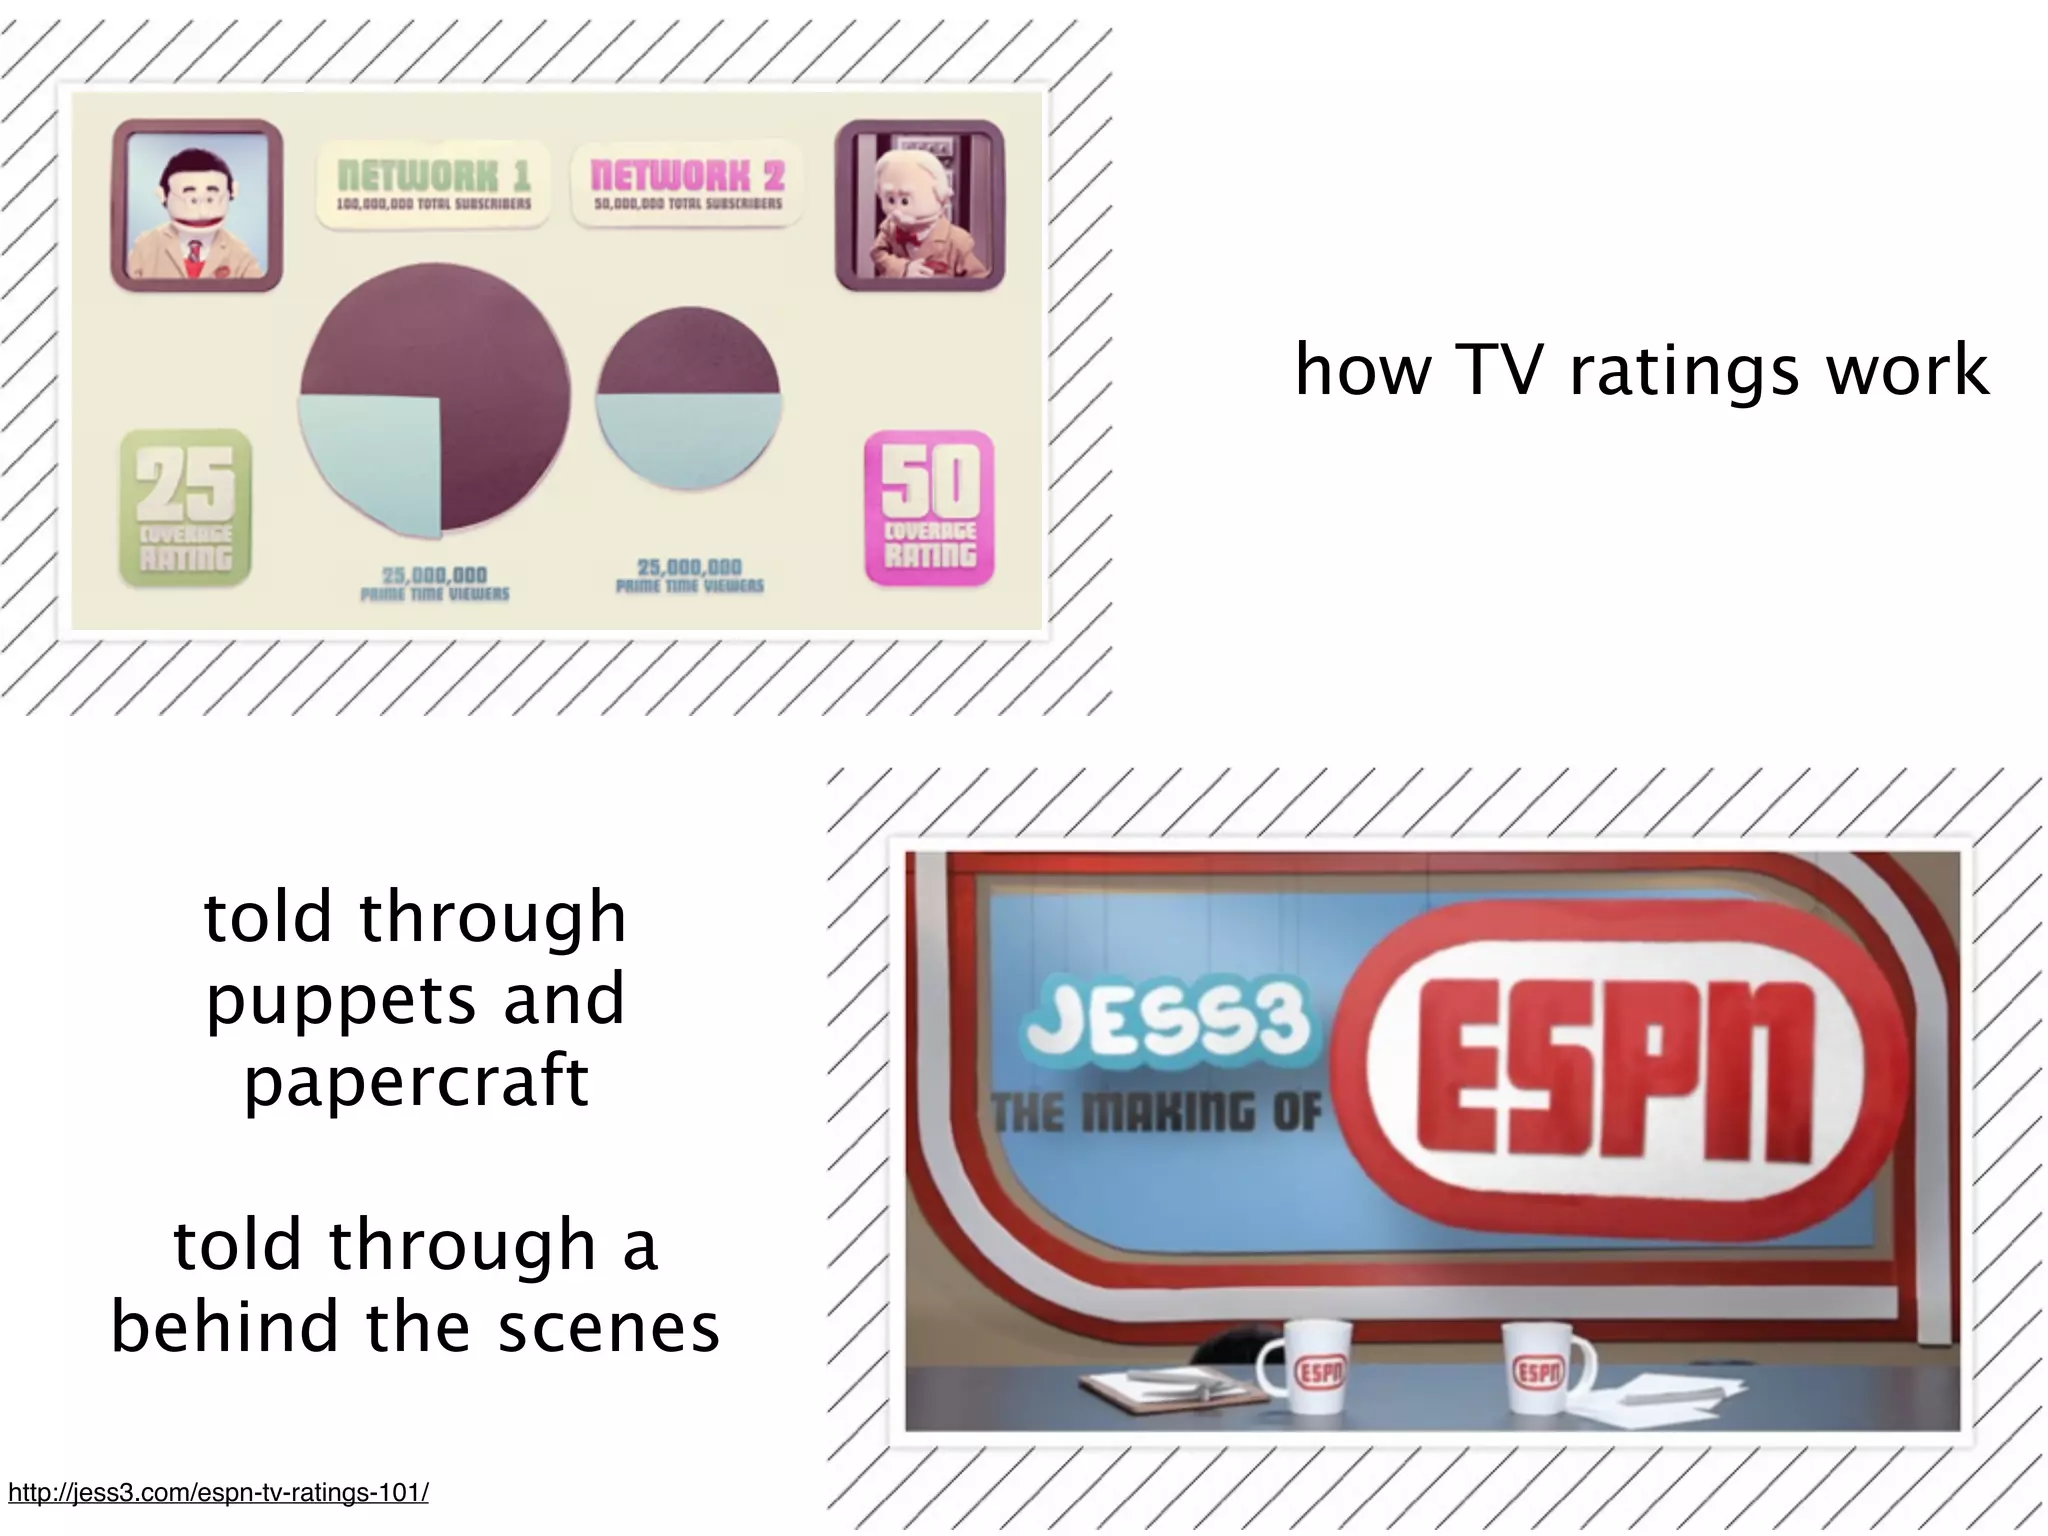
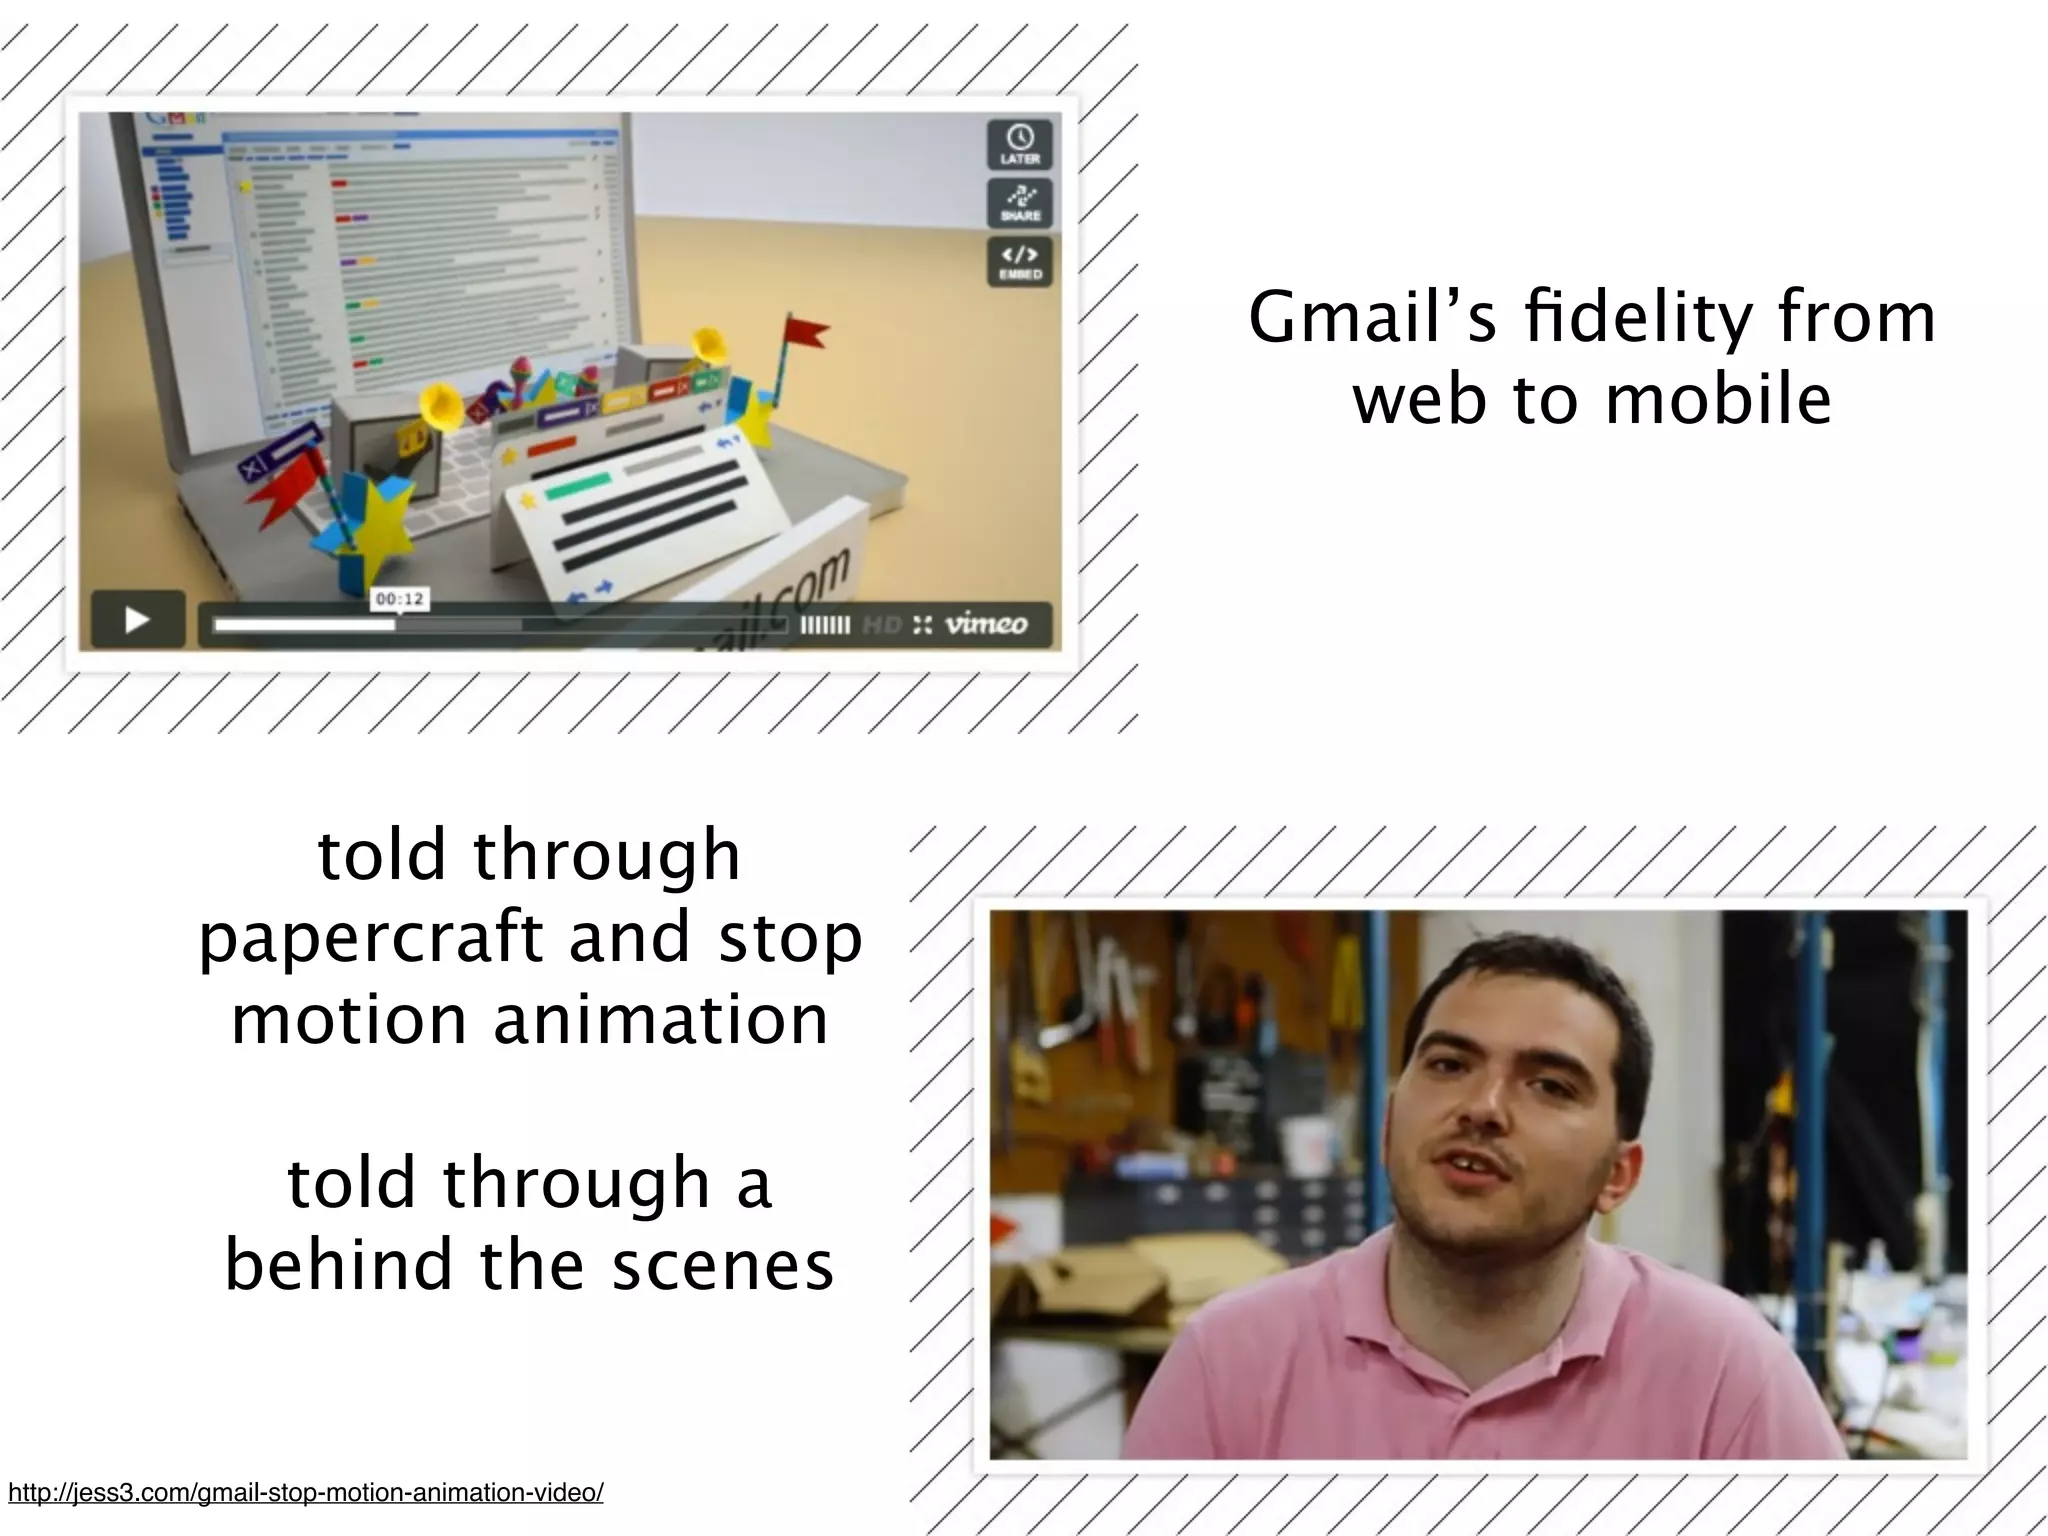
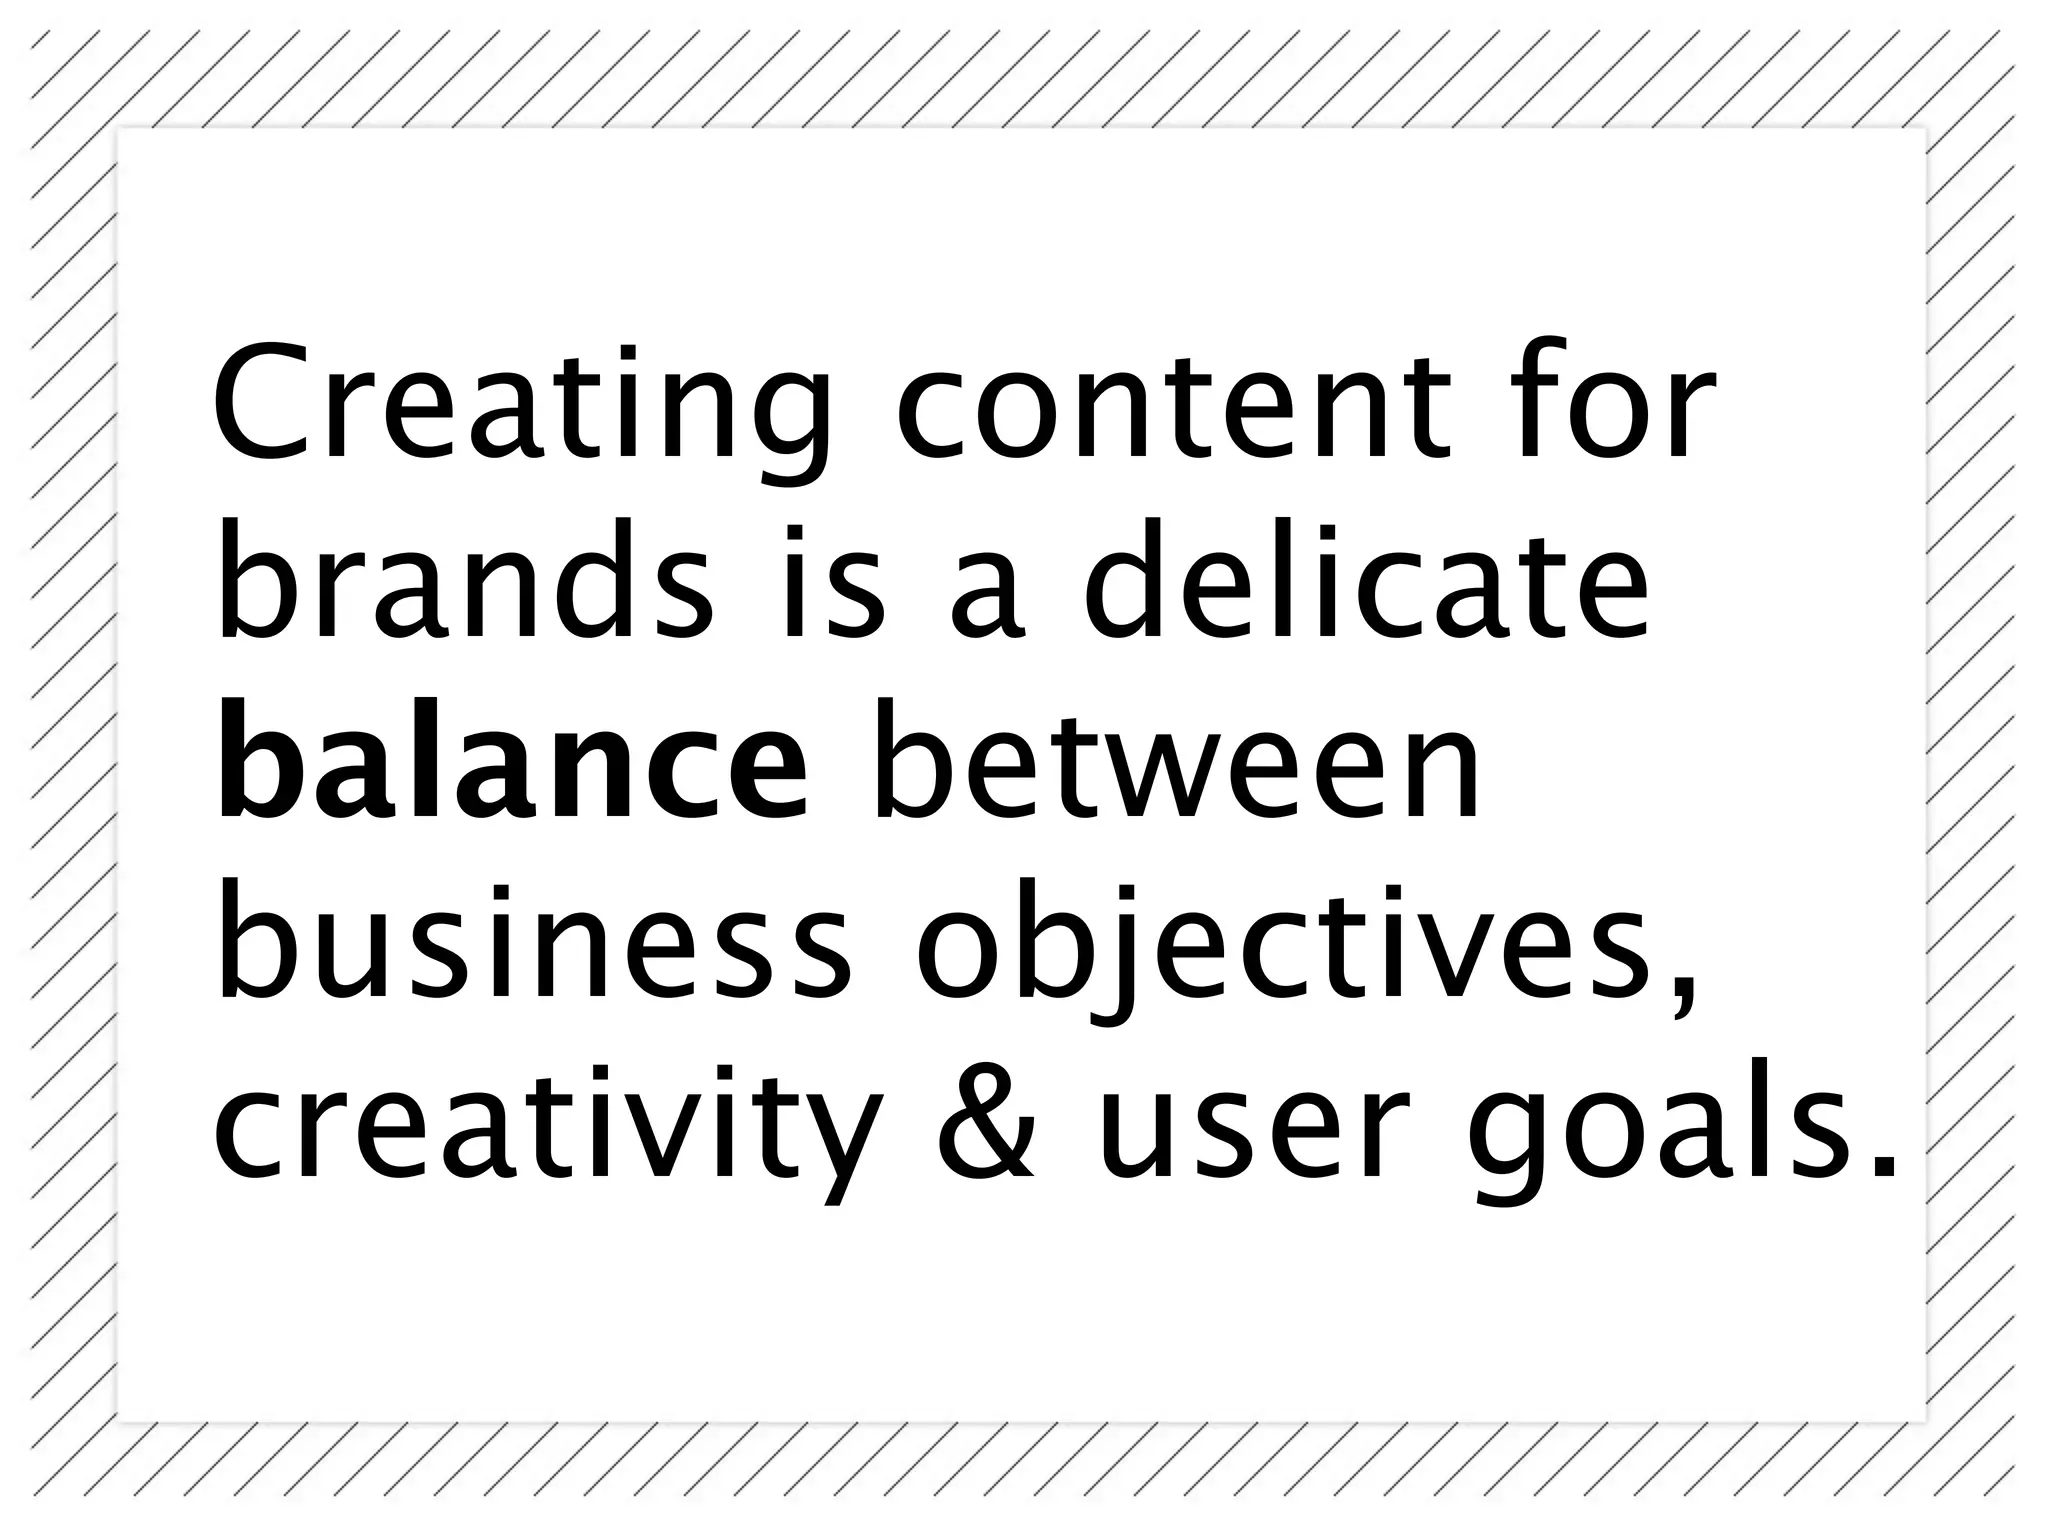

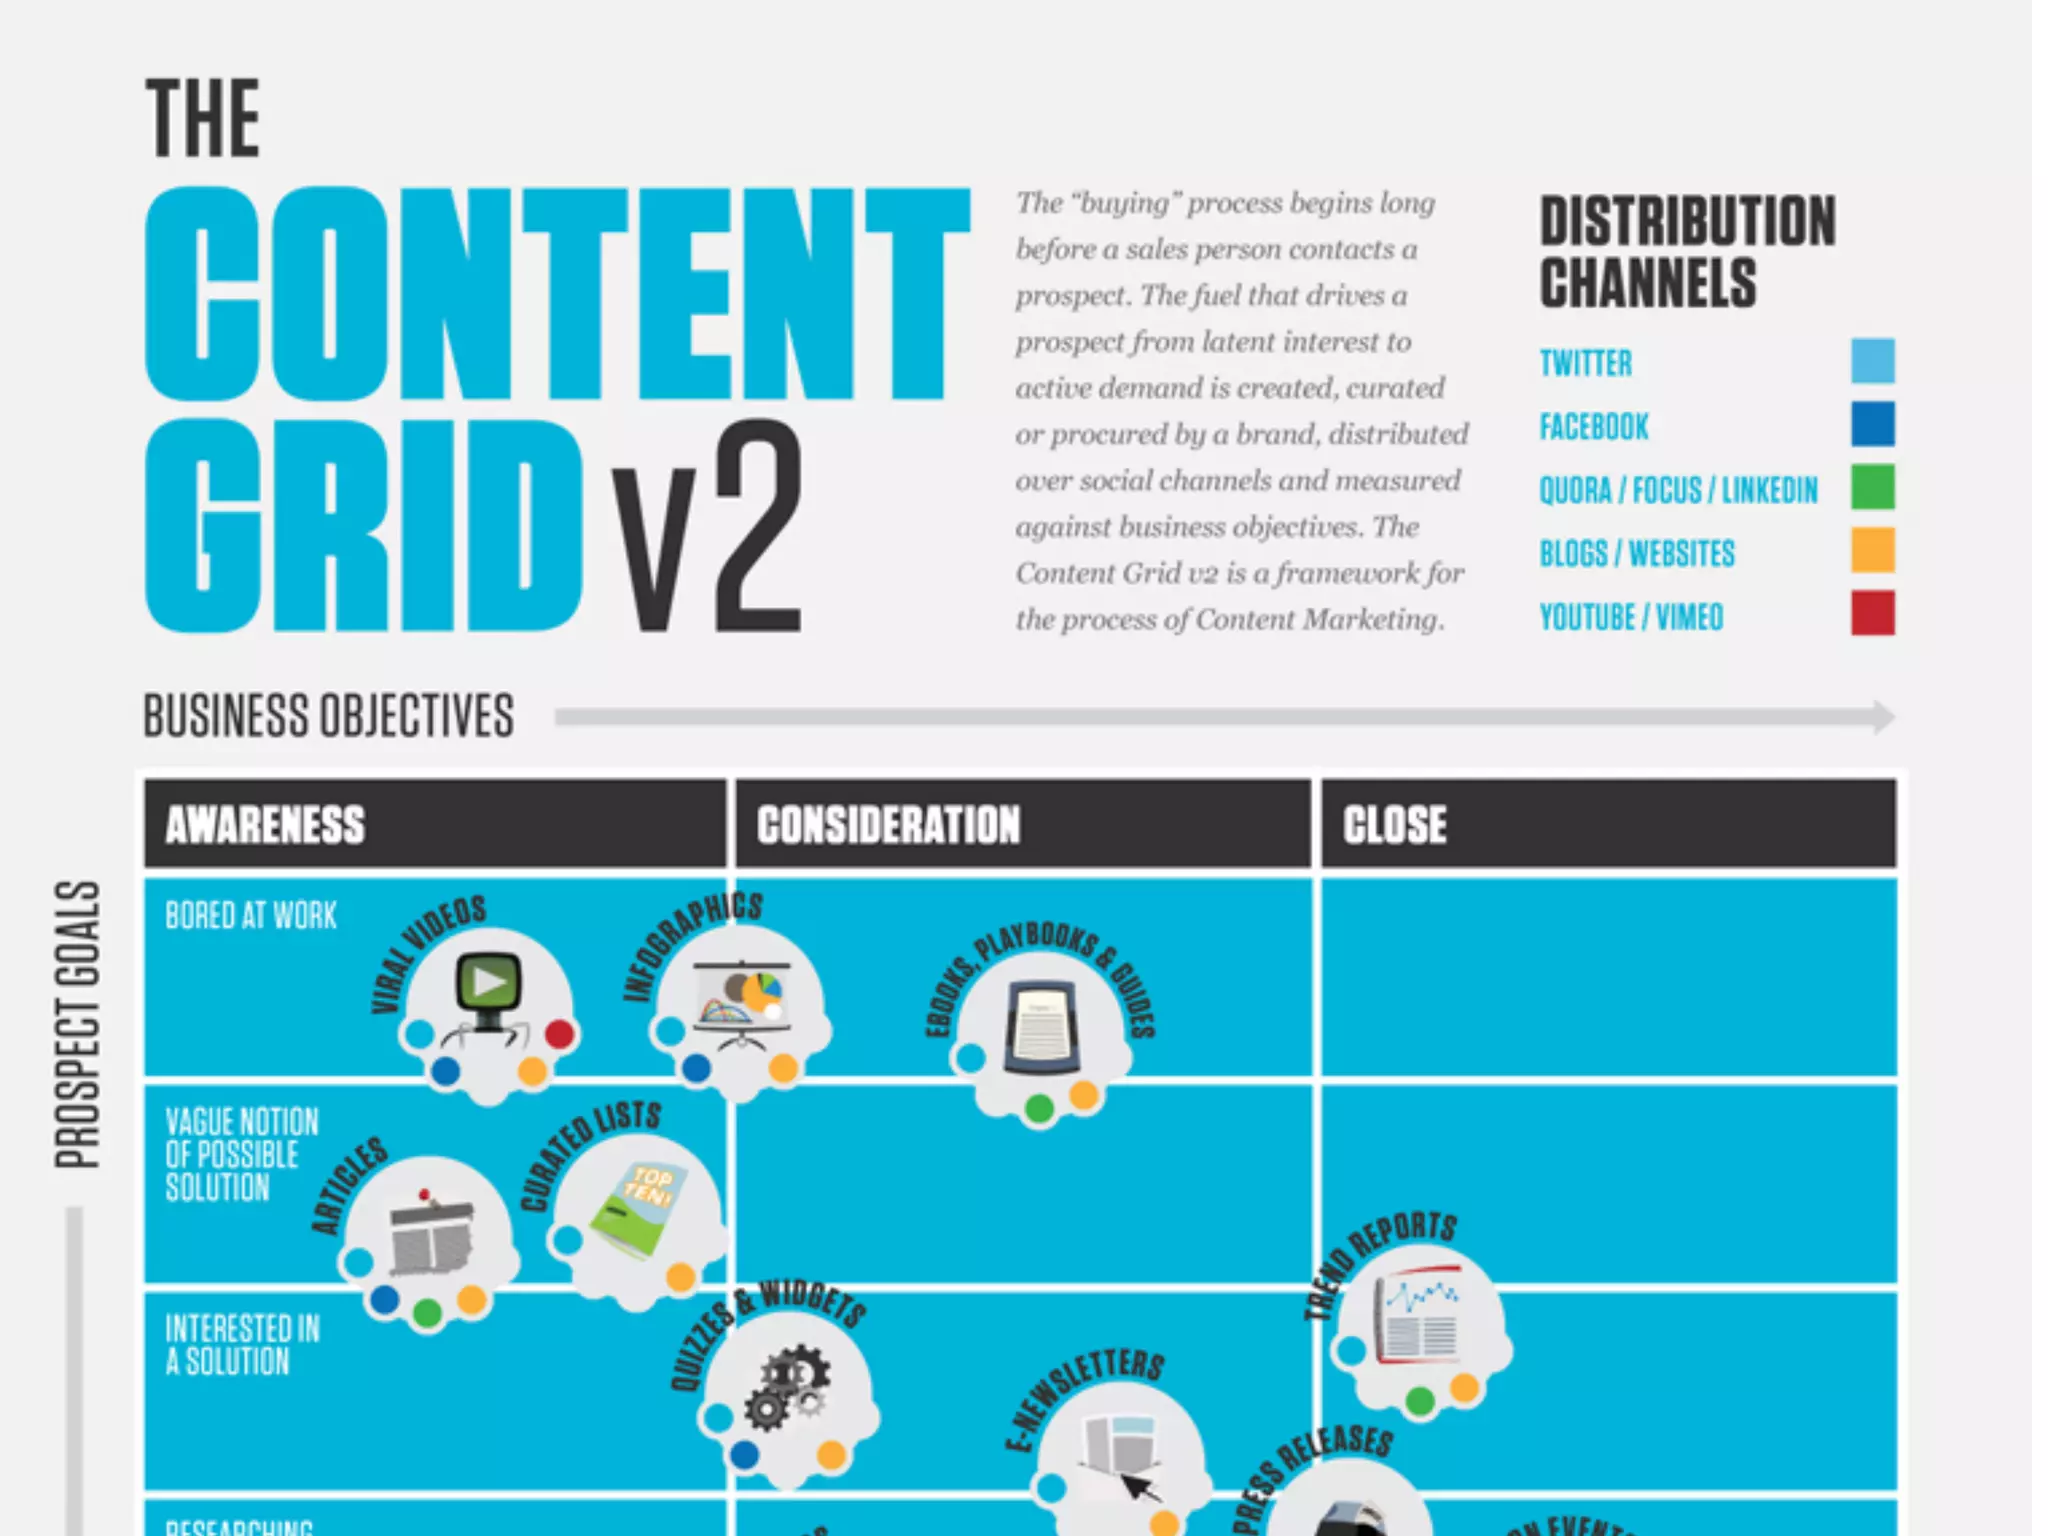


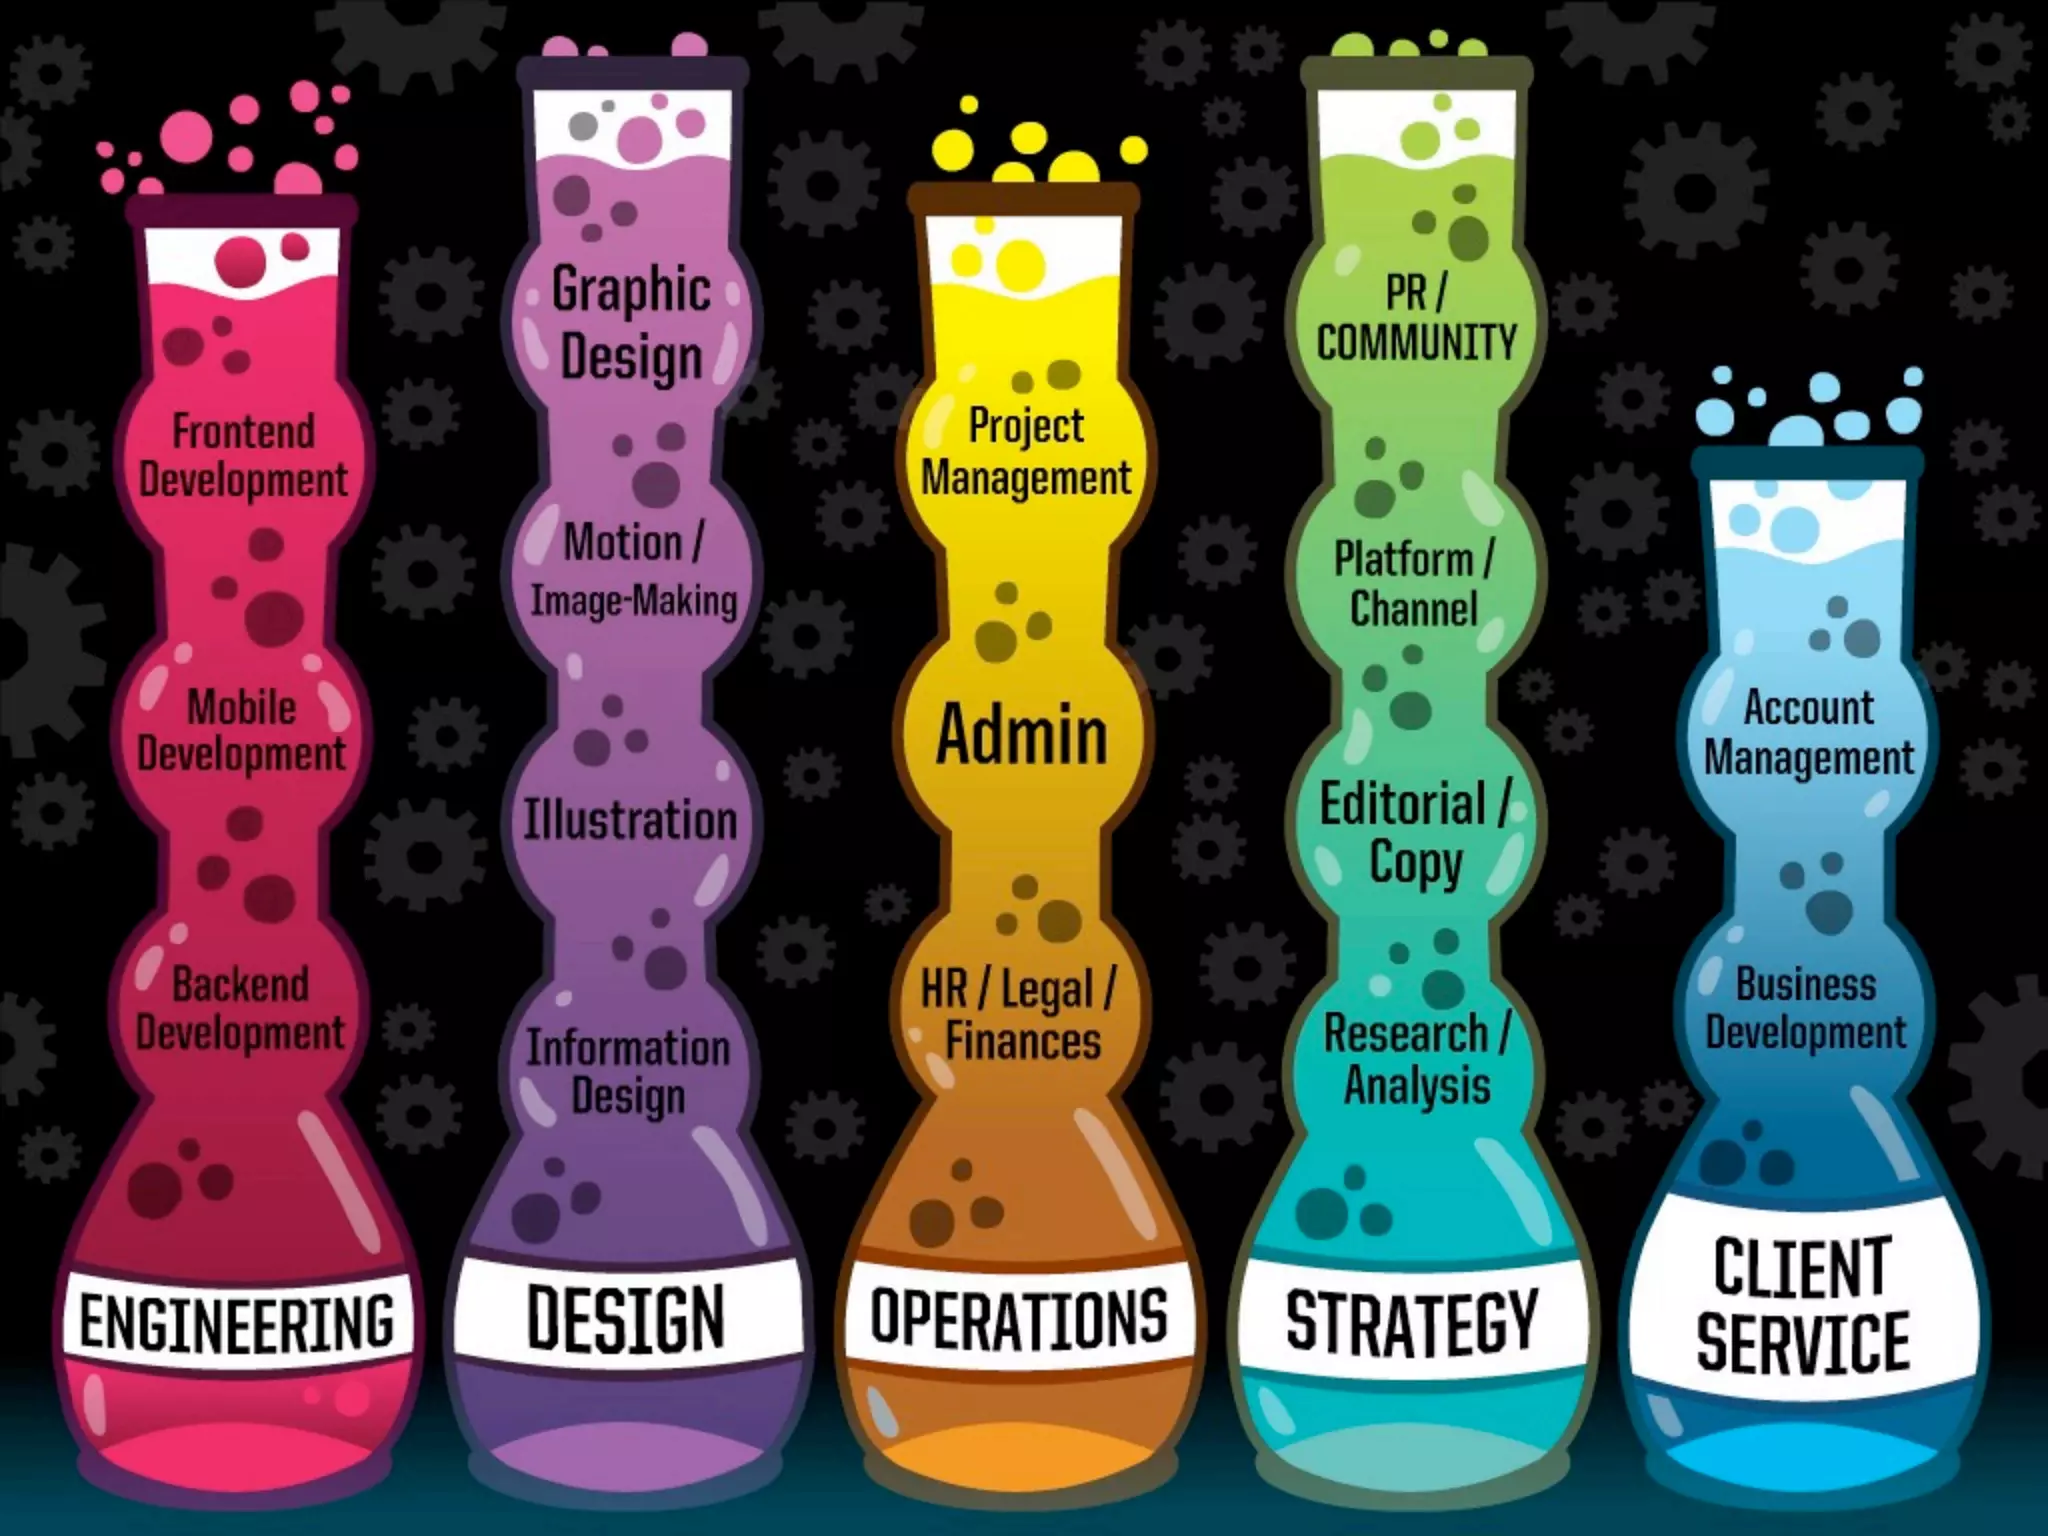
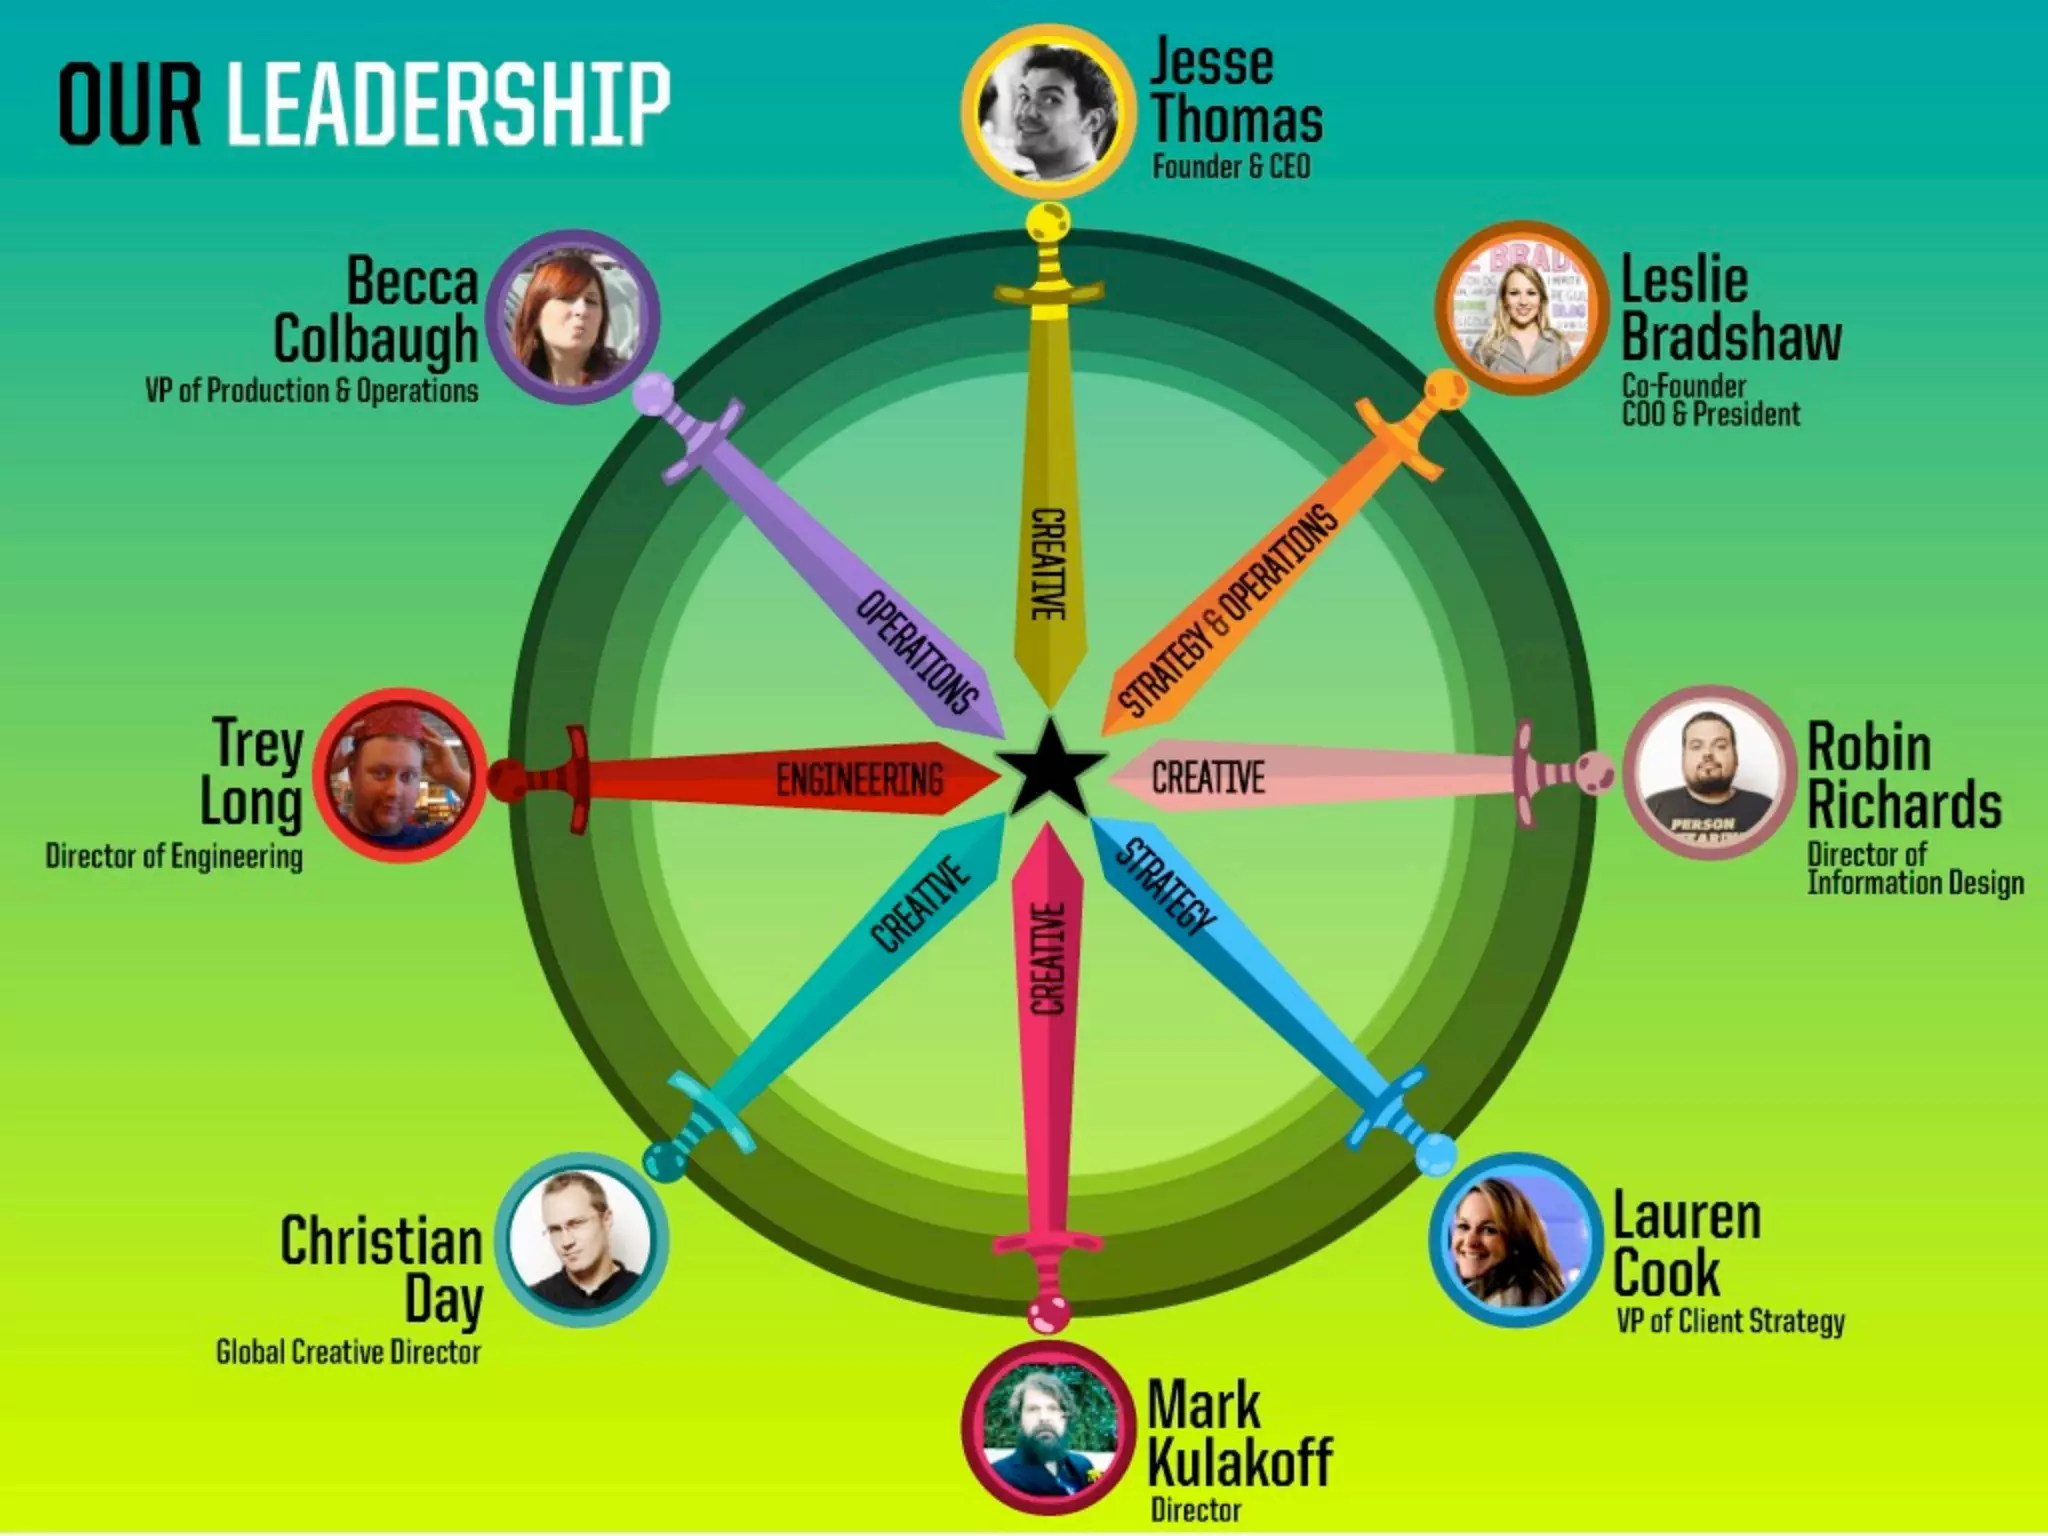


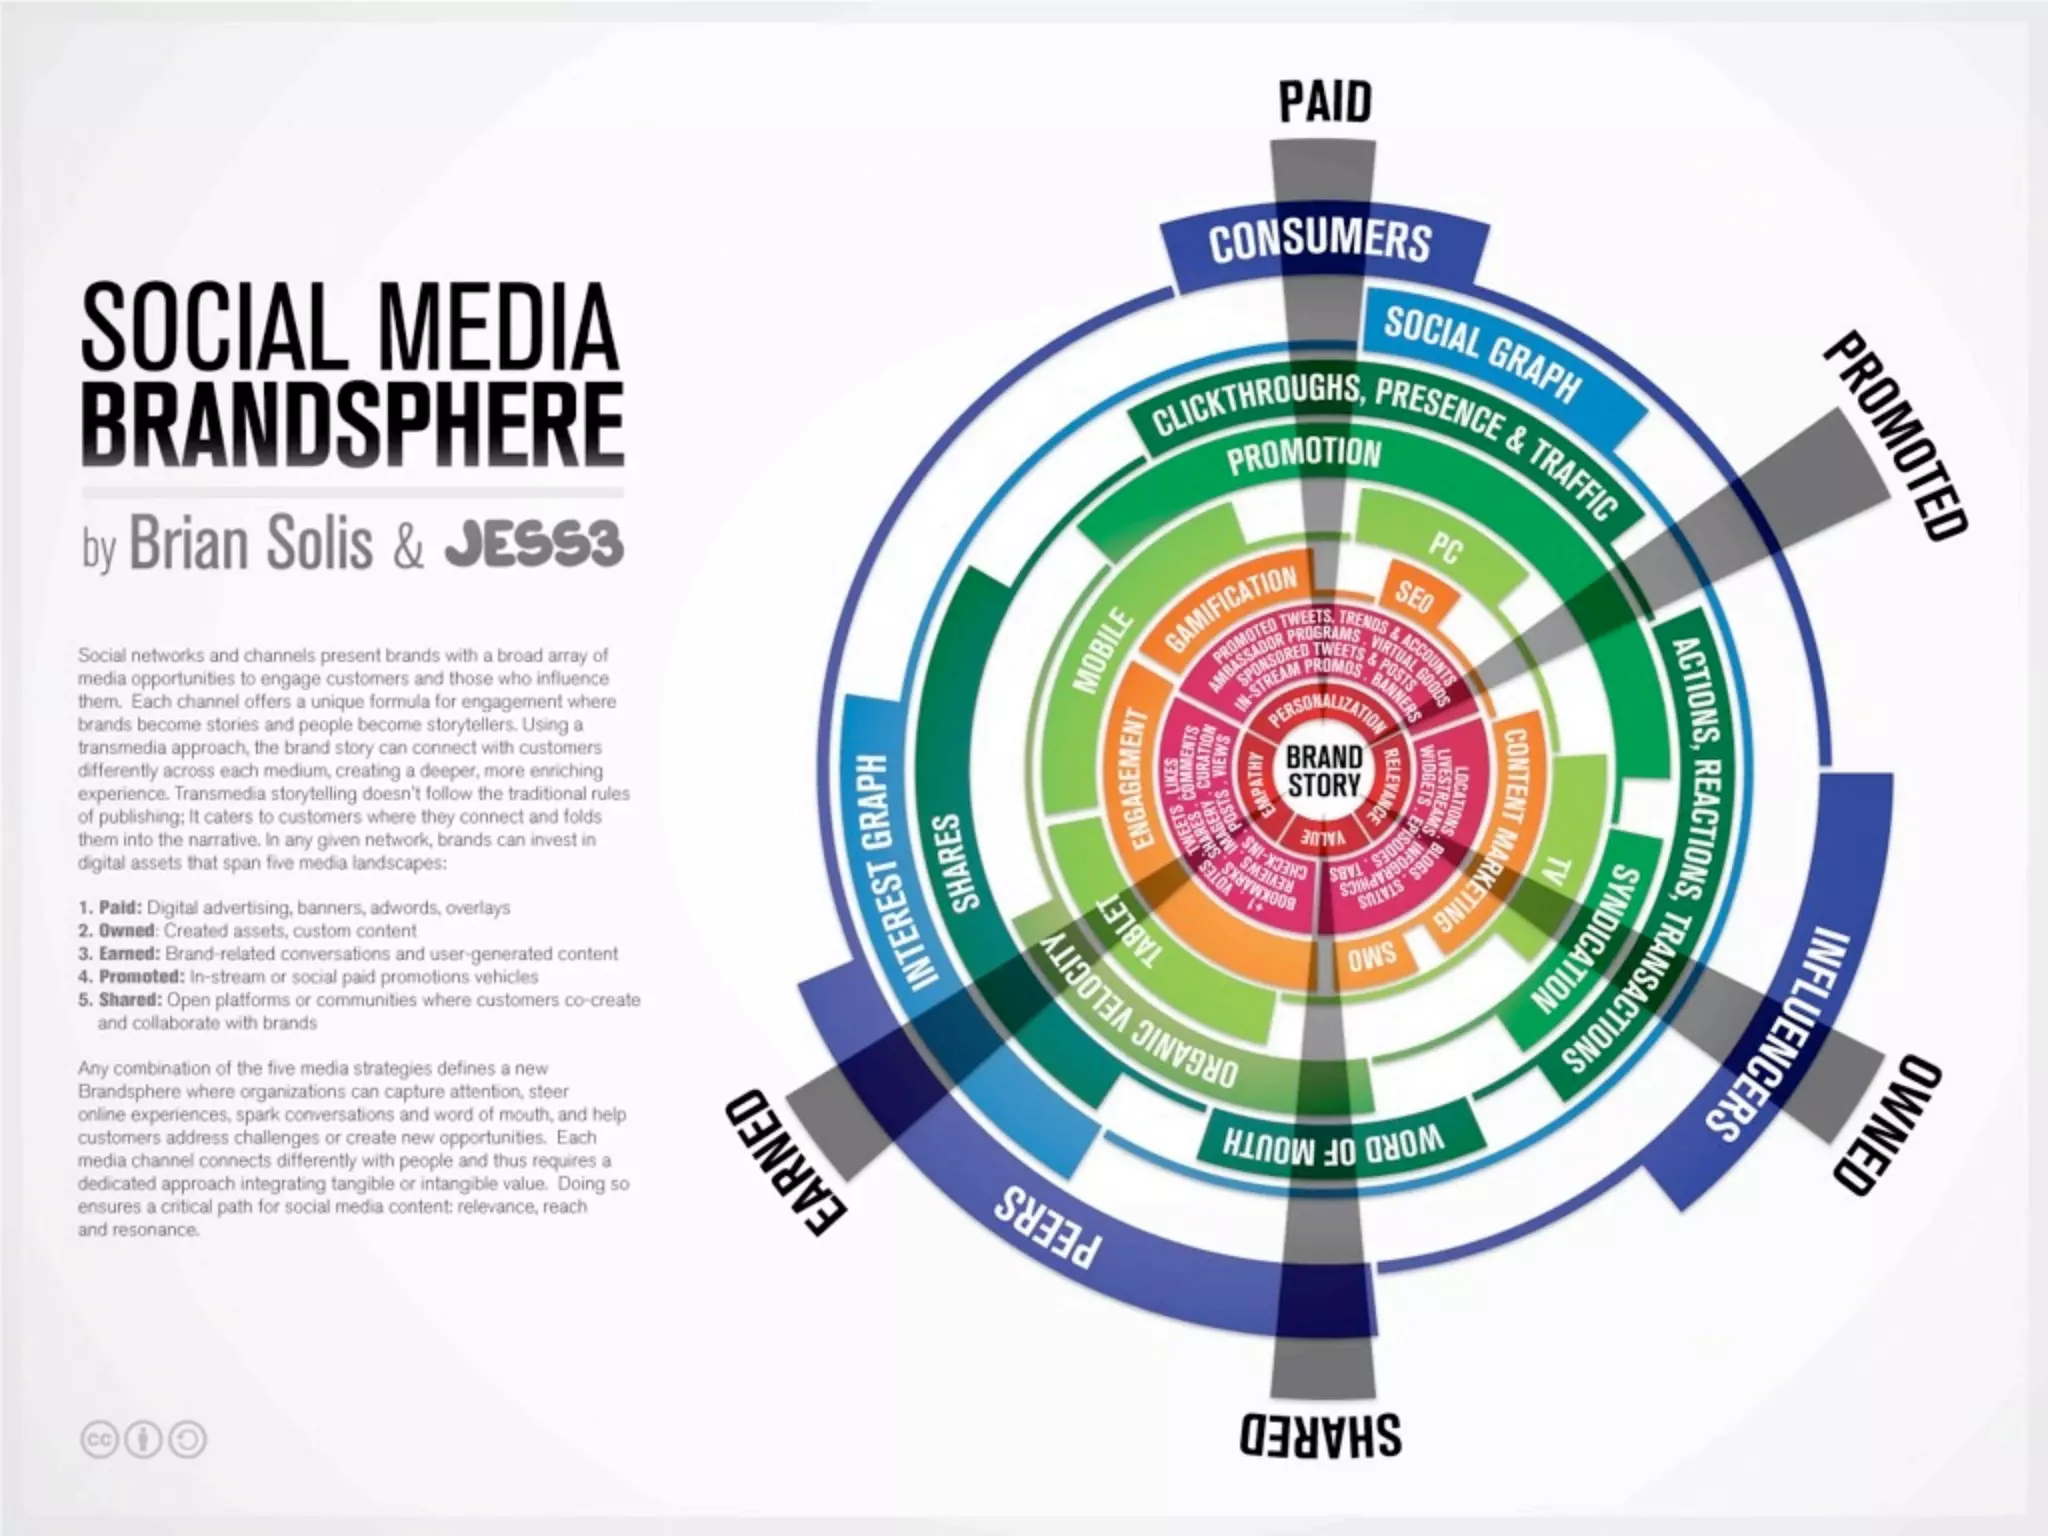

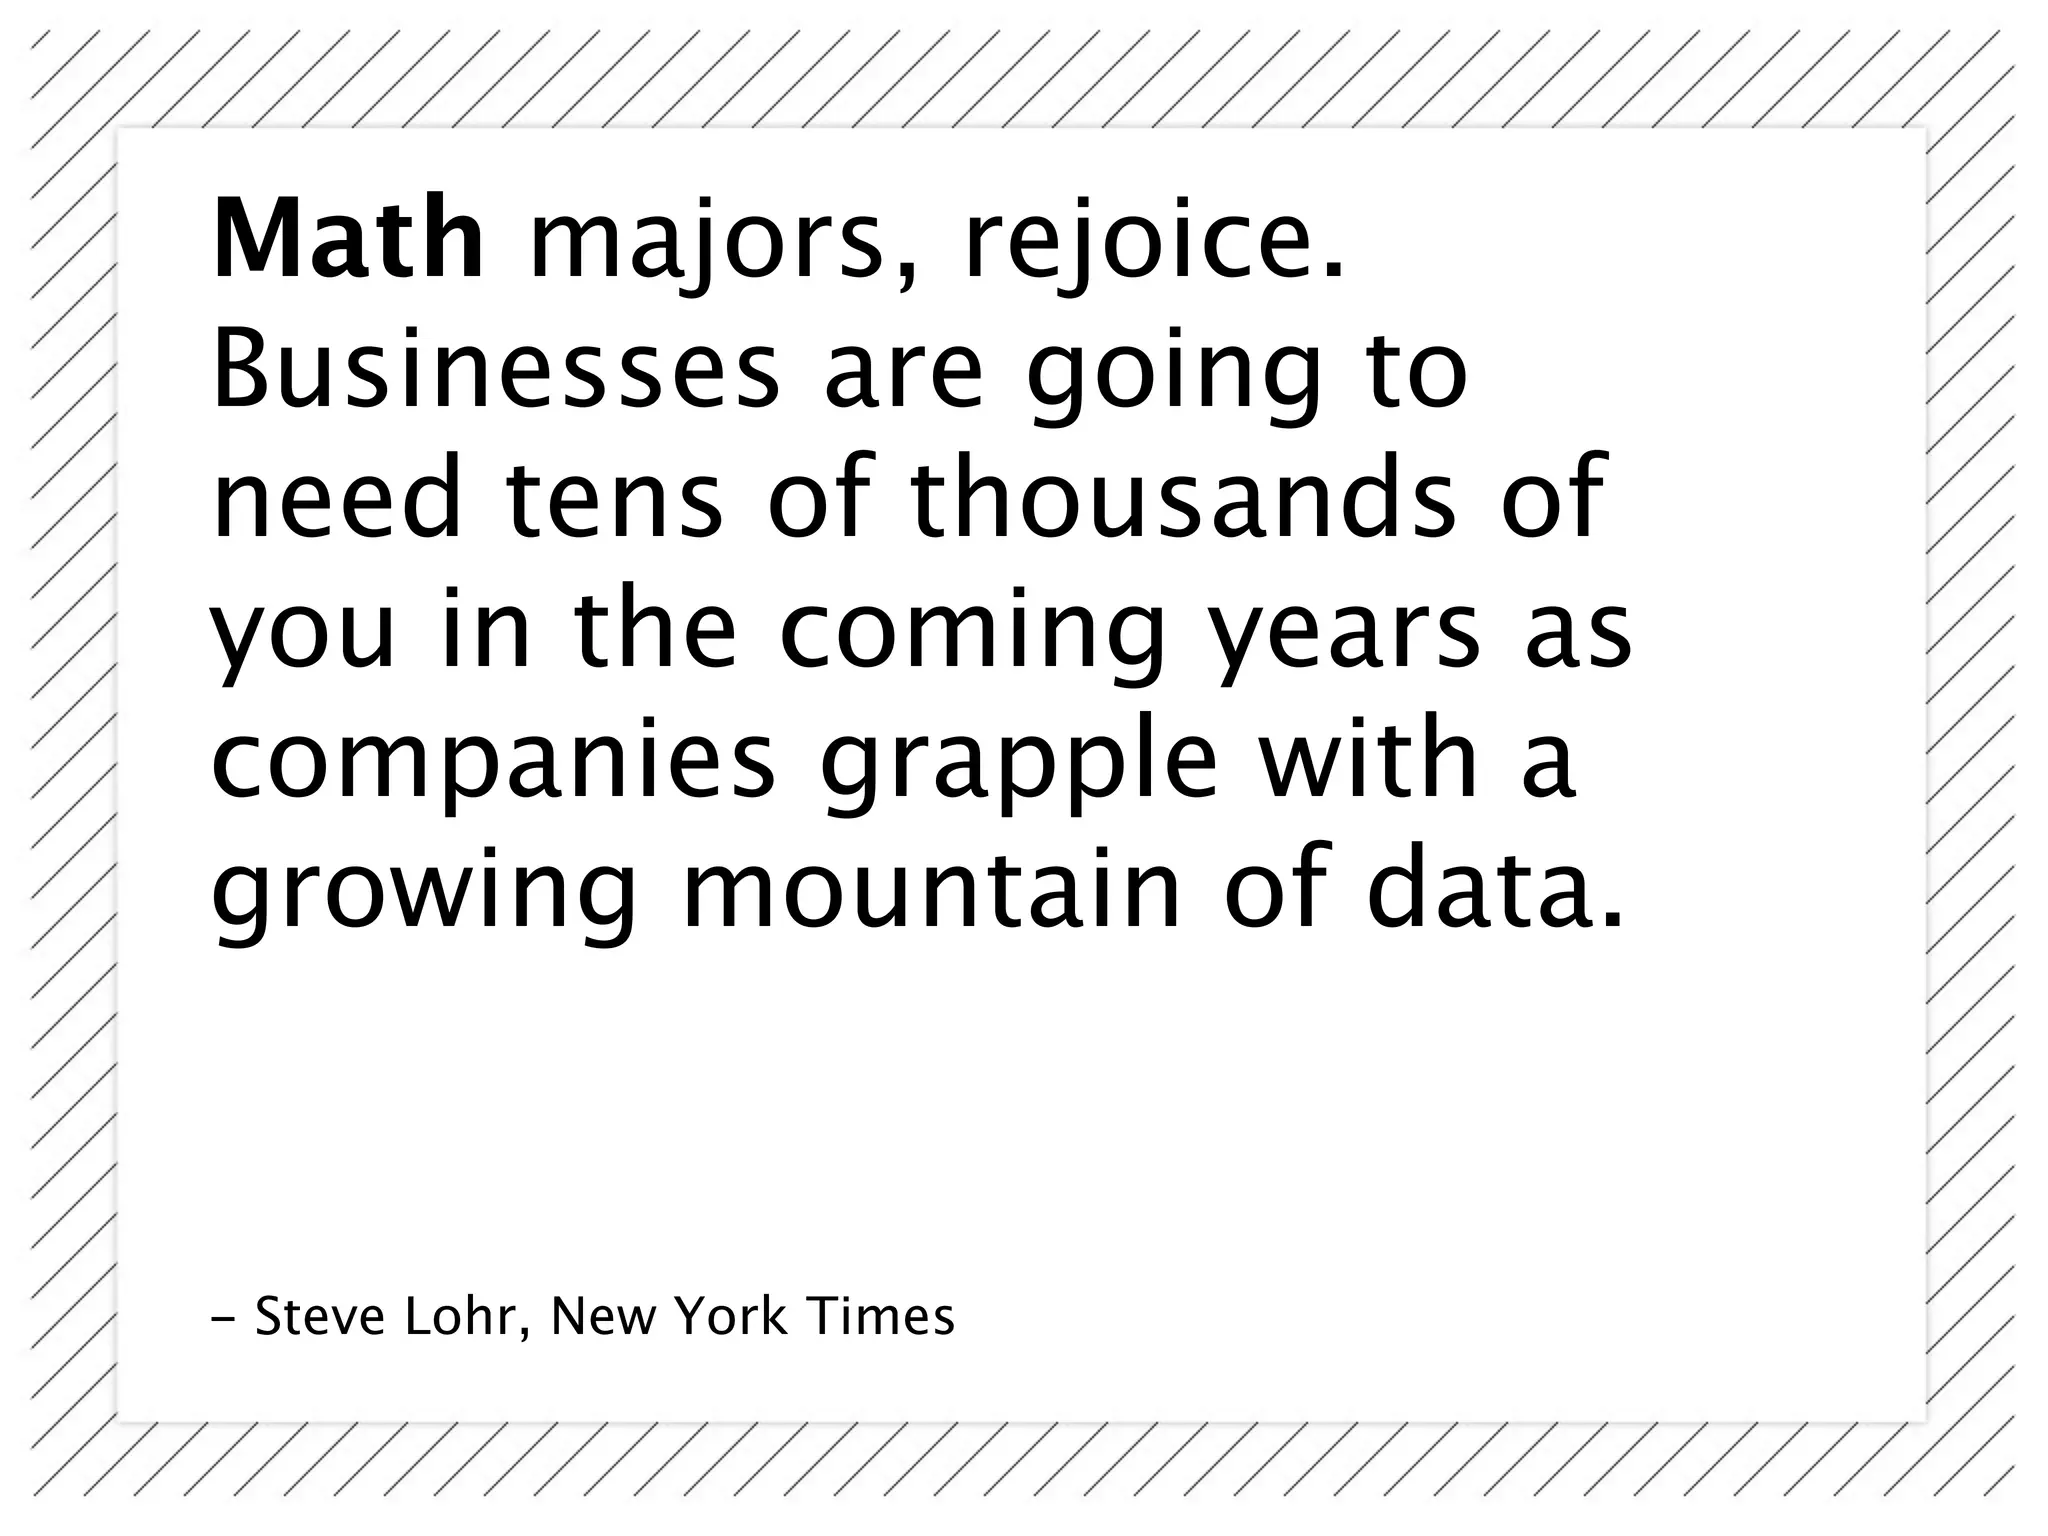


The document discusses the increasing importance of data visualization and the skills required to process and extract value from data in modern contexts. It highlights various projects that showcase data visualization efforts, emphasizing the delicate balance between creativity, business objectives, and user goals. Additionally, it notes the rapidly changing landscape of content production and the need for businesses to adapt to the overwhelming volume of brand messages in today's market.


