Exploring Stoic Philosophy From Ancient Wisdom to Modern Relevance.pdf
Chapter iv
1. Chapter IV
PRESENTATION, ANALYSIS, AND INTERPRETATION OF FINDINGS
This chapter presents the findings of the study in illustrative tables and analysis as well as
interpretation based from the treatment of the data.
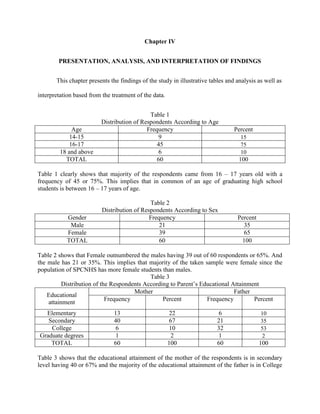
Table 1
Distribution of Respondents According to Age
Age Frequency Percent
14-15 9 15
16-17 45 75
18 and above 6 10
TOTAL 60 100
Table 1 clearly shows that majority of the respondents came from 16 – 17 years old with a
frequency of 45 or 75%. This implies that in common of an age of graduating high school
students is between 16 – 17 years of age.
Table 2
Distribution of Respondents According to Sex
Gender Frequency Percent
Male 21 35
Female 39 65
TOTAL 60 100
Table 2 shows that Female outnumbered the males having 39 out of 60 respondents or 65%. And
the male has 21 or 35%. This implies that majority of the taken sample were female since the
population of SPCNHS has more female students than males.
Table 3
Distribution of the Respondents According to Parent’s Educational Attainment
Mother Father
Educational
Frequency Percent Frequency Percent
attainment
Elementary 13 22 6 10
Secondary 40 67 21 35
College 6 10 32 53
Graduate degrees 1 2 1 2
TOTAL 60 100 60 100
Table 3 shows that the educational attainment of the mother of the respondents is in secondary
level having 40 or 67% and the majority of the educational attainment of the father is in College
2. level having 32 or 53%. This implies that the husband has attained a higher degree than their
wives.
Table 4
Distribution of the Respondents According to Parent’s Occupation
Occupation Mother Father
Frequency Percent Frequency Percent
White collar 11 18 6 10
Blue collar 6 10 50 83
None 43 72 4 7
TOTAL 60 100 60 100
Table 4 clearly shows us the difference between the husbands and the wives, majority of the
mothers have no job since common of them are housewives as supported by Khil (2004) Some
contemporary women are leaving the paid workforce and concentrating full-time on child-
rearing; particularly through their child(ren)'s early years (before entering kindergarten). There is
considerable variability within the stay-at-home mother population with regard to their intent to
return to the paid workforce. Some plan to work from their homes, some will do part-time work,
some intend to return to part or full-time work when their children have reached school age,
some may increase their skill sets by returning to higher education, and others may find it
economically feasible to refrain from entering (or re-entering) the paid workforce. Similarly,
there is considerable variation in the stay-at-home mother's attitude towards domestic work not
related to caring for children. Some may embrace a traditional role of housewife, cooking and
cleaning in addition to caring for children. Others see their primary role as that of child-care
providers, supporting their children's physical, intellectual, and emotional development while
sharing or outsourcing other aspects of home care.
Table 5
Distribution of Respondents According to their Monthly Income
Monthly Income (Php) Frequency Percent
6,000 below 6 10
6,001-8000 29 48
8,001-10,000 17 28
10,001-12,000 7 12
12,001-14,000 1 2
14,001 and above 0 0
TOTAL 60 100
3. Table 5 shows their monthly income, majority of their income highlighted ranges from 6,001 – 8,000
having 29 or 48%.
As mentioned by Rond (2005) Although income effect is likely to be present in mode choice for
most of the population within the developing world, presently used approaches do not take it into
account.
Table 6
Distribution of the Respondents According to their career preferences
Career First Second Third
Preferences frequency Percent frequency Percent frequency Percent
HRM 22 37 0 0 13 75
Engineering 14 23 0 0 2 0
Education 1 2 0 0 2 22
Tourism 16 27 14 23 20 3
Vocation 6 10 0 0 3 3
Arts and
1 2 1 2 0 33
Sciences
None 0 0 45 75 30 5
TOTAL 60 100 60 100 60 100
Table 6 shows the top three career preferences of the respondents. Majority of their 1st choice is
HRM course or some related to Hospitality and Management. And for their 2nd choice ‘none’
which comprehend us that the respondents have an assurance for their first choice while Tourism
outnumbered the related preferences having 14 or 23%. And for the 3rd preferences most of their
choice was related from arts and sciences.
Table 4
Respondents’ Perception on childhood aspiration
Standard
Indicators Mean Interpretation
Deviation
Strongly
1. A childhood choice career could change. 4.53 0.65
agree
2. A chosen career commonly came from 4.27 0.99 Strongly
childhood aspirations. agree
3. Childhood is a strong factor to choose a 4.18 1.05
Agree
career.
4. A person may perform well in his own
0.74 Strongly
chosen field if she/he follows his 4.62
Agree
childhood aspirations.
4.4 0.64
Agree
TOTAL
Legend:
4. 4.21 – 5.0 : Strongly Agree
3.41 – 4.20 : Agree
2.61 – 3.40 : Uncertain
1.81 – 2.60 : Disagree
1.0 – 1.80 : Strongly Disagree
Table 5
Respondents’ Perception on according to their Family and Relatives
Standard
Indicators Mean Interpretation
Deviation
Strongly
1. My family will choose my career 4.32 0.97
agree
2. Preferences are made by a relative since 4.32 1.17 Strongly
they will provide for the expenses. agree
3. My family will give me support on their 0.87 Strongly
chosen career for me 4.42 agree
4. I believe that they are the one who are 0.81
Strongly
responsible to choose a career for me 4.55
Agree
since they may know what is best for me.
4.4 0.95
TOTAL Agree
Legend:
4.21 – 5.0 : Strongly Agree
3.41 – 4.20 : Agree
2.61 – 3.40 : Uncertain
1.81 – 2.60 : Disagree
1.0 – 1.80 : Strongly Disagree
Table 6
Respondents’ Perception according to peer influence
Standard
Indicators Mean Interpretation
Deviation
1. Relying on friends will give me an 4.67 Strongly
0.77
assurance to choose my field clearly. agree
2. I do believe that my friends are there for 4.4 0.92
agree
me in any risk.
3. Peers can help me to motivate my chosen 0.9 Strongly
4.37
career. agree
4. I could easily adjust to my chosen field if 4.6
0.91 Agree
my friends are there.
4.51 0.88 Strongly
TOTAL
agree
5. Legend:
4.21 – 5.0 : Strongly Agree
3.41 – 4.20 : Agree
2.61 – 3.40 : Uncertain
1.81 – 2.60 : Disagree
1.0 – 1.80 : Strongly Disagree
Table 7
Respondents’ Perception on in-demand jobs
Standard
Indicators Mean Interpretation
Deviation
1. The best way to choose a career is being 4.5
0.83 Agree
how much demand
4.67 0.63 Strongly
2. It will help me to find job easily.
agree
3. It will help me to gain financially since its 0.87
4.3 Agree
highly demanding.
4. It’s better to follow and sustain ‘societal Strongly
needs’. 0.48 0.72 agree
4.49 0.76 Strongly
TOTAL
agree
Legend:
4.21 – 5.0 : Strongly Agree
3.41 – 4.20 : Agree
2.61 – 3.40 : Uncertain
1.81 – 2.60 : Disagree
1.0 – 1.80 : Strongly Disagree
Table 8
Correlation between Person – Related factors and career preferences
Factors r – value p - value Interpretation
Age 0.0943 0.4736 Not Significant
Sex 0.1119 0.3946 Not Significant
Parent educational
0.7188 0.0329 Significant
attainment
Occupation -0.1371 0.2962 Not Significant
Income 0.0467 0.7231 Not Significant
Legend:
6. p > 0.05 – Not significant
p < 0.05 – Significant
Table 9
Correlation between Person – Related Factors and preferences related variables
Factors r – value p - value Interpretation
Childhood
-0.1473 0.2614 Not Significant
aspiration
Family and relatives -0.03967 0.7635 Not Significant
Peer influence -0.11417 0.3851 Not Significant
In-demand jobs -0.18478 0.1575 Not Significant
Legend:
p > 0.05 – Not significant
p < 0.05 – Significant