1. CHAPTER VI
ANALYSIS AND INTERPRETATION
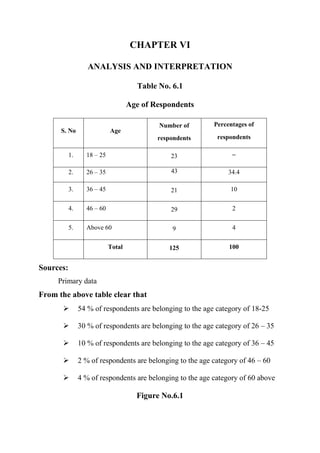
Table No. 6.1
Age of Respondents
Number of Percentages of
S. No Age
respondents respondents
1. 18 – 25 23 =
2. 26 – 35 43 34.4
3. 36 – 45 21 10
4. 46 – 60 29 2
5. Above 60 9 4
Total 125 100
Sources:
Primary data
From the above table clear that
54 % of respondents are belonging to the age category of 18-25
30 % of respondents are belonging to the age category of 26 – 35
10 % of respondents are belonging to the age category of 36 – 45
2 % of respondents are belonging to the age category of 46 – 60
4 % of respondents are belonging to the age category of 60 above
Figure No.6.1
3. Number of Percentages of
S. No Educational
respondents respondents
1. School level 9 18
2. Under Graduate 20 40
3. Post Graduate 5 10
4. Professionals 9 18
5. Others 7 14
Total 50 100
Sources:
Primary data
From the above table it is clear that
18 % of respondents are belonging to the school level category
40 % of respondents are belonging to the Under graduate category
10 % of respondents are belonging to the post Graduate category
18 % of respondents are belonging to the professionals category
14 % of respondents are belonging to the others category
Figure No.6.2
Educational Qualification
4. 14% 18%
18%
10% 40%
School level Under Graduate Post Graduate
Professionals Others
Table No.6.3
Occupation status of the Respondents
Number of Percentages of
S. No Particulars
respondents respondents
5. 1. Govt employee 15 30
2. Private employee 10 20
3. Business man 14 28
4. Home Maker 3 6
5. Students 8 16
Total 50 100
Sources:
Primary data
From the above table it is clear that
30 % of respondents are government employees
20 % of respondents are Private employees
28 % of respondents are business man
6 % of respondents are home makers
16 % of respondents are students.
Figure No. 6.3
Occupation status of the Respondents
6. 35%
30%
30% 28%
25%
20%
20%
16%
15%
10%
6%
5%
0%
Govt employee Private employee Business man
Home Maker Students
Table No. 6.4
Monthly earning of Respondents
S. No Monthly earning Number of Percentages of
7. respondents respondents
1. Below 5000 9 18
2. 5001 – 6000 7 14
3. 6001 – 10000 8 16
4. 10001 – 15000 20 40
5. 15000 above 6 8
Total 50 100
Sources:
Primary data
From the above table it is clear that
18 % of respondents are earning below Rs.5000
14 % of respondents are earning Rs.5001 - 6000
16 % of respondents are earning Rs.6001 - 10000
40 % of respondents are earning Rs.10001 - 15000
8 % of respondents are earning above Rs.15000
Figure No.6.4
Monthly earning of Respondents
8. 8%
18%
14%
40%
16%
Below 5000 5001 – 6000 6001 – 10000
10001 – 15000 15000 above
Table No.6.5
Family Size
S. No Total Number Number of Percentages of
9. respondents respondents
1. 1–3 5 10
2. 4–6 35 70
3. 7–9 10 20
4. Above 10 0 0
Total 50 100
Sources:
Primary data
From the above table it is clear that
10 % of respondents are no of members 1 - 3
70 % of respondents are no of members 4 - 6
20 % of respondents are no of members 7 - 9
0 % of respondents are no of members above 10
Figure No.6.5
Family Size
10. 0%
10%
20%
70%
1–3 4–6 7–9 Above 10
Table No.6.6
Models of Hero Honda
Number of Percentages of
S. No Types
respondents respondents
1. Hero Honda – splendor 8 16
11. 2. Hero Honda – Splendor + 18 36
Hero Honda – super
3. 5 10
splendor
4. Hero Honda – glamour 8 16
5. Passion pro 4 8
6. Others 7 14
Total 50 100
Sources:
Primary data
From the above table it is clear that
16 % of respondents are use Hero Honda – splendor
36 % of respondents are use Hero Honda – splendor +
10 % of respondents are use Hero Honda – super splendor
16 % of respondents are use Hero Honda - glamour
8 % of respondents are use passion pro
14 % of respondents are use others
Figure No.6.6
Models of Hero Honda