1. Journal of Economics and Sustainable Development www.iiste.org
ISSN 2222-1700 (Paper) ISSN 2222-2855 (Online)
Vol.2, No.5, 2011
Socio-Economic Analysis of Child Labor in the Carpet Industry
of Kashmir – A Micro Study
Nengroo Aasif Hussain
Post Graduate Department of Economics, University of Kashmir.
Email asifnengroo.ku@gmail.com
Bhat Arshad Hussain
Post Graduate Department of Economics, University of Kashmir.
Email bhatarshad09@gmail.com
Abstract
In the present paper an attempt has been made to study socio – economic characteristics of working children in
the Carpet Industry of Kashmir. It includes their social profile, age, education, nature of employment, family type,
economic status, child’s contribution to family income etc. Based on the primary data the study reveals most of
the child labors were in the age group of 11 -14 years and among them female child labor outnumber male child
labor. Economic compulsion and educational backwardness of parents were the main reasons forcing children to
leave the school and join labor market at different point of time. Our analysis shows that there is negative
correlation between percentage contribution of child labor to family income and total household income. In other
words as family income increases, the proportion of child’s contribution to family income decreases and vice-
versa.
Keywords: Child labour, sex, education, employment, family, dropout, carpet industry.
1. Introduction
The violation of human rights both in India and elsewhere is condemned. But at the same time, child labor
is practiced all over the world that it has come to be known as a necessary evil in some places. The issue of
child labor should rank top on the global agenda, but, in practice, it is folded by a wall of silence and
perpetuated due to several reasons. Child labor continues to be an affront to the conscience of the world
community. Therefore it is our duty to bring this evil practice to an end in view of ensuring an ideal society
in future. In this paper an attempt has been made to analyze the socio-economic characteristics of working
children in the carpet industry of Kashmir with special reference to block Qoimoh.
1.1 Objectives of the Study
The main objectives of the study are mentioned below:
To study the socio-economic characteristics of working children.
To study family background of working children engaged in the carpet weaving.
To analyze the main factors responsible for dropout.
To analyze the level of earnings of child labor and its impact on household income.
1.2 Methodology
In the present study, multistage sampling has been used. In the first stage Qoimoh block was selected
because of concentration of more carpet weaving units, employment of large number of children in the
carpet weaving industry and easy accessibility. In the second stage it was decided to take the sample of 100
households from five villages (20% from each) which have higher concentration of child labor and where
there is evidence of large scale carpet weaving at the village level. Hence with the help of key persons
(village elders) a sample of five villages via Brazloo, Bachroo, Hum-Shale- Bug, Tangan and Badroo were
selected in the present study. In the third stage a list of carpet weaving units/households from selected
18
2. Journal of Economics and Sustainable Development www.iiste.org
ISSN 2222-1700 (Paper) ISSN 2222-2855 (Online)
Vol.2, No.5, 2011
villages was prepared with the help of village leaders and others having knowledge about carpet weaving
units in the village. Only those households were interviewed were there was at least one child in the age
group of 6-14 years employed in the carpet weaving. Thus a sample of 162 child labors was taken for the
present study. As per objectives of the study parents and employers were interviewed. Personal interviews
and observation methods were resorted to in order to collect relevant data. Interviews of child labors and
employers were conducted with the pre-tested questionnaires and schedules. Personal observation schedule
was also found up by the researcher at the work place of child labor. The data thus collected was analyzed
and has been presented in tabular form.
2. Discussion and analysis
2.1 Sex and Age
It is a well established fact that age plays a dominant role in shaping personality and values of responsibility to
work and to participate in the different walk of life. It was in the above mentioned context that the sex and age
group of child was given an important position in the present study. Distribution of the child labors according to
their sex and age group is presented in the table 1
Table 1: Distribution of the Child Labors according to age and sex.
Age (Years) Male Female Total Percentage
6 0 0 0 0
7 0 0 0 0
8 1 1 2 1.23
9 0 2 2 1.23
10 1 3 4 2.47
11 7 13 20 12.35
12 13 17 30 18.52
13 19 29 48 29.63
14 23 33 56 34.57
Total 64 (39.50) 98 (60.50) 162 100.00
Note: figures in brackets indicate percentage, Source: field survey.
It is obvious from table 1 that 34.57 percent child labors were 14 years old, 29.63 percent, 18.52 percent, and
12.35 percent, were 13, 12, and 11 years old respectively. The data confirm the impression that people usually
send their children for work among 11 years or so. The children working in the age group of 11-14 years were
95.7 percent. The table further shows that female child laborers out number male child laborers in the carpet
weaving sector of the study area. As 60.50 percent child laborers are female and the rest 39.50 percent are male.
The societal preference for male children result in girls being valued less, fed less, educated less but worked harder
and are more disciplined and deprived of every opportunity to broaden their personal, social and intellectual
horizons.
In most economically disadvantaged families, greater the poverty, the more aggravated is the situation of the
female child. In certain families, the rules of permission and restriction on women and female children are much
more stringent which allows for greater exploitation and discrimination. Higher proportion of female children in
the sampled villages can be attributed to socio-economic factors as majority of the households put a ceiling into
female children's aspirations. The notion of temporary membership in the parental home results in the perception
of the female child as a burden to be passed on to another family where she remains an outsider, a household
drudge, a reproductive machine and unpaid worker throughout in life. Further girls’ economic participation goes
unnoticed as they are employed in either family labor or domestic worker in unorganized sector like carpet units.
2.2 Education
Education is of utmost importance for the proper growth and development of the individual. It plays an important
role in one's life in the sense that it helps in shaping the right kind of life style in the human beings. The educational
19
3. Journal of Economics and Sustainable Development www.iiste.org
ISSN 2222-1700 (Paper) ISSN 2222-2855 (Online)
Vol.2, No.5, 2011
standard of children in the sampled villages is presented in table 2.
Table 2: Educational attainment of child labors
S. No. Education SEX Total
Male Female
1 Illiterate 27 42 69 (42.59)
th
2 Up to 5 25 32 57 (35.18)
th
3 Up to 8 12 24 36(22.23)
Total 64 98 162(100)
Note: Figures in brackets indicate percentage.
Source: field survey.
The table 2 shows that a little more than 2/5th (42.59 percent) of the child laborers have never gone to school and
35.18 percent have studied up to 5th standard , while the rest 22.23 percent have studied up to 8th standard . Thus
more than 3/4th (77.77 percent) child laborers are either totally illiterate or have not completed even primary
education.
2.3 Factors Responsible For Drop Out
Those child labors who have attended the school, but discontinued at different point of time, mentioned variety of
reasons The reasons for discontinuance of the studies and those for not attending the school have some
commonality between them. However the reasons of discontinuance are more comprehensive in nature than those
for not attending the school. These reasons are grouped into five broad categories that are briefly defined as under:
2.3.1 Parental and Natural Reasons
It includes death and chronic illness of parents, bad behavior of step father /mother, aged parents ,illness of the
child, bad neighborhood, friends work so 'I work' and child wanting to become skilled craftsmen in the face of
limited or not economic opportunities.
2.3.2 Poverty and Economic Hardship
It includes repeated failure of agriculture, loss in business, no funds with parents to support studies, large size of
family, need to supplement income of the family, and prevalence of unemployment among educated youth.
2.3.3 Social and Customary Reasons
It includes age- old practice of not sending girls to school after a particular age, learning traditional practices of the
family. Parent’s apathy towards education, child required to look after young siblings and pressure of household
chores etc.
2.3.4 Educational Backwardness
It includes repeated failure in a class, lack of basic facilities in schools, fear of teachers, frequent absence of
teachers and hostile political environment.
2.3.5 More Than Two Reasons
More than two reasons given by children are grouped in above categories e.g. Personal, natural and economic
reasons, social, customary reasons, personal natural, social customary and economic, personal natural economic
and educational backwardness etc.
The sex wise information regarding discontinuing the studies is tabulated in table 3. Of the total child labors under
study, nearly 1/4th (26.54 percent) have given two or more reasons for non enrollment or discontinuing their studies
at different point of time. Poverty and bad economic conditions of the family (grouped together) figure as on of the
most important single cause for dropping out of school, the ratio for boys and girls being 2:1 as shown in table 3.
Scholastic backwardness of the child is another important single reason responsible for discontinuance of studies,
as 8.02 percent of both sexes left studies because of this reason whereas 8.16 percent of the girls left studies due to
social and cultural factors.
20
4. Journal of Economics and Sustainable Development www.iiste.org
ISSN 2222-1700 (Paper) ISSN 2222-2855 (Online)
Vol.2, No.5, 2011
Table 3: Child Labors Indicating Reasons of Discontinuing Studies by Sex
Sex NE PN EH SC EB PNEESC Total
Boys 27(42.18) 3(4.68) 12(18.75) 1(1.56) 5(7.81) 16(25.0) 64(100)
Girls 42(42.95) 4(4.08) 9(9.18) 8(8.16) 8(8.16) 27(27.55) 98(100)
Total 69(42.59) 7(4.32) 21(12.96) 9(5.56) 13(8.02) 43(26.54) 162(100)
Note: 1. Figures in brackets indicates percentage. 2. NE - Non Enrollment, PN - Personal & Natural,
EH-Economic Hardship’s, SH- Social & Customary, EB – Educational Backwardness.
From the above analysis it can be safely concluded that reasons for drop out as mentionable by children showed
that economic compulsion and educational backwardness are the two most important factors forcing children to
leave the school at different points of time. Social and customary factors are other important factors especially for
girls to withdraw from the studies. In other words, there is a close relationship between education of the child and
the need for taking up the jobs for helping the families financially and keeping them alive. Perhaps these children
are quite sensitive to the problems faced by their families. Unless these conditions are improved the problems of
literacy and social drop-out will persist and children will be forced to engage in some economic activities to help
and supplement the income of their families.
2.4 Employment
We have divided the child labors in two groups according to their nature of employment. One is self-employed i.e.
those child labors who are working in their house along with other members of the family. The other consists of
children who are employed against wages outside their house. The data presented in table 4 shows the nature of
employment of the sampled child workers according to sex.
Table 4: Employment of Child Workers by Sex
S. No. Category of Employment Boys Girls Total
1 Employed 30(46.87) 26(26.53) 56(34.57)
2 Self employed 34(53.12) 72(73.46) 106(65.43)
Total 64(100) 98(100) 162(100)
Note: Figures in brackets shows %age.
Source: field survey.
The above table reveals that self employed children outnumber employed children and among them girls (73.46
percent) are mostly employed at their home as compared to boys (53.12 percent). Out of the total 162 child labors
106 (65.43 percent) has been found working at their houses and only 56 (34.57 percent) have been employed
outside their house.
3. Family background
The family background of the respondents assumes more significance because it is the family where the child
learns the basic skills to cope with social norms, values and demands. It has its own pattern of interpersonal
relations, acts as an agency for socialization which in turn is affected by the socio-economic conditions of the
family. Within the villages under study the pattern of respondents’ families is varied among different income
groups. The villagers still attach importance to joint family which is breaking up and paves way for nuclear family.
In the present study an attempt has been made to collect salient features of social and economic conditions of the
family with a view to examine its impact on child. Direct observations coupled with the discussions with the
parents of child workers yielded some material on this point.
3.1 Family Type
In general it is believed and experienced that children in a joint family system would be given all protection and
they will be facilitated to seek better education, recreation and the broader requirements of socialization itself. A
21
5. Journal of Economics and Sustainable Development www.iiste.org
ISSN 2222-1700 (Paper) ISSN 2222-2855 (Online)
Vol.2, No.5, 2011
critical look at the studies on child labor in the Indian context would reveal that disintegration of joint family
system especially in rural society paved the way for emergence of child labor practice. It is equally true in the
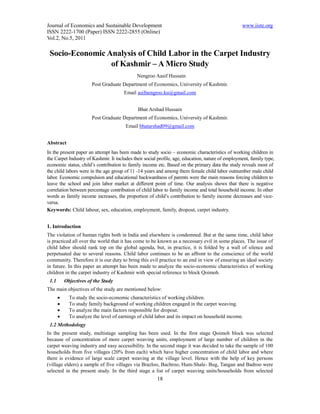
present study also. For instance data depicted in figure 1 shows that nuclear families constitute 87.04 percent to the
total families interviewed followed by joint family which is only 12.96 percent. Hence it is inferred from the
analysis that nuclear family system, which is also an influencing force in child labor practice, is predominant in the
study area. It is revealed from the study that parents in the nuclear family have got greater influence to decide upon
whether a child is to be educated or employed in contrast to the joint family system where old people have a
considerable amount of influence in decision making.
100
87.04
90
80
Respondents (%)
70
60
50 Percentage
40
30
20 12.96
10
0
Joint Family Nuclear Family
Family Type
Fig. 1: Distribution of respondents according to type of family
3.2 Size of family
After knowing the type of the family of child labors, another related query was regarding the number of family
members. Table 5 gives the number of family members in a child workers family.
Table 5: Number of family members
S. No. No. of family member No. of Respondents Percentage
1 1-4 17 10.49
2 4-8 80 49.39
3 8-12 65 40.12
Total 162 100.00
Source: Field study
The table 5 reveals that 80 (49.39 percent) child labors belonged to such families where there were 4-8 members.
Similarly 65 (40.12 percent) child labors belong to families which had 8-12 members. Only 17(10.49 percent)
labors belonged to families which had 1- 4 members. Thus, one can say that in a poor family which had more than
6 members, it is difficult for one person to run the house. Hence there is no other alternative but to send the child to
work rather than to school in order to supplement family income .The children who belonging to the small family
category that is 1- 4 members worked either because there was no earning member in the family or just to enjoy
with friends at the carpet units and at the same time learn some skills. Most of the children of this category added
that they had to work because their father had died and being the eldest child, it was their duty to look after the
family. Thus, we see that whether the child belonged to small or large family, they are forced to work for some
reason or the other.
3.3 Housing Conditions
22
6. Journal of Economics and Sustainable Development www.iiste.org
ISSN 2222-1700 (Paper) ISSN 2222-2855 (Online)
Vol.2, No.5, 2011
The distribution of respondents according to their nature of housing and civic amenities is presented in the tables 6
& 7.
Table 6: Types of Houses of Child Labors
S. No. Type of House No. of Respondents Percentage
1 Pucca 125 77.16
2 Semi-Pucca 34 21.18
3 Kutcha 3 1.85
Total 162 100.00
Source: Field Study.
As shown in table 6 more than 3/4th (77.16 percent) child labors live in Pucca houses where as 21.18 percent live
in the semi-Pucca houses and only 1.85 percent live in Kutcha houses. These figures show relatively good position
occupied by the sample area as against the data available on the overall state of J&K according to census 2001.
Census 2001 has revealed that 55 percent households live in Pucca houses ,32.15 percent in semi-Pucca houses
and 12.85 percent households where living in Kutcha houses in J&K state.
Table 7: Type of Civic Amenities in Child Workers House.
Type of Amenities Number Percentage
WATER
No Regular Facility 12 7.41
Public Tap 122 75.31
Private Tap 28 17.28
Total 162 100.00
ELECTRICITY
No Regular Facility 12 7.41
No Facility 7 4.32
Owned 143 88.27
Total 162 100.0
LATRINE
No Facility (Open Space) 65 40.12
Public 54 33.34
Private 43 26.54
Total 162 100.0
Source: Field Study
Almost all the localities lack one or the other type of basic amenities like water, latrine and electricity. Even where
these facilities are available they are woefully inadequate to meet the needs of residents. Table 7 shows that almost
all the households understudy have the availability of public or private water facilities but there are still 7.41
percent of the households who lack the availability of regular water facilities. All the respondents interviewed who
do not are having the regular availability of water supply were asked to tell the distance from which they have to
bring the water when they feel shortage of water supply. Almost all of them responded that they have to bring it
from a distance of 0.5 to 1 km or even more.
Electricity was available to majority of the respondents’ houses (80.27 percent) but there were still 7.41 percent
households who do not are having the regular availability of electricity and 4.32 percent were un-electrified. Those
23
7. Journal of Economics and Sustainable Development www.iiste.org
ISSN 2222-1700 (Paper) ISSN 2222-2855 (Online)
Vol.2, No.5, 2011
who do not are having the regular availability of electricity were mostly using lanterns or in some cases gas
cylinders or candles to light the houses in the evening. Further it is observed from the field survey that all the
un-electrified houses are recently constructed and taping of service required a considerable amount of money and
time.
The table 7 also shows that out of total 162 child labors, 65 (40.12 percent) were not having the facility of latrines,
54 (33.34 percent) and 43 (26.54 percent) were having the public and private latrines respectively. Those who do
not have the facilities of latrines responded that they have to go in open space outside the residential area at a
distance of about 0.5 to 1 km. Some told that they have to go in other Molalla of the same village where there is the
availability of Latrine.
The overall analysis relating to housing conditions shows that carpet weaving is carried within the four walls and
due to lack of proper ventilation and incapability of basic amenities of life, it affects the eyes and creates other
health problems to all employees in general and the children working in these carpet units, in particular hence there
is a need for the involvement of policy makers to look at the matter seriously and provide all basic amenities of life
to these carpet weaving employees so that they may not suffer in future.
3.4 Education of Parents
Undoubtedly, education plays an important role in the development of an individual, society or nation. The
educated parents plan their families; provide best possible education and recreational facilities to their children.
They are cautions about the nutritional and health requirements of their children and give them love and affection
essential for their growth, development and preparation for the future life. The table 8 reflects the educational level
of parents of child labors.
Table 8: Educational Attainment of Child Labors and Their Fathers
S. no. Level of education Father Child Worker's Education
1 Illiterate 83(59.71) 69(42.59)
th
2 Up to 5 32(23.02) 57(35.18)
th
3 Up to 8 and above 24(17.27) 36(22.23)
Total 139(100) 162(100)
Note: 1. Figures in brackets shows percentage.
2. 23 child labors have same parents; therefore total fathers shown are only 139.
It is only with this end in view that the present study tries to analyzes families who are male dominated, education
of fathers has been alone analyzed. The table 8 shows that a little less than 2/3rd (59.71 percent) of fathers were
illiterate and 23.02 percent have studied up to 5th standard. Only 17.27 percent of them have studied up to 8th
standard and above. Thus more than 4/5th (82.73 percent) of the fathers were either illiterate or have not completed
primary education. When we compare the education of fathers with that of their children, our study shows that
there is a direct relationship between the father’s illiteracy rate and child labor i.e. higher the illiteracy rate of father,
higher is the incidence of child labor.
3.5 Parental Occupation
In the rural areas children inherit their family occupations. The occupation of the parents of child labors has been
presented in figure 2.
24
8. Journal of Economics and Sustainable Development www.iiste.org
ISSN 2222-1700 (Paper) ISSN 2222-2855 (Online)
Vol.2, No.5, 2011
Percentage
Father Less,
3.08
Service, 4.93
Carpet Work,
17.9 Farming, 36.42
Business, 9.25
labour, 28.39
Fig. 2: Occupation of Parents of Child Labors.
The data presented in the figure 2 highlights that majority of parents (36.42 percent) have agriculture as their
occupation, 17.90 percent are involved in the carpet weaving work either in their own house or in other units,
28.39 percent and 9.25 percent are laborers and business men respectively. From this data one can safely conclude
that nearly half (46.29 percent) of the child laborers came from laboring class (both skilled & semi-skilled)
followed by farming class (36.42 percent). It is also revealed that people in service do not like their children to go
for jobs at an early age, most probably because they have learnt from their colleagues about the ill effects of the
child labor.
3.6 Economic Status
It is generally stated that the income level of the households is one of the key determinants of child labor. The
lower the income of the household the greater the incidence of child labors. The income level of the household is
taken here to mean the total monthly income of all members of the family including the earnings of the child
workers. Since the children are not considered very competent to give the exact income of their family. The
information regarding household income has been collected from parents and/or other elder/head of the family e.g.
mother, elder brother, elder sister, grandparents, uncles etc. In few cases the income of the household is gathered
from respondent child worker also. The information in this context has been collected from all the 100 sampled
households of the selected five villages of block Qaimoh of district Kulgam which is presented in the table 9
Table 9: Monthly Income of the Households /Parents (in Rs.) & no. Of child labors
S. No. Income Percentage No. of Child Percentage
labors
1 Up to Rs 2000 22.00 67 41.35
2 Rs 2000-Rs3000 55.00 52 32.09
3 Rs3000-Rs4000 20.00 30 18.51
4 Rs4000-Rs5000& above 3.0 13 8.02
Total 100.00 162 100.00
Source: Field Survey.
The above analysis reveals that more than 3/4th households monthly income is less than Rs 3000 while 20
percents’ monthly income is between Rs 3000 to Rs 4000 and only 3 percent have more than Rs 4000 per month.
25
9. Journal of Economics and Sustainable Development www.iiste.org
ISSN 2222-1700 (Paper) ISSN 2222-2855 (Online)
Vol.2, No.5, 2011
The table also shows that a little more than 2/5th (41.35 percent) of the child labors belong to those households
whose monthly income is below Rs 2000, nearly 1/3rd (32.09 percent) belong to those households whose monthly
income is between Rs 2000 to Rs 3000, 18.51 percent belong to those whose monthly income is between Rs 3000
to Rs 4000 and only 8.02 percent belong to those households whose monthly income is above Rs 4000. Thus the
analysis of the table shows that there is an inverse relationship between households’ monthly income and child
labor i.e. lower the level of income of household, greater is the incidence of the child labor. This indicates that due
to low income of the family children were deprived of the facilities which were essential for their proper growth
and development and on the contrary, they were put to work to supplement their family income. As the parents of
the working children had jobs with low emoluments, it was very difficult for them to educate their children.
3.7 Child's Contribution to Family Income.
Family being the basic social unit, earning members contribute to the family fund so that at least the basic needs of
all family members including non-earnings ones may be satisfied. The distribution of the child labors in terms of
their percentage contribution according to different house hold income groups has been presented in figure 3
Average Contribution of Child Labourers in %
35
Childs'contribution
30
25
20
15
10
5
0
Upto Rs 2000 Rs 2000-Rs3000 Rs3000-Rs4000 Upto Rs5000 &
above
Household income
Fig. 3: Childs’ contribution to family income per month.
The above figure shows that those households whose monthly income is up to Rs 2000, 32 percent (on an
avg.) of their income is contributed by their children working in carpet weaving units, 25 percent to those
households having income between Rs 2000 to Rs 3000, 19 percent and 12 percent income to those
households having income between Rs 3000 to Rs 4000 and above Rs 4000 respectively. Thus our analysis
show that there is a negative correlation between percentage contributions of child labors to their family
income and total household income. In other words, as family income increases, the proportion of child's
contribution to family income decreases and vice-versa.
4. Conclusion
To sum up, it can be seen that the working children in the carpet industry came from socially as well as
economically poor families and they supplemented the family earnings to a limited extent. The poor
economic conditions of the rural segment of the population, poor social background and high dependency
ratio in families force children to take up jobs for contributing to the family income in early life. Economic
compulsion and educational backwardness of parents were the main reasons forcing children to leave the
school and join labor market at different point of time. Our analysis shows that there is negative
correlation between percentage contribution of child labor to family income and total household income. In
other words as family income increases, the proportion of child’s contribution to family income decreases
and vice-versa.
26
10. Journal of Economics and Sustainable Development www.iiste.org
ISSN 2222-1700 (Paper) ISSN 2222-2855 (Online)
Vol.2, No.5, 2011
References
Anandharajakumar P. (2004) Female Child Labour, APH Publishing Corporation, New Delhi.
Bahara, O.S. (2008) Child Labour, Dimensions and Issues, Cyber Tech Publications, New Delhi.
China, S.S (2009) Child Labour and Policy Implications, Regal Publications, New York.
Jain Mahaveer (2006) Child Labour from different perspectives, Manak Publications, New Delhi.
Jha, K.J. (2002) State of Girl Child in India Indus Publishing Company, New Delhi.
Misra, S.N. and Sweta Mishra (2004) Tiny Hands in Unorganised Sector, Shipra Publications, New Delhi.
Mujawar, W.R. (2008) Child Labour Problem, Arise Publications, New Delhi.
Nengroo Aasif Hussain (2010) Child Labor in the carpet industry of Kashmir-A case study of block Qaimoh,
Unpublished M. Phil dissertation, P.G. Department of Economics ,University of Kashmir.
Rao, Prasad M. (2006) Child Labour: Problems and Policy Issues, The Associate Publishers, Ambala.
Shandila, Kummar Tappan (2006) Child Labour: A Global Challenge, Deep and Deep Publications,
New Delhi.
Sharma, Usha (2006) Female Labour in India, Mittal Publications, New Delhi.
27