

Recommended
Recommended
More Related Content
What's hot
What's hot (20)
More from Alex Thompson
More from Alex Thompson (20)
Recently uploaded
Recently uploaded (20)
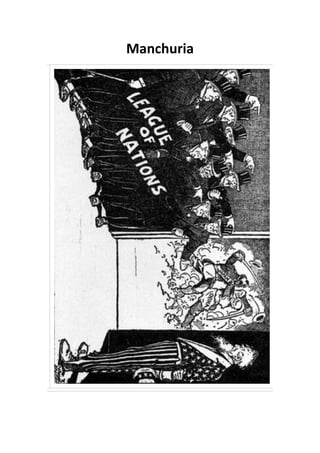
Manchuria cartoons
- 1. Manchuria
- 2. League of Nations – Collective Security
- 3. Japan withdraws from the League of Nations
- 4. Japanese invasion of China
- 5. Militarism
- 9. Japanese invasion of China
- 15. Pearl Harbour