Applied Math 40S Slides April 5, 2007
•
1 like•423 views

Review of our pretest on statistics dealing with normal and binomial distributions and normal approximations of a binomial distribution.

Recommended
Recommended
More Related Content
Similar to Applied Math 40S Slides April 5, 2007
Similar to Applied Math 40S Slides April 5, 2007 (20)
More from Darren Kuropatwa
More from Darren Kuropatwa (20)
Recently uploaded
Recently uploaded (20)
Applied Math 40S Slides April 5, 2007
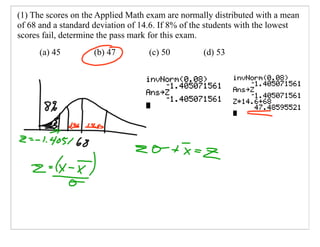
- 1. (1) The scores on the Applied Math exam are normally distributed with a mean of 68 and a standard deviation of 14.6. If 8% of the students with the lowest scores fail, determine the pass mark for this exam. (a) 45 (b) 47 (c) 50 (d) 53
- 2. (2) An inspection procedure at a manufacturing plant involves picking thirty items at random and then accepting the whole lot if at least twenty-five of the thirty items are in perfect condition. If in reality 85% of the whole lot are perfect, what is the probability that the lot will be accepted? (a) 0.186 (b) 0.476 (c) 0.524 (d) 0.667 (e) 0.711
- 3. (3) Tests indicate that the mean life of an electric light bulb in continuous operation is 87 hours with a standard deviation of 7.5 hours. Asuming a normal distribution in a total of 1000 light bulbs, approximately how many light bulbs will last between 72 and 94.5 hours?
- 4. (4) A medical researcher measured the body temperature of 700 people and found that the temperatures were normally distributed with a mean of 36.8°C and a standard deviation of 0.35°C. What is the number of people expected to have a body temperature of 37.5°C or lower?
- 5. (5) As part of its yearly plan, a recreation centre surveyed its community and gathered the following data. A frequency distribution of the number of children under 18 years of age from 100 families selected at random is shown above. (a) Calculate the mean and standard deviation for the number of children in each family. (2 marks) (b) What is the probability of a family having from 2 to 4 children under 18 years of age? (2 marks) (c) Recalculate the answer to part (b) using a normal approximation of the binomial distribution. (2 marks) (d) Why are the answers to part (b) and part (c) slightly different? (2 marks)
- 6. (5) As part of its yearly plan, a recreation centre surveyed its community and gathered the following data. A frequency distribution of the number of children under 18 years of age from 100 families selected at random is shown above. (a) Calculate the mean and standard deviation for the number of children in each family. (2 marks) (b) What is the probability of a family having from 2 to 4 children under 18 years of age? (2 marks)
- 7. (5) As part of its yearly plan, a recreation centre surveyed its community and gathered the following data. A frequency distribution of the number of children under 18 years of age from 100 families selected at random is shown above. (c) Recalculate the answer to part (b) using a normal approximation of the binomial distribution. (2 marks) (d) Why are the answers to part (b) and part (c) slightly different? (2 marks)