SlideShare a Scribd company logo
1 of 82
Download to read offline
Exam
Name___________________________________
MULTIPLE CHOICE. Choose the one alternative that best completes the statement or answers the question.
A graphical display of a data set is given. Identify the overall shape of the distribution.
1) A relative frequency histogram for the heights of a sample of adult women is shown below.
Which of the following best describes the shape of the distribution?
1)
A) Skewed to the right B) Bimodal
C) Skewed to the left D) Symmetric
Answer: D
Explanation: A)
B)
C)
D)
1
Statistics The Art and Science of Learning from Data 3rd Edition Agresti Test Bank
Full Download: http://alibabadownload.com/product/statistics-the-art-and-science-of-learning-from-data-3rd-edition-agresti-test-ba
This sample only, Download all chapters at: alibabadownload.com
Provide an appropriate response.
2) Each year advertisers spend billions of dollars purchasing commercial time on network sports
television. A recent article listed the top 10 leading spenders (in millions of dollars) over a 6 month
period:
Company A $72.0 Company F $26.9
Company B 63.1 Company G 25.0
Company C 54.7 Company H 23.9
Company D 54.3 Company I 23.0
Company E 29.0 Company J 20.0
Which of the following graphs would not be appropriate for displaying this data?
2)
A) Stem-and-leaf plot
B) Dot plot
C) Histogram
D) None of these should be used.
E) Pie chart
Answer: E
Explanation: A)
B)
C)
D)
E)
Select the most appropriate answer.
3) Which of the following graphical methods cannot be used to summarize a quantitative dataset? 3)
A) a bar graph
B) a dot plot
C) a histogram
D) a frequency table
E) a stem-and-leaf plot
Answer: A
Explanation: A)
B)
C)
D)
E)
4) Which of the following numerical summary measures is not sensitive to outliers in a dataset? 4)
A) range
B) interquartile range
C) mean
D) standard deviation
E) none of these
Answer: B
Explanation: A)
B)
C)
D)
E)
2
5) The median is equivalent to which quartile? 5)
A) Q3
B) Q1
C) Q4
D) None of these.
E) Q2
Answer: E
Explanation: A)
B)
C)
D)
E)
6) A set of data collected over time is called a 6)
A) data series.
B) time series.
C) None of these.
D) time bar.
E) time plot.
Answer: B
Explanation: A)
B)
C)
D)
E)
7) A distribution that has a left tail longer than the right tail is considered 7)
A) None of these.
B) skewed to the right.
C) symmetric.
D) skewed to the left.
E) not skewed.
Answer: D
Explanation: A)
B)
C)
D)
E)
8) The salaries of the top 10 highest paid CEOs in the U.S. ranged from 249.42 to 68.95 million dollars.
These data had Q1=71.84, median=101.7 and Q3=139.96. The full data set is given below.
249.42 230.55 139.96 135.53 122.67 80.73 75.33 71.84 69.66 68.95
In a boxplot, what would be the values to which the whiskers extend?
8)
A) -30.34, 242.14 B) 68.95, 249.42 C) 68.95, 230.55 D) -0.48, 203.88
Answer: C
Explanation: A)
B)
C)
D)
3
Provide an appropriate response.
9) The mean is less than the median 9)
A) when the data is symmetric B) when the data is skewed to the left
C) never D) when the data is skewed to the right
Answer: B
Explanation: A)
B)
C)
D)
Select the most appropriate answer.
10) The area of New Jersey Counties, in square miles, ranges from 47 to 819 with Q1=228, median=329
and Q3=476. The full data set follows.
47 103 130 192 221 228 234 267 307 312 329 362 365 423 468 476 500 527 569 642 819
According to the 1.5 × IQR criterion, are there any potential outliers in the data set?
10)
A) yes, 47 and 819 B) no C) yes, 819 D) yes, 47
Answer: B
Explanation: A)
B)
C)
D)
11) Which of the following numerical summary measures cannot be easily approximated from a box
plot?
11)
A) median
B) interquartile range
C) Q1
D) variance
E) range
Answer: D
Explanation: A)
B)
C)
D)
E)
12) What percent of the data falls below Q1? 12)
A) 50% B) 25% C) 33% D) 10% E) 75%
Answer: B
Explanation: A)
B)
C)
D)
E)
4
A graphical display of a data set is given. Identify the overall shape of the distribution.
13) The ages of a group of patients being treated at one hospital for osteoporosis are summarized in the
frequency histogram below.
Which of the following best describes the shape of the distribution?
13)
A) Skewed to the right
B) Multimodal
C) Skewed to the left
D) Bimodal
E) Symmetric
Answer: C
Explanation: A)
B)
C)
D)
E)
Select the most appropriate answer.
14) The characteristics observed to address the questions posed in a study are called 14)
A) variables.
B) parameters.
C) quantities.
D) statistics.
E) categories.
Answer: A
Explanation: A)
B)
C)
D)
E)
Provide an appropriate response.
15) Twenty-four workers were surveyed and asked how long it takes them to travel to work each day.
The data below are given in minutes.
20 35 42 52 65 20 60 49 24 37 23 24 22 20 41 25 28 27 50 47 58 30 32 48
Which of the following shows the data in a stem-and-leaf plot?
15)
5
A)
2
3
4
5
6
0 0 2 3 4 4 5 7 8
0 2 5 7
1 2 7 8 9
0 2 8
0 5
B)
2
3
4
5
6
0 0 0 2 3 4 4 5 7 8
0 2 5 7
1 2 7 8 9
0 2 8
0 5
C)
2
3
4
5
6
0 0 0 0 2 3 4 4 5 7 8
0 2 5 7
1 2 7 8 9
0 2 8
0 5
D)
2
3
4
5
6
0 0 0 2 3 4 4 5 7 8
0 2 5 7
1 2 7 8 9
0 2 8
0
E)
2
3
4
5
6
0 0 0 2 3 4 4 5 7
0 2 5 7 8
1 2 7 8 9
0 2 8
0 5
Answer: B
Explanation: A)
B)
C)
D)
E)
6
A graphical display of a data set is given. Identify the overall shape of the distribution.
16) A stem-and-leaf diagram is given below for the ages of the patients at a hospital.
0
1
2
3
4
5
6
7
8
9
0 4
2 4
0 0 2 3
0 1 2 5 8 9
1 1 2 3 4 5 7 8
0 2 3 6 6 6 8 8 9
0 0 1 2 2 3 5 5 6 6 8 8 8 9 9
2 3 3 3 3 4 5 5 5 5 6 6 7 7 7 8 8 8 8 9 9
0 0 2 2 3 3 5 6 6 7 8 8 9
1 3 4 6 7
Which of the following best describes the shape of the distribution?
16)
A) Skewed to the left B) Bimodal
C) Symmetric D) Skewed to the right
Answer: A
Explanation: A)
B)
C)
D)
Select the most appropriate answer.
17) A distribution that has the right tail longer than the left tail is considered 17)
A) None of these.
B) symmetric.
C) skewed to the right.
D) not skewed.
E) skewed to the left.
Answer: C
Explanation: A)
B)
C)
D)
E)
Provide an appropriate response.
18) At a tennis tournament a statistician keeps track of every serve that a player hits. The statistician
reported that the mean serve speed of a particular player was 98 miles per hour. Suppose that the
statistician indicated that the serve speed distribution was skewed to the left. Which of the
following values is most likely the value of the median serve speed?
18)
A) 93 mph B) 88 mph C) 83 mph D) 103 mph E) 98 mph
Answer: D
Explanation: A)
B)
C)
D)
E)
7
Select the most appropriate answer.
19) A common pattern observed over time is called a/an 19)
A) time plot.
B) mode
C) None of these.
D) trend.
E) time series.
Answer: D
Explanation: A)
B)
C)
D)
E)
20) In human engineering and product design, it is important to consider the weights of people so that
airplanes or elevators are not overloaded. The distribution of weights for adult males in the U.S.
has a mean weight of 173 pounds and a standard deviation of 30 pounds. Suppose the distribution
of weights was skewed to the left. Which of the following values is most likely the value of the
median weight?
20)
A) 173 pounds
B) 163 pounds
C) 188 pounds
D) 143 pounds
E) not enough information to determine
Answer: C
Explanation: A)
B)
C)
D)
E)
Provide an appropriate response.
21) Parking at a large university has become a major issue. University administrators would like to
determine the average time it takes a student to find a parking spot in a university lot. Students
who are willing to participate in the study were asked to record the time between entering campus
and pulling into a parking spot. Which of the following would not be appropriate for displaying
the parking time data?
21)
A) Pie chart
B) Box plot
C) Histogram
D) None of these should be used.
E) Stem-and-leaf plot
Answer: A
Explanation: A)
B)
C)
D)
E)
8
22) The mean score on the SAT writing section was 497 for the a given graduating class. Noting that
this test is scored on a scale of 200 to 800, which of the following is the most plausible value for the
standard deviation of the scores?
22)
A) 200 B) 300 C) -10 D) 10 E) 110
Answer: E
Explanation: A)
B)
C)
D)
E)
Select the most appropriate answer.
23) Which of the following numerical summary measures cannot be negative? 23)
A) Q3
B) z-score
C) mean
D) mode
E) standard deviation
Answer: E
Explanation: A)
B)
C)
D)
E)
9
A graphical display of a data set is given. Identify the overall shape of the distribution.
24) The following histogram depicts the heights of 50 women and 50 men.
Which of the following best describes the shape of the distribution?
24)
A) Symmetric B) Bimodal
C) Skewed to the right D) Skewed to the left
Answer: B
Explanation: A)
B)
C)
D)
Select the most appropriate answer.
25) Which of the following is a continuous variable? 25)
A) number of homeruns in a professional baseball player's career
B) brand of tennis shoe
C) type of fish caught
D) daily high temperature in New York City
E) number of pars in a round of golf
Answer: D
Explanation: A)
B)
C)
D)
E)
26) What percent of the data falls above Q2? 26)
A) 10% B) 25% C) 90% D) 75% E) 50%
Answer: E
Explanation: A)
B)
C)
D)
E)
10
27) The area of New Jersey Counties, in square miles, ranges from 47 to 819 with Q1=228, median=329
and Q3=476. The full data set follows.
47 103 130 192 221 228 234 267 307 312 329 362 365 423 468 476 500 527 569 642 819
In a boxplot, what would be the values to which the whiskers extend
27)
A) 228, 476 B) 47, 819 C) -144, 848 D) -43, 701
Answer: B
Explanation: A)
B)
C)
D)
28) A distribution that shows an overall pattern with two mounds is called 28)
A) None of the these.
B) bimodal.
C) nonmodal.
D) multimodal.
E) unimodal.
Answer: B
Explanation: A)
B)
C)
D)
E)
29) The salaries of the top 10 highest paid CEOs in the U.S. ranged from 249.42 to 68.95 million dollars.
These data had Q1=71.84, median=101.7 and Q3=139.96. The full data set is given below.
249.42 230.55 139.96 135.53 122.67 80.73 75.33 71.84 69.66 68.95
Using the 1.5 x IQR criterion, are there any potential outliers in the data set?
29)
A) yes, 68.95 and 249.42 B) yes, 249.42
C) yes, 68.95 D) no
Answer: B
Explanation: A)
B)
C)
D)
30) One-fourth of the dataset lies 30)
A) below Q3.
B) between Q1 and Q3.
C) above Q2.
D) above Q1.
E) above Q3.
Answer: E
Explanation: A)
B)
C)
D)
E)
11
31) Which of the following is a discrete variable? 31)
A) weight of a newborn baby
B) none of these
C) amount of coffee in an 8-ounce cup
D) number of phones per household
E) time it takes to drive to work
Answer: D
Explanation: A)
B)
C)
D)
E)
32) In human engineering and product design, it is important to consider the weights of people so that
airplanes or elevators aren't overloaded. The weight for adult males in the U.S. follows a
bell-shaped distribution with a mean weight of 173 pounds and a standard deviation of 30 pounds.
What proportion of these weights is between 203 pounds and 263 pounds?
32)
A) 0.1600 B) 0.6800 C) 0.4985 D) 0.1574 E) 0.3170
Answer: D
Explanation: A)
B)
C)
D)
E)
33) A distribution that shows an overall pattern with a single mound is called 33)
A) bimodal.
B) symmetric.
C) nonmodal.
D) unimodal.
E) multimodal.
Answer: D
Explanation: A)
B)
C)
D)
E)
12
34) In human engineering and product design, it is important to consider the weights of people so that
airplanes or elevators are not overloaded. The weight for adult males in the U.S. follows a
bell-shaped distribution with a mean weight of 173 pounds and a standard deviation of 30 pounds.
Using the z-score approach for detecting outliers, which of the following weights would represent
potential outliers in the distribution of U.S. adult male weights?
Weights: 110 pounds, 157 pounds, 281 pounds
34)
A) 110 pounds and 157 pounds are both potential outliers.
B) 110 pounds and 281 pounds are both potential outliers.
C) 281 pounds is the only potential outlier.
D) None of the three weights are potential outliers.
E) 110 pounds, 157 pounds, and 281 pounds are all potential outliers.
Answer: C
Explanation: A)
B)
C)
D)
E)
SHORT ANSWER. Write the word or phrase that best completes each statement or answers the question.
Provide an appropriate response.
35) In order to reduce pollutants from motor vehicle exhaust emissions, three-way catalytic
converters have been installed in new vehicles. However, these converters increase the
level of ammonia in the air. A study was published on the ammonia levels near the exit
ramp of a highway tunnel. The data below represent daily ammonia concentrations (parts
per million) on eight randomly selected days during afternoon drive-time in the summer.
1.53 1.50 1.37 1.51 1.55 1.42 1.41 1.48
Find the median.
35)
Answer: median = 1.49
Explanation:
36) A stock broker has been following different stocks over the last month and has recorded
whether the various stock values are up, unchanged, or down at the end of the month. The
results were
Stock performance up same down
Count 21 7 12
a. What is the variable of interest?
b. Is the variable categorical or quantitative?
c. Which response is the mode?
d. Add proportions to this frequency table.
36)
Answer: a. stock performance
b. categorical
c. up
d.
Stock performance up same down
Count 0.525 0.175 0.300
Explanation:
13
Fill in the blank.
37) A variable is called ____________________ if each observation belongs to one of a set of
categories.
37)
Answer: categorical
Explanation:
38) The five-number summary of a dataset consists of the ____________________,
____________________, ____________________, ____________________, and
____________________.
38)
Answer: minimum value; Q1; median; Q3; maximum value
Explanation:
Provide an appropriate response.
39) A local school district wants to know the number of children under the age of five living in
the district in order to predict future enrollment. Households were randomly sampled in
the district, and the head of household was asked to disclose the number of children under
the age of five living in the household. The results were
Number of children under five 0 1 2 3 4
Count 15 18 12 12 3
a. What is the variable of interest?
b. Is the variable categorical or quantitative?
c. Which response is the mode?
d. Add proportions to this frequency table.
39)
Answer: a. number of children under five
b. discrete
c. 1
d.
Number of children under five 0 1 2 3 4
Count 0.25 0.30 0.20 0.20 0.05
Explanation:
40) The table below shows the unemployment rate in one city from 2003 to 2012.
Year 2003 2004 2005 2006 2007 2008 2009 2010 2011 2012
Unemployment
Rate (Percent) 5.90 5.78 5.45 5.28 5.06 4.88 4.80 4.63 4.44 4.24
a. Construct a time plot for these data.
b. Is there a trend? If so, what kind?
c. Would a histogram more clearly describe the above dataset? Explain.
40)
14
Answer: a. Unemployment Rate 2003-2012
Unemployment
Rate (Percent)
2003 2004 2005 2006 2007 2008 2009 2010 2011
2012
Year
b. There is a clear decreasing trend over time; c. No, a histogram would not depict
the trend in this dataset.
Explanation:
41) Why is it beneficial to label each pie slice of a pie chart with its corresponding percent? 41)
Answer: This clarifies what percent a slice represents and which of two slices is larger.
Explanation:
15
42) The following frequency histogram provides average SO2 (sulfur dioxide) emission rates
from utility and industrial boilers (lb/million Btu) for 47 states (data for Idaho, Alaska, and
Hawaii omitted).
a. Identify the intervals of emission rates used for the plot.
b. Describe the shape of the distribution.
c. What information can you get from the dot plot or stem-and-leaf plot of these data
that you
cannot get from this plot?
d. This histogram shows frequencies. If you were to construct a histogram using the
percentages
for each interval, how (if at all) would the shape of this histogram change?
42)
Answer: a. 0 to 0.49, 0.5 to 0.99, 1.0 to 1.49, 1.5 to 1.99, 2.0 to 2.49, 2.5 to 2.99, 3.0 to 3.49, 3.5 to
3.99, 4.0 to 4.49, 4.5 to 4.99; b. The distribution is skewed to the right. c. You can get
the actual data values from a dot plot or stem-and-leaf plot. d. The shape would
not change.
Explanation:
43) The table below summarizes total enrollment and female enrollment at a pilot training
college for the years 2005 through 2012. The table has been used to construct two different
graphs displayed below the table. Summarize the information that is available from each
of the graphs and discuss the advantages and disadvantages of each graph.
Enrollment at Pilot Training College
43)
16
Year Total Number
of Students
Number of
Female Students
2005 283 20
2006 275 22
2007 265 22
2008 258 24
2009 252 25
2010 248 25
2011 245 27
2012 242 28
Enrollment at Pilot Training College
- - - - Total enrollment
Female enrollment
Female Enrollment as Percentage of
Total Enrollment at Pilot Training College
17
Answer: The first graph shows the total numbers of students for each year as well as the
number of female students. We can see the downward trend in overall enrollment,
the slight upward trend in female enrollment and that female enrollment is small
relative to total enrollment.
However, with both total enrollment and female enrollment on the same graph,
since female enrollment is small relative to total enrollment, the scale is not suitable
for female enrollment and the upward trend in female enrollment is not very clear.
Since both total enrollment and female enrollment are varying with time, the second
graph which shows female enrollment as a percentage of total enrollment may be
more useful. It is clear from this graph that as a percentage of total enrollment,
female enrollment is increasing significantly. However, this graph gives no
indication of the absolute number of students (overall or female) and without
reference to the first graph, we cannot know whether the percentage female
enrollment is increasing because female enrollment is increasing, because male
enrollment is decreasing, or both.
Explanation:
44) 1.The data below represent the number of inches of rain in Chicago, Illinois, during the
month of April for 20 randomly selected years.
2.47 3.97 3.94 4.11 1.14
4.02 3.41 1.85 5.22 0.97
6.14 2.34 3.48 4.77 2.78
4.00 6.28 5.50 7.69 5.79
a. Construct a box plot for these data.
b. Describe the shape of this distribution.
c. Compute and interpret the standard deviation.
44)
Answer: a.
b. The distribution is approximately symmetrical; c. standard deviation = 1.779
inches; The typical distance the data falls from the mean is 1.779 inches.
Explanation:
18
Fill in the blank.
45) The ____________________ is the balance point of the data values; while, the
_____________________ is the midpoint of the ordered data values.
45)
Answer: mean; median
Explanation:
46) The ____________________ is the difference between the largest and the smallest data
values.
46)
Answer: range
Explanation:
47) Extreme observations in the dataset are called ____________________. 47)
Answer: outliers
Explanation:
Provide an appropriate response.
48) The box plot below represents the volume of stock X traded for a random sample of 35
trading days. The volume of a stock is the number of shares traded on a given day.
a. Approximately, what is the median for this dataset?
b. Are there any potential outliers in this dataset? If so, how many?
c. Describe the shape of the distribution. Would the standard deviation or the
interquartile
range be a better measure of spread for this dataset? Explain.
48)
Answer: a. median = about 10 million shares; b. yes, 3; c. The distribution is skewed to the
right. The IQR would be a better measure of spread for this dataset, because it is
highly skewed and contains 3 potential outliers. The standard deviation is not a
resistant measure of variability.
Explanation:
19
Fill in the blank.
49) A variable is called ____________________ if observations on it take numerical values that
represent different magnitudes of the variable.
49)
Answer: quantitative
Explanation:
Identify the abuse of statistics.
50) The graph shows the increases in a certain expenditure over a four-year period. What is
wrong with the graph?
50)
Answer: The bars are not drawn in the correct proportions.
Explanation:
Provide an appropriate response.
51) The scores for a statistics test are as follows:
87 76 94 77 95 96 88 85 66 89
79 98 54 90 83 88 82 55 14 69
Create a stem-and-leaf display for the data. The stem should consist of the tens digit and
range from 1 to 9. The leaves should be drawn aside the appropriate stem based on the
data values.
51)
Answer:
1
2
3
4
5
6
7
8
9
4
4 5
6 9
6 7 9
2 3 5 7 8 8 9
0 4 5 6 8
Explanation:
20
52) A survey investigated exposure to tobacco use in a series of G-rated animated films. Data
on the total tobacco exposure time (in seconds) is below.
223 176 548 37 158 51 299 37 11
165 74 9 2 9 23 206 9
Construct a dot plot for these data. Comment on the shape of the distribution.
52)
Answer: Total Tobacco Exposure Time
Exposure Time (seconds)
This distribution appears to be skewed to the right.
Explanation:
53) A television manufacturer sold three times as many televisions in 2012 as it did in 2002. To
illustrate this fact, the manufacturer draws a pictogram as shown below. The television on
the right is three times as tall and three times as wide as the television on the left.
2002 2012
Why is this pictogram misleading? What visual impression is portrayed by the pictogram?
53)
Answer: Possible answer: The area of the television on the right is nine times (not three times)
the area of the television on the left. The pictogram gives the visual impression that
sales in 2012 were nine times the sales in 2002.
Explanation:
Fill in the blank.
54) A ____________________ is a graph that uses bars to portray the frequencies or the relative
frequencies of the possible outcomes for a quantitative variable.
54)
Answer: histogram
Explanation:
21
Provide an appropriate response.
55) A recent survey investigated exposure to tobacco and alcohol use in a series of G-rated
animated films. Data on the total tobacco exposure time (in seconds) is below.
223 176 548 37 158 51 299 37 11
165 74 9 2 6 23 206 9
Find the Five-Number Summary of Positions.
55)
Answer: minimum = 2 seconds, Q1 = 10 seconds, median = 51 seconds, Q3 = 191 seconds,
and maximum = 548 seconds
Explanation:
56) In order to reduce pollutants from motor vehicle exhaust emissions, three-way catalytic
converters have been installed in new vehicles. However, these converters increase the
level of ammonia in the air. A study was published on the ammonia levels near the exit
ramp of a highway tunnel. The data below represent daily ammonia concentrations (parts
per million) on eight randomly selected days during afternoon drive-time in the summer.
1.53 1.50 1.37 1.51 1.55 1.42 1.41 1.48
Find the mean.
56)
Answer: mean = 1.471
Explanation:
57) The following data represent the number of grams of fat in various breakfast foods.
Breakfast Food Fat (in grams)
Muffin and egg sandwich 12
Muffin, egg, and ham sandwich 22
Muffin, egg, and bacon sandwich 27
Muffin and sausage sandwich 22
Bagel, egg, and ham sandwich 25
Bagel, egg, and bacon sandwich 30
Bagel, egg, and sausage sandwich 32
Bagel, egg, sausage, and cheese sandwich 37
Bagel, egg, ham, and cheese sandwich 27
Bagel, egg, bacon, and cheese sandwich 31
Bagel 11
Pancakes platter 16
Pancakes and eggs platter 21
Pancakes, eggs, and bacon platter 32
Yogurt 2
Construct a dot plot for these data.
57)
Answer:
Explanation:
22
Fill in the blank.
58) The ____________________ for a data value is the number of standard deviations that it
falls from the mean.
58)
Answer: z-score
Explanation:
Provide an appropriate response.
59) The histogram below shows the number of car accidents occurring in one city in each of the
years 2007 through 2012. The number of accidents dropped in 2009 after a new speed limit
was imposed. Why is the graph misleading? How would you redesign the graph to be less
misleading?
2007 2008 2009 2010 2011 2012
Year
59)
Answer: Possible answer: The graph is misleading because it is truncated. The scale on the
vertical axis should start at zero so that the bars will be in the correct proportions. A
part of the vertical axis could be omitted but the symbol // should then be used to
warn the reader of the modified axis.
Explanation:
23
60) The enrollment for fall semester at University X is as follows.
Enrollment Count
Undergraduate 24,814
Graduate/Professional 8386
Independent Study 20
a. Construct a bar graph for these data.
b. Would a dot plot or a stem-and-leaf plot make sense for these data? Explain.
60)
Answer: a.
b. No, both a dot plot and a stem-and-leaf plot are used on small quantitative
datasets.
Explanation:
61) In order to reduce pollutants from motor vehicle exhaust emissions, three-way catalytic
converters have been installed in new vehicles. However, these converters increase the
level of ammonia in the air. A study was published on the ammonia levels near the exit
ramp of a highway tunnel. The data below represent daily ammonia concentrations (parts
per million) on eight randomly selected days during afternoon drive-time in the summer.
1.53 1.50 1.37 1.51 1.55 1.42 1.41 1.48
Construct a dot plot for these data.
61)
Answer:
Explanation:
24
62) A sample of 324 randomly selected doctors was asked to indicate the category that best
described how often they used the Internet. The results follow.
Internet Usage Pattern Count
Never 31
Rarely (about 3 times per year) 15
Occasionally (about once a month) 52
Often (about once a week) 109
Daily 117
a. Construct a pie chart for these data.
b. In creating a bar graph of these data, would it be more useful to list the patterns as
given in the table above or in the order of a Pareto chart?
62)
Answer: a.
b. Since the categories of Internet usage pattern have a natural order from never
to daily, it makes more sense to leave the categories in this natural order rather
than ordering them from the tallest bar to the shortest bar.
Explanation:
63) The table below summarizes total enrollment and female enrollment at a pilot training
college for the years 2005 through 2012. The table has been used to construct two different
graphs displayed below the table. Summarize the information that is available from each
of the graphs and discuss the advantages and disadvantages of each graph.
Enrollment at Pilot Training College
63)
25
Year Total Number
of Students
Number of
Female Students
2005 283 20
2006 275 22
2007 265 22
2008 258 24
2009 252 25
2010 248 25
2011 245 27
2012 242 28
Enrollment at Pilot Training College
- - - - Total enrollment
Female enrollment
Female Enrollment at Pilot Training College
26
Answer: The first graph shows the total numbers of students for each year as well as the
number of female students. We can see the downward trend in overall enrollment,
the slight upward trend in female enrollment and that female enrollment is small
relative to total enrollment. However, with both total and female enrollment on the
same graph, since female enrollment is small relative to total enrollment, the scale is
not suitable for female enrollment and the upward trend in female enrollment is not
very clear. This upward trend is much clearer from the second graph which shows
female enrollment alone, However this graph gives no indication of how female
enrollment compares to total enrollment.
Explanation:
64) The following data provide the daily protein intake (in grams of protein per kilogram of
body weight) for 20 competitive athletes.
1.4 2.2 2.7 1.5 2.3 1.7 2.3 1.5 1.8 2.8
1.8 1.9 2.0 2.3 1.5 1.9 1.7 1.8 1.6 3.0
Find the mean and the median. Which measure of center seems more appropriate for this
dataset? Explain.
64)
Answer: mean = 1.985, median = 1.85; The median seems more appropriate for this dataset,
because this dataset is highly skewed to the right.
Explanation:
27
65) A sample of recent car buyers was asked to identify what they considered to be the most
useful source of information about the cars they purchased. The results follow.
Source Count
Consumer guide 172
Dealership 93
Word of mouth 40
Internet 26
a. Construct a pie chart for these data.
b. In creating a bar graph of these data, would it be more useful to list the sources of
consumer information in the same order in which they appear in the table above or in
the form of a Pareto chart?
65)
Answer: a.
b. Since it is of interest to know which categories were more useful to consumers,
ordering the categories as in a Pareto chart would be more appropriate than
listing them alphabetically.
Explanation:
28
66) The bar graph below shows the average cost of renting a studio in one city in each of the
years 2008 through 2012.
2008 2009 2010 2011 2012
Year
By what percentage does the average price increase from 2008 to 2009? Obtain a truncated
version of the graph by sliding a piece of paper over the bottom of the graph so that the
bars start at 300. In the truncated graph, by what percentage does the price appear to
increase from 2008 to 2009? Why is the truncated graph misleading?
66)
Answer: Possible answer: The average price increases by 25% from 2008 to 2009. Using the
truncated graph, the price appears to double from 2008 to 2009 (i.e. it appears to
increase by 100%). Using the truncated graph, the differences between the bars seem
bigger (relatively) than they really are.
Explanation:
67) The Highway Patrol, using radar, clocked the speeds (in mph) of 30 passing motorists at a
checkpoint. The results are listed below. Construct a dot plot for the data.
44 38 41 50 36 36 43 42 49 48
35 40 37 41 43 50 45 45 39 38
50 41 47 36 35 40 42 43 48 33
67)
Answer:
Explanation:
29
MULTIPLE CHOICE. Choose the one alternative that best completes the statement or answers the question.
68) The heights (in inches) of 20 adult males are listed below. Find the range of the data.
70 72 71 70 69 73 69 68 70 71
67 71 70 74 69 68 71 71 71 72
68)
A) 7 B) 6.5 C) 5.5 D) 6 E) 5
Answer: A
Explanation: A)
B)
C)
D)
E)
The bar graph below shows the political party affiliation of 1000 registered U.S. voters.
69) What percentage of the 1000 registered U.S. voters belongs to one of the two traditional parties
(Democratic and Republican)?
69)
A) 40% B) 75% C) 35% D) 25% E) 50%
Answer: B
Explanation: A)
B)
C)
D)
E)
30
A survey was conducted to determine how people rated the quality of programming available on television. Respondents
were asked to rate the overall quality from 0 (no quality at all) to 100 (extremely good quality). The stem-and-leaf display
of the data is shown below.
Stem Leaves
3 2 6
4 0 3 4 7 8 9 9 9
5 0 1 1 2 3 4 5
6 1 2 5 6 6
7 1 7
8
9 3
70) Identify the minimum quality rating. 70)
A) 2 B) 32 C) 26 D) 0
Answer: B
Explanation: A)
B)
C)
D)
31
Provide an appropriate response.
71) The following is a partial histogram illustrating the final course grade distribution for an
introductory level statistics class with 160 students. No student scored below 50. The grading scale
is as follows.
Course Grading Scale
90-99 A
80-89 B
70-79 C
60-69 D
50-59 F
The data for a grade of "D" is missing. What percentage of the students received a grade of "D?"
71)
A) 5%
B) 16%
C) cannot be determined from the information given
D) 10%
Answer: D
Explanation: A)
B)
C)
D)
32
A sporting goods retailer conducted a customer survey to determine its customers primary reason for shopping at their
store. The results are shown in the graph below.
72) What percentage of the customers gave "prices" or "merchandise" as their answer? 72)
A) 0.10 B) 0.71 C) 0.20 D) 0.30 E) 0.14
Answer: B
Explanation: A)
B)
C)
D)
E)
Provide an appropriate response.
73) According to the Empirical Rule, approximately 95% of the data values from a bell-shaped
distribution fall within _______ standard deviations of the mean.
73)
A) 1 B) 0.5 C) 3 D) 2.5 E) 2
Answer: E
Explanation: A)
B)
C)
D)
E)
33
A nurse measured the blood pressure of each person who visited her clinic. Following is a relative-frequency histogram
for the systolic blood pressure readings for those people aged 25 to 40. Use the histogram to answer the question. The
blood pressure readings were given to the nearest whole number.
74) Approximately what percentage of the people aged 25-40 had a systolic blood pressure reading of
at least 110 but less than 120?
74)
A) 35% B) 3.5% C) 30% D) 15% E) 0.35%
Answer: A
Explanation: A)
B)
C)
D)
E)
34
A sporting goods retailer conducted a customer survey to determine its customers primary reason for shopping at their
store. The results are shown in the graph below.
75) What response represents the mode? 75)
A) Prices B) Other C) Merchandise D) Convenience
Answer: C
Explanation: A)
B)
C)
D)
Identify potential outliers, if any, for the given data.
76) The test scores of 15 students are listed below.
36 40 48 65 67
69 70 73 75 76
79 82 87 90 99
76)
A) 36, 40 B) None C) 36 D) 36, 99 E) 90, 99
Answer: C
Explanation: A)
B)
C)
D)
E)
The following data show the number of laps run by each participant in a timed running race:
46 65 55 43 51 48 57 30 43 49 32 56
77) If the stems are 3, 4, 5 and 6, how many leaves are on the "4 stem"? 77)
A) 5 B) 0 C) 4 D) 1
Answer: A
Explanation: A)
B)
C)
D)
35
The heights (in inches) of 30 adult males are listed below. A frequency distribution show the frequency and relative
frequency using five classes.
70 72 71 70 69 73 69 68 70 71
67 71 70 74 69 68 71 71 71 72
69 71 68 67 73 74 70 71 69 68
Height (in inches) Frequency Relative Frequency
67.0-68.4 6 0.20
68.5-69.9 5 0.167
70.0-71.4 13 0.433
71.5-72.9 2 0.067
73.0-74.4 4 0.133
78) What percentage of the 30 adult males had heights between 73 and 74.4 inches? 78)
A) 0.133
B) 13.3
C) 4
D) 0.04
E) none of these
Answer: B
Explanation: A)
B)
C)
D)
E)
36
Construct a pie chart illustrating the given data set.
79) After reviewing a movie, 900 people rated the movie as excellent, good, or fair. The following data
give the rating distribution.
Excellent Good Fair
180 450 270
79)
A) B)
C) D)
Answer: C
Explanation: A)
B)
C)
D)
Answer true or false.
80) Dot plots and stem-and-leaf plots are often used to summarize small quantitative datasets. 80)
A) True B) False
Answer: A
Explanation: A)
B)
37
Provide an appropriate response.
81) SAT verbal scores are normally distributed with a mean of 433 and a standard deviation of 90. Use
the Empirical Rule to determine what percent of the scores lie between 433 and 523.
81)
A) 51% B) 34% C) 68% D) 49.9% E) 47.5%
Answer: B
Explanation: A)
B)
C)
D)
E)
Classify as categorical or qualitative data.
82) Your statistics teacher has gathered information on each of the students in your class in order to
illustrate the difference between categorical and quantitative variables. For each student, she has
recorded their major, gender, age and height. The variable "age" is an example of what type of
variable?
82)
A) Quantitative B) Categorical
Answer: A
Explanation: A)
B)
The heights (in inches) of 30 adult males are listed below. A frequency distribution show the frequency and relative
frequency using five classes.
70 72 71 70 69 73 69 68 70 71
67 71 70 74 69 68 71 71 71 72
69 71 68 67 73 74 70 71 69 68
Height (in inches) Frequency Relative Frequency
67.0-68.4 6 0.20
68.5-69.9 5 0.167
70.0-71.4 13 0.433
71.5-72.9 2 0.067
73.0-74.4 4 0.133
83) Identify the variable. 83)
A) Relative frequency
B) Number of classes
C) Frequency
D) Height
E) Number of adult males
Answer: D
Explanation: A)
B)
C)
D)
E)
38
Provide an appropriate response.
84) The professor of economics at a small Texas University wanted to determine what year in school
students were taking his tough economics course. Shown below is a pie chart of the results.
What percentage of the class took the course prior to reaching their senior year?
84)
A) 14% B) 54% C) 86% D) 30% E) 44%
Answer: C
Explanation: A)
B)
C)
D)
E)
85) A competency test has scores with a mean of 69 and a standard deviation of 4. A histogram of the
data shows that the distribution is normal. Use the Empirical Rule to find the percentage of scores
between 61 and 77.
85)
A) 68% B) 77% C) 99.7% D) 50% E) 95%
Answer: E
Explanation: A)
B)
C)
D)
E)
Classify the variable as either discrete or continuous.
86) Your statistics teacher has gathered information on each of the students in your class in order to
illustrate the difference between discrete and continuous variables. For each student, she has
recorded their height, number of credit hours completed and the time it took for them to complete
their last exam. The variable "number of credit hours completed" is
86)
A) Discrete B) Continuous
Answer: A
Explanation: A)
B)
39
Provide an appropriate response.
87) The following is a time plot of wine exports (in millions of gallons) in a certain country for the past
15 years. Is there a trend evident in the data?
87)
A) yes, decreasing trend B) no trend evident C) yes, increasing trend
Answer: C
Explanation: A)
B)
C)
Answer true or false.
88) If a distribution is very highly skewed, the mean is usually preferred over the mean because it
better represents what is typical.
88)
A) True B) False
Answer: B
Explanation: A)
B)
Find the original data from the stem-and-leaf plot.
89)
Stem Leaves
8 5 8
9 1 8
10 5 5
89)
A) 81, 88, 81, 98, 105, 105
B) 85, 88, 91, 91, 105, 105
C) 85, 81, 88, 91, 101, 105
D) 85, 88, 91, 98, 105, 105
E) 81, 85, 81, 98, 108, 105
Answer: D
Explanation: A)
B)
C)
D)
E)
40
Provide an appropriate response.
90) The weight at birth of males has a mean value of 3.53 kg with a standard deviation of 0.58. What
birth weight has a z-score of 0.81?
90)
A) -3.06 kg B) -4 kg C) 2.52 kg D) 4 kg
Answer: D
Explanation: A)
B)
C)
D)
Find the median for the given sample data.
91) A store manager kept track of the number of newspapers sold each week over a seven-week
period. The results are shown below.
95, 38, 221, 122, 258, 237, 233
Find the median number of newspapers sold.
91)
A) 172 newspapers
B) 233 newspapers
C) 122 newspapers
D) 258 newspapers
E) 221 newspapers
Answer: E
Explanation: A)
B)
C)
D)
E)
Answer true or false.
92) A numerical summary of the observations is called resistant if extreme observations have little, if
any, influence on its value.
92)
A) True B) False
Answer: A
Explanation: A)
B)
Classify as categorical or qualitative data.
93) Your statistics teacher has gathered information on each of the students in your class in order to
illustrate the difference between categorical and quantitative variables. For each student, she has
recorded their major, gender, age and height. The variable "major" is an example of what type of
variable?
93)
A) Quantitative B) Categorical
Answer: B
Explanation: A)
B)
41
The following data show the number of laps run by each participant in a timed running race:
46 65 55 43 51 48 57 30 43 49 32 56
94) What is the mode for number of laps run? 94)
A) 30 B) 65 C) 3 D) 43
Answer: D
Explanation: A)
B)
C)
D)
Provide an appropriate response.
95) The age at inauguration for 15 presidents of various organizations are below. Find the median age.
Smith 54
Williams 46
Blake 64
Carroll 69
Carter 52
Johnson 61
Jones 56
Brown 55
Davis 43
Miller 62
Wilson 60
Taylor 51
Anderson 54
Thomas 51
White 55
95)
A) 54.5 years B) 56 years C) 55.5 years D) 55 years
Answer: D
Explanation: A)
B)
C)
D)
42
96) For the distribution shown below, identify the mean, median, and mode 96)
A) A = mode, B = median, C = mean
B) A = median, B = mean, C = mode
C) A = median, B = mode, C = mean
D) A = mean, B = mode, C = median
E) A = mode, B = mean, C = median
Answer: A
Explanation: A)
B)
C)
D)
E)
The heights (in inches) of 30 adult males are listed below. A frequency distribution show the frequency and relative
frequency using five classes.
70 72 71 70 69 73 69 68 70 71
67 71 70 74 69 68 71 71 71 72
69 71 68 67 73 74 70 71 69 68
Height (in inches) Frequency Relative Frequency
67.0-68.4 6 0.20
68.5-69.9 5 0.167
70.0-71.4 13 0.433
71.5-72.9 2 0.067
73.0-74.4 4 0.133
97) Which category of heights represents the mode? 97)
A) 73.0-74.4 B) 70.0-71.4 C) 71.5-72.9 D) 68.5-69.9 E) 67.0-68.4
Answer: B
Explanation: A)
B)
C)
D)
E)
43
Answer true or false.
98) The median is always the midpoint of Q1 and Q3. 98)
A) True B) False
Answer: B
Explanation: A)
B)
Find the five-number summary for the given data.
99) The normal annual precipitation (in inches) is given below for 21 different U.S. cities.
39.1 32.9 18.5 35.6 27.1 27.8 8.6
23.5 42.6 34.7 20.2 12.0 5.1 13.9
22.6 10.9 16.4 25.4 17.2 14.7 51.7
99)
A) 5.1, 14.1, 22.6, 31.625, 51.7 inches
B) 5.1, 14.1, 21.3, 31.625, 51.7 inches
C) 5.1, 14.7, 21.3, 33.8, 51.7 inches
D) 5.1, 14.7, 22.6, 35.6, 51.7 inches
E) 5.1, 14.3, 22.6, 33.8, 51.7 inches
Answer: E
Explanation: A)
B)
C)
D)
E)
Determine the quartile, percentile or interquartile range as specified.
100) The test scores of 15 students are listed below. Find the first quartile, Q
1
.
44 46 51 57 60
63 65 70 75 76
85 87 90 94 95
100)
A) 53.4 B) 54.0 C) 57.0 D) 58.5 E) 55.5
Answer: C
Explanation: A)
B)
C)
D)
E)
44
Provide an appropriate response.
101) The normal monthly precipitation (in inches) for September is listed for 20 different U.S. cities. Find
the mean of the data.
3.5 1.6 2.4 3.7 4.1
3.9 1.0 3.6 4.2 3.4
3.7 2.2 1.5 4.2 3.4
2.7 0.4 3.7 2.0 3.6
101)
A) 2.70 in. B) 2.80 in. C) 3.27 in. D) 2.94 in. E) 3.09 in.
Answer: D
Explanation: A)
B)
C)
D)
E)
Classify the variable as either discrete or continuous.
102) Your statistics teacher has gathered information on each of the students in your class in order to
illustrate the difference between discrete and continuous variables. For each student, she has
recorded their height, number of credit hours completed and the time it took for them to complete
their last exam. The variable "height" is
102)
A) Discrete B) Continuous
Answer: B
Explanation: A)
B)
Answer true or false.
103) The frequency for a particular category is the proportion of observations that fall in the category. 103)
A) True B) False
Answer: B
Explanation: A)
B)
104) The sum of the deviations, the differences between the observations and the sample mean (x - x),
is always equal to zero.
104)
A) True B) False
Answer: A
Explanation: A)
B)
45
A sample of fifty motorists was taken on a Federal highway where the speed limit was 60 miles per hour. A dot plot of
their speeds is shown below.
105) Would a pie chart be appropriate for displaying this data? 105)
A) Yes B) No
Answer: B
Explanation: A)
B)
Provide an appropriate response.
106) Use the following summary information for a data set of 100 observations to determine whether the
data set is likely to be bell-shaped, skewed to the right or skewed to the left.
Mean = 120, s=22, Minimum=37, Maximum=136
106)
A) bell-shaped
B) unable to determine from the information given
C) skewed to the right
D) skewed to the left
Answer: D
Explanation: A)
B)
C)
D)
Classify the variable as either discrete or continuous.
107) The following table shows the heights of the five tallest mountains in North America.
Mountain Height (ft) Rank
McKinley 20,320 1
Logan 19,850 2
Citlaltepec 18,700 3
St. Elias 18,008 4
Popocatepetl 17,930 5
The heights given in the second column represent what type of data?
107)
A) Discrete B) Continuous
Answer: B
Explanation: A)
B)
46
A sample of fifty motorists was taken on a Federal highway where the speed limit was 60 miles per hour. A dot plot of
their speeds is shown below.
108) What is the variable of interest? 108)
A) number of speeding motorists
B) motorist's speed
C) whether or not a motorist was speeding
D) number of motorists on the Federal highway
Answer: B
Explanation: A)
B)
C)
D)
Provide an appropriate response.
109) The distribution of salaries of professional basketball players is skewed to the right. Which measure
of central tendency would be the best measure to determine the location of the center of the
distribution?
109)
A) Standard Deviation
B) Mode
C) Range
D) Mean
E) Median
Answer: E
Explanation: A)
B)
C)
D)
E)
47
110) The following is a time plot of infant mortality rates in a certain country from the years 1960 to
2011. Is there an obvious trend in the data?
110)
A) yes, increasing trend B) no trend evident C) yes, decreasing trend
Answer: C
Explanation: A)
B)
C)
Answer true or false.
111) Bar graphs and pie charts are graphical methods that are often used in summarizing quantitative
data.
111)
A) False B) True
Answer: A
Explanation: A)
B)
Find the five-number summary for the given data.
112) The salaries (in millions of dollars) of the top 10 highest paid CEOs in the U.S.
249.42 230.55 139.96 135.53 122.67 80.73 75.33 71.84 69.66 68.95
112)
A) 68.95, 71.84, 122.67, 139.96, 230.55
B) 0, 71.84, 122.67, 139.96, 230.55
C) 68.95, 71.84, 101.7, 139.96, 230.55
D) -0.48, 71.84, 101.7, 139.96, 203.88
E) 68.95, 71.84, 101.7, 139.96, 249.42
Answer: C
Explanation: A)
B)
C)
D)
E)
48
Provide an appropriate response.
113) Use the following summary information for a data set of 100 observations to determine whether the
data set is likely to be bell-shaped, skewed to the right or skewed to the left.
Mean = 120, s=22, Minimum=103, Maximum=170
113)
A) skewed to the left
B) unable to determine from the information given
C) skewed to the right
D) bell-shaped
Answer: C
Explanation: A)
B)
C)
D)
114) Brandon kept track of the number of hours he spent exercising each week for four months. The
results are shown below. Find the mean number of hours Brandon spent exercising per week.
Round your answer to two decimal places.
7.50 8.20 7.10 7.90 8.00 7.50
7.80 7.10 7.30 7.50 7.90 8.90
7.10 8.20 8.20 8.20 8.00 7.80
114)
A) 8.01 B) 7.38 C) 8.25 D) 7.30 E) 7.79
Answer: E
Explanation: A)
B)
C)
D)
E)
49
The payroll amounts for several major-league baseball teams are shown below. Answer the following question
concerning this graph.
115) What percentage of the payrolls exceed $30 million? (Assume that no payroll is exactly $30
million.)
115)
A) 46% B) 19% C) 50% D) 12 E) 13
Answer: C
Explanation: A)
B)
C)
D)
E)
50
A nurse measured the blood pressure of each person who visited her clinic. Following is a relative-frequency histogram
for the systolic blood pressure readings for those people aged 25 to 40. Use the histogram to answer the question. The
blood pressure readings were given to the nearest whole number.
116) Given that 200 people were aged between 25 and 40, approximately how many had a systolic blood
pressure reading less than 130?
116)
A) 150 B) 25 C) 100 D) 50 E) 75
Answer: A
Explanation: A)
B)
C)
D)
E)
51
Provide an appropriate response.
117) The following plot illustrates a time series of unemployment rates in a certain country between the
years 1953 and 2012. Is a trend evident in the data set?
117)
A) yes, increasing trend B) no trend evident C) yes, decreasing trend
Answer: B
Explanation: A)
B)
C)
Construct a boxplot as specified.
118) The weekly salaries (in dollars) of 24 randomly selected employees of a company are shown below.
Construct a boxplot for the data set. What is the shape of the distribution?
310 320 450 460 470 500 520 540
580 600 650 700 710 840 870 900
1000 1200 1250 1300 1400 1720 2500 3700
118)
A)
Bell-shaped
B)
Skewed-right
52
C)
Skewed-left
D)
Skewed-right
E)
Skewed-left
Answer: D
Explanation: A)
B)
C)
D)
E)
Provide an appropriate response.
119) Last year, batting averages in the National League averaged 0.257 with a high of 0.323 and a low of
0.250 (minimum 250 at bats). Based on this information, which measure of variation could be
calculated?
119)
A) none of the above
B) range
C) standard deviation
D) variance
E) mode
Answer: B
Explanation: A)
B)
C)
D)
E)
53
Determine the quartile, percentile or interquartile range as specified.
120) The test scores of 19 students are listed below. Find the interquartile range.
91 46 86 70 61
63 97 56 90 77
82 83 52 88 74
43 92 94 67
120)
A) 27 B) 28.5 C) 25.5 D) 29.5 E) 29
Answer: E
Explanation: A)
B)
C)
D)
E)
Classify the variable as either discrete or continuous.
121) The following table shows the heights of the five tallest mountains in North America.
Mountain Height (ft) Rank
McKinley 20,320 1
Logan 19,850 2
Citlaltepec 18,700 3
St. Elias 18,008 4
Popocatepetl 17,930 5
The ranks given in the third column represent what type of data?
121)
A) Continuous B) Discrete
Answer: B
Explanation: A)
B)
Classify as categorical or qualitative data.
122) A survey of automobiles parked in the student and staff lots at a large college recorded the make
and model of the automobiles. The variable "make" is:
122)
A) Categorical B) Quantitative
Answer: A
Explanation: A)
B)
54
Provide an appropriate response.
123) For the stem-and-leaf plot below, find the range of the data set.
1
2
2
3
3
4
4 5
6 6 6 7 8 9
7 7 7 8 8 9 9 9
0 1 1 2 3 4 4 5
6 6 6 7 8 8 9
0 0
123)
A) 26 B) 40 C) 36 D) 34 E) 14
Answer: A
Explanation: A)
B)
C)
D)
E)
124) The cost for one semester's books (in dollars) are given below for a sample of five college students.
Calculate the sample standard deviation, s of the book costs. Round to the nearest hundredth when
necessary.
340, 170, 145, 420, 120
124)
A) 118.93 B) 132.97 C) 17,680 D) 300
Answer: B
Explanation: A)
B)
C)
D)
A sample of fifty motorists was taken on a Federal highway where the speed limit was 60 miles per hour. A dot plot of
their speeds is shown below.
125) What proportion of the motorists were speeding? 125)
A) 0.22 B) 2 C) 0.04 D) 0.72 E) 0.18
Answer: E
Explanation: A)
B)
C)
D)
E)
55
Determine the quartile, percentile or interquartile range as specified.
126) The cholesterol levels (in milligrams per deciliter) of 30 adults are listed below. Find the
interquartile range for the cholesterol level of the 30 adults.
154 156 165 165 170 171 172 180 184 185
189 189 190 192 195 198 198 200 200 200
205 205 211 215 220 220 225 238 255 265
126)
A) 30 B) 31 C) 211 D) 111 E) 180
Answer: B
Explanation: A)
B)
C)
D)
E)
The bar graph below shows the political party affiliation of 1000 registered U.S. voters.
127) Which response represents the mode? 127)
A) Independent
B) Democrat
C) 40%
D) 10%
E) Republican
Answer: B
Explanation: A)
B)
C)
D)
E)
56
A survey was conducted to determine how people rated the quality of programming available on television. Respondents
were asked to rate the overall quality from 0 (no quality at all) to 100 (extremely good quality). The stem-and-leaf display
of the data is shown below.
Stem Leaves
3 2 6
4 0 3 4 7 8 9 9 9
5 0 1 1 2 3 4 5
6 1 2 5 6 6
7 1 7
8
9 3
128) What percentage of the respondents rated overall television quality as very good (regarded as
ratings of 80 and above)?
128)
A) 4% B) 3% C) 12% D) 1% E) 32%
Answer: A
Explanation: A)
B)
C)
D)
E)
Provide an appropriate response.
129) The heights (in inches) of 10 adult males are listed below. Find the standard deviation, s. Round to
the nearest hundredth.
70 72 71 70 69 73 69 68 70 71
129)
A) 2.23 B) 2.01 C) 20.10 D) 1.42 E) 1.49
Answer: E
Explanation: A)
B)
C)
D)
E)
57
Find the median for the given sample data.
130) Health care issues are receiving much attention in both academic and political arenas. A sociologist
recently conducted a survey of senior citizens whose net worth is too high to qualify for Medicaid
but who have no private health insurance. The ages of 25 uninsured senior citizens were as follows:
67 72 65 75 85 73
60 88 64 89 68 91
75 61 80 62 67 80
69 72 59 86 74 63 81
Find the median of the observations.
130)
A) 68 B) 73 C) 72 D) 69 E) 72.5
Answer: C
Explanation: A)
B)
C)
D)
E)
Provide an appropriate response.
131) Results from a survey of 7116 vehicle types on the campus of State College are summarized in the
following pie chart.
How many of the vehicles were sedans? Give your answer to the nearest whole number.
131)
A) 4270 B) 600 C) 60 D) 6 E) 427
Answer: E
Explanation: A)
B)
C)
D)
E)
58
132) The age at inauguration for 15 presidents of various organizations are below. Find the mean age.
Smith 54
Williams 46
Blake 64
Carroll 69
Carter 52
Johnson 61
Jones 56
Brown 55
Davis 43
Miller 62
Wilson 60
Taylor 51
Anderson 54
Thomas 51
White 55
132)
A) 55.5 years B) 46.5 years C) 54 years D) 55 years
Answer: A
Explanation: A)
B)
C)
D)
The heights (in inches) of 30 adult males are listed below. A frequency distribution show the frequency and relative
frequency using five classes.
70 72 71 70 69 73 69 68 70 71
67 71 70 74 69 68 71 71 71 72
69 71 68 67 73 74 70 71 69 68
Height (in inches) Frequency Relative Frequency
67.0-68.4 6 0.20
68.5-69.9 5 0.167
70.0-71.4 13 0.433
71.5-72.9 2 0.067
73.0-74.4 4 0.133
133) Is the variable "height" continuous or discrete? 133)
A) Continuous B) Discrete
Answer: A
Explanation: A)
B)
59
The bar graph below shows the political party affiliation of 1000 registered U.S. voters.
134) About how many of the registered U.S. voters stated "Independent" as their political party
affiliation?
134)
A) 15%
B) 150
C) cannot be determined from the information given
D) 15
Answer: B
Explanation: A)
B)
C)
D)
Identify potential outliers, if any, for the given data.
135) The normal annual precipitation (in inches) is given below for 21 different U.S. cities.
32.4 29.4 34.6 65.3 22.1 31.8 16.6
28.2 36.2 59.4 24.3 47.2 45.6 9.2
27.1 18.9 13.6 31.4 24.2 12.3 35.4
135)
A) 9.2, 12.3
B) 59.4, 65.3
C) 65.3
D) None
E) 9.2, 59.4, 65.3
Answer: B
Explanation: A)
B)
C)
D)
E)
60
Provide an appropriate response.
136) The weight at birth of males has a mean value of 3.53 kg with a standard deviation of 0.58. For a
male child weighing 2.75 kg at birth, what is the corresponding z-score?
136)
A) -1.34 B) -0.78 C) 0.78 D) 1.34
Answer: A
Explanation: A)
B)
C)
D)
Classify the variable as either discrete or continuous.
137) The time it takes an athlete to run 100 meters. 137)
A) Discrete B) Continuous
Answer: B
Explanation: A)
B)
A sporting goods retailer conducted a customer survey to determine its customers primary reason for shopping at their
store. The results are shown in the graph below.
138) Is the variable "reason for shopping at our store" categorical or quantitative? 138)
A) Quantitative B) Categorical
Answer: B
Explanation: A)
B)
61
Provide an appropriate response.
139) The age at inauguration for 15 presidents of various organizations are below. Find the range of the
ages.
Smith 54
Williams 46
Blake 64
Carroll 69
Carter 52
Johnson 61
Jones 56
Brown 55
Davis 43
Miller 62
Wilson 60
Taylor 51
Anderson 54
Thomas 51
White 55
139)
A) 10 years B) 26 years C) 18 years D) 55.5 years E) 55 years
Answer: B
Explanation: A)
B)
C)
D)
E)
140) Last year, U.S. consumers redeemed 6.12 billion manufacturers' coupons and saved themselves
$2.86 billion. Calculate and interpret the mean savings of U.S. consumers per coupon.
140)
A) Half of all U.S. consumers who used coupons saved more than 214.0 cents per coupon.
B) The average savings of all U.S. consumers was $47 per coupon.
C) Half of all U.S. consumers who used coupons saved more than $0.47 per coupon.
D) The average savings of all U.S. consumers was $0.47 per coupon.
E) The average savings of all U.S. consumers was 214.0 cents per coupon.
Answer: D
Explanation: A)
B)
C)
D)
E)
Answer true or false.
141) In skewed distributions, we expect the values of the mean, median, and mode to be approximately
equal, since they are all measures of center.
141)
A) False B) True
Answer: A
Explanation: A)
B)
62
Provide an appropriate response.
142) A safety engineer wishes to use the following data to show the number of deaths in a year from the
collision of passenger cars with trucks on a particular highway.
Year Number of Deaths
1 12
2 17
3 22
4 21
5 16
6 13
7 11
8 12
What is the mode of the number of deaths?
142)
A) 16 B) 15.5 C) 22 D) 12 E) 13
Answer: D
Explanation: A)
B)
C)
D)
E)
Classify the variable as either discrete or continuous.
143) The number of calls received between 8 a.m. and 5 p.m. by a technical support professional. 143)
A) Continuous B) Discrete
Answer: B
Explanation: A)
B)
Provide an appropriate response.
144) Test scores for a history class had a mean of 79 with a standard deviation of 4.5. Test scores for a
physics class had a mean of 69 with a standard deviation of 3.7. Suppose a student gets a 68 on the
history test and a 87 on the physics test. Calculate the z-score for each test. On which test did the
student perform better?
144)
A) history; 4.86
B) physics; -2.44
C) history; 2.44
D) physics; 4.86
E) history; -2.44
Answer: D
Explanation: A)
B)
C)
D)
E)
63
145) The proportion of adults aged 15-49 who are living with HIV/AIDS is 0.5% in Latin America, 1.0%
in the Caribbean, 0.9% in Eastern Europe and Central Asia and 0.6% in North America. Suppose
we include the proportion for Sub-Saharan Africa (5.0%) to this data set and calculate the standard
deviation. Would you expect it to be significantly larger, smaller or remain about the same as the
standard deviation of the proportions WITHOUT the observation from Sub-Saharan Africa?
145)
A) significantly smaller
B) remain about the same
C) unable to determine from the information given
D) significantly larger
Answer: D
Explanation: A)
B)
C)
D)
A survey was conducted to determine how people rated the quality of programming available on television. Respondents
were asked to rate the overall quality from 0 (no quality at all) to 100 (extremely good quality). The stem-and-leaf display
of the data is shown below.
Stem Leaves
3 2 6
4 0 3 4 7 8 9 9 9
5 0 1 1 2 3 4 5
6 1 2 5 6 6
7 1 7
8
9 3
146) What is the mode rating? 146)
A) 9 B) 49 C) 93 D) 51
Answer: B
Explanation: A)
B)
C)
D)
64
A sample of fifty motorists was taken on a Federal highway where the speed limit was 60 miles per hour. A dot plot of
their speeds is shown below.
147) What is the mode for speed? 147)
A) 70
B) 55
C) 7
D) none of these
E) 60
Answer: B
Explanation: A)
B)
C)
D)
E)
Answer true or false.
148) A frequency table is a listing of possible values for a variable, together with their frequencies
and/or relative frequencies.
148)
A) False B) True
Answer: B
Explanation: A)
B)
65
Provide an appropriate response.
149) The following is a partial histogram illustrating the final course grade distribution for an
introductory level statistics class with 160 students. No student scored below 50. The grading scale
is as follows.
Course Grading Scale
90-99 A
80-89 B
70-79 C
60-69 D
50-59 F
The data for a grade of "D" is missing. What is the correct frequency for the grade of "D?"
149)
A) 0
B) 10
C) 16
D) cannot be determined from the information given
Answer: C
Explanation: A)
B)
C)
D)
66
The payroll amounts for several major-league baseball teams are shown below. Answer the following question
concerning this graph.
150) How many of the major-league payrolls exceed $20 million? (Assume that no payroll is exactly $20
million.)
150)
A) 24 payrolls
B) 3 payrolls
C) 10 payrolls
D) 14 payrolls
E) 23 payrolls
Answer: E
Explanation: A)
B)
C)
D)
E)
Classify as categorical or qualitative data.
151) The amount of time spent watching television or playing video games is considered a significant
factor on predicting childhood obesity. 290 parents of school-aged children were asked to estimate
the number of hours per week that their child spent watching television or playing video games.
This is an example of what type of variable?
151)
A) Quantitative B) Categorical
Answer: A
Explanation: A)
B)
67
The heights (in inches) of 30 adult males are listed below. A frequency distribution show the frequency and relative
frequency using five classes.
70 72 71 70 69 73 69 68 70 71
67 71 70 74 69 68 71 71 71 72
69 71 68 67 73 74 70 71 69 68
Height (in inches) Frequency Relative Frequency
67.0-68.4 6 0.20
68.5-69.9 5 0.167
70.0-71.4 13 0.433
71.5-72.9 2 0.067
73.0-74.4 4 0.133
152) A height of 69 inches belongs to the class having what frequency? 152)
A) 0.20 B) 11 C) 6 D) 0.167 E) 5
Answer: E
Explanation: A)
B)
C)
D)
E)
A survey was conducted to determine how people rated the quality of programming available on television. Respondents
were asked to rate the overall quality from 0 (no quality at all) to 100 (extremely good quality). The stem-and-leaf display
of the data is shown below.
Stem Leaves
3 2 6
4 0 3 4 7 8 9 9 9
5 0 1 1 2 3 4 5
6 1 2 5 6 6
7 1 7
8
9 3
153) The variable "quality" is 153)
A) Categorical B) Quantitative
Answer: B
Explanation: A)
B)
68
The heights (in inches) of 30 adult males are listed below. A frequency distribution show the frequency and relative
frequency using five classes.
70 72 71 70 69 73 69 68 70 71
67 71 70 74 69 68 71 71 71 72
69 71 68 67 73 74 70 71 69 68
Height (in inches) Frequency Relative Frequency
67.0-68.4 6 0.20
68.5-69.9 5 0.167
70.0-71.4 13 0.433
71.5-72.9 2 0.067
73.0-74.4 4 0.133
154) What proportion of the 30 adult males had heights less than 70 inches? 154)
A) 0.167 B) 36.7 C) 16.7% D) 0.433 E) 0.367
Answer: E
Explanation: A)
B)
C)
D)
E)
69
A nurse measured the blood pressure of each person who visited her clinic. Following is a relative-frequency histogram
for the systolic blood pressure readings for those people aged 25 to 40. Use the histogram to answer the question. The
blood pressure readings were given to the nearest whole number.
155) Approximately what percentage of the people aged 25-40 had a systolic blood pressure reading
less than 120?
155)
A) 15% B) 50% C) 5% D) 35% E) 3.5%
Answer: B
Explanation: A)
B)
C)
D)
E)
A survey was conducted to determine how people rated the quality of programming available on television. Respondents
were asked to rate the overall quality from 0 (no quality at all) to 100 (extremely good quality). The stem-and-leaf display
of the data is shown below.
Stem Leaves
3 2 6
4 0 3 4 7 8 9 9 9
5 0 1 1 2 3 4 5
6 1 2 5 6 6
7 1 7
8
9 3
156) Identify the maximum quality rating. 156)
A) 49 B) 93 C) 100 D) 3
Answer: B
Explanation: A)
B)
C)
D)
70
Provide an appropriate response.
157) Three statistics classes (each of 50 students) took the same test. Shown below are histograms of the
scores for the classes. Which class had the smallest standard deviation? Which class had the largest
standard deviation?
157)
A) 1, 3 B) 3, 2 C) 2, 1 D) 3, 1
Answer: D
Explanation: A)
B)
C)
D)
158) The histograms below display the body fat percentages of 42 female students and 48 male students
taking a college health course.
Do the female or male students have a larger standard deviation?
158)
A) male students B) female students
Answer: B
Explanation: A)
B)
71
The following data show the number of laps run by each participant in a timed running race:
46 65 55 43 51 48 57 30 43 49 32 56
159) If the stems are 3, 4, 5 and 6,what are the values of the leaves are on the "4 stem"? 159)
A) 5 B) 3, 6, 8, 9 C) 0 D) 3, 3, 6, 8, 9
Answer: D
Explanation: A)
B)
C)
D)
Provide an appropriate response.
160) Histograms are presented below for three different samples. To which of the samples does the
empirical rule apply?
Histogram I
Histogram II
Histogram III
160)
72
A) I and II B) II only C) I only D) I and III
Answer: C
Explanation: A)
B)
C)
D)
Determine the quartile, percentile or interquartile range as specified.
161) When Scholastic Achievement Scores (SAT's) are sent to test-takers, the percentiles associated with
their scores are also given. Suppose a test-taker scored at the 75th percentile for their verbal grade
and at the 37th percentile for their quantitative grade. Interpret these results.
161)
A) This student performed better than 75% of the other test-takers in the verbal part and better
than 63% in the quantitative part.
B) This student performed better than 25% of the other test-takers in the verbal part and better
than 37% in the quantitative part.
C) This student performed better than 25% of the other test-takers in the verbal part and better
than 63% in the quantitative part.
D) This student performed better than 75% of the other test-takers in the quantitative part and
better than 37% in the verbal part.
E) This student performed better than 75% of the other test-takers in the verbal part and better
than 37% in the quantitative part.
Answer: E
Explanation: A)
B)
C)
D)
E)
73
A sporting goods retailer conducted a customer survey to determine its customers primary reason for shopping at their
store. The results are shown in the graph below.
162) What proportion of the customers responded that the merchandise was the reason they shopped at
the store?
162)
A) none of these
B) 0.30
C) 0.43
D) 0.50
E) 30
Answer: C
Explanation: A)
B)
C)
D)
E)
The following data show the number of laps run by each participant in a timed running race:
46 65 55 43 51 48 57 30 43 49 32 56
163) Is the variable "number of laps run" discrete or continuous? 163)
A) Continuous B) Neither C) Discrete
Answer: C
Explanation: A)
B)
C)
74
Answer Key
Testname: C2
1) D
2) E
3) A
4) B
5) E
6) B
7) D
8) C
9) B
10) B
11) D
12) B
13) C
14) A
15) B
16) A
17) C
18) D
19) D
20) C
21) A
22) E
23) E
24) B
25) D
26) E
27) B
28) B
29) B
30) E
31) D
32) D
33) D
34) C
35) median = 1.49
36) a. stock performance
b. categorical
c. up
d.
Stock performance up same down
Count 0.525 0.175 0.300
37) categorical
38) minimum value; Q1; median; Q3; maximum value
75
Answer Key
Testname: C2
39) a. number of children under five
b. discrete
c. 1
d.
Number of children under five 0 1 2 3 4
Count 0.25 0.30 0.20 0.20 0.05
40) a. Unemployment Rate 2003-2012
Unemployment
Rate (Percent)
2003 2004 2005 2006 2007 2008 2009 2010 2011 2012
Year
b. There is a clear decreasing trend over time; c. No, a histogram would not depict the trend in this dataset.
41) This clarifies what percent a slice represents and which of two slices is larger.
42) a. 0 to 0.49, 0.5 to 0.99, 1.0 to 1.49, 1.5 to 1.99, 2.0 to 2.49, 2.5 to 2.99, 3.0 to 3.49, 3.5 to 3.99, 4.0 to 4.49, 4.5 to 4.99; b. The
distribution is skewed to the right. c. You can get the actual data values from a dot plot or stem-and-leaf plot. d. The
shape would not change.
43) The first graph shows the total numbers of students for each year as well as the number of female students. We can see
the downward trend in overall enrollment, the slight upward trend in female enrollment and that female enrollment is
small relative to total enrollment.
However, with both total enrollment and female enrollment on the same graph, since female enrollment is small
relative to total enrollment, the scale is not suitable for female enrollment and the upward trend in female enrollment is
not very clear.
Since both total enrollment and female enrollment are varying with time, the second graph which shows female
enrollment as a percentage of total enrollment may be more useful. It is clear from this graph that as a percentage of
total enrollment, female enrollment is increasing significantly. However, this graph gives no indication of the absolute
number of students (overall or female) and without reference to the first graph, we cannot know whether the
percentage female enrollment is increasing because female enrollment is increasing, because male enrollment is
decreasing, or both.
76
Answer Key
Testname: C2
44) a.
b. The distribution is approximately symmetrical; c. standard deviation = 1.779 inches; The typical distance the data
falls from the mean is 1.779 inches.
45) mean; median
46) range
47) outliers
48) a. median = about 10 million shares; b. yes, 3; c. The distribution is skewed to the right. The IQR would be a better
measure of spread for this dataset, because it is highly skewed and contains 3 potential outliers. The standard
deviation is not a resistant measure of variability.
49) quantitative
50) The bars are not drawn in the correct proportions.
51)
1
2
3
4
5
6
7
8
9
4
4 5
6 9
6 7 9
2 3 5 7 8 8 9
0 4 5 6 8
52) Total Tobacco Exposure Time
Exposure Time (seconds)
This distribution appears to be skewed to the right.
53) Possible answer: The area of the television on the right is nine times (not three times) the area of the television on the
left. The pictogram gives the visual impression that sales in 2012 were nine times the sales in 2002.
54) histogram
55) minimum = 2 seconds, Q1 = 10 seconds, median = 51 seconds, Q3 = 191 seconds, and maximum = 548 seconds
77
Answer Key
Testname: C2
56) mean = 1.471
57)
58) z-score
59) Possible answer: The graph is misleading because it is truncated. The scale on the vertical axis should start at zero so
that the bars will be in the correct proportions. A part of the vertical axis could be omitted but the symbol // should
then be used to warn the reader of the modified axis.
60) a.
b. No, both a dot plot and a stem-and-leaf plot are used on small quantitative
datasets.
61)
78
Answer Key
Testname: C2
62) a.
b. Since the categories of Internet usage pattern have a natural order from never
to daily, it makes more sense to leave the categories in this natural order rather
than ordering them from the tallest bar to the shortest bar.
63) The first graph shows the total numbers of students for each year as well as the number of female students. We can see
the downward trend in overall enrollment, the slight upward trend in female enrollment and that female enrollment is
small relative to total enrollment. However, with both total and female enrollment on the same graph, since female
enrollment is small relative to total enrollment, the scale is not suitable for female enrollment and the upward trend in
female enrollment is not very clear. This upward trend is much clearer from the second graph which shows female
enrollment alone, However this graph gives no indication of how female enrollment compares to total enrollment.
64) mean = 1.985, median = 1.85; The median seems more appropriate for this dataset, because this dataset is highly
skewed to the right.
79
Answer Key
Testname: C2
65) a.
b. Since it is of interest to know which categories were more useful to consumers, ordering the categories as in a
Pareto chart would be more appropriate than listing them alphabetically.
66) Possible answer: The average price increases by 25% from 2008 to 2009. Using the truncated graph, the price appears to
double from 2008 to 2009 (i.e. it appears to increase by 100%). Using the truncated graph, the differences between the
bars seem bigger (relatively) than they really are.
67)
68) A
69) B
70) B
71) D
72) B
73) E
74) A
75) C
76) C
77) A
78) B
79) C
80) A
81) B
82) A
83) D
80
Answer Key
Testname: C2
84) C
85) E
86) A
87) C
88) B
89) D
90) D
91) E
92) A
93) B
94) D
95) D
96) A
97) B
98) B
99) E
100) C
101) D
102) B
103) B
104) A
105) B
106) D
107) B
108) B
109) E
110) C
111) A
112) C
113) C
114) E
115) C
116) A
117) B
118) D
119) B
120) E
121) B
122) A
123) A
124) B
125) E
126) B
127) B
128) A
129) E
130) C
131) E
132) A
133) A
81
Answer Key
Testname: C2
134) B
135) B
136) A
137) B
138) B
139) B
140) D
141) A
142) D
143) B
144) D
145) D
146) B
147) B
148) B
149) C
150) E
151) A
152) E
153) B
154) E
155) B
156) B
157) D
158) B
159) D
160) C
161) E
162) C
163) C
82
Statistics The Art and Science of Learning from Data 3rd Edition Agresti Test Bank
Full Download: http://alibabadownload.com/product/statistics-the-art-and-science-of-learning-from-data-3rd-edition-agresti-test-ba
This sample only, Download all chapters at: alibabadownload.com

More Related Content

Similar to Statistics The Art and Science of Learning from Data 3rd Edition Agresti Test Bank

TitleABC123 Version X1Practice Set 1QNT275 Version.docx
TitleABC123 Version X1Practice Set 1QNT275 Version.docxTitleABC123 Version X1Practice Set 1QNT275 Version.docx
TitleABC123 Version X1Practice Set 1QNT275 Version.docxherthalearmont
 
Week 1 Practice SetUniversity of Phoenix MaterialPract.docx
Week 1 Practice SetUniversity of Phoenix MaterialPract.docxWeek 1 Practice SetUniversity of Phoenix MaterialPract.docx
Week 1 Practice SetUniversity of Phoenix MaterialPract.docxnealralix138661
 
Stats math1342finalreview 000
Stats math1342finalreview 000Stats math1342finalreview 000
Stats math1342finalreview 000Nasrullah Roslan
 
Points 250Assignment 3Biggest Challenges Facing Organizations .docx
Points 250Assignment 3Biggest Challenges Facing Organizations .docxPoints 250Assignment 3Biggest Challenges Facing Organizations .docx
Points 250Assignment 3Biggest Challenges Facing Organizations .docxharrisonhoward80223
 
CXC MATHEMATICS MULTIPLE CHOICE
CXC MATHEMATICS MULTIPLE CHOICECXC MATHEMATICS MULTIPLE CHOICE
CXC MATHEMATICS MULTIPLE CHOICEMadanaDookieram
 
Statistics and Probability Reviewer.pptx
Statistics and Probability Reviewer.pptxStatistics and Probability Reviewer.pptx
Statistics and Probability Reviewer.pptxJERWINTELACAS
 
Final exam review sheet # 3 2015
Final exam review sheet # 3 2015Final exam review sheet # 3 2015
Final exam review sheet # 3 2015mlabuski
 
Final exam review sheet # 1 2015
Final exam review sheet # 1 2015Final exam review sheet # 1 2015
Final exam review sheet # 1 2015mlabuski
 
Frost & Sullivan_Entry Interview Questions (English & Math)
Frost & Sullivan_Entry Interview Questions (English & Math)Frost & Sullivan_Entry Interview Questions (English & Math)
Frost & Sullivan_Entry Interview Questions (English & Math)Max Lee
 
1 3 my statlab module one problem set complete solutions correct answers key
1 3 my statlab module one problem set complete solutions correct answers key1 3 my statlab module one problem set complete solutions correct answers key
1 3 my statlab module one problem set complete solutions correct answers keySong Love
 
PGCET MCA 2017 question paper
PGCET MCA 2017 question paperPGCET MCA 2017 question paper
PGCET MCA 2017 question paperEneutron
 
GATE-ec-question-Paper-2018.pdf-82.pdf
GATE-ec-question-Paper-2018.pdf-82.pdfGATE-ec-question-Paper-2018.pdf-82.pdf
GATE-ec-question-Paper-2018.pdf-82.pdfJAYMINKUMARPATEL1
 
QRB 501 Final Exam 2015 version
QRB 501 Final Exam 2015 versionQRB 501 Final Exam 2015 version
QRB 501 Final Exam 2015 versionuopcom4
 
QRB 501 Final Exam 2015 version
QRB 501 Final Exam 2015 versionQRB 501 Final Exam 2015 version
QRB 501 Final Exam 2015 versionuopcom4
 
QRB 501 Final Exam 2015 version
QRB 501 Final Exam 2015 versionQRB 501 Final Exam 2015 version
QRB 501 Final Exam 2015 versionuopcom4
 
QRB 501 Final Exam 2015 version
QRB 501 Final Exam 2015 versionQRB 501 Final Exam 2015 version
QRB 501 Final Exam 2015 versionuopcom4
 

Similar to Statistics The Art and Science of Learning from Data 3rd Edition Agresti Test Bank (20)

TitleABC123 Version X1Practice Set 1QNT275 Version.docx
TitleABC123 Version X1Practice Set 1QNT275 Version.docxTitleABC123 Version X1Practice Set 1QNT275 Version.docx
TitleABC123 Version X1Practice Set 1QNT275 Version.docx
 
Week 1 Practice SetUniversity of Phoenix MaterialPract.docx
Week 1 Practice SetUniversity of Phoenix MaterialPract.docxWeek 1 Practice SetUniversity of Phoenix MaterialPract.docx
Week 1 Practice SetUniversity of Phoenix MaterialPract.docx
 
Stats math1342finalreview 000
Stats math1342finalreview 000Stats math1342finalreview 000
Stats math1342finalreview 000
 
Practive test 1
Practive test 1Practive test 1
Practive test 1
 
Points 250Assignment 3Biggest Challenges Facing Organizations .docx
Points 250Assignment 3Biggest Challenges Facing Organizations .docxPoints 250Assignment 3Biggest Challenges Facing Organizations .docx
Points 250Assignment 3Biggest Challenges Facing Organizations .docx
 
CXC MATHEMATICS MULTIPLE CHOICE
CXC MATHEMATICS MULTIPLE CHOICECXC MATHEMATICS MULTIPLE CHOICE
CXC MATHEMATICS MULTIPLE CHOICE
 
Statistics and Probability Reviewer.pptx
Statistics and Probability Reviewer.pptxStatistics and Probability Reviewer.pptx
Statistics and Probability Reviewer.pptx
 
Ssc j en 2015 ee solved paper
Ssc j en 2015 ee solved paperSsc j en 2015 ee solved paper
Ssc j en 2015 ee solved paper
 
Ssc j en 2015 ee solved paper
Ssc j en 2015 ee solved paperSsc j en 2015 ee solved paper
Ssc j en 2015 ee solved paper
 
Final exam review sheet # 3 2015
Final exam review sheet # 3 2015Final exam review sheet # 3 2015
Final exam review sheet # 3 2015
 
Final exam review sheet # 1 2015
Final exam review sheet # 1 2015Final exam review sheet # 1 2015
Final exam review sheet # 1 2015
 
Prac excises 3[1].5
Prac excises 3[1].5Prac excises 3[1].5
Prac excises 3[1].5
 
Frost & Sullivan_Entry Interview Questions (English & Math)
Frost & Sullivan_Entry Interview Questions (English & Math)Frost & Sullivan_Entry Interview Questions (English & Math)
Frost & Sullivan_Entry Interview Questions (English & Math)
 
1 3 my statlab module one problem set complete solutions correct answers key
1 3 my statlab module one problem set complete solutions correct answers key1 3 my statlab module one problem set complete solutions correct answers key
1 3 my statlab module one problem set complete solutions correct answers key
 
PGCET MCA 2017 question paper
PGCET MCA 2017 question paperPGCET MCA 2017 question paper
PGCET MCA 2017 question paper
 
GATE-ec-question-Paper-2018.pdf-82.pdf
GATE-ec-question-Paper-2018.pdf-82.pdfGATE-ec-question-Paper-2018.pdf-82.pdf
GATE-ec-question-Paper-2018.pdf-82.pdf
 
QRB 501 Final Exam 2015 version
QRB 501 Final Exam 2015 versionQRB 501 Final Exam 2015 version
QRB 501 Final Exam 2015 version
 
QRB 501 Final Exam 2015 version
QRB 501 Final Exam 2015 versionQRB 501 Final Exam 2015 version
QRB 501 Final Exam 2015 version
 
QRB 501 Final Exam 2015 version
QRB 501 Final Exam 2015 versionQRB 501 Final Exam 2015 version
QRB 501 Final Exam 2015 version
 
QRB 501 Final Exam 2015 version
QRB 501 Final Exam 2015 versionQRB 501 Final Exam 2015 version
QRB 501 Final Exam 2015 version
 

Recently uploaded

Employee wellbeing at the workplace.pptx
Employee wellbeing at the workplace.pptxEmployee wellbeing at the workplace.pptx
Employee wellbeing at the workplace.pptxNirmalaLoungPoorunde1
 
Hybridoma Technology ( Production , Purification , and Application )
Hybridoma Technology  ( Production , Purification , and Application  ) Hybridoma Technology  ( Production , Purification , and Application  )
Hybridoma Technology ( Production , Purification , and Application ) Sakshi Ghasle
 
Interactive Powerpoint_How to Master effective communication
Interactive Powerpoint_How to Master effective communicationInteractive Powerpoint_How to Master effective communication
Interactive Powerpoint_How to Master effective communicationnomboosow
 
Introduction to AI in Higher Education_draft.pptx
Introduction to AI in Higher Education_draft.pptxIntroduction to AI in Higher Education_draft.pptx
Introduction to AI in Higher Education_draft.pptxpboyjonauth
 
POINT- BIOCHEMISTRY SEM 2 ENZYMES UNIT 5.pptx
POINT- BIOCHEMISTRY SEM 2 ENZYMES UNIT 5.pptxPOINT- BIOCHEMISTRY SEM 2 ENZYMES UNIT 5.pptx
POINT- BIOCHEMISTRY SEM 2 ENZYMES UNIT 5.pptxSayali Powar
 
call girls in Kamla Market (DELHI) 🔝 >༒9953330565🔝 genuine Escort Service 🔝✔️✔️
call girls in Kamla Market (DELHI) 🔝 >༒9953330565🔝 genuine Escort Service 🔝✔️✔️call girls in Kamla Market (DELHI) 🔝 >༒9953330565🔝 genuine Escort Service 🔝✔️✔️
call girls in Kamla Market (DELHI) 🔝 >༒9953330565🔝 genuine Escort Service 🔝✔️✔️9953056974 Low Rate Call Girls In Saket, Delhi NCR
 
Kisan Call Centre - To harness potential of ICT in Agriculture by answer farm...
Kisan Call Centre - To harness potential of ICT in Agriculture by answer farm...Kisan Call Centre - To harness potential of ICT in Agriculture by answer farm...
Kisan Call Centre - To harness potential of ICT in Agriculture by answer farm...Krashi Coaching
 
Science 7 - LAND and SEA BREEZE and its Characteristics
Science 7 - LAND and SEA BREEZE and its CharacteristicsScience 7 - LAND and SEA BREEZE and its Characteristics
Science 7 - LAND and SEA BREEZE and its CharacteristicsKarinaGenton
 
Sanyam Choudhary Chemistry practical.pdf
Sanyam Choudhary Chemistry practical.pdfSanyam Choudhary Chemistry practical.pdf
Sanyam Choudhary Chemistry practical.pdfsanyamsingh5019
 
MENTAL STATUS EXAMINATION format.docx
MENTAL     STATUS EXAMINATION format.docxMENTAL     STATUS EXAMINATION format.docx
MENTAL STATUS EXAMINATION format.docxPoojaSen20
 
SOCIAL AND HISTORICAL CONTEXT - LFTVD.pptx
SOCIAL AND HISTORICAL CONTEXT - LFTVD.pptxSOCIAL AND HISTORICAL CONTEXT - LFTVD.pptx
SOCIAL AND HISTORICAL CONTEXT - LFTVD.pptxiammrhaywood
 
Presiding Officer Training module 2024 lok sabha elections
Presiding Officer Training module 2024 lok sabha electionsPresiding Officer Training module 2024 lok sabha elections
Presiding Officer Training module 2024 lok sabha electionsanshu789521
 
Alper Gobel In Media Res Media Component
Alper Gobel In Media Res Media ComponentAlper Gobel In Media Res Media Component
Alper Gobel In Media Res Media ComponentInMediaRes1
 
Call Girls in Dwarka Mor Delhi Contact Us 9654467111
Call Girls in Dwarka Mor Delhi Contact Us 9654467111Call Girls in Dwarka Mor Delhi Contact Us 9654467111
Call Girls in Dwarka Mor Delhi Contact Us 9654467111Sapana Sha
 
KSHARA STURA .pptx---KSHARA KARMA THERAPY (CAUSTIC THERAPY)————IMP.OF KSHARA ...
KSHARA STURA .pptx---KSHARA KARMA THERAPY (CAUSTIC THERAPY)————IMP.OF KSHARA ...KSHARA STURA .pptx---KSHARA KARMA THERAPY (CAUSTIC THERAPY)————IMP.OF KSHARA ...
KSHARA STURA .pptx---KSHARA KARMA THERAPY (CAUSTIC THERAPY)————IMP.OF KSHARA ...M56BOOKSTORE PRODUCT/SERVICE
 
Contemporary philippine arts from the regions_PPT_Module_12 [Autosaved] (1).pptx
Contemporary philippine arts from the regions_PPT_Module_12 [Autosaved] (1).pptxContemporary philippine arts from the regions_PPT_Module_12 [Autosaved] (1).pptx
Contemporary philippine arts from the regions_PPT_Module_12 [Autosaved] (1).pptxRoyAbrique
 
mini mental status format.docx
mini    mental       status     format.docxmini    mental       status     format.docx
mini mental status format.docxPoojaSen20
 

Recently uploaded (20)

Employee wellbeing at the workplace.pptx
Employee wellbeing at the workplace.pptxEmployee wellbeing at the workplace.pptx
Employee wellbeing at the workplace.pptx
 
Hybridoma Technology ( Production , Purification , and Application )
Hybridoma Technology  ( Production , Purification , and Application  ) Hybridoma Technology  ( Production , Purification , and Application  )
Hybridoma Technology ( Production , Purification , and Application )
 
Código Creativo y Arte de Software | Unidad 1
Código Creativo y Arte de Software | Unidad 1Código Creativo y Arte de Software | Unidad 1
Código Creativo y Arte de Software | Unidad 1
 
Interactive Powerpoint_How to Master effective communication
Interactive Powerpoint_How to Master effective communicationInteractive Powerpoint_How to Master effective communication
Interactive Powerpoint_How to Master effective communication
 
Introduction to AI in Higher Education_draft.pptx
Introduction to AI in Higher Education_draft.pptxIntroduction to AI in Higher Education_draft.pptx
Introduction to AI in Higher Education_draft.pptx
 
POINT- BIOCHEMISTRY SEM 2 ENZYMES UNIT 5.pptx
POINT- BIOCHEMISTRY SEM 2 ENZYMES UNIT 5.pptxPOINT- BIOCHEMISTRY SEM 2 ENZYMES UNIT 5.pptx
POINT- BIOCHEMISTRY SEM 2 ENZYMES UNIT 5.pptx
 
call girls in Kamla Market (DELHI) 🔝 >༒9953330565🔝 genuine Escort Service 🔝✔️✔️
call girls in Kamla Market (DELHI) 🔝 >༒9953330565🔝 genuine Escort Service 🔝✔️✔️call girls in Kamla Market (DELHI) 🔝 >༒9953330565🔝 genuine Escort Service 🔝✔️✔️
call girls in Kamla Market (DELHI) 🔝 >༒9953330565🔝 genuine Escort Service 🔝✔️✔️
 
Kisan Call Centre - To harness potential of ICT in Agriculture by answer farm...
Kisan Call Centre - To harness potential of ICT in Agriculture by answer farm...Kisan Call Centre - To harness potential of ICT in Agriculture by answer farm...
Kisan Call Centre - To harness potential of ICT in Agriculture by answer farm...
 
Science 7 - LAND and SEA BREEZE and its Characteristics
Science 7 - LAND and SEA BREEZE and its CharacteristicsScience 7 - LAND and SEA BREEZE and its Characteristics
Science 7 - LAND and SEA BREEZE and its Characteristics
 
Sanyam Choudhary Chemistry practical.pdf
Sanyam Choudhary Chemistry practical.pdfSanyam Choudhary Chemistry practical.pdf
Sanyam Choudhary Chemistry practical.pdf
 
MENTAL STATUS EXAMINATION format.docx
MENTAL     STATUS EXAMINATION format.docxMENTAL     STATUS EXAMINATION format.docx
MENTAL STATUS EXAMINATION format.docx
 
SOCIAL AND HISTORICAL CONTEXT - LFTVD.pptx
SOCIAL AND HISTORICAL CONTEXT - LFTVD.pptxSOCIAL AND HISTORICAL CONTEXT - LFTVD.pptx
SOCIAL AND HISTORICAL CONTEXT - LFTVD.pptx
 
Presiding Officer Training module 2024 lok sabha elections
Presiding Officer Training module 2024 lok sabha electionsPresiding Officer Training module 2024 lok sabha elections
Presiding Officer Training module 2024 lok sabha elections
 
Alper Gobel In Media Res Media Component
Alper Gobel In Media Res Media ComponentAlper Gobel In Media Res Media Component
Alper Gobel In Media Res Media Component
 
Call Girls in Dwarka Mor Delhi Contact Us 9654467111
Call Girls in Dwarka Mor Delhi Contact Us 9654467111Call Girls in Dwarka Mor Delhi Contact Us 9654467111
Call Girls in Dwarka Mor Delhi Contact Us 9654467111
 
KSHARA STURA .pptx---KSHARA KARMA THERAPY (CAUSTIC THERAPY)————IMP.OF KSHARA ...
KSHARA STURA .pptx---KSHARA KARMA THERAPY (CAUSTIC THERAPY)————IMP.OF KSHARA ...KSHARA STURA .pptx---KSHARA KARMA THERAPY (CAUSTIC THERAPY)————IMP.OF KSHARA ...
KSHARA STURA .pptx---KSHARA KARMA THERAPY (CAUSTIC THERAPY)————IMP.OF KSHARA ...
 
Contemporary philippine arts from the regions_PPT_Module_12 [Autosaved] (1).pptx
Contemporary philippine arts from the regions_PPT_Module_12 [Autosaved] (1).pptxContemporary philippine arts from the regions_PPT_Module_12 [Autosaved] (1).pptx
Contemporary philippine arts from the regions_PPT_Module_12 [Autosaved] (1).pptx
 
mini mental status format.docx
mini    mental       status     format.docxmini    mental       status     format.docx
mini mental status format.docx
 
Staff of Color (SOC) Retention Efforts DDSD
Staff of Color (SOC) Retention Efforts DDSDStaff of Color (SOC) Retention Efforts DDSD
Staff of Color (SOC) Retention Efforts DDSD
 
9953330565 Low Rate Call Girls In Rohini Delhi NCR
9953330565 Low Rate Call Girls In Rohini  Delhi NCR9953330565 Low Rate Call Girls In Rohini  Delhi NCR
9953330565 Low Rate Call Girls In Rohini Delhi NCR
 

Statistics The Art and Science of Learning from Data 3rd Edition Agresti Test Bank

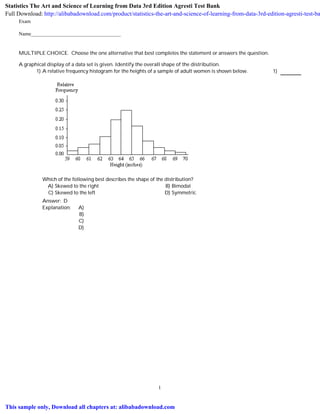
  • 1. Exam Name___________________________________ MULTIPLE CHOICE. Choose the one alternative that best completes the statement or answers the question. A graphical display of a data set is given. Identify the overall shape of the distribution. 1) A relative frequency histogram for the heights of a sample of adult women is shown below. Which of the following best describes the shape of the distribution? 1) A) Skewed to the right B) Bimodal C) Skewed to the left D) Symmetric Answer: D Explanation: A) B) C) D) 1 Statistics The Art and Science of Learning from Data 3rd Edition Agresti Test Bank Full Download: http://alibabadownload.com/product/statistics-the-art-and-science-of-learning-from-data-3rd-edition-agresti-test-ba This sample only, Download all chapters at: alibabadownload.com
  • 2. Provide an appropriate response. 2) Each year advertisers spend billions of dollars purchasing commercial time on network sports television. A recent article listed the top 10 leading spenders (in millions of dollars) over a 6 month period: Company A $72.0 Company F $26.9 Company B 63.1 Company G 25.0 Company C 54.7 Company H 23.9 Company D 54.3 Company I 23.0 Company E 29.0 Company J 20.0 Which of the following graphs would not be appropriate for displaying this data? 2) A) Stem-and-leaf plot B) Dot plot C) Histogram D) None of these should be used. E) Pie chart Answer: E Explanation: A) B) C) D) E) Select the most appropriate answer. 3) Which of the following graphical methods cannot be used to summarize a quantitative dataset? 3) A) a bar graph B) a dot plot C) a histogram D) a frequency table E) a stem-and-leaf plot Answer: A Explanation: A) B) C) D) E) 4) Which of the following numerical summary measures is not sensitive to outliers in a dataset? 4) A) range B) interquartile range C) mean D) standard deviation E) none of these Answer: B Explanation: A) B) C) D) E) 2
  • 3. 5) The median is equivalent to which quartile? 5) A) Q3 B) Q1 C) Q4 D) None of these. E) Q2 Answer: E Explanation: A) B) C) D) E) 6) A set of data collected over time is called a 6) A) data series. B) time series. C) None of these. D) time bar. E) time plot. Answer: B Explanation: A) B) C) D) E) 7) A distribution that has a left tail longer than the right tail is considered 7) A) None of these. B) skewed to the right. C) symmetric. D) skewed to the left. E) not skewed. Answer: D Explanation: A) B) C) D) E) 8) The salaries of the top 10 highest paid CEOs in the U.S. ranged from 249.42 to 68.95 million dollars. These data had Q1=71.84, median=101.7 and Q3=139.96. The full data set is given below. 249.42 230.55 139.96 135.53 122.67 80.73 75.33 71.84 69.66 68.95 In a boxplot, what would be the values to which the whiskers extend? 8) A) -30.34, 242.14 B) 68.95, 249.42 C) 68.95, 230.55 D) -0.48, 203.88 Answer: C Explanation: A) B) C) D) 3
  • 4. Provide an appropriate response. 9) The mean is less than the median 9) A) when the data is symmetric B) when the data is skewed to the left C) never D) when the data is skewed to the right Answer: B Explanation: A) B) C) D) Select the most appropriate answer. 10) The area of New Jersey Counties, in square miles, ranges from 47 to 819 with Q1=228, median=329 and Q3=476. The full data set follows. 47 103 130 192 221 228 234 267 307 312 329 362 365 423 468 476 500 527 569 642 819 According to the 1.5 × IQR criterion, are there any potential outliers in the data set? 10) A) yes, 47 and 819 B) no C) yes, 819 D) yes, 47 Answer: B Explanation: A) B) C) D) 11) Which of the following numerical summary measures cannot be easily approximated from a box plot? 11) A) median B) interquartile range C) Q1 D) variance E) range Answer: D Explanation: A) B) C) D) E) 12) What percent of the data falls below Q1? 12) A) 50% B) 25% C) 33% D) 10% E) 75% Answer: B Explanation: A) B) C) D) E) 4
  • 5. A graphical display of a data set is given. Identify the overall shape of the distribution. 13) The ages of a group of patients being treated at one hospital for osteoporosis are summarized in the frequency histogram below. Which of the following best describes the shape of the distribution? 13) A) Skewed to the right B) Multimodal C) Skewed to the left D) Bimodal E) Symmetric Answer: C Explanation: A) B) C) D) E) Select the most appropriate answer. 14) The characteristics observed to address the questions posed in a study are called 14) A) variables. B) parameters. C) quantities. D) statistics. E) categories. Answer: A Explanation: A) B) C) D) E) Provide an appropriate response. 15) Twenty-four workers were surveyed and asked how long it takes them to travel to work each day. The data below are given in minutes. 20 35 42 52 65 20 60 49 24 37 23 24 22 20 41 25 28 27 50 47 58 30 32 48 Which of the following shows the data in a stem-and-leaf plot? 15) 5
  • 6. A) 2 3 4 5 6 0 0 2 3 4 4 5 7 8 0 2 5 7 1 2 7 8 9 0 2 8 0 5 B) 2 3 4 5 6 0 0 0 2 3 4 4 5 7 8 0 2 5 7 1 2 7 8 9 0 2 8 0 5 C) 2 3 4 5 6 0 0 0 0 2 3 4 4 5 7 8 0 2 5 7 1 2 7 8 9 0 2 8 0 5 D) 2 3 4 5 6 0 0 0 2 3 4 4 5 7 8 0 2 5 7 1 2 7 8 9 0 2 8 0 E) 2 3 4 5 6 0 0 0 2 3 4 4 5 7 0 2 5 7 8 1 2 7 8 9 0 2 8 0 5 Answer: B Explanation: A) B) C) D) E) 6
  • 7. A graphical display of a data set is given. Identify the overall shape of the distribution. 16) A stem-and-leaf diagram is given below for the ages of the patients at a hospital. 0 1 2 3 4 5 6 7 8 9 0 4 2 4 0 0 2 3 0 1 2 5 8 9 1 1 2 3 4 5 7 8 0 2 3 6 6 6 8 8 9 0 0 1 2 2 3 5 5 6 6 8 8 8 9 9 2 3 3 3 3 4 5 5 5 5 6 6 7 7 7 8 8 8 8 9 9 0 0 2 2 3 3 5 6 6 7 8 8 9 1 3 4 6 7 Which of the following best describes the shape of the distribution? 16) A) Skewed to the left B) Bimodal C) Symmetric D) Skewed to the right Answer: A Explanation: A) B) C) D) Select the most appropriate answer. 17) A distribution that has the right tail longer than the left tail is considered 17) A) None of these. B) symmetric. C) skewed to the right. D) not skewed. E) skewed to the left. Answer: C Explanation: A) B) C) D) E) Provide an appropriate response. 18) At a tennis tournament a statistician keeps track of every serve that a player hits. The statistician reported that the mean serve speed of a particular player was 98 miles per hour. Suppose that the statistician indicated that the serve speed distribution was skewed to the left. Which of the following values is most likely the value of the median serve speed? 18) A) 93 mph B) 88 mph C) 83 mph D) 103 mph E) 98 mph Answer: D Explanation: A) B) C) D) E) 7
  • 8. Select the most appropriate answer. 19) A common pattern observed over time is called a/an 19) A) time plot. B) mode C) None of these. D) trend. E) time series. Answer: D Explanation: A) B) C) D) E) 20) In human engineering and product design, it is important to consider the weights of people so that airplanes or elevators are not overloaded. The distribution of weights for adult males in the U.S. has a mean weight of 173 pounds and a standard deviation of 30 pounds. Suppose the distribution of weights was skewed to the left. Which of the following values is most likely the value of the median weight? 20) A) 173 pounds B) 163 pounds C) 188 pounds D) 143 pounds E) not enough information to determine Answer: C Explanation: A) B) C) D) E) Provide an appropriate response. 21) Parking at a large university has become a major issue. University administrators would like to determine the average time it takes a student to find a parking spot in a university lot. Students who are willing to participate in the study were asked to record the time between entering campus and pulling into a parking spot. Which of the following would not be appropriate for displaying the parking time data? 21) A) Pie chart B) Box plot C) Histogram D) None of these should be used. E) Stem-and-leaf plot Answer: A Explanation: A) B) C) D) E) 8
  • 9. 22) The mean score on the SAT writing section was 497 for the a given graduating class. Noting that this test is scored on a scale of 200 to 800, which of the following is the most plausible value for the standard deviation of the scores? 22) A) 200 B) 300 C) -10 D) 10 E) 110 Answer: E Explanation: A) B) C) D) E) Select the most appropriate answer. 23) Which of the following numerical summary measures cannot be negative? 23) A) Q3 B) z-score C) mean D) mode E) standard deviation Answer: E Explanation: A) B) C) D) E) 9
  • 10. A graphical display of a data set is given. Identify the overall shape of the distribution. 24) The following histogram depicts the heights of 50 women and 50 men. Which of the following best describes the shape of the distribution? 24) A) Symmetric B) Bimodal C) Skewed to the right D) Skewed to the left Answer: B Explanation: A) B) C) D) Select the most appropriate answer. 25) Which of the following is a continuous variable? 25) A) number of homeruns in a professional baseball player's career B) brand of tennis shoe C) type of fish caught D) daily high temperature in New York City E) number of pars in a round of golf Answer: D Explanation: A) B) C) D) E) 26) What percent of the data falls above Q2? 26) A) 10% B) 25% C) 90% D) 75% E) 50% Answer: E Explanation: A) B) C) D) E) 10
  • 11. 27) The area of New Jersey Counties, in square miles, ranges from 47 to 819 with Q1=228, median=329 and Q3=476. The full data set follows. 47 103 130 192 221 228 234 267 307 312 329 362 365 423 468 476 500 527 569 642 819 In a boxplot, what would be the values to which the whiskers extend 27) A) 228, 476 B) 47, 819 C) -144, 848 D) -43, 701 Answer: B Explanation: A) B) C) D) 28) A distribution that shows an overall pattern with two mounds is called 28) A) None of the these. B) bimodal. C) nonmodal. D) multimodal. E) unimodal. Answer: B Explanation: A) B) C) D) E) 29) The salaries of the top 10 highest paid CEOs in the U.S. ranged from 249.42 to 68.95 million dollars. These data had Q1=71.84, median=101.7 and Q3=139.96. The full data set is given below. 249.42 230.55 139.96 135.53 122.67 80.73 75.33 71.84 69.66 68.95 Using the 1.5 x IQR criterion, are there any potential outliers in the data set? 29) A) yes, 68.95 and 249.42 B) yes, 249.42 C) yes, 68.95 D) no Answer: B Explanation: A) B) C) D) 30) One-fourth of the dataset lies 30) A) below Q3. B) between Q1 and Q3. C) above Q2. D) above Q1. E) above Q3. Answer: E Explanation: A) B) C) D) E) 11
  • 12. 31) Which of the following is a discrete variable? 31) A) weight of a newborn baby B) none of these C) amount of coffee in an 8-ounce cup D) number of phones per household E) time it takes to drive to work Answer: D Explanation: A) B) C) D) E) 32) In human engineering and product design, it is important to consider the weights of people so that airplanes or elevators aren't overloaded. The weight for adult males in the U.S. follows a bell-shaped distribution with a mean weight of 173 pounds and a standard deviation of 30 pounds. What proportion of these weights is between 203 pounds and 263 pounds? 32) A) 0.1600 B) 0.6800 C) 0.4985 D) 0.1574 E) 0.3170 Answer: D Explanation: A) B) C) D) E) 33) A distribution that shows an overall pattern with a single mound is called 33) A) bimodal. B) symmetric. C) nonmodal. D) unimodal. E) multimodal. Answer: D Explanation: A) B) C) D) E) 12
  • 13. 34) In human engineering and product design, it is important to consider the weights of people so that airplanes or elevators are not overloaded. The weight for adult males in the U.S. follows a bell-shaped distribution with a mean weight of 173 pounds and a standard deviation of 30 pounds. Using the z-score approach for detecting outliers, which of the following weights would represent potential outliers in the distribution of U.S. adult male weights? Weights: 110 pounds, 157 pounds, 281 pounds 34) A) 110 pounds and 157 pounds are both potential outliers. B) 110 pounds and 281 pounds are both potential outliers. C) 281 pounds is the only potential outlier. D) None of the three weights are potential outliers. E) 110 pounds, 157 pounds, and 281 pounds are all potential outliers. Answer: C Explanation: A) B) C) D) E) SHORT ANSWER. Write the word or phrase that best completes each statement or answers the question. Provide an appropriate response. 35) In order to reduce pollutants from motor vehicle exhaust emissions, three-way catalytic converters have been installed in new vehicles. However, these converters increase the level of ammonia in the air. A study was published on the ammonia levels near the exit ramp of a highway tunnel. The data below represent daily ammonia concentrations (parts per million) on eight randomly selected days during afternoon drive-time in the summer. 1.53 1.50 1.37 1.51 1.55 1.42 1.41 1.48 Find the median. 35) Answer: median = 1.49 Explanation: 36) A stock broker has been following different stocks over the last month and has recorded whether the various stock values are up, unchanged, or down at the end of the month. The results were Stock performance up same down Count 21 7 12 a. What is the variable of interest? b. Is the variable categorical or quantitative? c. Which response is the mode? d. Add proportions to this frequency table. 36) Answer: a. stock performance b. categorical c. up d. Stock performance up same down Count 0.525 0.175 0.300 Explanation: 13
  • 14. Fill in the blank. 37) A variable is called ____________________ if each observation belongs to one of a set of categories. 37) Answer: categorical Explanation: 38) The five-number summary of a dataset consists of the ____________________, ____________________, ____________________, ____________________, and ____________________. 38) Answer: minimum value; Q1; median; Q3; maximum value Explanation: Provide an appropriate response. 39) A local school district wants to know the number of children under the age of five living in the district in order to predict future enrollment. Households were randomly sampled in the district, and the head of household was asked to disclose the number of children under the age of five living in the household. The results were Number of children under five 0 1 2 3 4 Count 15 18 12 12 3 a. What is the variable of interest? b. Is the variable categorical or quantitative? c. Which response is the mode? d. Add proportions to this frequency table. 39) Answer: a. number of children under five b. discrete c. 1 d. Number of children under five 0 1 2 3 4 Count 0.25 0.30 0.20 0.20 0.05 Explanation: 40) The table below shows the unemployment rate in one city from 2003 to 2012. Year 2003 2004 2005 2006 2007 2008 2009 2010 2011 2012 Unemployment Rate (Percent) 5.90 5.78 5.45 5.28 5.06 4.88 4.80 4.63 4.44 4.24 a. Construct a time plot for these data. b. Is there a trend? If so, what kind? c. Would a histogram more clearly describe the above dataset? Explain. 40) 14
  • 15. Answer: a. Unemployment Rate 2003-2012 Unemployment Rate (Percent) 2003 2004 2005 2006 2007 2008 2009 2010 2011 2012 Year b. There is a clear decreasing trend over time; c. No, a histogram would not depict the trend in this dataset. Explanation: 41) Why is it beneficial to label each pie slice of a pie chart with its corresponding percent? 41) Answer: This clarifies what percent a slice represents and which of two slices is larger. Explanation: 15
  • 16. 42) The following frequency histogram provides average SO2 (sulfur dioxide) emission rates from utility and industrial boilers (lb/million Btu) for 47 states (data for Idaho, Alaska, and Hawaii omitted). a. Identify the intervals of emission rates used for the plot. b. Describe the shape of the distribution. c. What information can you get from the dot plot or stem-and-leaf plot of these data that you cannot get from this plot? d. This histogram shows frequencies. If you were to construct a histogram using the percentages for each interval, how (if at all) would the shape of this histogram change? 42) Answer: a. 0 to 0.49, 0.5 to 0.99, 1.0 to 1.49, 1.5 to 1.99, 2.0 to 2.49, 2.5 to 2.99, 3.0 to 3.49, 3.5 to 3.99, 4.0 to 4.49, 4.5 to 4.99; b. The distribution is skewed to the right. c. You can get the actual data values from a dot plot or stem-and-leaf plot. d. The shape would not change. Explanation: 43) The table below summarizes total enrollment and female enrollment at a pilot training college for the years 2005 through 2012. The table has been used to construct two different graphs displayed below the table. Summarize the information that is available from each of the graphs and discuss the advantages and disadvantages of each graph. Enrollment at Pilot Training College 43) 16
  • 17. Year Total Number of Students Number of Female Students 2005 283 20 2006 275 22 2007 265 22 2008 258 24 2009 252 25 2010 248 25 2011 245 27 2012 242 28 Enrollment at Pilot Training College - - - - Total enrollment Female enrollment Female Enrollment as Percentage of Total Enrollment at Pilot Training College 17
  • 18. Answer: The first graph shows the total numbers of students for each year as well as the number of female students. We can see the downward trend in overall enrollment, the slight upward trend in female enrollment and that female enrollment is small relative to total enrollment. However, with both total enrollment and female enrollment on the same graph, since female enrollment is small relative to total enrollment, the scale is not suitable for female enrollment and the upward trend in female enrollment is not very clear. Since both total enrollment and female enrollment are varying with time, the second graph which shows female enrollment as a percentage of total enrollment may be more useful. It is clear from this graph that as a percentage of total enrollment, female enrollment is increasing significantly. However, this graph gives no indication of the absolute number of students (overall or female) and without reference to the first graph, we cannot know whether the percentage female enrollment is increasing because female enrollment is increasing, because male enrollment is decreasing, or both. Explanation: 44) 1.The data below represent the number of inches of rain in Chicago, Illinois, during the month of April for 20 randomly selected years. 2.47 3.97 3.94 4.11 1.14 4.02 3.41 1.85 5.22 0.97 6.14 2.34 3.48 4.77 2.78 4.00 6.28 5.50 7.69 5.79 a. Construct a box plot for these data. b. Describe the shape of this distribution. c. Compute and interpret the standard deviation. 44) Answer: a. b. The distribution is approximately symmetrical; c. standard deviation = 1.779 inches; The typical distance the data falls from the mean is 1.779 inches. Explanation: 18
  • 19. Fill in the blank. 45) The ____________________ is the balance point of the data values; while, the _____________________ is the midpoint of the ordered data values. 45) Answer: mean; median Explanation: 46) The ____________________ is the difference between the largest and the smallest data values. 46) Answer: range Explanation: 47) Extreme observations in the dataset are called ____________________. 47) Answer: outliers Explanation: Provide an appropriate response. 48) The box plot below represents the volume of stock X traded for a random sample of 35 trading days. The volume of a stock is the number of shares traded on a given day. a. Approximately, what is the median for this dataset? b. Are there any potential outliers in this dataset? If so, how many? c. Describe the shape of the distribution. Would the standard deviation or the interquartile range be a better measure of spread for this dataset? Explain. 48) Answer: a. median = about 10 million shares; b. yes, 3; c. The distribution is skewed to the right. The IQR would be a better measure of spread for this dataset, because it is highly skewed and contains 3 potential outliers. The standard deviation is not a resistant measure of variability. Explanation: 19
  • 20. Fill in the blank. 49) A variable is called ____________________ if observations on it take numerical values that represent different magnitudes of the variable. 49) Answer: quantitative Explanation: Identify the abuse of statistics. 50) The graph shows the increases in a certain expenditure over a four-year period. What is wrong with the graph? 50) Answer: The bars are not drawn in the correct proportions. Explanation: Provide an appropriate response. 51) The scores for a statistics test are as follows: 87 76 94 77 95 96 88 85 66 89 79 98 54 90 83 88 82 55 14 69 Create a stem-and-leaf display for the data. The stem should consist of the tens digit and range from 1 to 9. The leaves should be drawn aside the appropriate stem based on the data values. 51) Answer: 1 2 3 4 5 6 7 8 9 4 4 5 6 9 6 7 9 2 3 5 7 8 8 9 0 4 5 6 8 Explanation: 20
  • 21. 52) A survey investigated exposure to tobacco use in a series of G-rated animated films. Data on the total tobacco exposure time (in seconds) is below. 223 176 548 37 158 51 299 37 11 165 74 9 2 9 23 206 9 Construct a dot plot for these data. Comment on the shape of the distribution. 52) Answer: Total Tobacco Exposure Time Exposure Time (seconds) This distribution appears to be skewed to the right. Explanation: 53) A television manufacturer sold three times as many televisions in 2012 as it did in 2002. To illustrate this fact, the manufacturer draws a pictogram as shown below. The television on the right is three times as tall and three times as wide as the television on the left. 2002 2012 Why is this pictogram misleading? What visual impression is portrayed by the pictogram? 53) Answer: Possible answer: The area of the television on the right is nine times (not three times) the area of the television on the left. The pictogram gives the visual impression that sales in 2012 were nine times the sales in 2002. Explanation: Fill in the blank. 54) A ____________________ is a graph that uses bars to portray the frequencies or the relative frequencies of the possible outcomes for a quantitative variable. 54) Answer: histogram Explanation: 21
  • 22. Provide an appropriate response. 55) A recent survey investigated exposure to tobacco and alcohol use in a series of G-rated animated films. Data on the total tobacco exposure time (in seconds) is below. 223 176 548 37 158 51 299 37 11 165 74 9 2 6 23 206 9 Find the Five-Number Summary of Positions. 55) Answer: minimum = 2 seconds, Q1 = 10 seconds, median = 51 seconds, Q3 = 191 seconds, and maximum = 548 seconds Explanation: 56) In order to reduce pollutants from motor vehicle exhaust emissions, three-way catalytic converters have been installed in new vehicles. However, these converters increase the level of ammonia in the air. A study was published on the ammonia levels near the exit ramp of a highway tunnel. The data below represent daily ammonia concentrations (parts per million) on eight randomly selected days during afternoon drive-time in the summer. 1.53 1.50 1.37 1.51 1.55 1.42 1.41 1.48 Find the mean. 56) Answer: mean = 1.471 Explanation: 57) The following data represent the number of grams of fat in various breakfast foods. Breakfast Food Fat (in grams) Muffin and egg sandwich 12 Muffin, egg, and ham sandwich 22 Muffin, egg, and bacon sandwich 27 Muffin and sausage sandwich 22 Bagel, egg, and ham sandwich 25 Bagel, egg, and bacon sandwich 30 Bagel, egg, and sausage sandwich 32 Bagel, egg, sausage, and cheese sandwich 37 Bagel, egg, ham, and cheese sandwich 27 Bagel, egg, bacon, and cheese sandwich 31 Bagel 11 Pancakes platter 16 Pancakes and eggs platter 21 Pancakes, eggs, and bacon platter 32 Yogurt 2 Construct a dot plot for these data. 57) Answer: Explanation: 22
  • 23. Fill in the blank. 58) The ____________________ for a data value is the number of standard deviations that it falls from the mean. 58) Answer: z-score Explanation: Provide an appropriate response. 59) The histogram below shows the number of car accidents occurring in one city in each of the years 2007 through 2012. The number of accidents dropped in 2009 after a new speed limit was imposed. Why is the graph misleading? How would you redesign the graph to be less misleading? 2007 2008 2009 2010 2011 2012 Year 59) Answer: Possible answer: The graph is misleading because it is truncated. The scale on the vertical axis should start at zero so that the bars will be in the correct proportions. A part of the vertical axis could be omitted but the symbol // should then be used to warn the reader of the modified axis. Explanation: 23
  • 24. 60) The enrollment for fall semester at University X is as follows. Enrollment Count Undergraduate 24,814 Graduate/Professional 8386 Independent Study 20 a. Construct a bar graph for these data. b. Would a dot plot or a stem-and-leaf plot make sense for these data? Explain. 60) Answer: a. b. No, both a dot plot and a stem-and-leaf plot are used on small quantitative datasets. Explanation: 61) In order to reduce pollutants from motor vehicle exhaust emissions, three-way catalytic converters have been installed in new vehicles. However, these converters increase the level of ammonia in the air. A study was published on the ammonia levels near the exit ramp of a highway tunnel. The data below represent daily ammonia concentrations (parts per million) on eight randomly selected days during afternoon drive-time in the summer. 1.53 1.50 1.37 1.51 1.55 1.42 1.41 1.48 Construct a dot plot for these data. 61) Answer: Explanation: 24
  • 25. 62) A sample of 324 randomly selected doctors was asked to indicate the category that best described how often they used the Internet. The results follow. Internet Usage Pattern Count Never 31 Rarely (about 3 times per year) 15 Occasionally (about once a month) 52 Often (about once a week) 109 Daily 117 a. Construct a pie chart for these data. b. In creating a bar graph of these data, would it be more useful to list the patterns as given in the table above or in the order of a Pareto chart? 62) Answer: a. b. Since the categories of Internet usage pattern have a natural order from never to daily, it makes more sense to leave the categories in this natural order rather than ordering them from the tallest bar to the shortest bar. Explanation: 63) The table below summarizes total enrollment and female enrollment at a pilot training college for the years 2005 through 2012. The table has been used to construct two different graphs displayed below the table. Summarize the information that is available from each of the graphs and discuss the advantages and disadvantages of each graph. Enrollment at Pilot Training College 63) 25
  • 26. Year Total Number of Students Number of Female Students 2005 283 20 2006 275 22 2007 265 22 2008 258 24 2009 252 25 2010 248 25 2011 245 27 2012 242 28 Enrollment at Pilot Training College - - - - Total enrollment Female enrollment Female Enrollment at Pilot Training College 26
  • 27. Answer: The first graph shows the total numbers of students for each year as well as the number of female students. We can see the downward trend in overall enrollment, the slight upward trend in female enrollment and that female enrollment is small relative to total enrollment. However, with both total and female enrollment on the same graph, since female enrollment is small relative to total enrollment, the scale is not suitable for female enrollment and the upward trend in female enrollment is not very clear. This upward trend is much clearer from the second graph which shows female enrollment alone, However this graph gives no indication of how female enrollment compares to total enrollment. Explanation: 64) The following data provide the daily protein intake (in grams of protein per kilogram of body weight) for 20 competitive athletes. 1.4 2.2 2.7 1.5 2.3 1.7 2.3 1.5 1.8 2.8 1.8 1.9 2.0 2.3 1.5 1.9 1.7 1.8 1.6 3.0 Find the mean and the median. Which measure of center seems more appropriate for this dataset? Explain. 64) Answer: mean = 1.985, median = 1.85; The median seems more appropriate for this dataset, because this dataset is highly skewed to the right. Explanation: 27
  • 28. 65) A sample of recent car buyers was asked to identify what they considered to be the most useful source of information about the cars they purchased. The results follow. Source Count Consumer guide 172 Dealership 93 Word of mouth 40 Internet 26 a. Construct a pie chart for these data. b. In creating a bar graph of these data, would it be more useful to list the sources of consumer information in the same order in which they appear in the table above or in the form of a Pareto chart? 65) Answer: a. b. Since it is of interest to know which categories were more useful to consumers, ordering the categories as in a Pareto chart would be more appropriate than listing them alphabetically. Explanation: 28
  • 29. 66) The bar graph below shows the average cost of renting a studio in one city in each of the years 2008 through 2012. 2008 2009 2010 2011 2012 Year By what percentage does the average price increase from 2008 to 2009? Obtain a truncated version of the graph by sliding a piece of paper over the bottom of the graph so that the bars start at 300. In the truncated graph, by what percentage does the price appear to increase from 2008 to 2009? Why is the truncated graph misleading? 66) Answer: Possible answer: The average price increases by 25% from 2008 to 2009. Using the truncated graph, the price appears to double from 2008 to 2009 (i.e. it appears to increase by 100%). Using the truncated graph, the differences between the bars seem bigger (relatively) than they really are. Explanation: 67) The Highway Patrol, using radar, clocked the speeds (in mph) of 30 passing motorists at a checkpoint. The results are listed below. Construct a dot plot for the data. 44 38 41 50 36 36 43 42 49 48 35 40 37 41 43 50 45 45 39 38 50 41 47 36 35 40 42 43 48 33 67) Answer: Explanation: 29
  • 30. MULTIPLE CHOICE. Choose the one alternative that best completes the statement or answers the question. 68) The heights (in inches) of 20 adult males are listed below. Find the range of the data. 70 72 71 70 69 73 69 68 70 71 67 71 70 74 69 68 71 71 71 72 68) A) 7 B) 6.5 C) 5.5 D) 6 E) 5 Answer: A Explanation: A) B) C) D) E) The bar graph below shows the political party affiliation of 1000 registered U.S. voters. 69) What percentage of the 1000 registered U.S. voters belongs to one of the two traditional parties (Democratic and Republican)? 69) A) 40% B) 75% C) 35% D) 25% E) 50% Answer: B Explanation: A) B) C) D) E) 30
  • 31. A survey was conducted to determine how people rated the quality of programming available on television. Respondents were asked to rate the overall quality from 0 (no quality at all) to 100 (extremely good quality). The stem-and-leaf display of the data is shown below. Stem Leaves 3 2 6 4 0 3 4 7 8 9 9 9 5 0 1 1 2 3 4 5 6 1 2 5 6 6 7 1 7 8 9 3 70) Identify the minimum quality rating. 70) A) 2 B) 32 C) 26 D) 0 Answer: B Explanation: A) B) C) D) 31
  • 32. Provide an appropriate response. 71) The following is a partial histogram illustrating the final course grade distribution for an introductory level statistics class with 160 students. No student scored below 50. The grading scale is as follows. Course Grading Scale 90-99 A 80-89 B 70-79 C 60-69 D 50-59 F The data for a grade of "D" is missing. What percentage of the students received a grade of "D?" 71) A) 5% B) 16% C) cannot be determined from the information given D) 10% Answer: D Explanation: A) B) C) D) 32
  • 33. A sporting goods retailer conducted a customer survey to determine its customers primary reason for shopping at their store. The results are shown in the graph below. 72) What percentage of the customers gave "prices" or "merchandise" as their answer? 72) A) 0.10 B) 0.71 C) 0.20 D) 0.30 E) 0.14 Answer: B Explanation: A) B) C) D) E) Provide an appropriate response. 73) According to the Empirical Rule, approximately 95% of the data values from a bell-shaped distribution fall within _______ standard deviations of the mean. 73) A) 1 B) 0.5 C) 3 D) 2.5 E) 2 Answer: E Explanation: A) B) C) D) E) 33
  • 34. A nurse measured the blood pressure of each person who visited her clinic. Following is a relative-frequency histogram for the systolic blood pressure readings for those people aged 25 to 40. Use the histogram to answer the question. The blood pressure readings were given to the nearest whole number. 74) Approximately what percentage of the people aged 25-40 had a systolic blood pressure reading of at least 110 but less than 120? 74) A) 35% B) 3.5% C) 30% D) 15% E) 0.35% Answer: A Explanation: A) B) C) D) E) 34
  • 35. A sporting goods retailer conducted a customer survey to determine its customers primary reason for shopping at their store. The results are shown in the graph below. 75) What response represents the mode? 75) A) Prices B) Other C) Merchandise D) Convenience Answer: C Explanation: A) B) C) D) Identify potential outliers, if any, for the given data. 76) The test scores of 15 students are listed below. 36 40 48 65 67 69 70 73 75 76 79 82 87 90 99 76) A) 36, 40 B) None C) 36 D) 36, 99 E) 90, 99 Answer: C Explanation: A) B) C) D) E) The following data show the number of laps run by each participant in a timed running race: 46 65 55 43 51 48 57 30 43 49 32 56 77) If the stems are 3, 4, 5 and 6, how many leaves are on the "4 stem"? 77) A) 5 B) 0 C) 4 D) 1 Answer: A Explanation: A) B) C) D) 35
  • 36. The heights (in inches) of 30 adult males are listed below. A frequency distribution show the frequency and relative frequency using five classes. 70 72 71 70 69 73 69 68 70 71 67 71 70 74 69 68 71 71 71 72 69 71 68 67 73 74 70 71 69 68 Height (in inches) Frequency Relative Frequency 67.0-68.4 6 0.20 68.5-69.9 5 0.167 70.0-71.4 13 0.433 71.5-72.9 2 0.067 73.0-74.4 4 0.133 78) What percentage of the 30 adult males had heights between 73 and 74.4 inches? 78) A) 0.133 B) 13.3 C) 4 D) 0.04 E) none of these Answer: B Explanation: A) B) C) D) E) 36
  • 37. Construct a pie chart illustrating the given data set. 79) After reviewing a movie, 900 people rated the movie as excellent, good, or fair. The following data give the rating distribution. Excellent Good Fair 180 450 270 79) A) B) C) D) Answer: C Explanation: A) B) C) D) Answer true or false. 80) Dot plots and stem-and-leaf plots are often used to summarize small quantitative datasets. 80) A) True B) False Answer: A Explanation: A) B) 37
  • 38. Provide an appropriate response. 81) SAT verbal scores are normally distributed with a mean of 433 and a standard deviation of 90. Use the Empirical Rule to determine what percent of the scores lie between 433 and 523. 81) A) 51% B) 34% C) 68% D) 49.9% E) 47.5% Answer: B Explanation: A) B) C) D) E) Classify as categorical or qualitative data. 82) Your statistics teacher has gathered information on each of the students in your class in order to illustrate the difference between categorical and quantitative variables. For each student, she has recorded their major, gender, age and height. The variable "age" is an example of what type of variable? 82) A) Quantitative B) Categorical Answer: A Explanation: A) B) The heights (in inches) of 30 adult males are listed below. A frequency distribution show the frequency and relative frequency using five classes. 70 72 71 70 69 73 69 68 70 71 67 71 70 74 69 68 71 71 71 72 69 71 68 67 73 74 70 71 69 68 Height (in inches) Frequency Relative Frequency 67.0-68.4 6 0.20 68.5-69.9 5 0.167 70.0-71.4 13 0.433 71.5-72.9 2 0.067 73.0-74.4 4 0.133 83) Identify the variable. 83) A) Relative frequency B) Number of classes C) Frequency D) Height E) Number of adult males Answer: D Explanation: A) B) C) D) E) 38
  • 39. Provide an appropriate response. 84) The professor of economics at a small Texas University wanted to determine what year in school students were taking his tough economics course. Shown below is a pie chart of the results. What percentage of the class took the course prior to reaching their senior year? 84) A) 14% B) 54% C) 86% D) 30% E) 44% Answer: C Explanation: A) B) C) D) E) 85) A competency test has scores with a mean of 69 and a standard deviation of 4. A histogram of the data shows that the distribution is normal. Use the Empirical Rule to find the percentage of scores between 61 and 77. 85) A) 68% B) 77% C) 99.7% D) 50% E) 95% Answer: E Explanation: A) B) C) D) E) Classify the variable as either discrete or continuous. 86) Your statistics teacher has gathered information on each of the students in your class in order to illustrate the difference between discrete and continuous variables. For each student, she has recorded their height, number of credit hours completed and the time it took for them to complete their last exam. The variable "number of credit hours completed" is 86) A) Discrete B) Continuous Answer: A Explanation: A) B) 39
  • 40. Provide an appropriate response. 87) The following is a time plot of wine exports (in millions of gallons) in a certain country for the past 15 years. Is there a trend evident in the data? 87) A) yes, decreasing trend B) no trend evident C) yes, increasing trend Answer: C Explanation: A) B) C) Answer true or false. 88) If a distribution is very highly skewed, the mean is usually preferred over the mean because it better represents what is typical. 88) A) True B) False Answer: B Explanation: A) B) Find the original data from the stem-and-leaf plot. 89) Stem Leaves 8 5 8 9 1 8 10 5 5 89) A) 81, 88, 81, 98, 105, 105 B) 85, 88, 91, 91, 105, 105 C) 85, 81, 88, 91, 101, 105 D) 85, 88, 91, 98, 105, 105 E) 81, 85, 81, 98, 108, 105 Answer: D Explanation: A) B) C) D) E) 40
  • 41. Provide an appropriate response. 90) The weight at birth of males has a mean value of 3.53 kg with a standard deviation of 0.58. What birth weight has a z-score of 0.81? 90) A) -3.06 kg B) -4 kg C) 2.52 kg D) 4 kg Answer: D Explanation: A) B) C) D) Find the median for the given sample data. 91) A store manager kept track of the number of newspapers sold each week over a seven-week period. The results are shown below. 95, 38, 221, 122, 258, 237, 233 Find the median number of newspapers sold. 91) A) 172 newspapers B) 233 newspapers C) 122 newspapers D) 258 newspapers E) 221 newspapers Answer: E Explanation: A) B) C) D) E) Answer true or false. 92) A numerical summary of the observations is called resistant if extreme observations have little, if any, influence on its value. 92) A) True B) False Answer: A Explanation: A) B) Classify as categorical or qualitative data. 93) Your statistics teacher has gathered information on each of the students in your class in order to illustrate the difference between categorical and quantitative variables. For each student, she has recorded their major, gender, age and height. The variable "major" is an example of what type of variable? 93) A) Quantitative B) Categorical Answer: B Explanation: A) B) 41
  • 42. The following data show the number of laps run by each participant in a timed running race: 46 65 55 43 51 48 57 30 43 49 32 56 94) What is the mode for number of laps run? 94) A) 30 B) 65 C) 3 D) 43 Answer: D Explanation: A) B) C) D) Provide an appropriate response. 95) The age at inauguration for 15 presidents of various organizations are below. Find the median age. Smith 54 Williams 46 Blake 64 Carroll 69 Carter 52 Johnson 61 Jones 56 Brown 55 Davis 43 Miller 62 Wilson 60 Taylor 51 Anderson 54 Thomas 51 White 55 95) A) 54.5 years B) 56 years C) 55.5 years D) 55 years Answer: D Explanation: A) B) C) D) 42
  • 43. 96) For the distribution shown below, identify the mean, median, and mode 96) A) A = mode, B = median, C = mean B) A = median, B = mean, C = mode C) A = median, B = mode, C = mean D) A = mean, B = mode, C = median E) A = mode, B = mean, C = median Answer: A Explanation: A) B) C) D) E) The heights (in inches) of 30 adult males are listed below. A frequency distribution show the frequency and relative frequency using five classes. 70 72 71 70 69 73 69 68 70 71 67 71 70 74 69 68 71 71 71 72 69 71 68 67 73 74 70 71 69 68 Height (in inches) Frequency Relative Frequency 67.0-68.4 6 0.20 68.5-69.9 5 0.167 70.0-71.4 13 0.433 71.5-72.9 2 0.067 73.0-74.4 4 0.133 97) Which category of heights represents the mode? 97) A) 73.0-74.4 B) 70.0-71.4 C) 71.5-72.9 D) 68.5-69.9 E) 67.0-68.4 Answer: B Explanation: A) B) C) D) E) 43
  • 44. Answer true or false. 98) The median is always the midpoint of Q1 and Q3. 98) A) True B) False Answer: B Explanation: A) B) Find the five-number summary for the given data. 99) The normal annual precipitation (in inches) is given below for 21 different U.S. cities. 39.1 32.9 18.5 35.6 27.1 27.8 8.6 23.5 42.6 34.7 20.2 12.0 5.1 13.9 22.6 10.9 16.4 25.4 17.2 14.7 51.7 99) A) 5.1, 14.1, 22.6, 31.625, 51.7 inches B) 5.1, 14.1, 21.3, 31.625, 51.7 inches C) 5.1, 14.7, 21.3, 33.8, 51.7 inches D) 5.1, 14.7, 22.6, 35.6, 51.7 inches E) 5.1, 14.3, 22.6, 33.8, 51.7 inches Answer: E Explanation: A) B) C) D) E) Determine the quartile, percentile or interquartile range as specified. 100) The test scores of 15 students are listed below. Find the first quartile, Q 1 . 44 46 51 57 60 63 65 70 75 76 85 87 90 94 95 100) A) 53.4 B) 54.0 C) 57.0 D) 58.5 E) 55.5 Answer: C Explanation: A) B) C) D) E) 44
  • 45. Provide an appropriate response. 101) The normal monthly precipitation (in inches) for September is listed for 20 different U.S. cities. Find the mean of the data. 3.5 1.6 2.4 3.7 4.1 3.9 1.0 3.6 4.2 3.4 3.7 2.2 1.5 4.2 3.4 2.7 0.4 3.7 2.0 3.6 101) A) 2.70 in. B) 2.80 in. C) 3.27 in. D) 2.94 in. E) 3.09 in. Answer: D Explanation: A) B) C) D) E) Classify the variable as either discrete or continuous. 102) Your statistics teacher has gathered information on each of the students in your class in order to illustrate the difference between discrete and continuous variables. For each student, she has recorded their height, number of credit hours completed and the time it took for them to complete their last exam. The variable "height" is 102) A) Discrete B) Continuous Answer: B Explanation: A) B) Answer true or false. 103) The frequency for a particular category is the proportion of observations that fall in the category. 103) A) True B) False Answer: B Explanation: A) B) 104) The sum of the deviations, the differences between the observations and the sample mean (x - x), is always equal to zero. 104) A) True B) False Answer: A Explanation: A) B) 45
  • 46. A sample of fifty motorists was taken on a Federal highway where the speed limit was 60 miles per hour. A dot plot of their speeds is shown below. 105) Would a pie chart be appropriate for displaying this data? 105) A) Yes B) No Answer: B Explanation: A) B) Provide an appropriate response. 106) Use the following summary information for a data set of 100 observations to determine whether the data set is likely to be bell-shaped, skewed to the right or skewed to the left. Mean = 120, s=22, Minimum=37, Maximum=136 106) A) bell-shaped B) unable to determine from the information given C) skewed to the right D) skewed to the left Answer: D Explanation: A) B) C) D) Classify the variable as either discrete or continuous. 107) The following table shows the heights of the five tallest mountains in North America. Mountain Height (ft) Rank McKinley 20,320 1 Logan 19,850 2 Citlaltepec 18,700 3 St. Elias 18,008 4 Popocatepetl 17,930 5 The heights given in the second column represent what type of data? 107) A) Discrete B) Continuous Answer: B Explanation: A) B) 46
  • 47. A sample of fifty motorists was taken on a Federal highway where the speed limit was 60 miles per hour. A dot plot of their speeds is shown below. 108) What is the variable of interest? 108) A) number of speeding motorists B) motorist's speed C) whether or not a motorist was speeding D) number of motorists on the Federal highway Answer: B Explanation: A) B) C) D) Provide an appropriate response. 109) The distribution of salaries of professional basketball players is skewed to the right. Which measure of central tendency would be the best measure to determine the location of the center of the distribution? 109) A) Standard Deviation B) Mode C) Range D) Mean E) Median Answer: E Explanation: A) B) C) D) E) 47
  • 48. 110) The following is a time plot of infant mortality rates in a certain country from the years 1960 to 2011. Is there an obvious trend in the data? 110) A) yes, increasing trend B) no trend evident C) yes, decreasing trend Answer: C Explanation: A) B) C) Answer true or false. 111) Bar graphs and pie charts are graphical methods that are often used in summarizing quantitative data. 111) A) False B) True Answer: A Explanation: A) B) Find the five-number summary for the given data. 112) The salaries (in millions of dollars) of the top 10 highest paid CEOs in the U.S. 249.42 230.55 139.96 135.53 122.67 80.73 75.33 71.84 69.66 68.95 112) A) 68.95, 71.84, 122.67, 139.96, 230.55 B) 0, 71.84, 122.67, 139.96, 230.55 C) 68.95, 71.84, 101.7, 139.96, 230.55 D) -0.48, 71.84, 101.7, 139.96, 203.88 E) 68.95, 71.84, 101.7, 139.96, 249.42 Answer: C Explanation: A) B) C) D) E) 48
  • 49. Provide an appropriate response. 113) Use the following summary information for a data set of 100 observations to determine whether the data set is likely to be bell-shaped, skewed to the right or skewed to the left. Mean = 120, s=22, Minimum=103, Maximum=170 113) A) skewed to the left B) unable to determine from the information given C) skewed to the right D) bell-shaped Answer: C Explanation: A) B) C) D) 114) Brandon kept track of the number of hours he spent exercising each week for four months. The results are shown below. Find the mean number of hours Brandon spent exercising per week. Round your answer to two decimal places. 7.50 8.20 7.10 7.90 8.00 7.50 7.80 7.10 7.30 7.50 7.90 8.90 7.10 8.20 8.20 8.20 8.00 7.80 114) A) 8.01 B) 7.38 C) 8.25 D) 7.30 E) 7.79 Answer: E Explanation: A) B) C) D) E) 49
  • 50. The payroll amounts for several major-league baseball teams are shown below. Answer the following question concerning this graph. 115) What percentage of the payrolls exceed $30 million? (Assume that no payroll is exactly $30 million.) 115) A) 46% B) 19% C) 50% D) 12 E) 13 Answer: C Explanation: A) B) C) D) E) 50
  • 51. A nurse measured the blood pressure of each person who visited her clinic. Following is a relative-frequency histogram for the systolic blood pressure readings for those people aged 25 to 40. Use the histogram to answer the question. The blood pressure readings were given to the nearest whole number. 116) Given that 200 people were aged between 25 and 40, approximately how many had a systolic blood pressure reading less than 130? 116) A) 150 B) 25 C) 100 D) 50 E) 75 Answer: A Explanation: A) B) C) D) E) 51
  • 52. Provide an appropriate response. 117) The following plot illustrates a time series of unemployment rates in a certain country between the years 1953 and 2012. Is a trend evident in the data set? 117) A) yes, increasing trend B) no trend evident C) yes, decreasing trend Answer: B Explanation: A) B) C) Construct a boxplot as specified. 118) The weekly salaries (in dollars) of 24 randomly selected employees of a company are shown below. Construct a boxplot for the data set. What is the shape of the distribution? 310 320 450 460 470 500 520 540 580 600 650 700 710 840 870 900 1000 1200 1250 1300 1400 1720 2500 3700 118) A) Bell-shaped B) Skewed-right 52
  • 53. C) Skewed-left D) Skewed-right E) Skewed-left Answer: D Explanation: A) B) C) D) E) Provide an appropriate response. 119) Last year, batting averages in the National League averaged 0.257 with a high of 0.323 and a low of 0.250 (minimum 250 at bats). Based on this information, which measure of variation could be calculated? 119) A) none of the above B) range C) standard deviation D) variance E) mode Answer: B Explanation: A) B) C) D) E) 53
  • 54. Determine the quartile, percentile or interquartile range as specified. 120) The test scores of 19 students are listed below. Find the interquartile range. 91 46 86 70 61 63 97 56 90 77 82 83 52 88 74 43 92 94 67 120) A) 27 B) 28.5 C) 25.5 D) 29.5 E) 29 Answer: E Explanation: A) B) C) D) E) Classify the variable as either discrete or continuous. 121) The following table shows the heights of the five tallest mountains in North America. Mountain Height (ft) Rank McKinley 20,320 1 Logan 19,850 2 Citlaltepec 18,700 3 St. Elias 18,008 4 Popocatepetl 17,930 5 The ranks given in the third column represent what type of data? 121) A) Continuous B) Discrete Answer: B Explanation: A) B) Classify as categorical or qualitative data. 122) A survey of automobiles parked in the student and staff lots at a large college recorded the make and model of the automobiles. The variable "make" is: 122) A) Categorical B) Quantitative Answer: A Explanation: A) B) 54
  • 55. Provide an appropriate response. 123) For the stem-and-leaf plot below, find the range of the data set. 1 2 2 3 3 4 4 5 6 6 6 7 8 9 7 7 7 8 8 9 9 9 0 1 1 2 3 4 4 5 6 6 6 7 8 8 9 0 0 123) A) 26 B) 40 C) 36 D) 34 E) 14 Answer: A Explanation: A) B) C) D) E) 124) The cost for one semester's books (in dollars) are given below for a sample of five college students. Calculate the sample standard deviation, s of the book costs. Round to the nearest hundredth when necessary. 340, 170, 145, 420, 120 124) A) 118.93 B) 132.97 C) 17,680 D) 300 Answer: B Explanation: A) B) C) D) A sample of fifty motorists was taken on a Federal highway where the speed limit was 60 miles per hour. A dot plot of their speeds is shown below. 125) What proportion of the motorists were speeding? 125) A) 0.22 B) 2 C) 0.04 D) 0.72 E) 0.18 Answer: E Explanation: A) B) C) D) E) 55
  • 56. Determine the quartile, percentile or interquartile range as specified. 126) The cholesterol levels (in milligrams per deciliter) of 30 adults are listed below. Find the interquartile range for the cholesterol level of the 30 adults. 154 156 165 165 170 171 172 180 184 185 189 189 190 192 195 198 198 200 200 200 205 205 211 215 220 220 225 238 255 265 126) A) 30 B) 31 C) 211 D) 111 E) 180 Answer: B Explanation: A) B) C) D) E) The bar graph below shows the political party affiliation of 1000 registered U.S. voters. 127) Which response represents the mode? 127) A) Independent B) Democrat C) 40% D) 10% E) Republican Answer: B Explanation: A) B) C) D) E) 56
  • 57. A survey was conducted to determine how people rated the quality of programming available on television. Respondents were asked to rate the overall quality from 0 (no quality at all) to 100 (extremely good quality). The stem-and-leaf display of the data is shown below. Stem Leaves 3 2 6 4 0 3 4 7 8 9 9 9 5 0 1 1 2 3 4 5 6 1 2 5 6 6 7 1 7 8 9 3 128) What percentage of the respondents rated overall television quality as very good (regarded as ratings of 80 and above)? 128) A) 4% B) 3% C) 12% D) 1% E) 32% Answer: A Explanation: A) B) C) D) E) Provide an appropriate response. 129) The heights (in inches) of 10 adult males are listed below. Find the standard deviation, s. Round to the nearest hundredth. 70 72 71 70 69 73 69 68 70 71 129) A) 2.23 B) 2.01 C) 20.10 D) 1.42 E) 1.49 Answer: E Explanation: A) B) C) D) E) 57
  • 58. Find the median for the given sample data. 130) Health care issues are receiving much attention in both academic and political arenas. A sociologist recently conducted a survey of senior citizens whose net worth is too high to qualify for Medicaid but who have no private health insurance. The ages of 25 uninsured senior citizens were as follows: 67 72 65 75 85 73 60 88 64 89 68 91 75 61 80 62 67 80 69 72 59 86 74 63 81 Find the median of the observations. 130) A) 68 B) 73 C) 72 D) 69 E) 72.5 Answer: C Explanation: A) B) C) D) E) Provide an appropriate response. 131) Results from a survey of 7116 vehicle types on the campus of State College are summarized in the following pie chart. How many of the vehicles were sedans? Give your answer to the nearest whole number. 131) A) 4270 B) 600 C) 60 D) 6 E) 427 Answer: E Explanation: A) B) C) D) E) 58
  • 59. 132) The age at inauguration for 15 presidents of various organizations are below. Find the mean age. Smith 54 Williams 46 Blake 64 Carroll 69 Carter 52 Johnson 61 Jones 56 Brown 55 Davis 43 Miller 62 Wilson 60 Taylor 51 Anderson 54 Thomas 51 White 55 132) A) 55.5 years B) 46.5 years C) 54 years D) 55 years Answer: A Explanation: A) B) C) D) The heights (in inches) of 30 adult males are listed below. A frequency distribution show the frequency and relative frequency using five classes. 70 72 71 70 69 73 69 68 70 71 67 71 70 74 69 68 71 71 71 72 69 71 68 67 73 74 70 71 69 68 Height (in inches) Frequency Relative Frequency 67.0-68.4 6 0.20 68.5-69.9 5 0.167 70.0-71.4 13 0.433 71.5-72.9 2 0.067 73.0-74.4 4 0.133 133) Is the variable "height" continuous or discrete? 133) A) Continuous B) Discrete Answer: A Explanation: A) B) 59
  • 60. The bar graph below shows the political party affiliation of 1000 registered U.S. voters. 134) About how many of the registered U.S. voters stated "Independent" as their political party affiliation? 134) A) 15% B) 150 C) cannot be determined from the information given D) 15 Answer: B Explanation: A) B) C) D) Identify potential outliers, if any, for the given data. 135) The normal annual precipitation (in inches) is given below for 21 different U.S. cities. 32.4 29.4 34.6 65.3 22.1 31.8 16.6 28.2 36.2 59.4 24.3 47.2 45.6 9.2 27.1 18.9 13.6 31.4 24.2 12.3 35.4 135) A) 9.2, 12.3 B) 59.4, 65.3 C) 65.3 D) None E) 9.2, 59.4, 65.3 Answer: B Explanation: A) B) C) D) E) 60
  • 61. Provide an appropriate response. 136) The weight at birth of males has a mean value of 3.53 kg with a standard deviation of 0.58. For a male child weighing 2.75 kg at birth, what is the corresponding z-score? 136) A) -1.34 B) -0.78 C) 0.78 D) 1.34 Answer: A Explanation: A) B) C) D) Classify the variable as either discrete or continuous. 137) The time it takes an athlete to run 100 meters. 137) A) Discrete B) Continuous Answer: B Explanation: A) B) A sporting goods retailer conducted a customer survey to determine its customers primary reason for shopping at their store. The results are shown in the graph below. 138) Is the variable "reason for shopping at our store" categorical or quantitative? 138) A) Quantitative B) Categorical Answer: B Explanation: A) B) 61
  • 62. Provide an appropriate response. 139) The age at inauguration for 15 presidents of various organizations are below. Find the range of the ages. Smith 54 Williams 46 Blake 64 Carroll 69 Carter 52 Johnson 61 Jones 56 Brown 55 Davis 43 Miller 62 Wilson 60 Taylor 51 Anderson 54 Thomas 51 White 55 139) A) 10 years B) 26 years C) 18 years D) 55.5 years E) 55 years Answer: B Explanation: A) B) C) D) E) 140) Last year, U.S. consumers redeemed 6.12 billion manufacturers' coupons and saved themselves $2.86 billion. Calculate and interpret the mean savings of U.S. consumers per coupon. 140) A) Half of all U.S. consumers who used coupons saved more than 214.0 cents per coupon. B) The average savings of all U.S. consumers was $47 per coupon. C) Half of all U.S. consumers who used coupons saved more than $0.47 per coupon. D) The average savings of all U.S. consumers was $0.47 per coupon. E) The average savings of all U.S. consumers was 214.0 cents per coupon. Answer: D Explanation: A) B) C) D) E) Answer true or false. 141) In skewed distributions, we expect the values of the mean, median, and mode to be approximately equal, since they are all measures of center. 141) A) False B) True Answer: A Explanation: A) B) 62
  • 63. Provide an appropriate response. 142) A safety engineer wishes to use the following data to show the number of deaths in a year from the collision of passenger cars with trucks on a particular highway. Year Number of Deaths 1 12 2 17 3 22 4 21 5 16 6 13 7 11 8 12 What is the mode of the number of deaths? 142) A) 16 B) 15.5 C) 22 D) 12 E) 13 Answer: D Explanation: A) B) C) D) E) Classify the variable as either discrete or continuous. 143) The number of calls received between 8 a.m. and 5 p.m. by a technical support professional. 143) A) Continuous B) Discrete Answer: B Explanation: A) B) Provide an appropriate response. 144) Test scores for a history class had a mean of 79 with a standard deviation of 4.5. Test scores for a physics class had a mean of 69 with a standard deviation of 3.7. Suppose a student gets a 68 on the history test and a 87 on the physics test. Calculate the z-score for each test. On which test did the student perform better? 144) A) history; 4.86 B) physics; -2.44 C) history; 2.44 D) physics; 4.86 E) history; -2.44 Answer: D Explanation: A) B) C) D) E) 63
  • 64. 145) The proportion of adults aged 15-49 who are living with HIV/AIDS is 0.5% in Latin America, 1.0% in the Caribbean, 0.9% in Eastern Europe and Central Asia and 0.6% in North America. Suppose we include the proportion for Sub-Saharan Africa (5.0%) to this data set and calculate the standard deviation. Would you expect it to be significantly larger, smaller or remain about the same as the standard deviation of the proportions WITHOUT the observation from Sub-Saharan Africa? 145) A) significantly smaller B) remain about the same C) unable to determine from the information given D) significantly larger Answer: D Explanation: A) B) C) D) A survey was conducted to determine how people rated the quality of programming available on television. Respondents were asked to rate the overall quality from 0 (no quality at all) to 100 (extremely good quality). The stem-and-leaf display of the data is shown below. Stem Leaves 3 2 6 4 0 3 4 7 8 9 9 9 5 0 1 1 2 3 4 5 6 1 2 5 6 6 7 1 7 8 9 3 146) What is the mode rating? 146) A) 9 B) 49 C) 93 D) 51 Answer: B Explanation: A) B) C) D) 64
  • 65. A sample of fifty motorists was taken on a Federal highway where the speed limit was 60 miles per hour. A dot plot of their speeds is shown below. 147) What is the mode for speed? 147) A) 70 B) 55 C) 7 D) none of these E) 60 Answer: B Explanation: A) B) C) D) E) Answer true or false. 148) A frequency table is a listing of possible values for a variable, together with their frequencies and/or relative frequencies. 148) A) False B) True Answer: B Explanation: A) B) 65
  • 66. Provide an appropriate response. 149) The following is a partial histogram illustrating the final course grade distribution for an introductory level statistics class with 160 students. No student scored below 50. The grading scale is as follows. Course Grading Scale 90-99 A 80-89 B 70-79 C 60-69 D 50-59 F The data for a grade of "D" is missing. What is the correct frequency for the grade of "D?" 149) A) 0 B) 10 C) 16 D) cannot be determined from the information given Answer: C Explanation: A) B) C) D) 66
  • 67. The payroll amounts for several major-league baseball teams are shown below. Answer the following question concerning this graph. 150) How many of the major-league payrolls exceed $20 million? (Assume that no payroll is exactly $20 million.) 150) A) 24 payrolls B) 3 payrolls C) 10 payrolls D) 14 payrolls E) 23 payrolls Answer: E Explanation: A) B) C) D) E) Classify as categorical or qualitative data. 151) The amount of time spent watching television or playing video games is considered a significant factor on predicting childhood obesity. 290 parents of school-aged children were asked to estimate the number of hours per week that their child spent watching television or playing video games. This is an example of what type of variable? 151) A) Quantitative B) Categorical Answer: A Explanation: A) B) 67
  • 68. The heights (in inches) of 30 adult males are listed below. A frequency distribution show the frequency and relative frequency using five classes. 70 72 71 70 69 73 69 68 70 71 67 71 70 74 69 68 71 71 71 72 69 71 68 67 73 74 70 71 69 68 Height (in inches) Frequency Relative Frequency 67.0-68.4 6 0.20 68.5-69.9 5 0.167 70.0-71.4 13 0.433 71.5-72.9 2 0.067 73.0-74.4 4 0.133 152) A height of 69 inches belongs to the class having what frequency? 152) A) 0.20 B) 11 C) 6 D) 0.167 E) 5 Answer: E Explanation: A) B) C) D) E) A survey was conducted to determine how people rated the quality of programming available on television. Respondents were asked to rate the overall quality from 0 (no quality at all) to 100 (extremely good quality). The stem-and-leaf display of the data is shown below. Stem Leaves 3 2 6 4 0 3 4 7 8 9 9 9 5 0 1 1 2 3 4 5 6 1 2 5 6 6 7 1 7 8 9 3 153) The variable "quality" is 153) A) Categorical B) Quantitative Answer: B Explanation: A) B) 68
  • 69. The heights (in inches) of 30 adult males are listed below. A frequency distribution show the frequency and relative frequency using five classes. 70 72 71 70 69 73 69 68 70 71 67 71 70 74 69 68 71 71 71 72 69 71 68 67 73 74 70 71 69 68 Height (in inches) Frequency Relative Frequency 67.0-68.4 6 0.20 68.5-69.9 5 0.167 70.0-71.4 13 0.433 71.5-72.9 2 0.067 73.0-74.4 4 0.133 154) What proportion of the 30 adult males had heights less than 70 inches? 154) A) 0.167 B) 36.7 C) 16.7% D) 0.433 E) 0.367 Answer: E Explanation: A) B) C) D) E) 69
  • 70. A nurse measured the blood pressure of each person who visited her clinic. Following is a relative-frequency histogram for the systolic blood pressure readings for those people aged 25 to 40. Use the histogram to answer the question. The blood pressure readings were given to the nearest whole number. 155) Approximately what percentage of the people aged 25-40 had a systolic blood pressure reading less than 120? 155) A) 15% B) 50% C) 5% D) 35% E) 3.5% Answer: B Explanation: A) B) C) D) E) A survey was conducted to determine how people rated the quality of programming available on television. Respondents were asked to rate the overall quality from 0 (no quality at all) to 100 (extremely good quality). The stem-and-leaf display of the data is shown below. Stem Leaves 3 2 6 4 0 3 4 7 8 9 9 9 5 0 1 1 2 3 4 5 6 1 2 5 6 6 7 1 7 8 9 3 156) Identify the maximum quality rating. 156) A) 49 B) 93 C) 100 D) 3 Answer: B Explanation: A) B) C) D) 70
  • 71. Provide an appropriate response. 157) Three statistics classes (each of 50 students) took the same test. Shown below are histograms of the scores for the classes. Which class had the smallest standard deviation? Which class had the largest standard deviation? 157) A) 1, 3 B) 3, 2 C) 2, 1 D) 3, 1 Answer: D Explanation: A) B) C) D) 158) The histograms below display the body fat percentages of 42 female students and 48 male students taking a college health course. Do the female or male students have a larger standard deviation? 158) A) male students B) female students Answer: B Explanation: A) B) 71
  • 72. The following data show the number of laps run by each participant in a timed running race: 46 65 55 43 51 48 57 30 43 49 32 56 159) If the stems are 3, 4, 5 and 6,what are the values of the leaves are on the "4 stem"? 159) A) 5 B) 3, 6, 8, 9 C) 0 D) 3, 3, 6, 8, 9 Answer: D Explanation: A) B) C) D) Provide an appropriate response. 160) Histograms are presented below for three different samples. To which of the samples does the empirical rule apply? Histogram I Histogram II Histogram III 160) 72
  • 73. A) I and II B) II only C) I only D) I and III Answer: C Explanation: A) B) C) D) Determine the quartile, percentile or interquartile range as specified. 161) When Scholastic Achievement Scores (SAT's) are sent to test-takers, the percentiles associated with their scores are also given. Suppose a test-taker scored at the 75th percentile for their verbal grade and at the 37th percentile for their quantitative grade. Interpret these results. 161) A) This student performed better than 75% of the other test-takers in the verbal part and better than 63% in the quantitative part. B) This student performed better than 25% of the other test-takers in the verbal part and better than 37% in the quantitative part. C) This student performed better than 25% of the other test-takers in the verbal part and better than 63% in the quantitative part. D) This student performed better than 75% of the other test-takers in the quantitative part and better than 37% in the verbal part. E) This student performed better than 75% of the other test-takers in the verbal part and better than 37% in the quantitative part. Answer: E Explanation: A) B) C) D) E) 73
  • 74. A sporting goods retailer conducted a customer survey to determine its customers primary reason for shopping at their store. The results are shown in the graph below. 162) What proportion of the customers responded that the merchandise was the reason they shopped at the store? 162) A) none of these B) 0.30 C) 0.43 D) 0.50 E) 30 Answer: C Explanation: A) B) C) D) E) The following data show the number of laps run by each participant in a timed running race: 46 65 55 43 51 48 57 30 43 49 32 56 163) Is the variable "number of laps run" discrete or continuous? 163) A) Continuous B) Neither C) Discrete Answer: C Explanation: A) B) C) 74
  • 75. Answer Key Testname: C2 1) D 2) E 3) A 4) B 5) E 6) B 7) D 8) C 9) B 10) B 11) D 12) B 13) C 14) A 15) B 16) A 17) C 18) D 19) D 20) C 21) A 22) E 23) E 24) B 25) D 26) E 27) B 28) B 29) B 30) E 31) D 32) D 33) D 34) C 35) median = 1.49 36) a. stock performance b. categorical c. up d. Stock performance up same down Count 0.525 0.175 0.300 37) categorical 38) minimum value; Q1; median; Q3; maximum value 75
  • 76. Answer Key Testname: C2 39) a. number of children under five b. discrete c. 1 d. Number of children under five 0 1 2 3 4 Count 0.25 0.30 0.20 0.20 0.05 40) a. Unemployment Rate 2003-2012 Unemployment Rate (Percent) 2003 2004 2005 2006 2007 2008 2009 2010 2011 2012 Year b. There is a clear decreasing trend over time; c. No, a histogram would not depict the trend in this dataset. 41) This clarifies what percent a slice represents and which of two slices is larger. 42) a. 0 to 0.49, 0.5 to 0.99, 1.0 to 1.49, 1.5 to 1.99, 2.0 to 2.49, 2.5 to 2.99, 3.0 to 3.49, 3.5 to 3.99, 4.0 to 4.49, 4.5 to 4.99; b. The distribution is skewed to the right. c. You can get the actual data values from a dot plot or stem-and-leaf plot. d. The shape would not change. 43) The first graph shows the total numbers of students for each year as well as the number of female students. We can see the downward trend in overall enrollment, the slight upward trend in female enrollment and that female enrollment is small relative to total enrollment. However, with both total enrollment and female enrollment on the same graph, since female enrollment is small relative to total enrollment, the scale is not suitable for female enrollment and the upward trend in female enrollment is not very clear. Since both total enrollment and female enrollment are varying with time, the second graph which shows female enrollment as a percentage of total enrollment may be more useful. It is clear from this graph that as a percentage of total enrollment, female enrollment is increasing significantly. However, this graph gives no indication of the absolute number of students (overall or female) and without reference to the first graph, we cannot know whether the percentage female enrollment is increasing because female enrollment is increasing, because male enrollment is decreasing, or both. 76
  • 77. Answer Key Testname: C2 44) a. b. The distribution is approximately symmetrical; c. standard deviation = 1.779 inches; The typical distance the data falls from the mean is 1.779 inches. 45) mean; median 46) range 47) outliers 48) a. median = about 10 million shares; b. yes, 3; c. The distribution is skewed to the right. The IQR would be a better measure of spread for this dataset, because it is highly skewed and contains 3 potential outliers. The standard deviation is not a resistant measure of variability. 49) quantitative 50) The bars are not drawn in the correct proportions. 51) 1 2 3 4 5 6 7 8 9 4 4 5 6 9 6 7 9 2 3 5 7 8 8 9 0 4 5 6 8 52) Total Tobacco Exposure Time Exposure Time (seconds) This distribution appears to be skewed to the right. 53) Possible answer: The area of the television on the right is nine times (not three times) the area of the television on the left. The pictogram gives the visual impression that sales in 2012 were nine times the sales in 2002. 54) histogram 55) minimum = 2 seconds, Q1 = 10 seconds, median = 51 seconds, Q3 = 191 seconds, and maximum = 548 seconds 77
  • 78. Answer Key Testname: C2 56) mean = 1.471 57) 58) z-score 59) Possible answer: The graph is misleading because it is truncated. The scale on the vertical axis should start at zero so that the bars will be in the correct proportions. A part of the vertical axis could be omitted but the symbol // should then be used to warn the reader of the modified axis. 60) a. b. No, both a dot plot and a stem-and-leaf plot are used on small quantitative datasets. 61) 78
  • 79. Answer Key Testname: C2 62) a. b. Since the categories of Internet usage pattern have a natural order from never to daily, it makes more sense to leave the categories in this natural order rather than ordering them from the tallest bar to the shortest bar. 63) The first graph shows the total numbers of students for each year as well as the number of female students. We can see the downward trend in overall enrollment, the slight upward trend in female enrollment and that female enrollment is small relative to total enrollment. However, with both total and female enrollment on the same graph, since female enrollment is small relative to total enrollment, the scale is not suitable for female enrollment and the upward trend in female enrollment is not very clear. This upward trend is much clearer from the second graph which shows female enrollment alone, However this graph gives no indication of how female enrollment compares to total enrollment. 64) mean = 1.985, median = 1.85; The median seems more appropriate for this dataset, because this dataset is highly skewed to the right. 79
  • 80. Answer Key Testname: C2 65) a. b. Since it is of interest to know which categories were more useful to consumers, ordering the categories as in a Pareto chart would be more appropriate than listing them alphabetically. 66) Possible answer: The average price increases by 25% from 2008 to 2009. Using the truncated graph, the price appears to double from 2008 to 2009 (i.e. it appears to increase by 100%). Using the truncated graph, the differences between the bars seem bigger (relatively) than they really are. 67) 68) A 69) B 70) B 71) D 72) B 73) E 74) A 75) C 76) C 77) A 78) B 79) C 80) A 81) B 82) A 83) D 80
  • 81. Answer Key Testname: C2 84) C 85) E 86) A 87) C 88) B 89) D 90) D 91) E 92) A 93) B 94) D 95) D 96) A 97) B 98) B 99) E 100) C 101) D 102) B 103) B 104) A 105) B 106) D 107) B 108) B 109) E 110) C 111) A 112) C 113) C 114) E 115) C 116) A 117) B 118) D 119) B 120) E 121) B 122) A 123) A 124) B 125) E 126) B 127) B 128) A 129) E 130) C 131) E 132) A 133) A 81
  • 82. Answer Key Testname: C2 134) B 135) B 136) A 137) B 138) B 139) B 140) D 141) A 142) D 143) B 144) D 145) D 146) B 147) B 148) B 149) C 150) E 151) A 152) E 153) B 154) E 155) B 156) B 157) D 158) B 159) D 160) C 161) E 162) C 163) C 82 Statistics The Art and Science of Learning from Data 3rd Edition Agresti Test Bank Full Download: http://alibabadownload.com/product/statistics-the-art-and-science-of-learning-from-data-3rd-edition-agresti-test-ba This sample only, Download all chapters at: alibabadownload.com