Downloaded 1,142 times


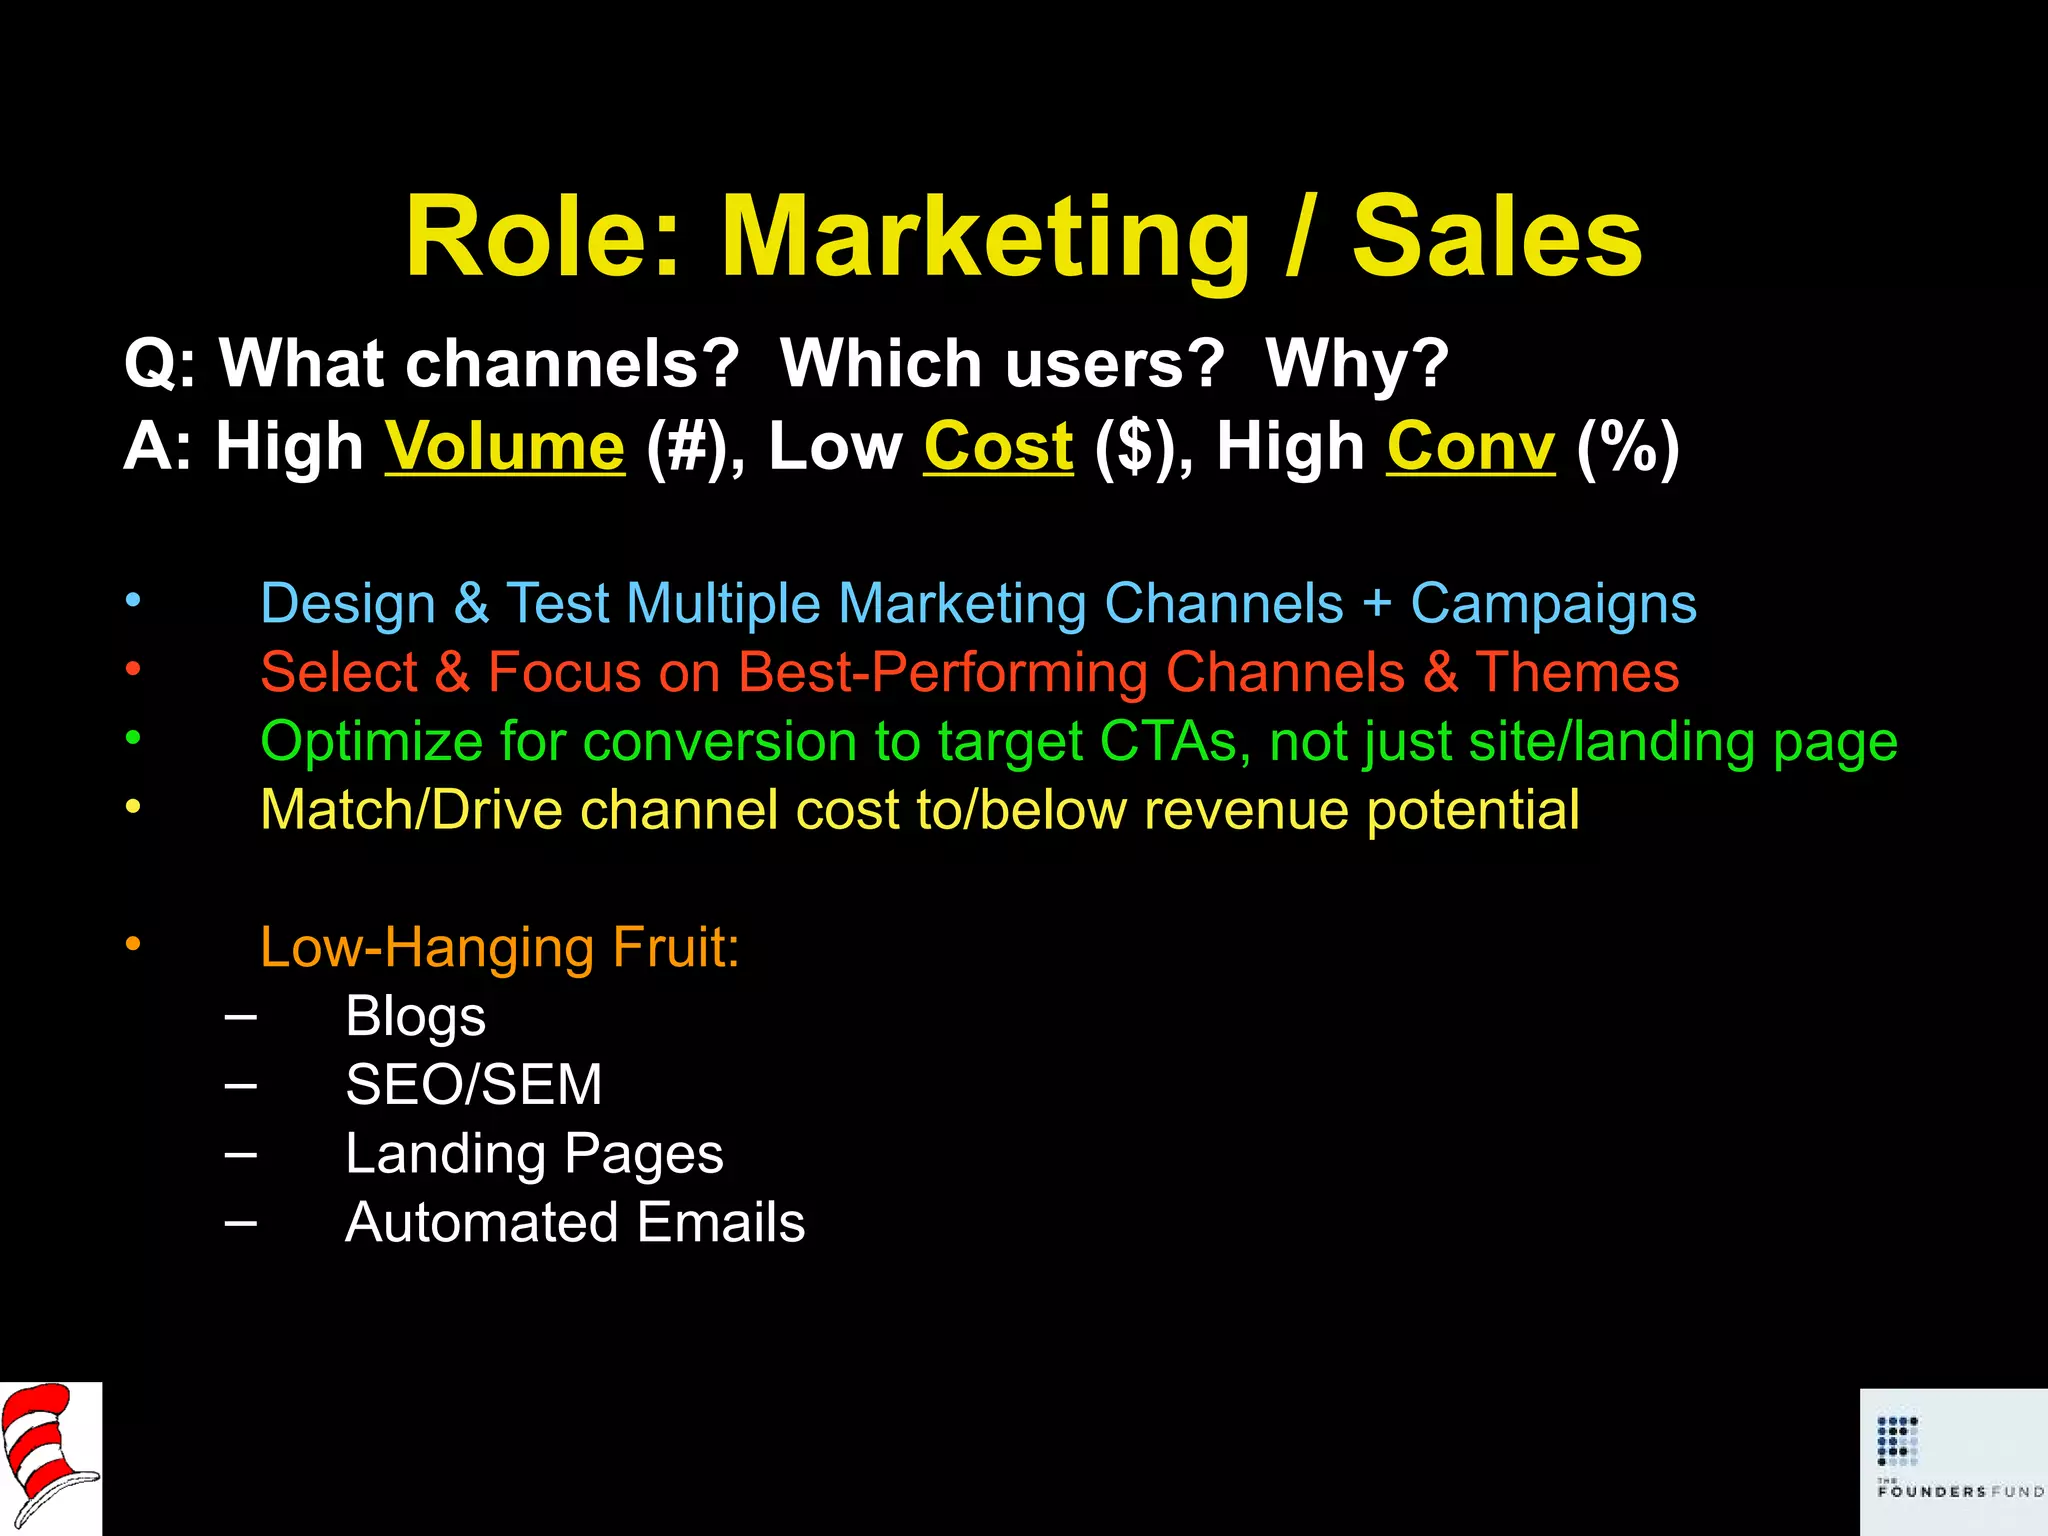
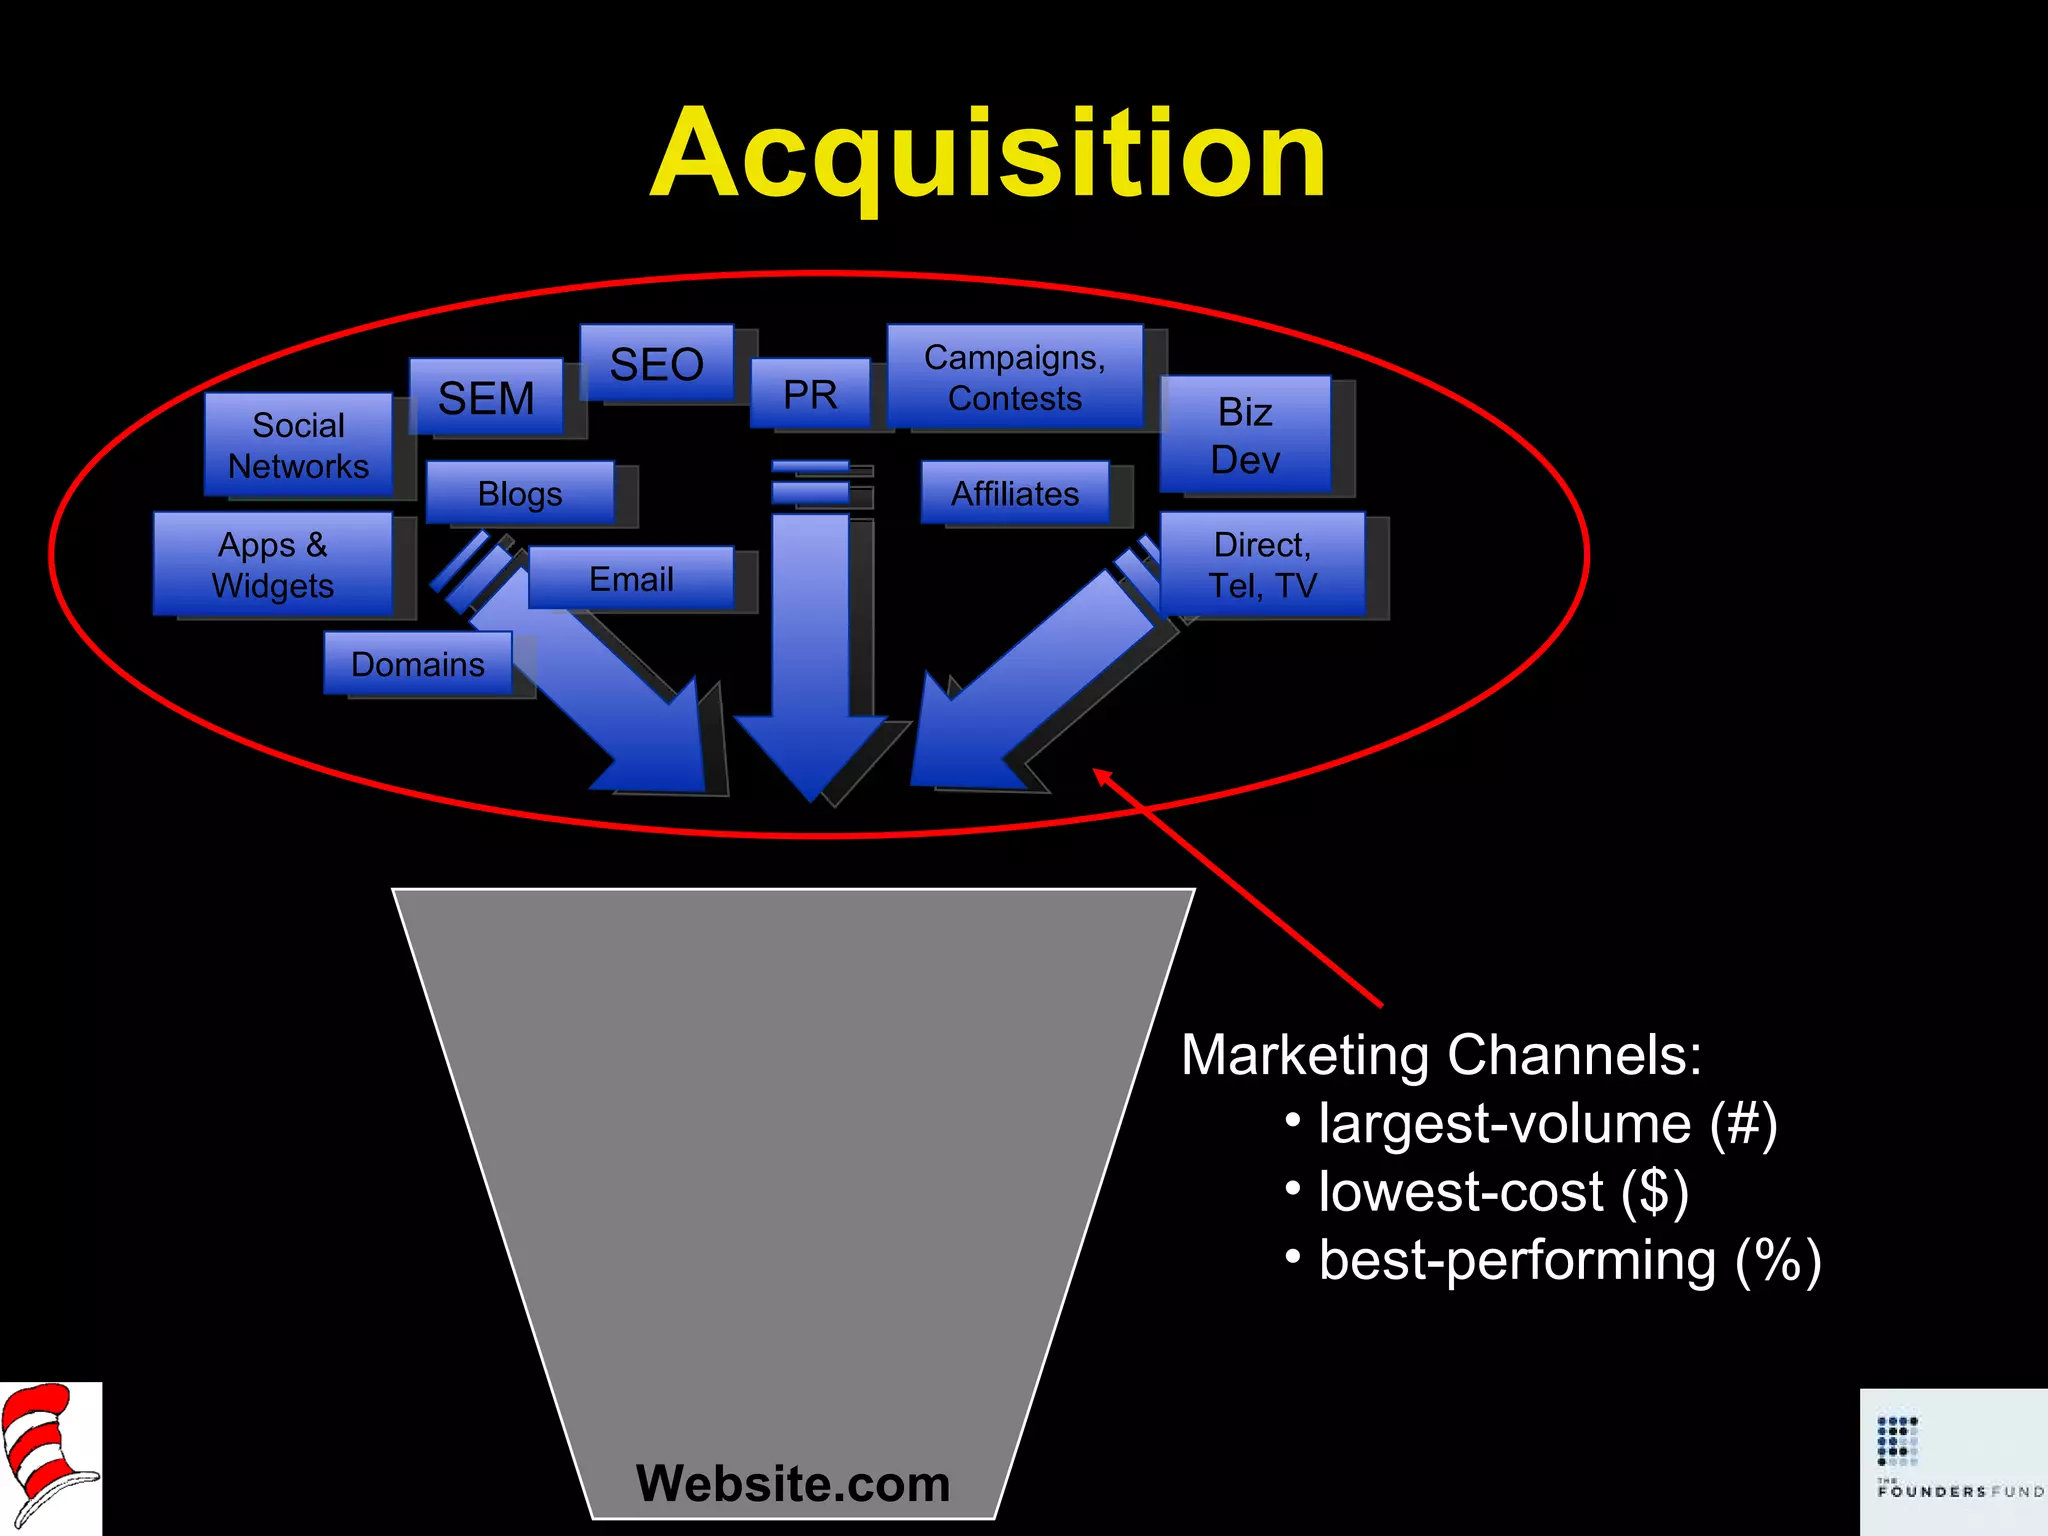
![M AARRR keting Plan Marketing Plan = Target Customer Acquisition Channels 3 Important Factors = Volume (#), Cost ($), Conversion (%) Measure conversion to target customer actions Test audience segments, campaign themes, Call-To-Action ( CTA s) [Gradually] Match Channel Costs => Revenue Potential Increase Vol. & Conversion, Decrease Cost, Optimize for Revenue Potential Avg Txn Value ( ATV ), Ann Rev Per User ( ARPU ), Cust Lifetime Value ( CLV ) Design channels that (eventually) cost <20-50% of target ATV, ARPU, CLV Consider Costs, Scarce Resource Tradeoffs Actual $ expenses Marketing time & resources Product/Engineering time & resources Cashflow timing of expense vs. revenue, profit](https://image.slidesharecdn.com/web2metricsjediproductmarketingbusinessoptimization-090403162246-phpapp01/75/How-to-be-a-Web-2-0-Metrics-Jedi-Web-2-0-Expo-April-2009-22-2048.jpg)


![[email_address] @danolsen www.yourversion.com May the Force of Metrics be with you!](https://image.slidesharecdn.com/web2metricsjediproductmarketingbusinessoptimization-090403162246-phpapp01/75/How-to-be-a-Web-2-0-Metrics-Jedi-Web-2-0-Expo-April-2009-39-2048.jpg)


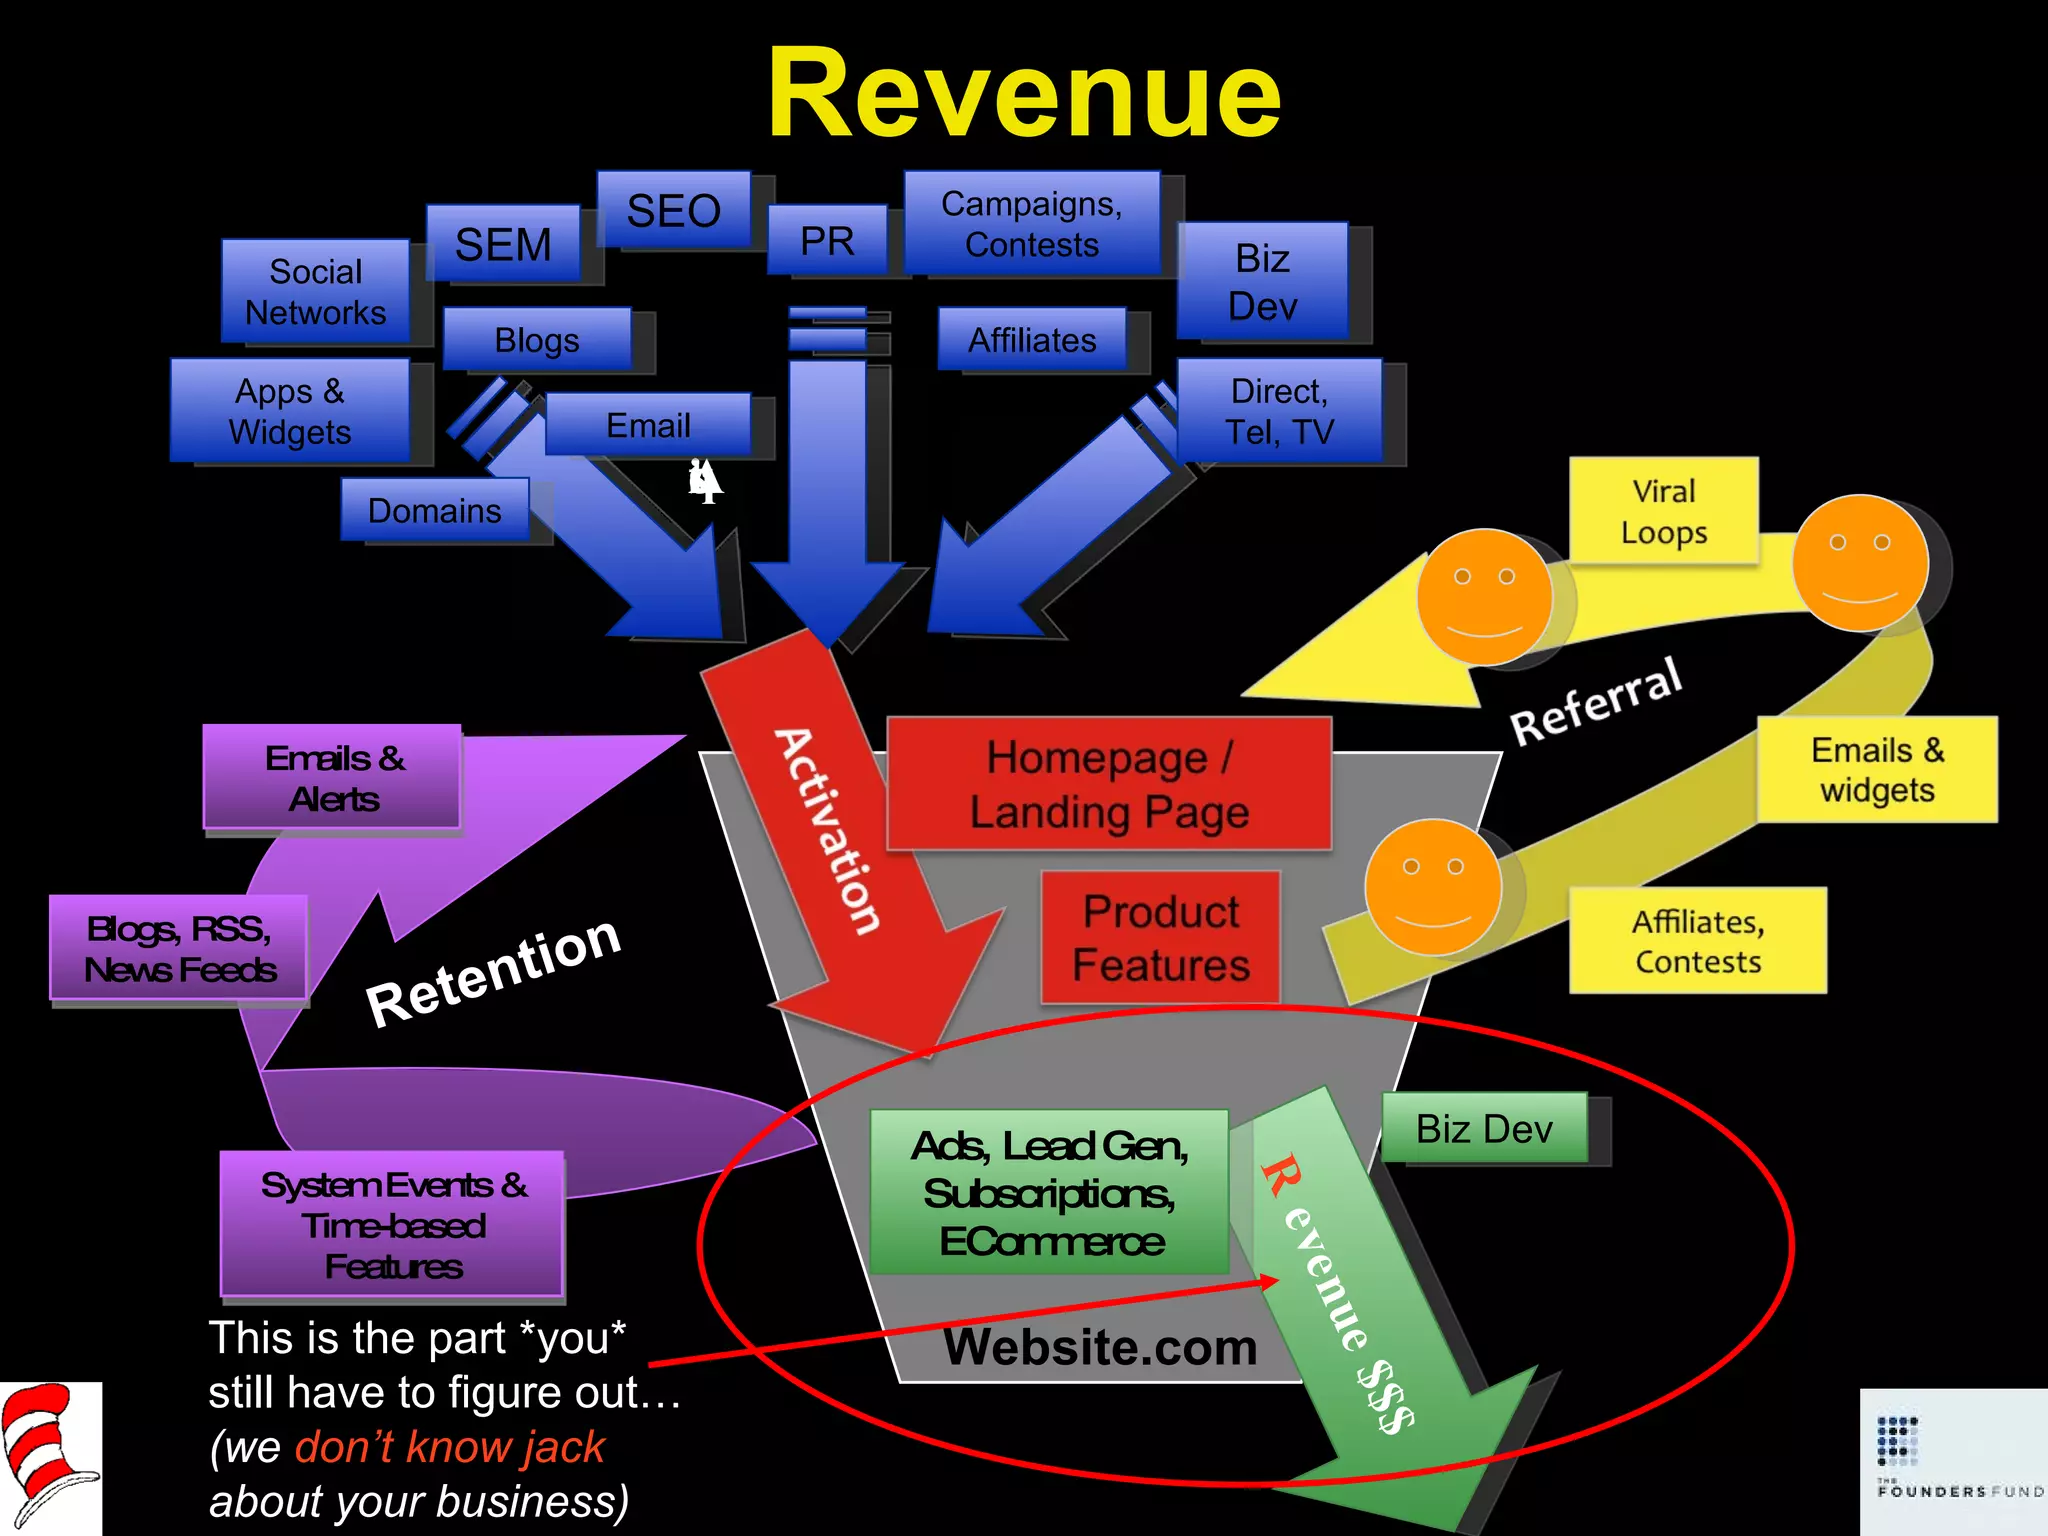


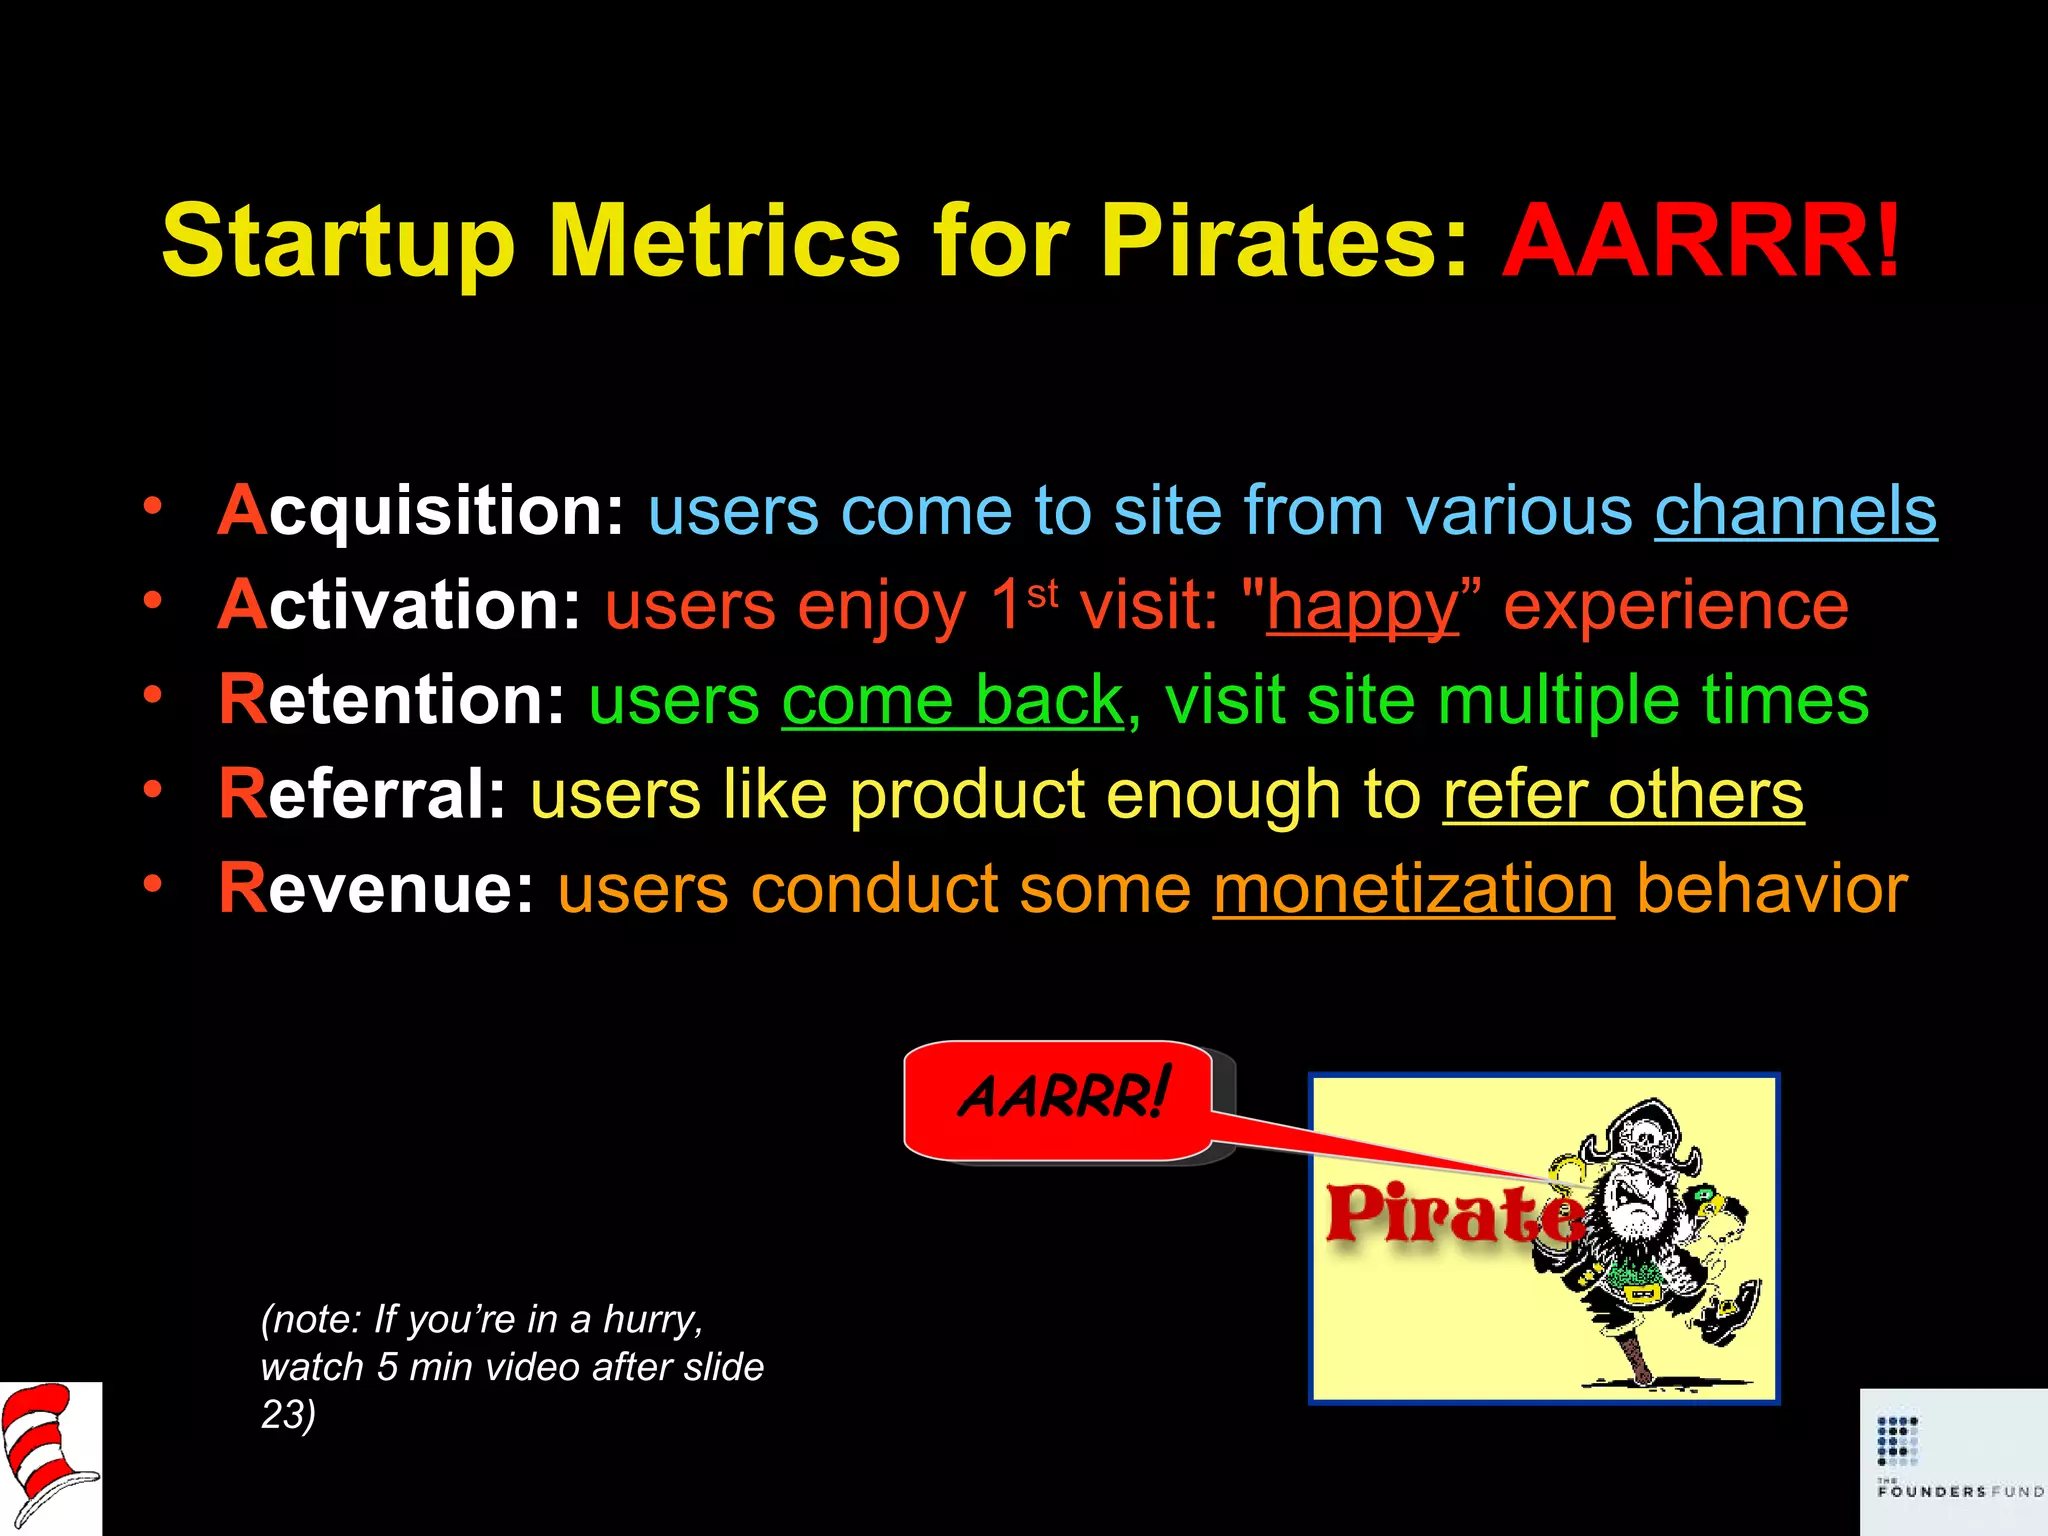
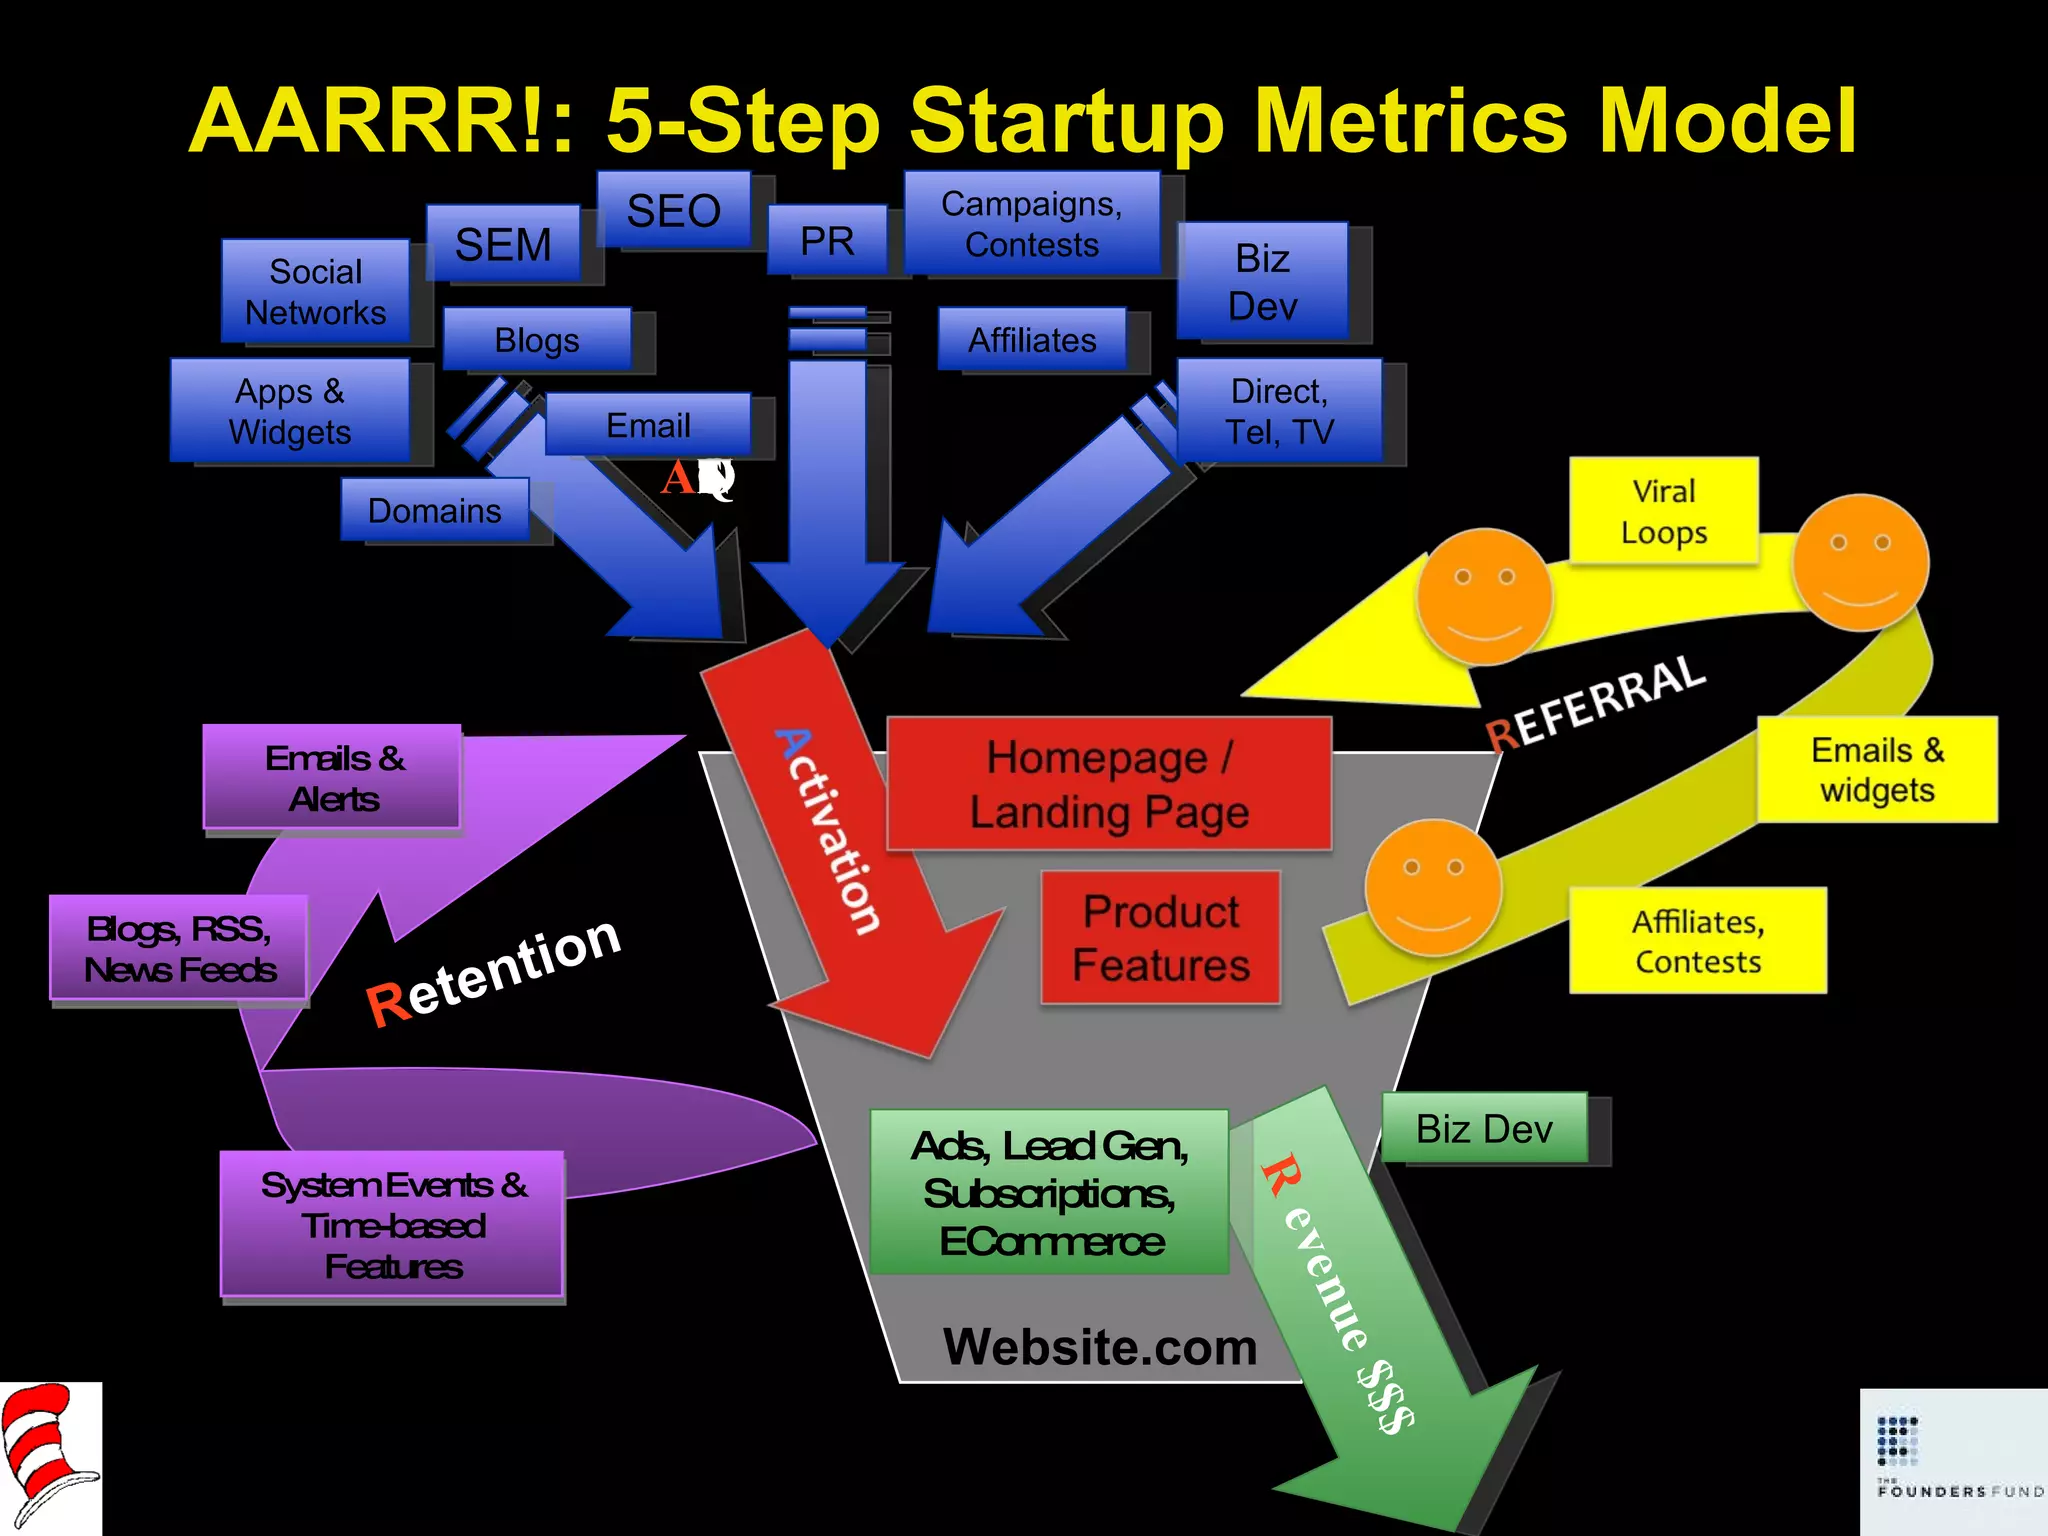
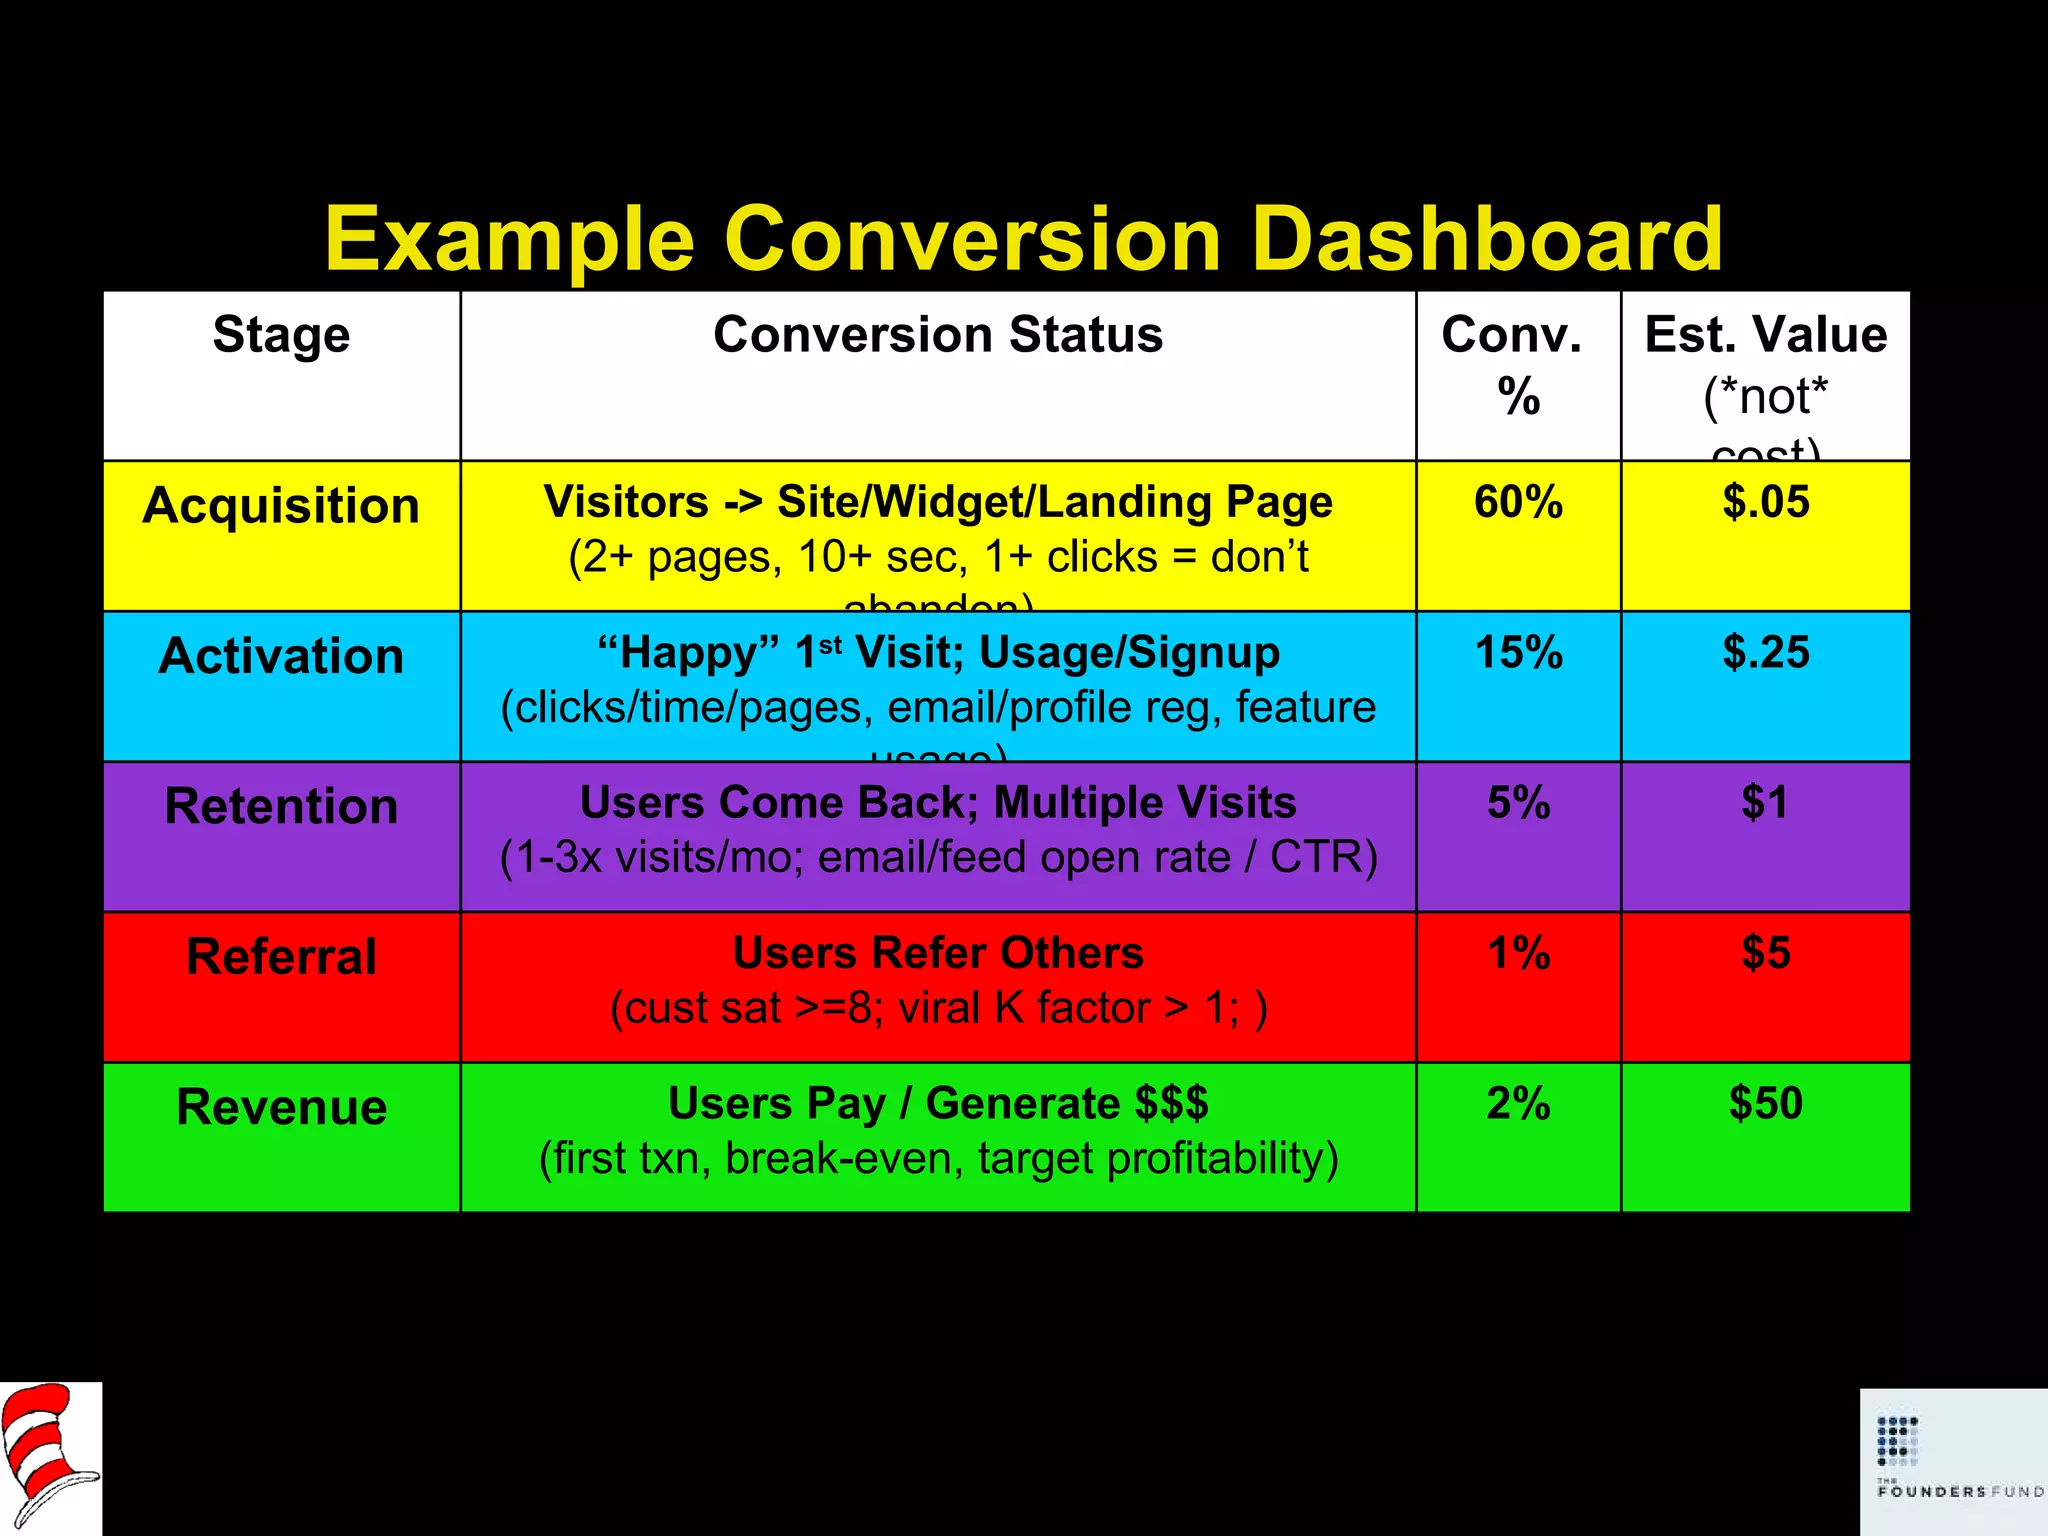
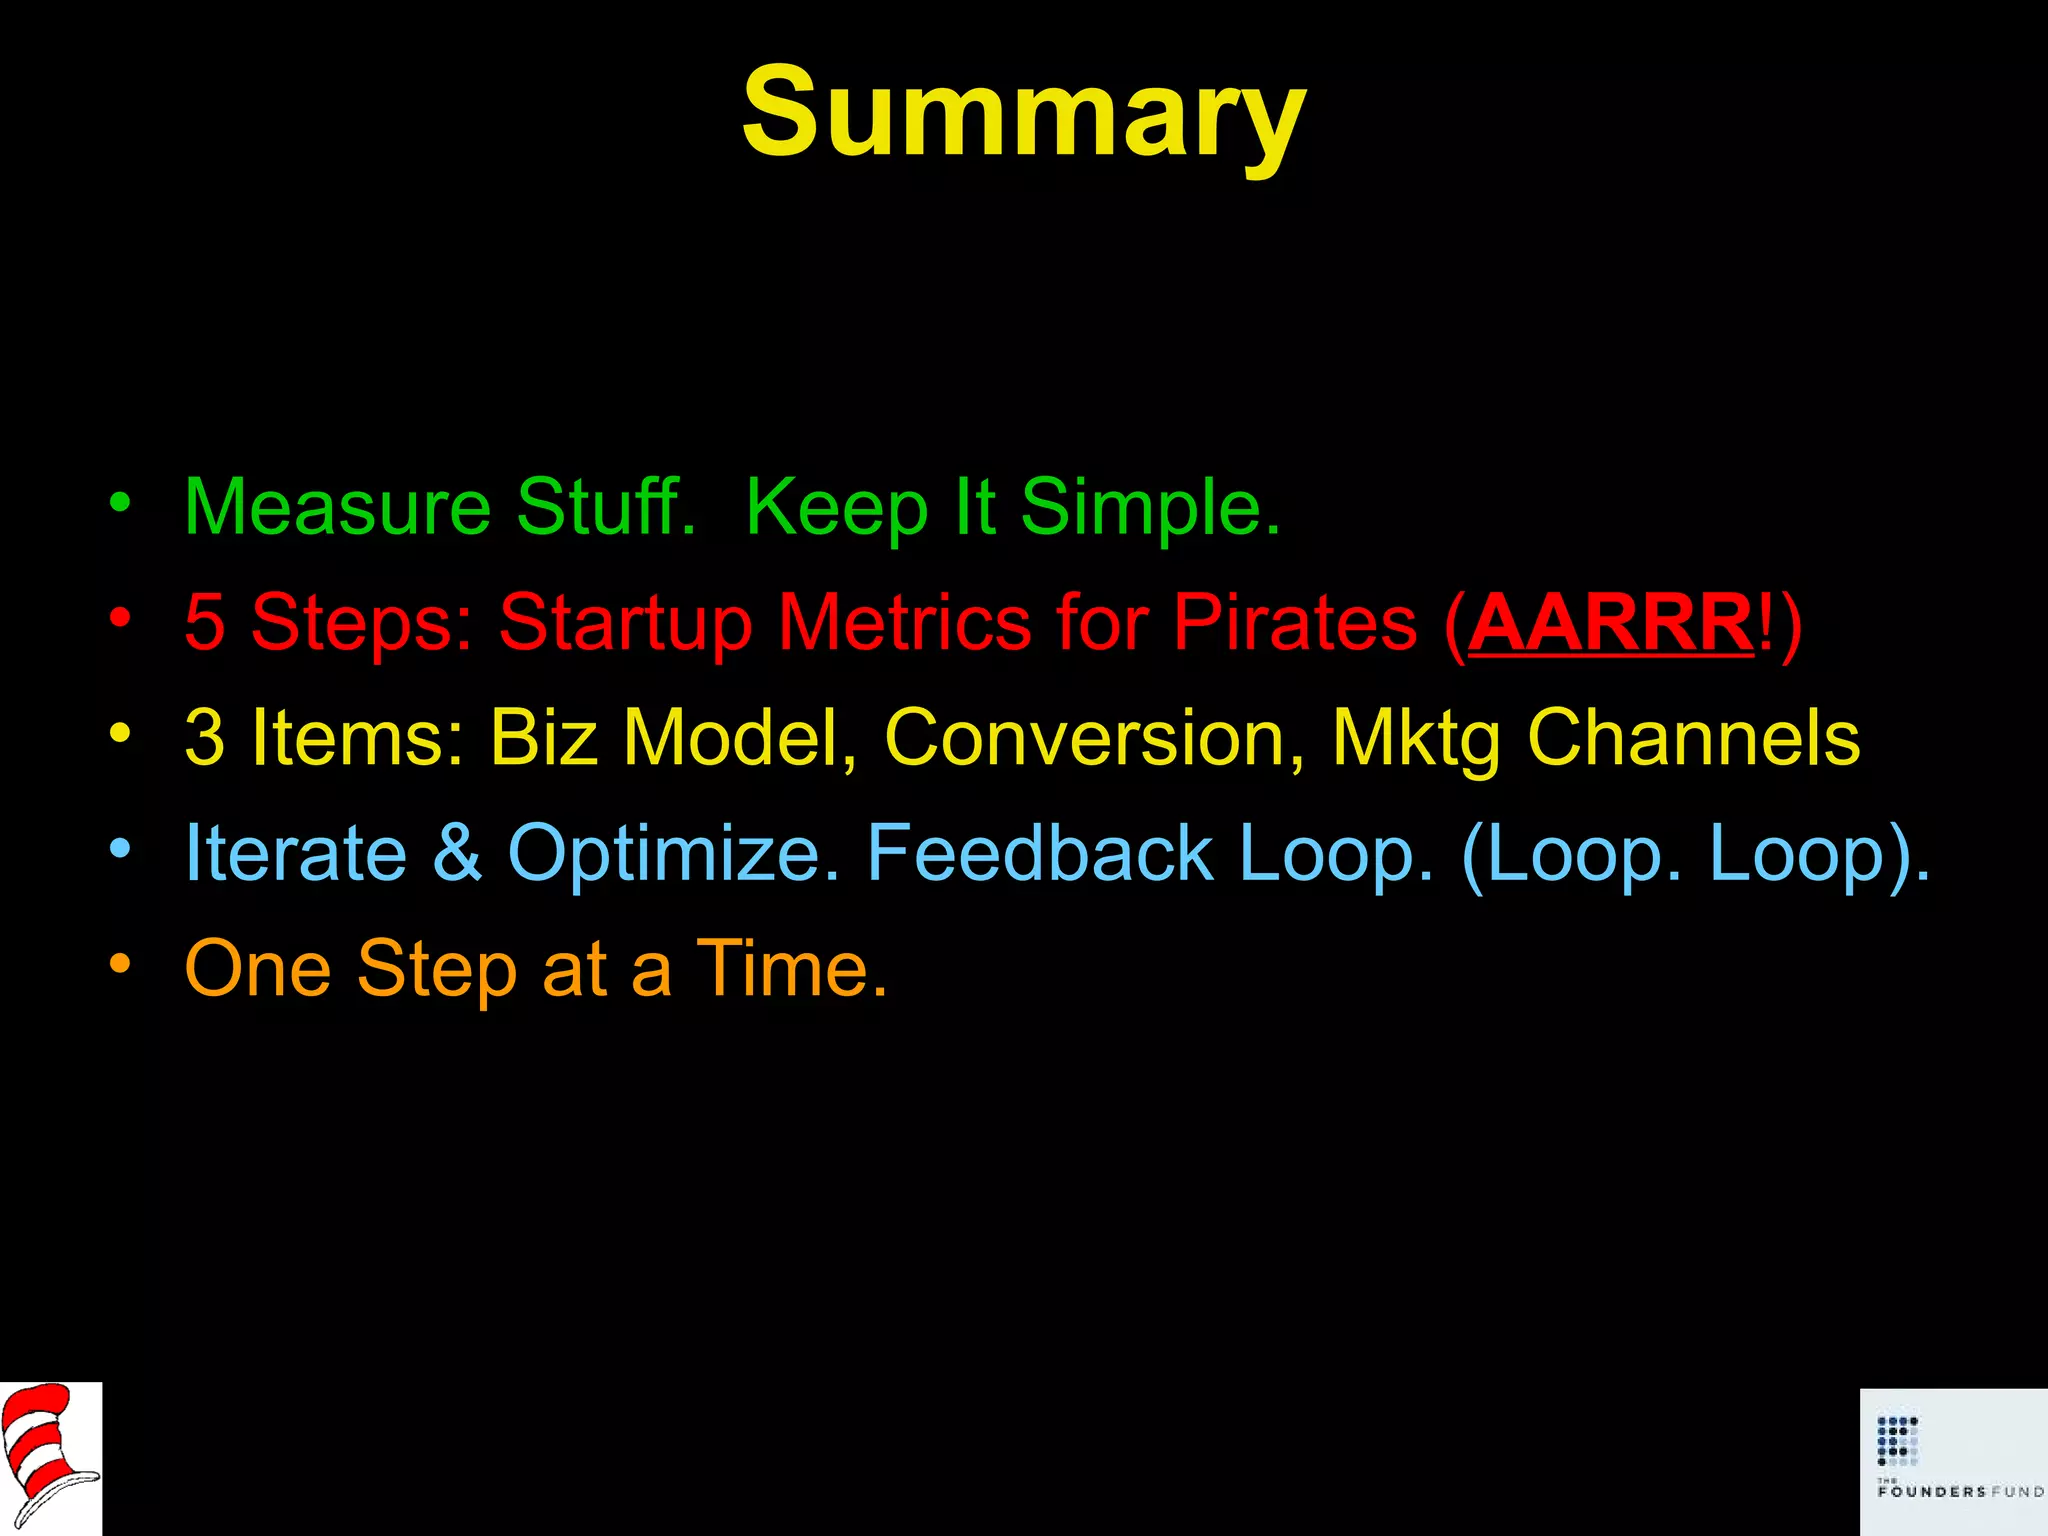
The document outlines key metrics strategies for optimizing web 2.0 businesses, emphasizing the importance of a structured approach to measuring product and marketing performance. It introduces the 'Startup Metrics for Pirates' framework (AARRR: Acquisition, Activation, Retention, Referral, Revenue) and advocates for iterative testing and optimization of both product features and marketing channels to enhance user experience and business profitability. The document also provides insights on using data-driven decision-making to focus on actionable metrics and continuously improve customer engagement.


