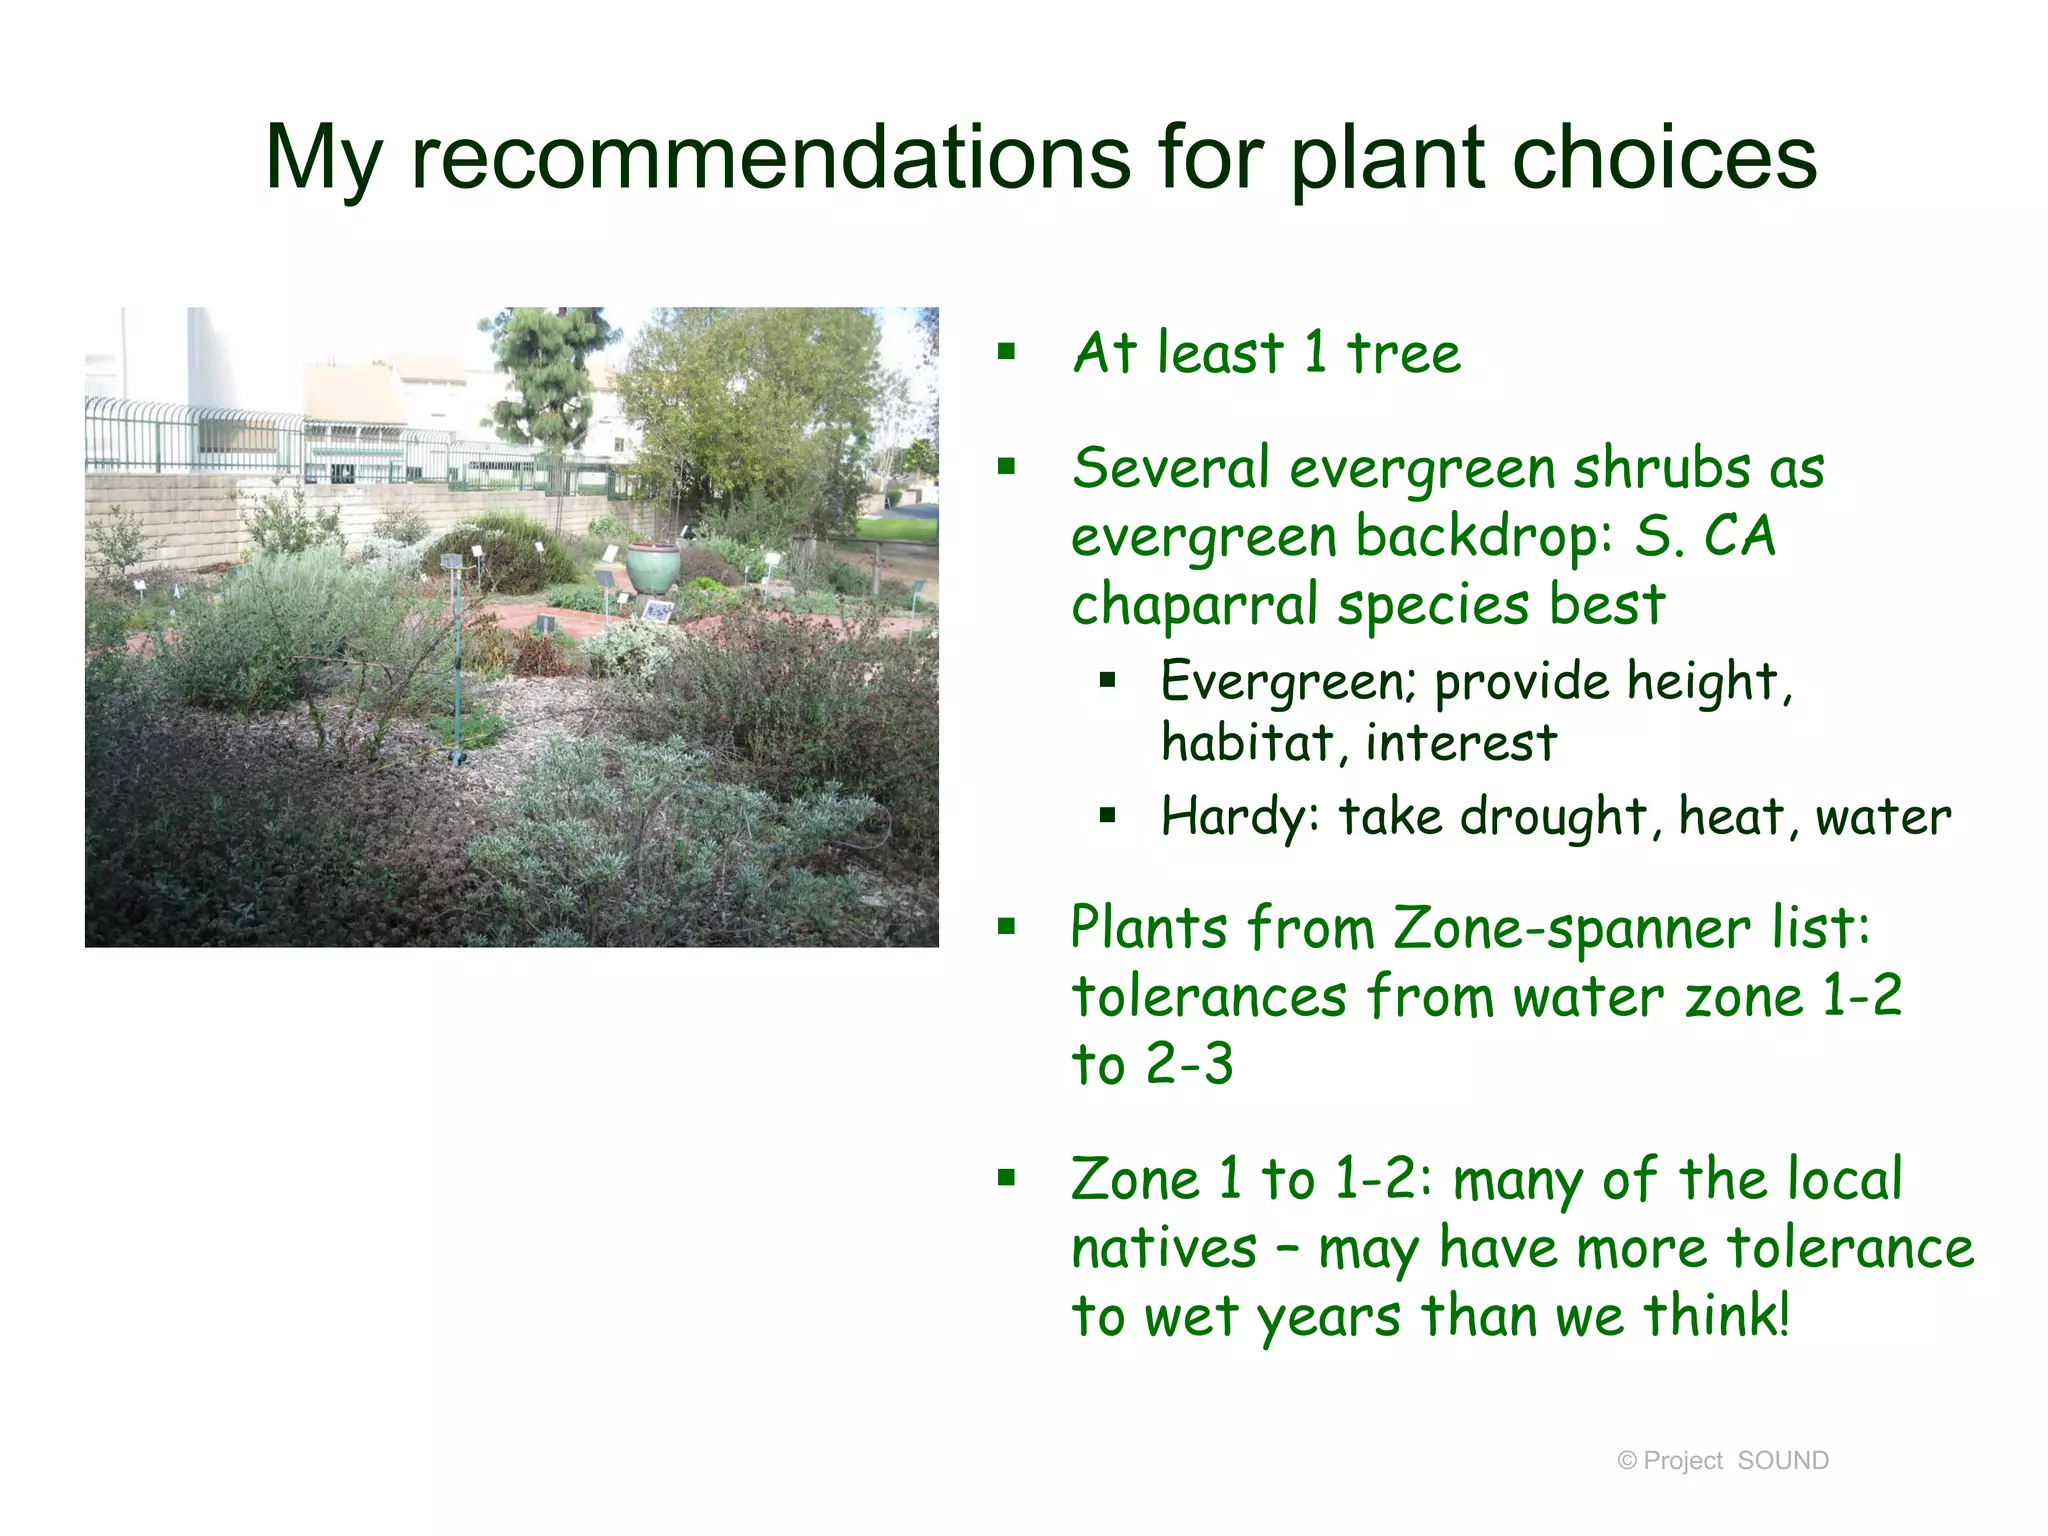
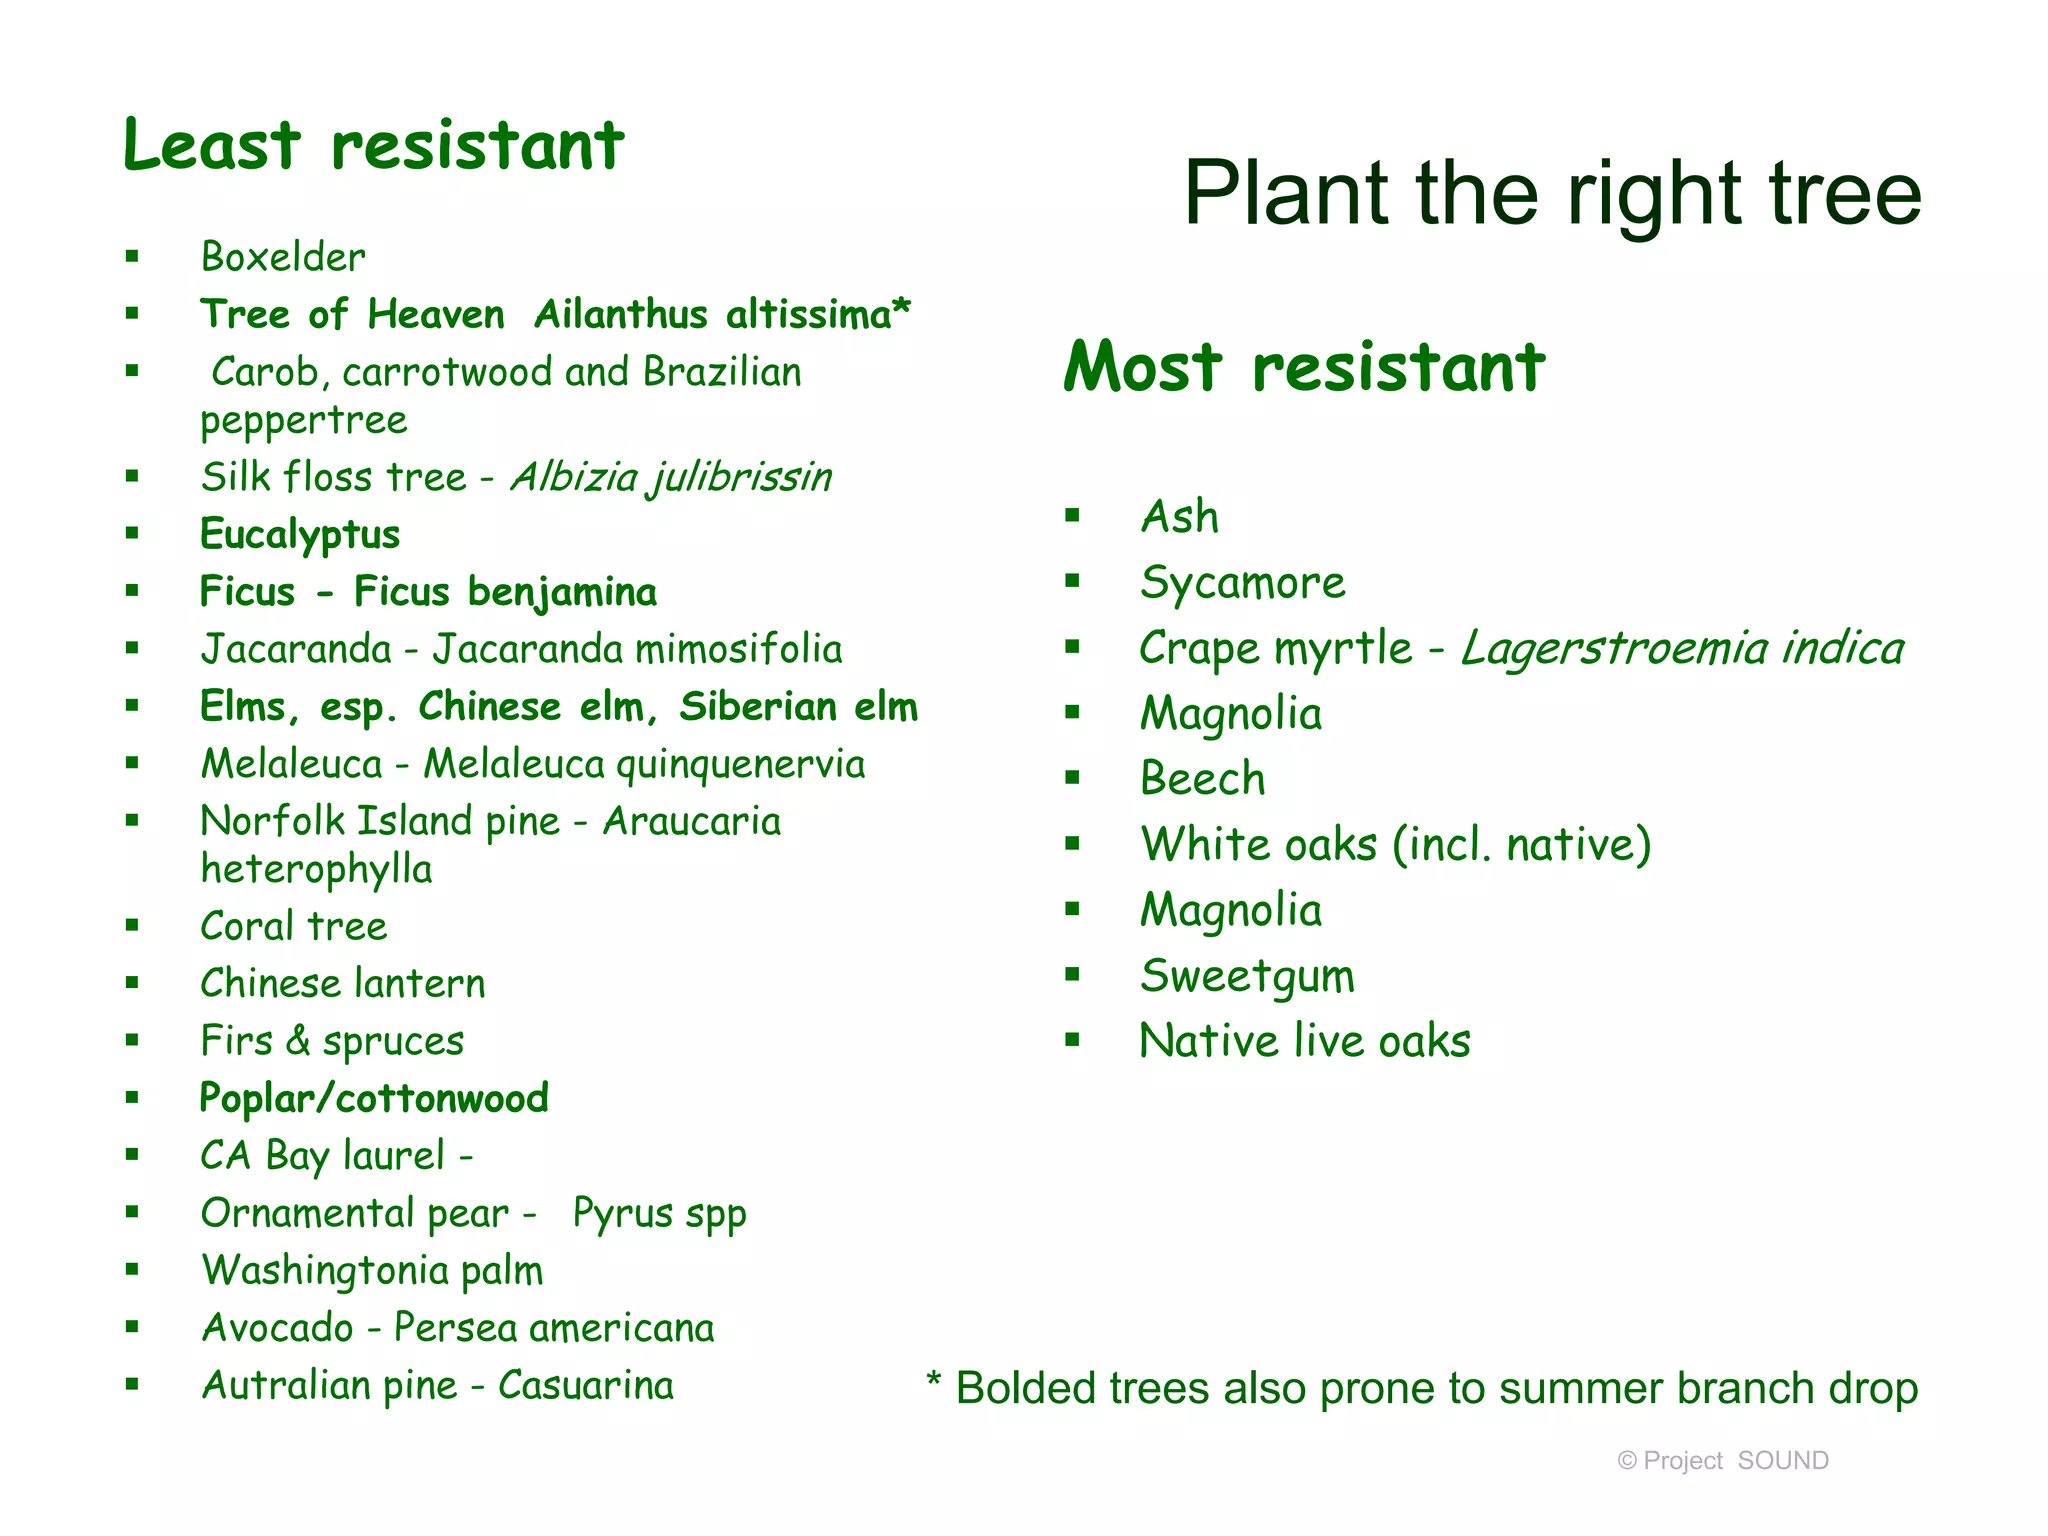
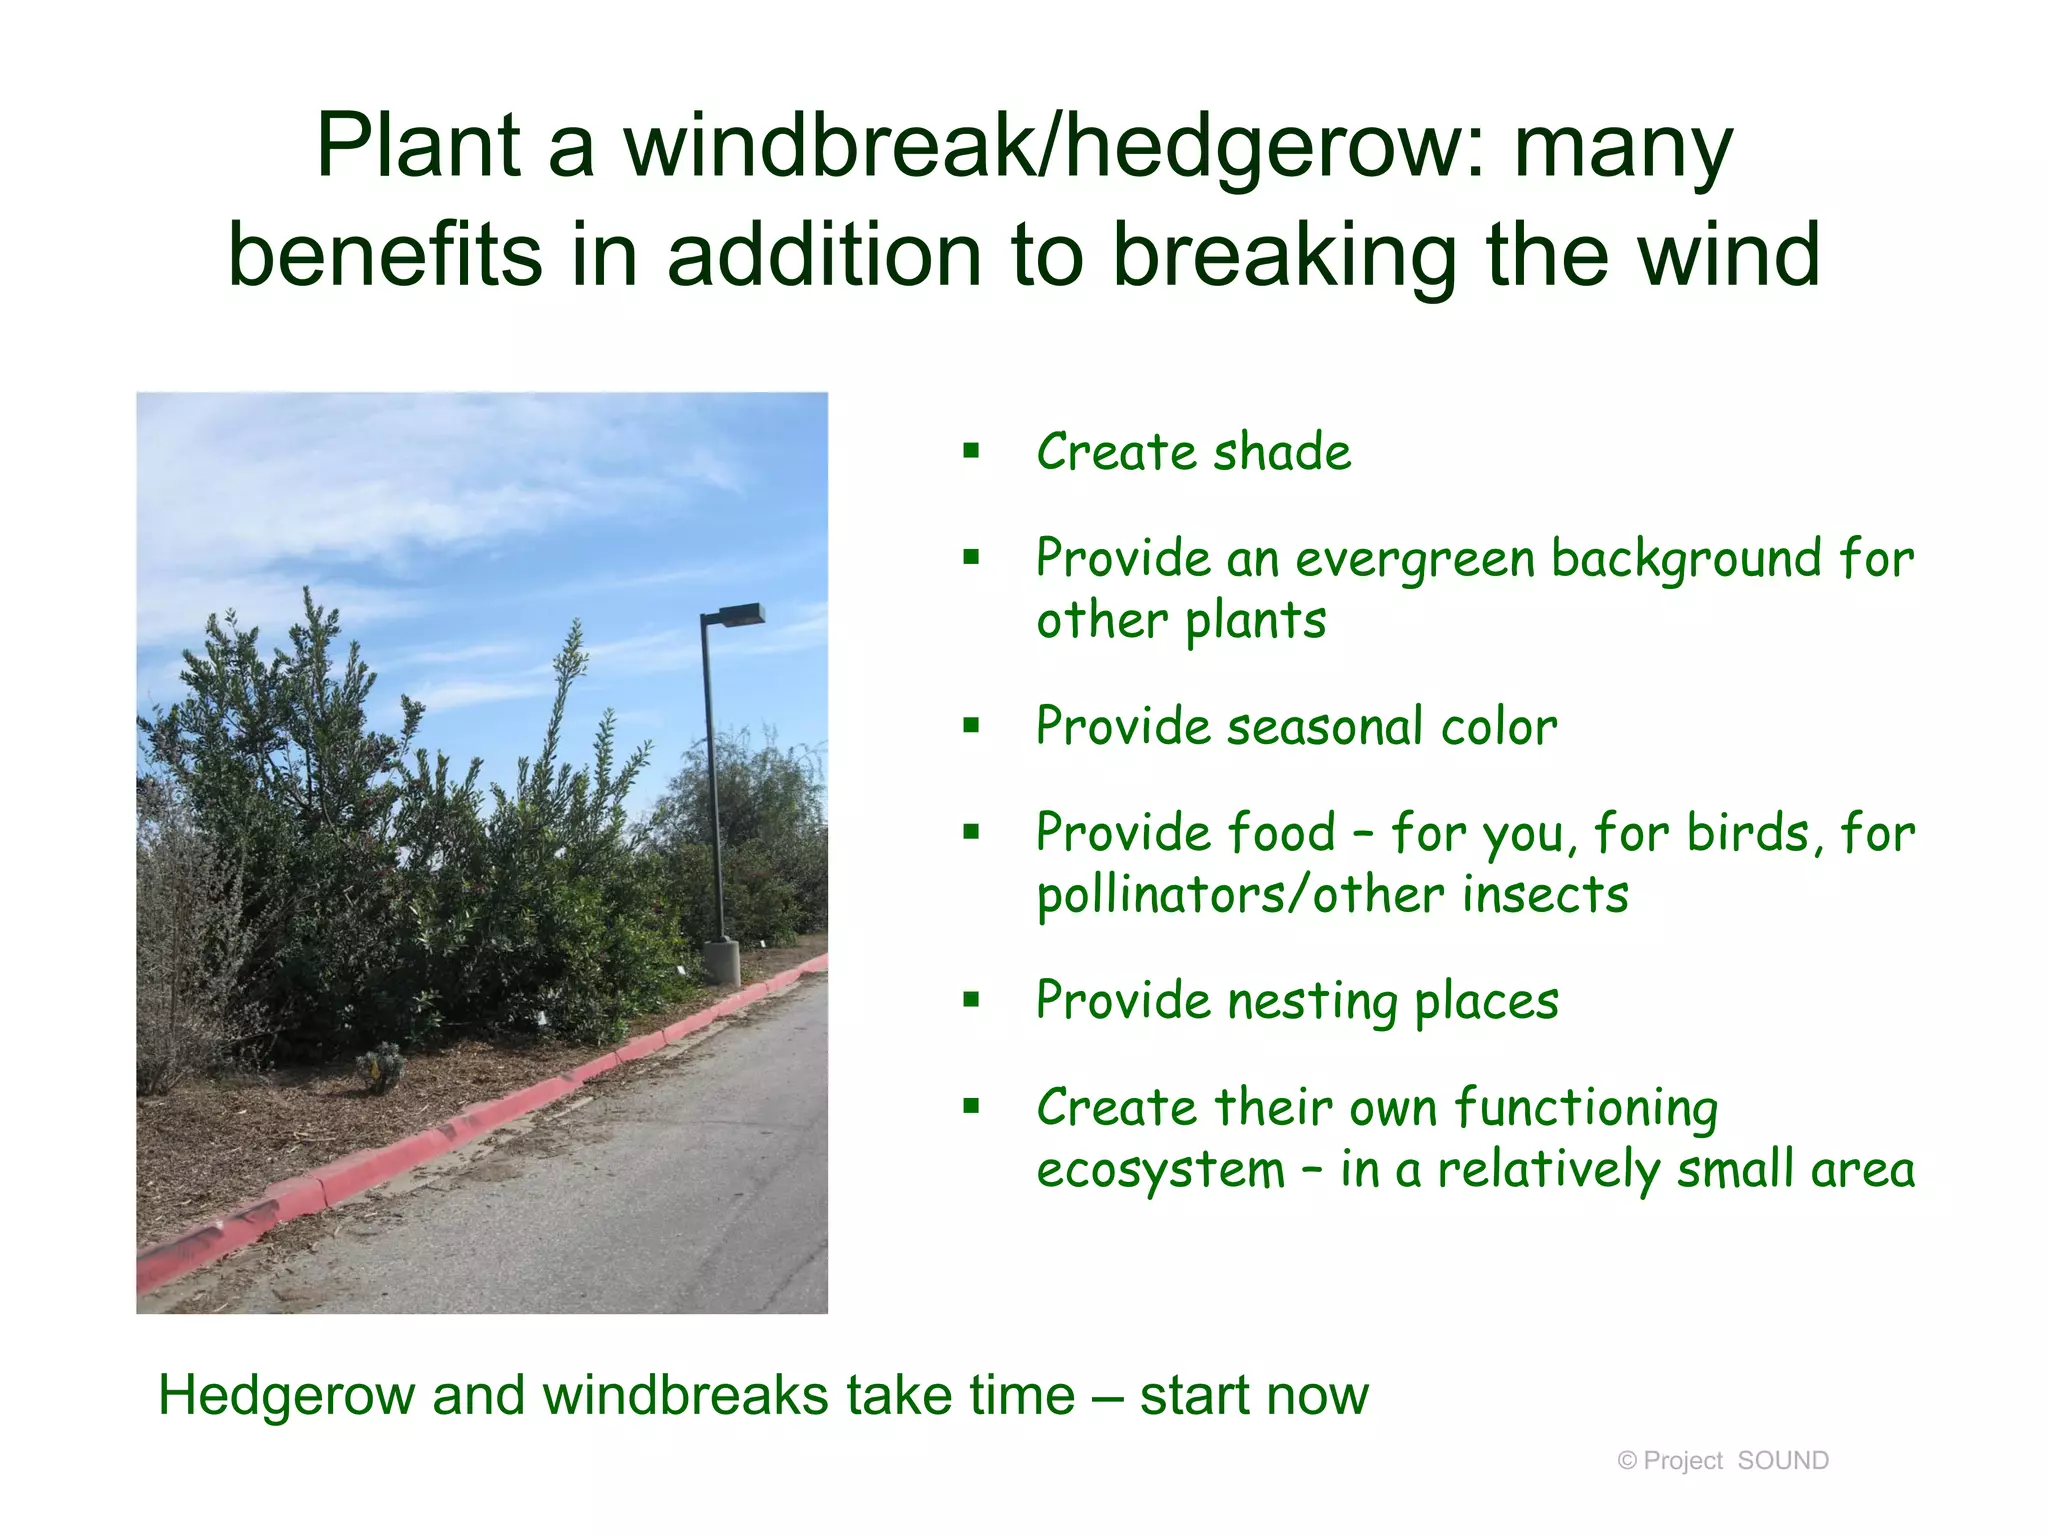
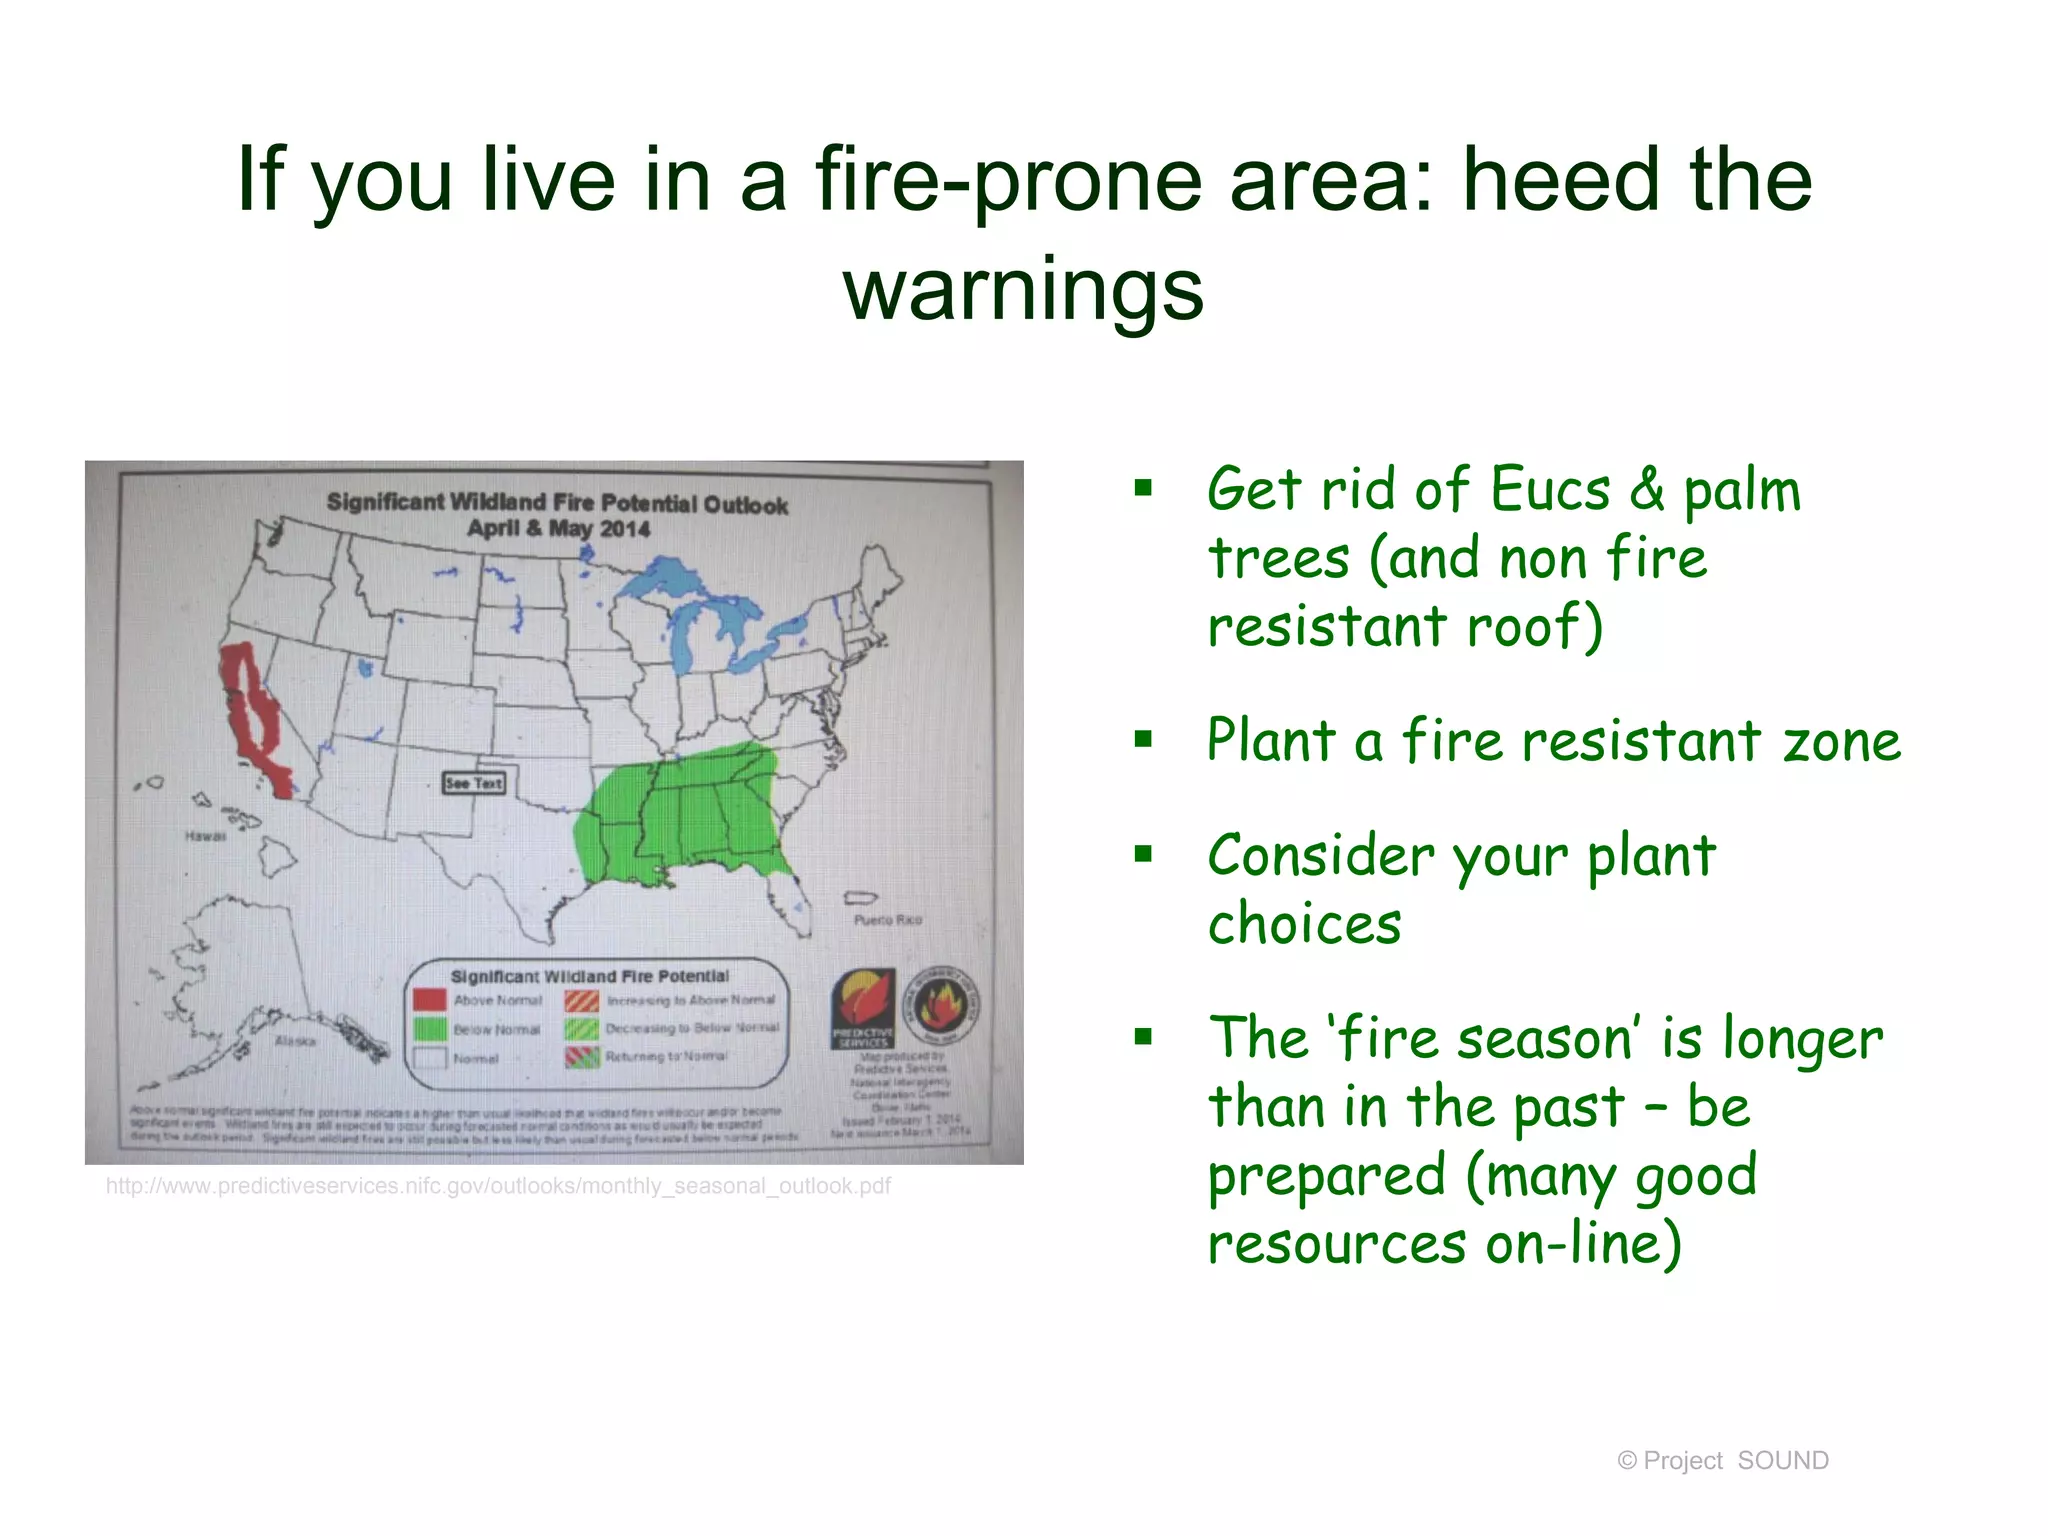
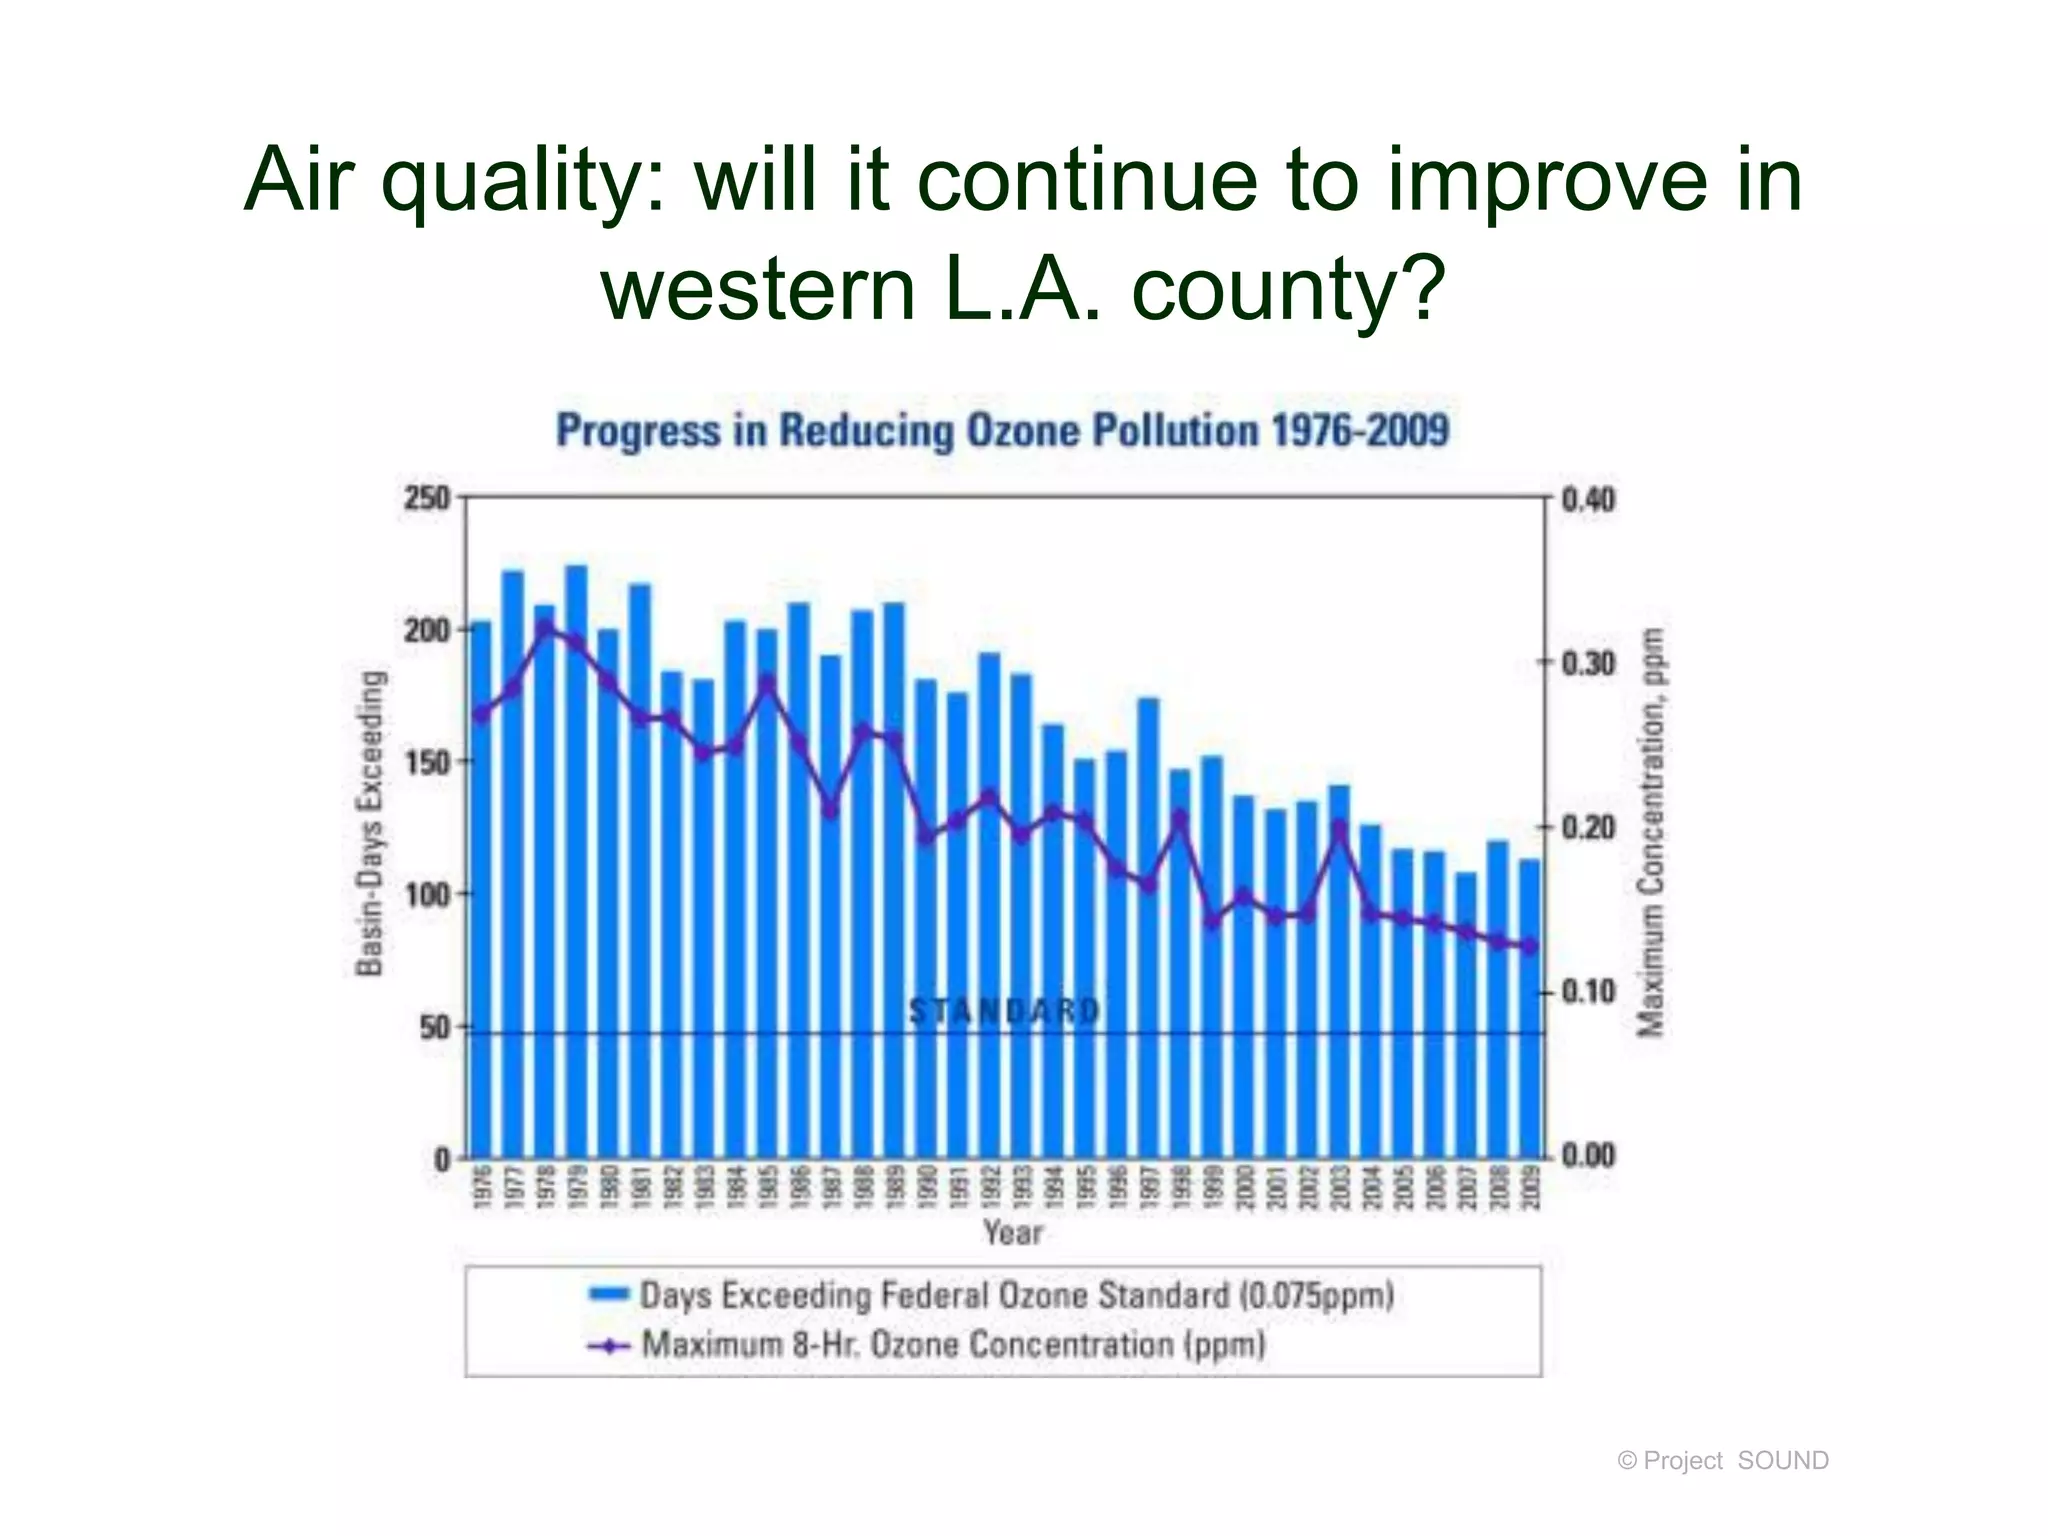
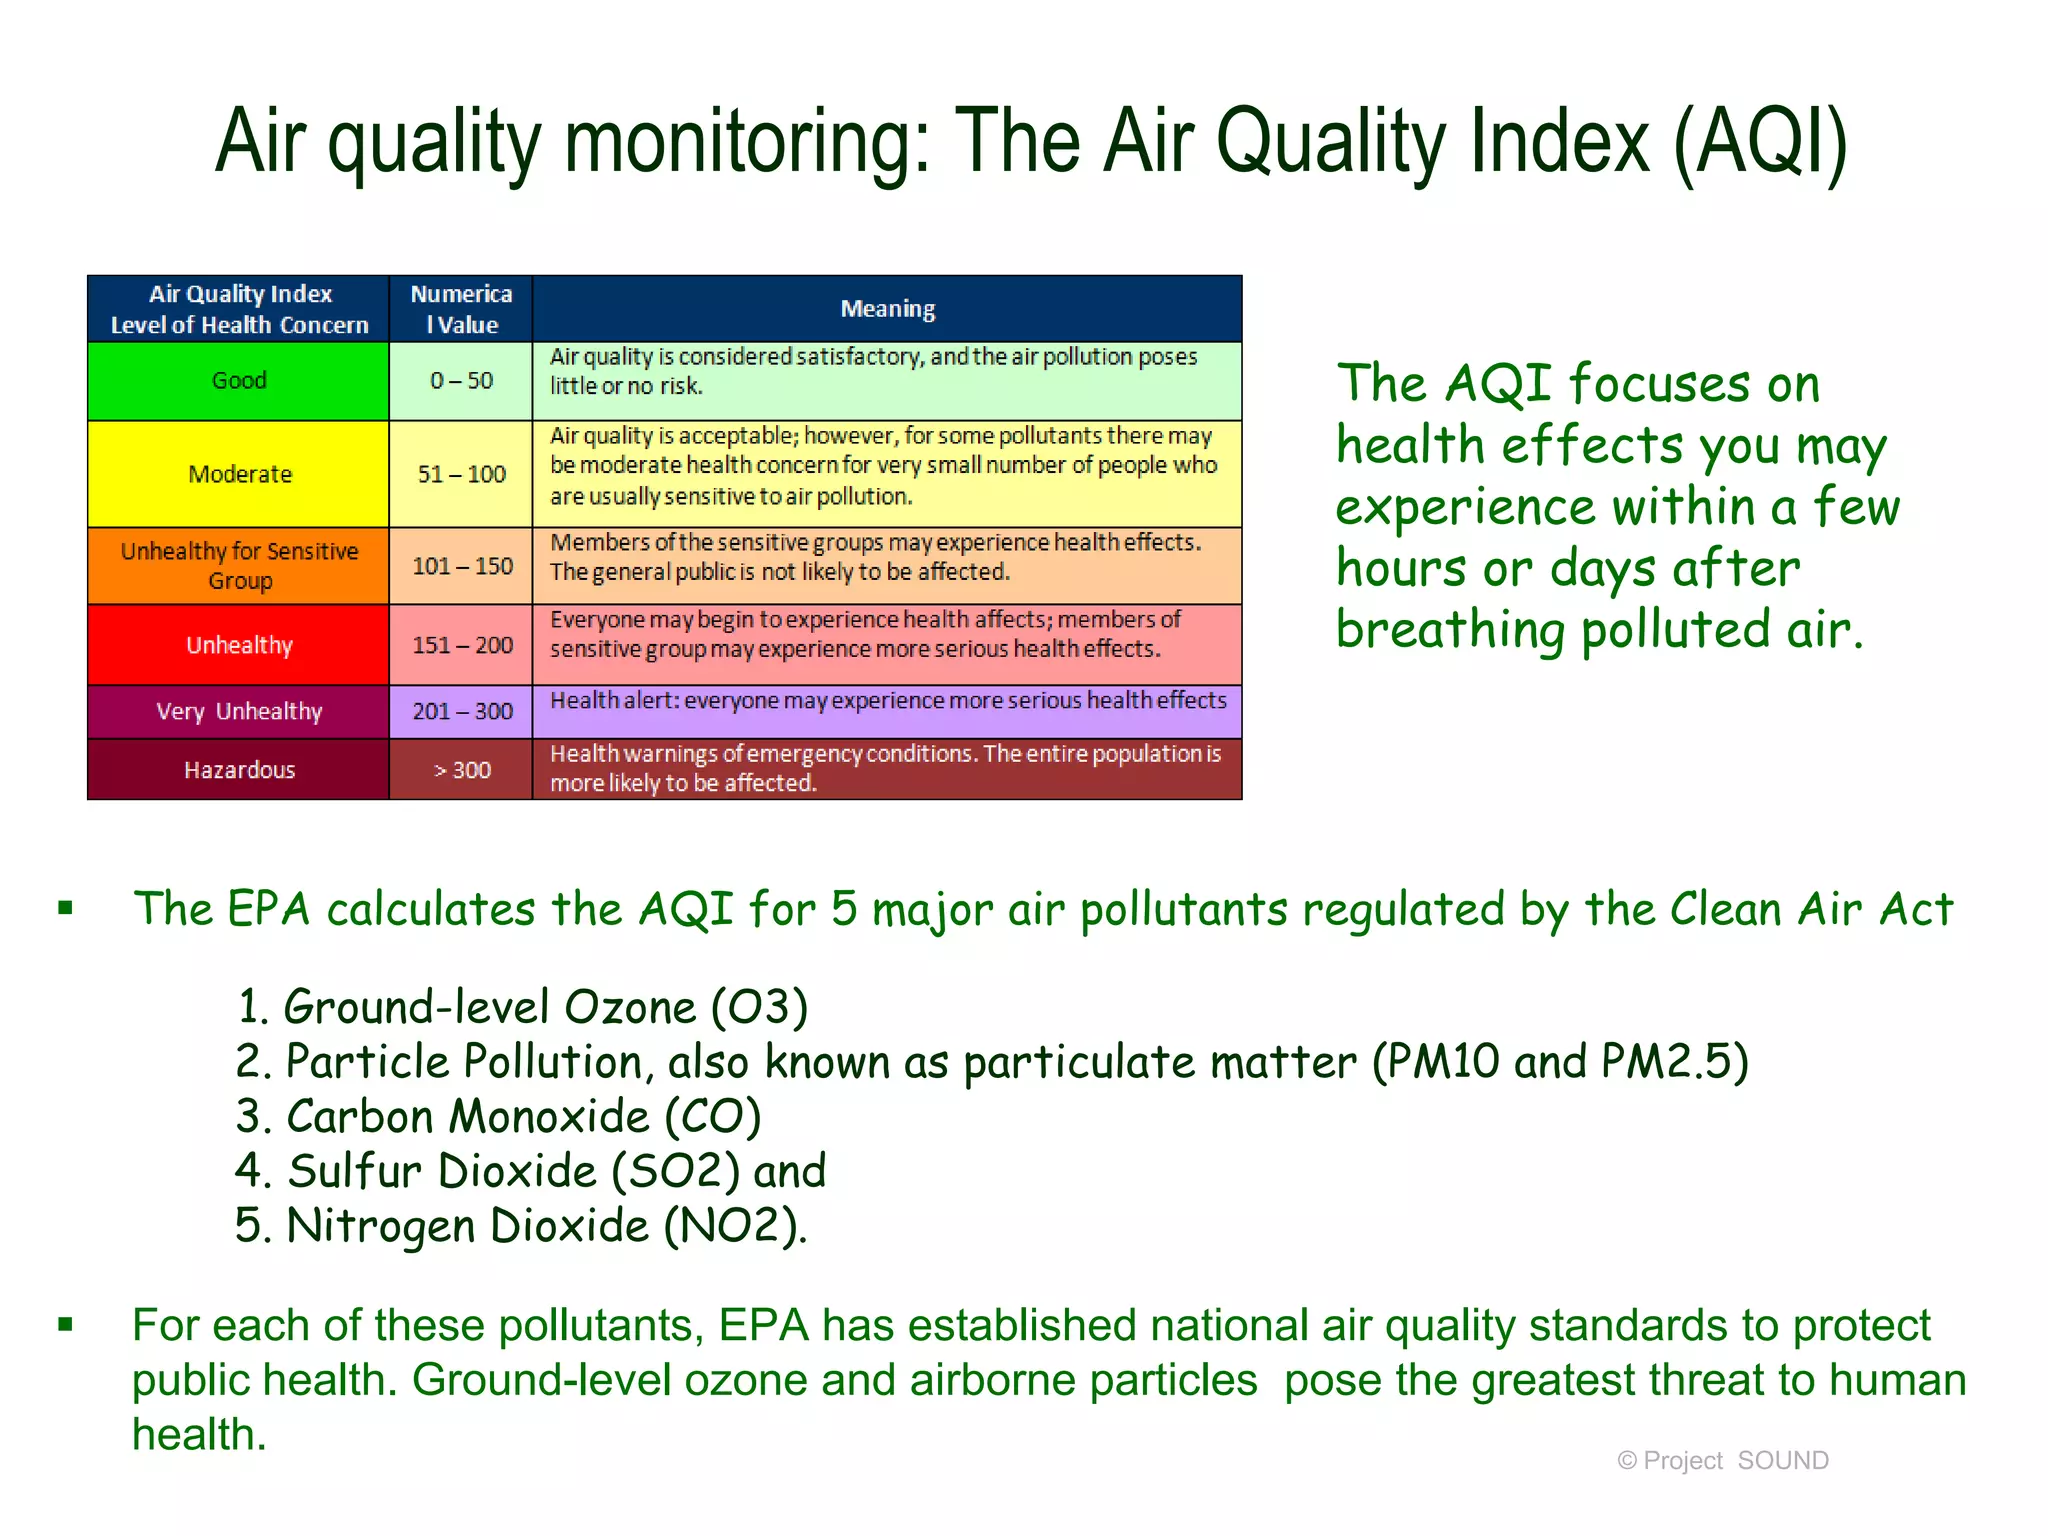
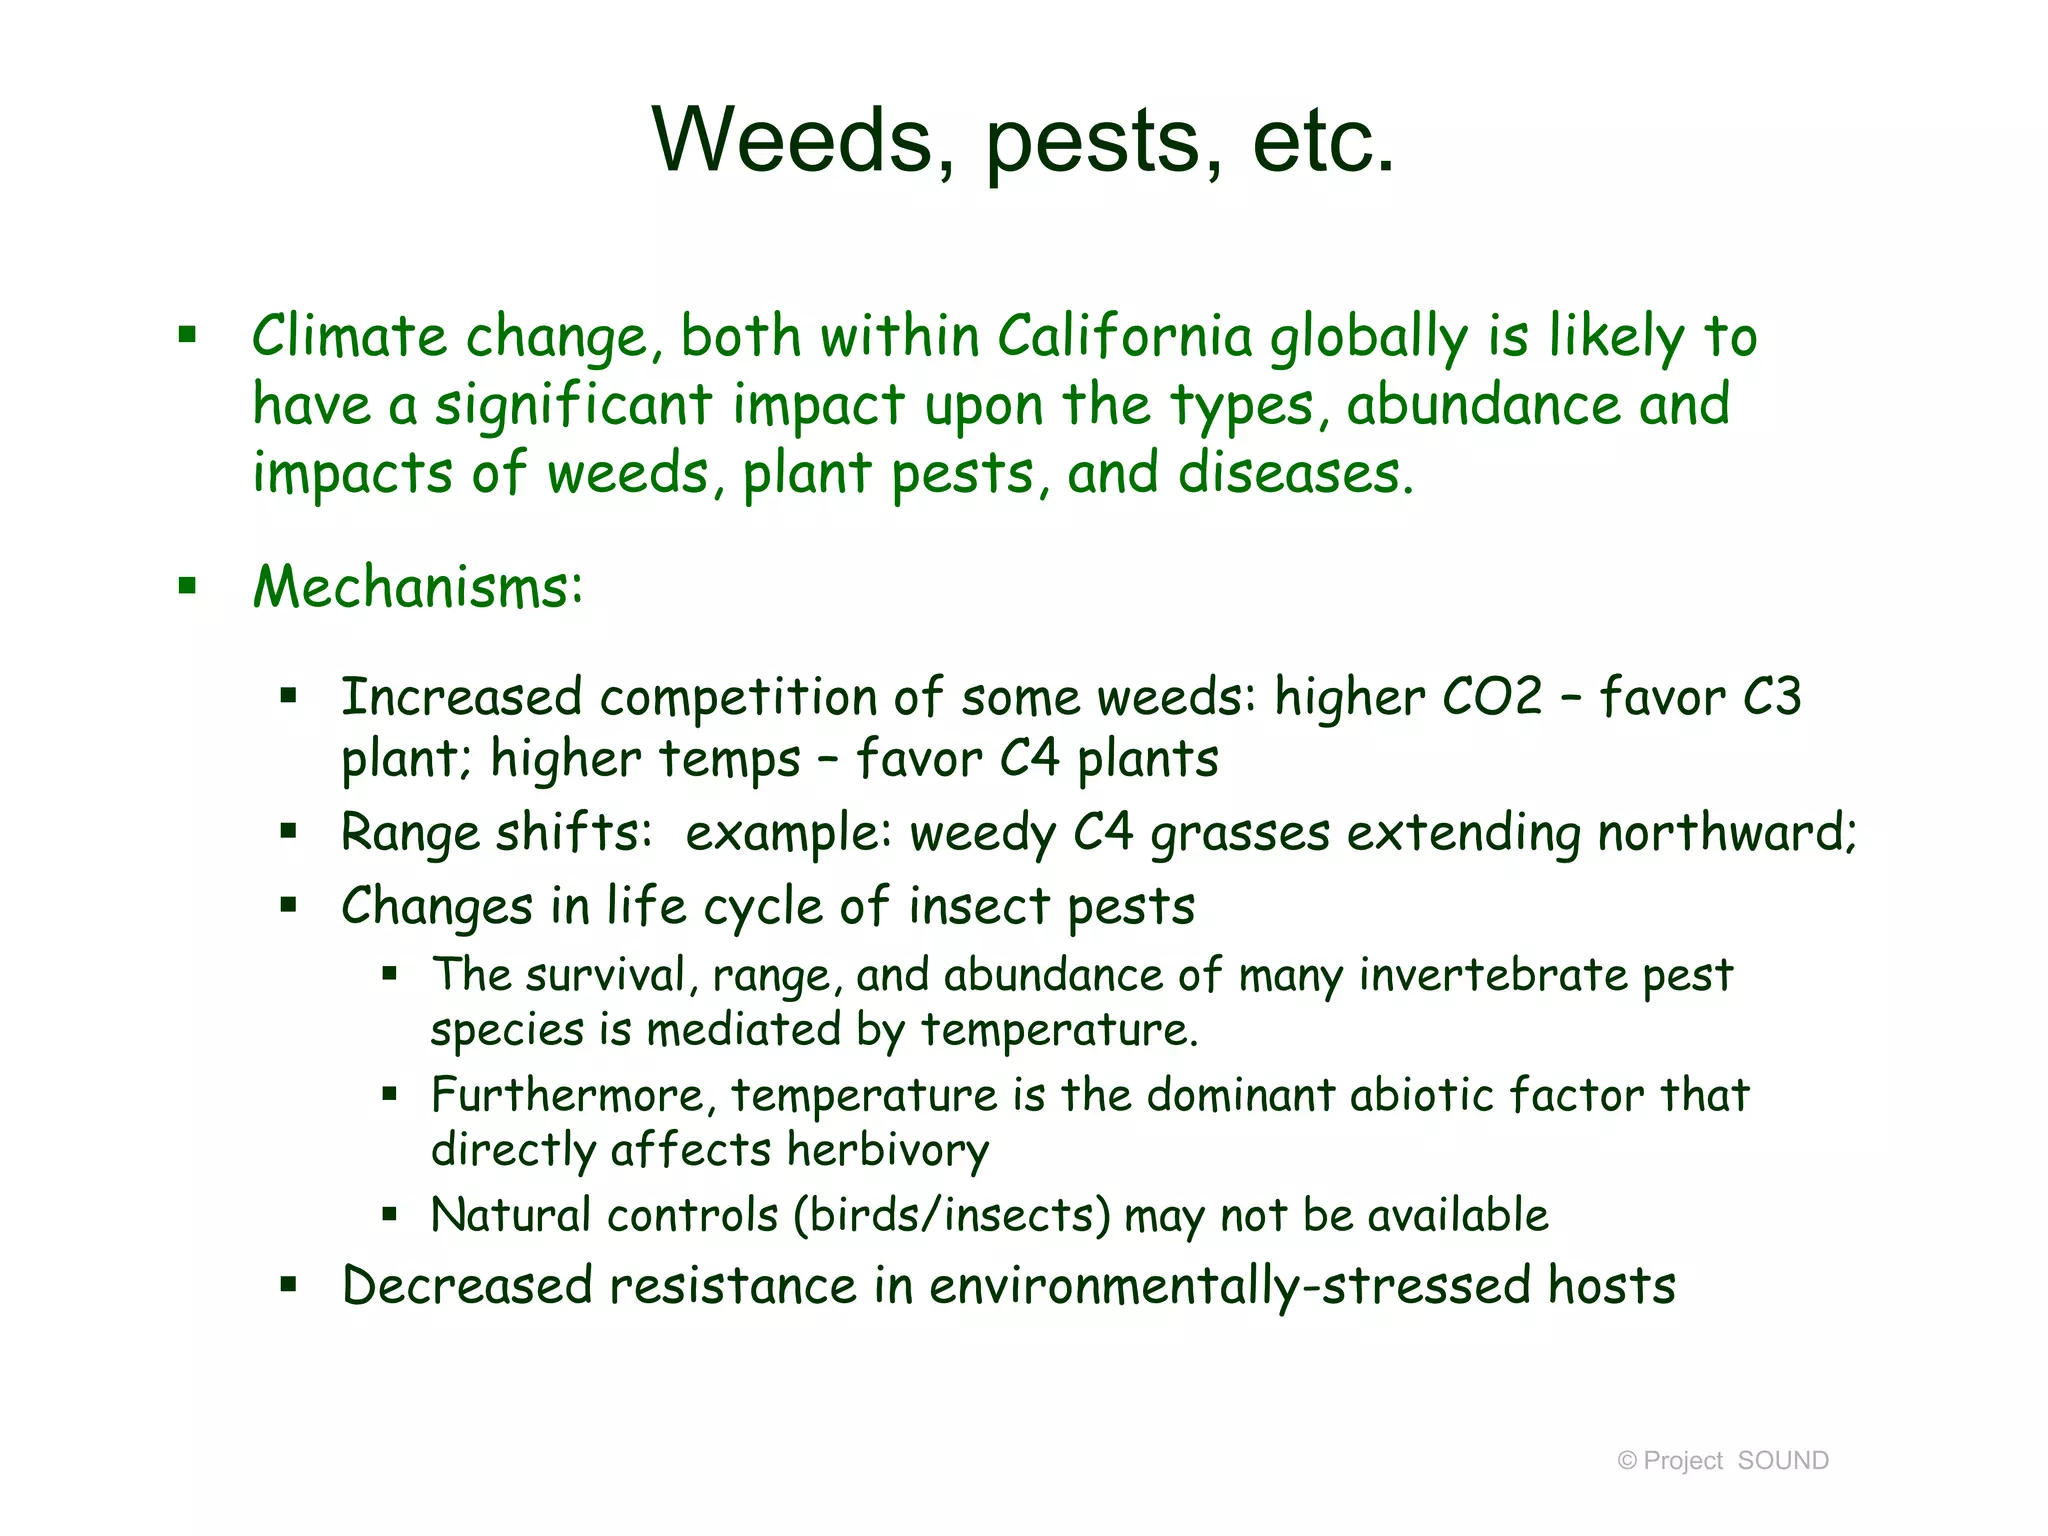
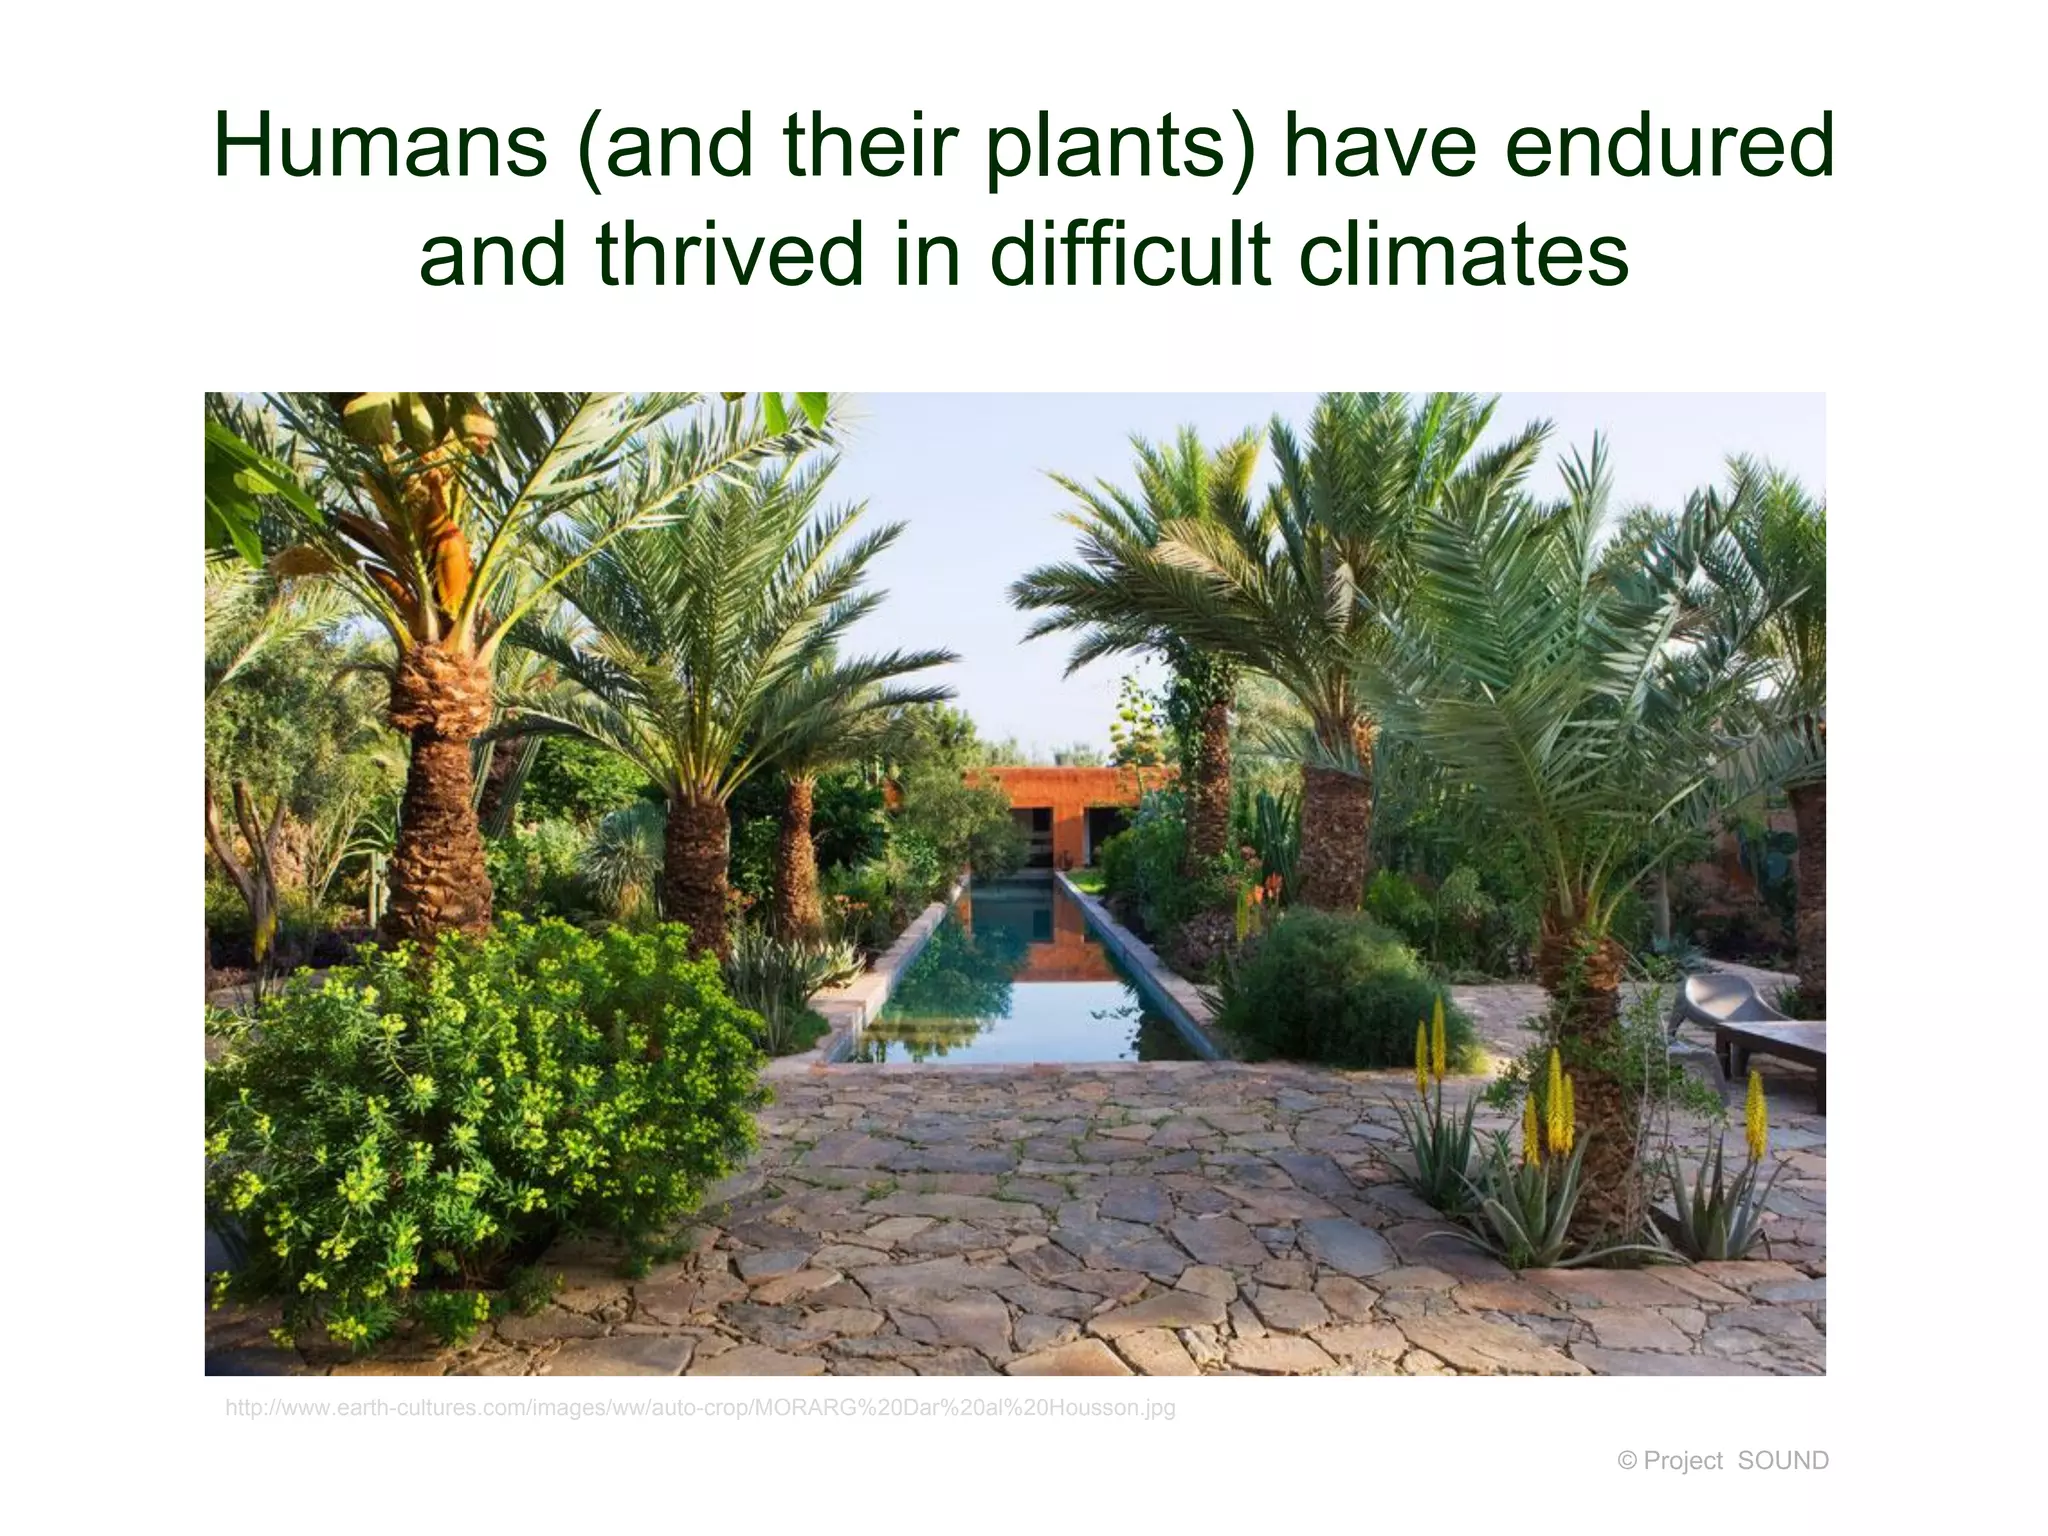
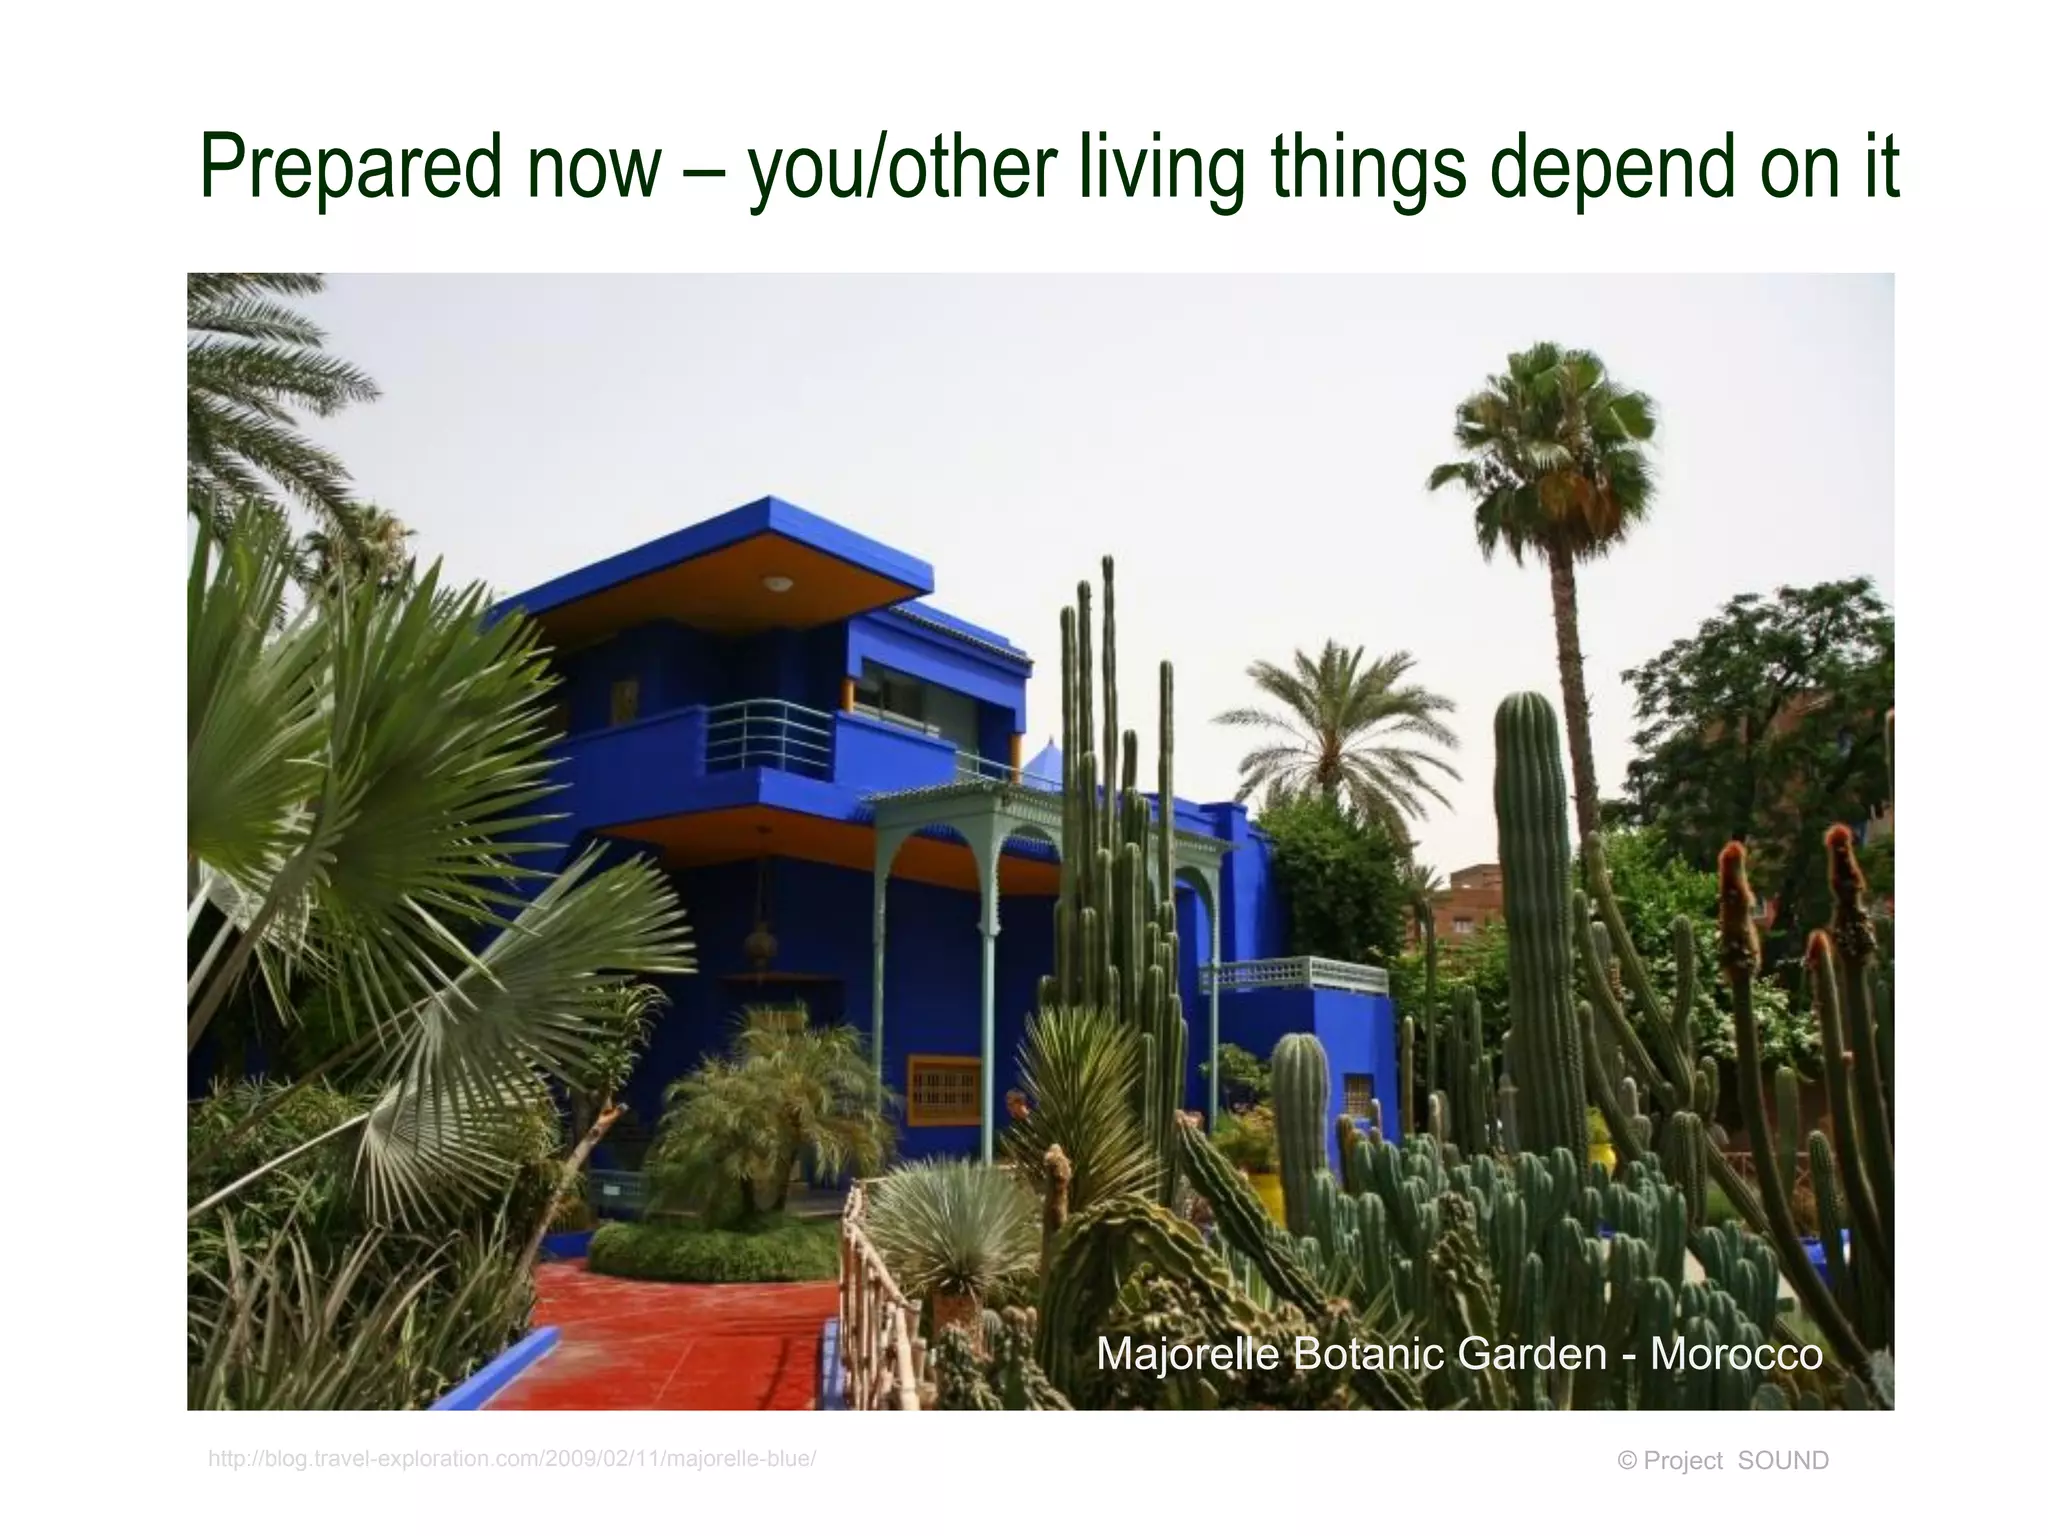
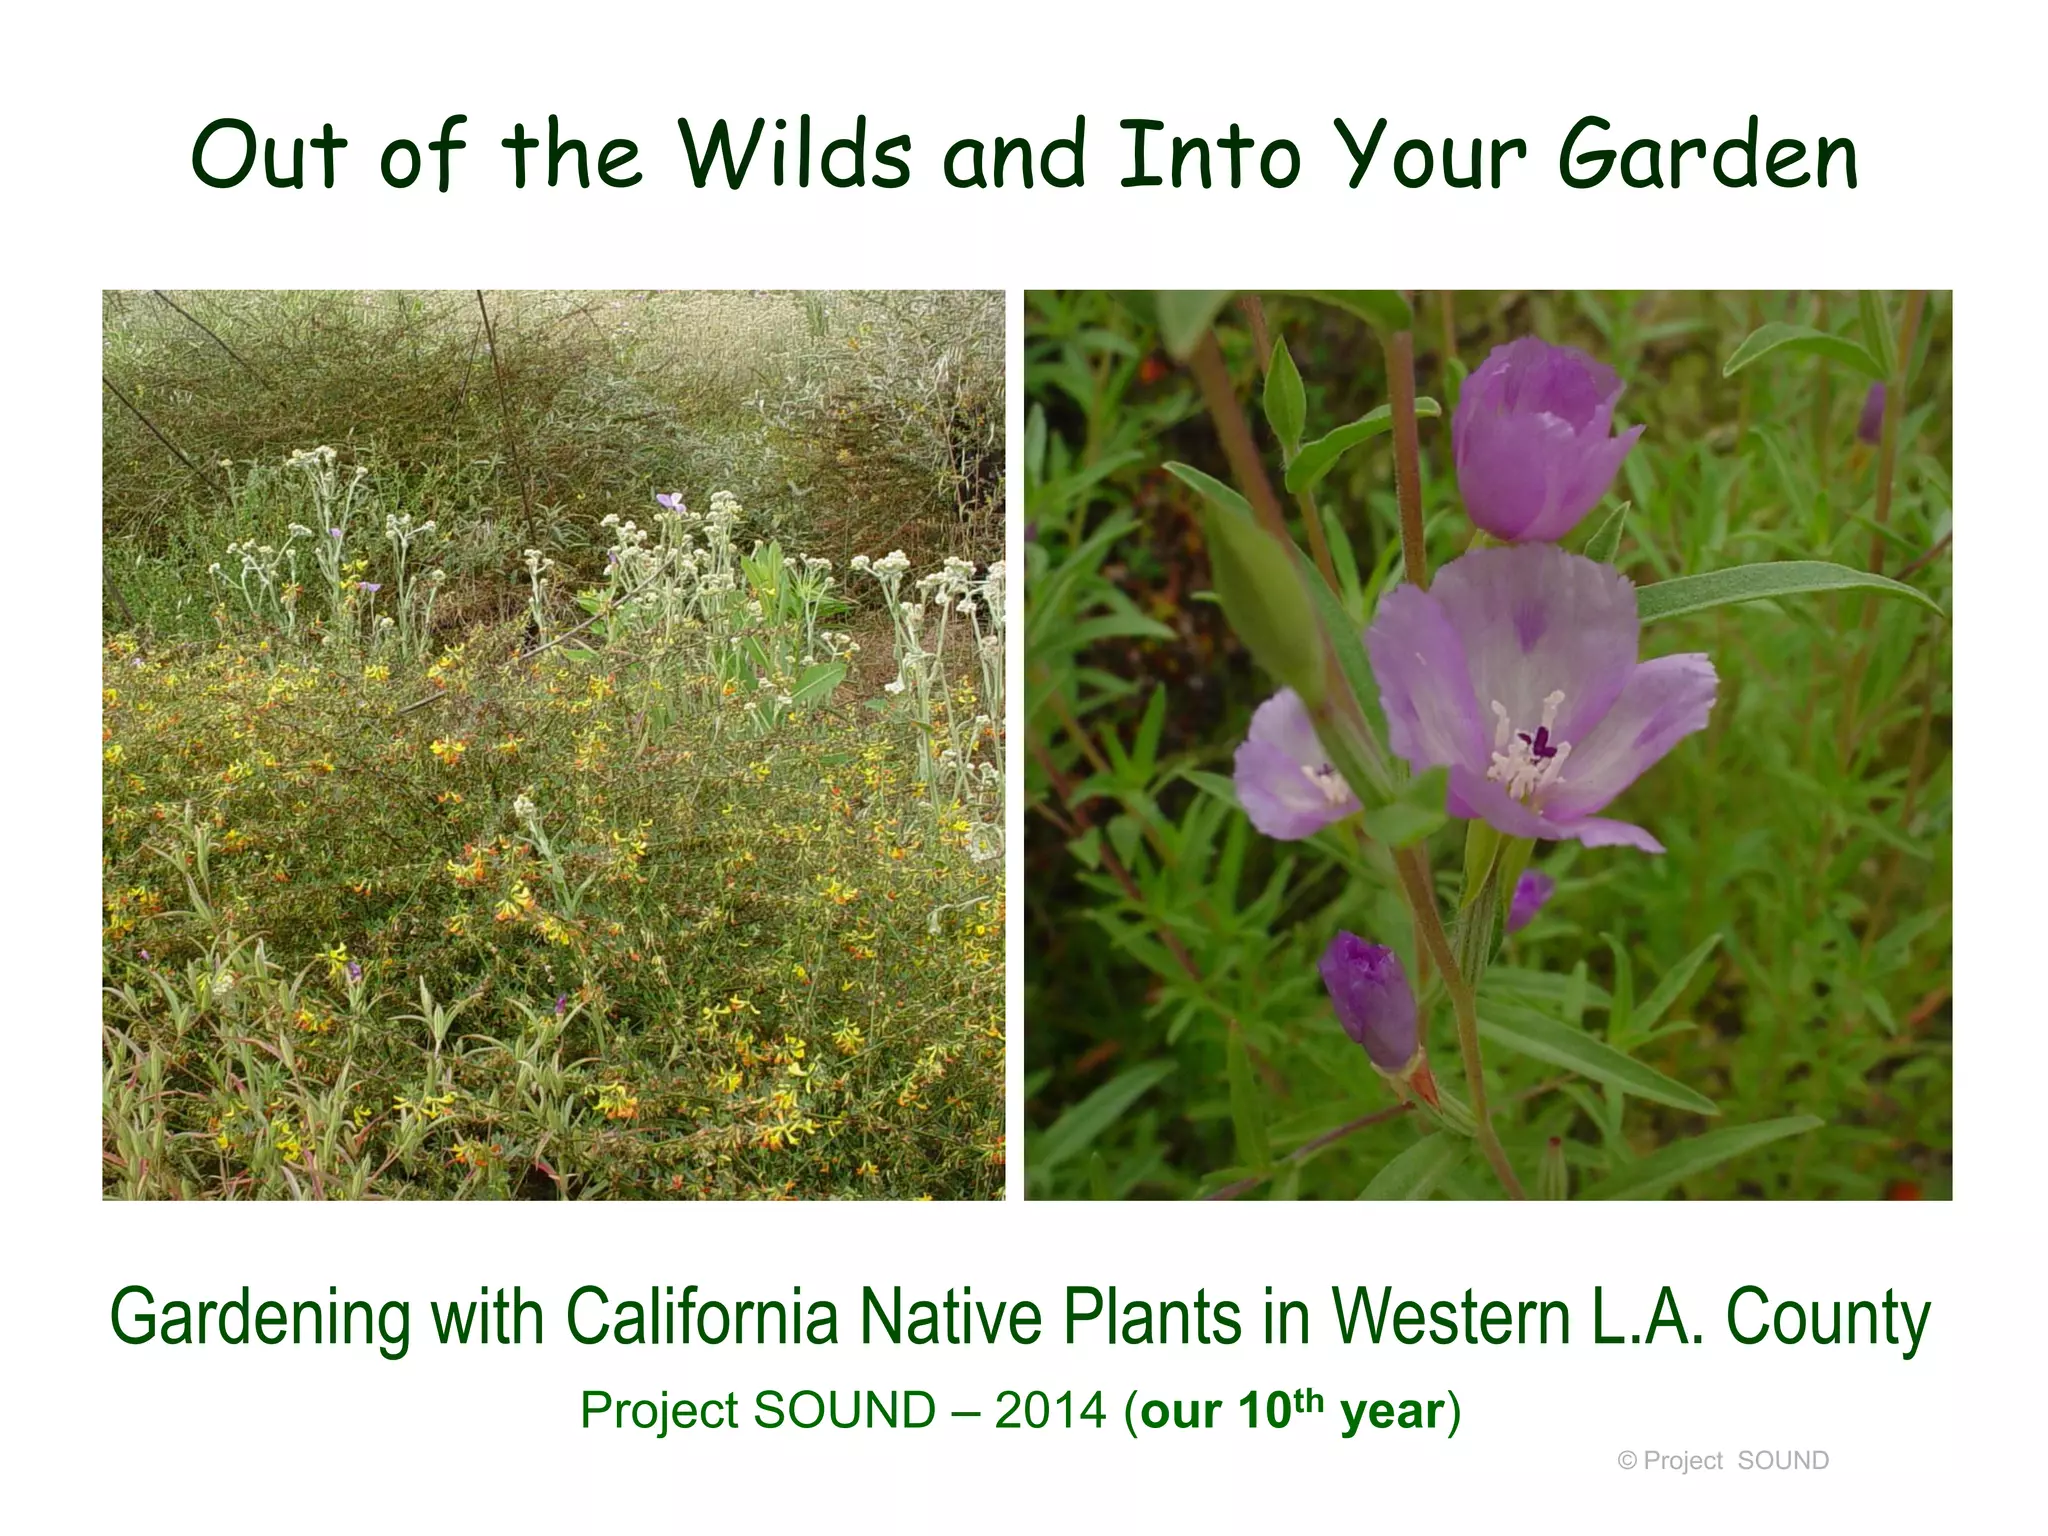
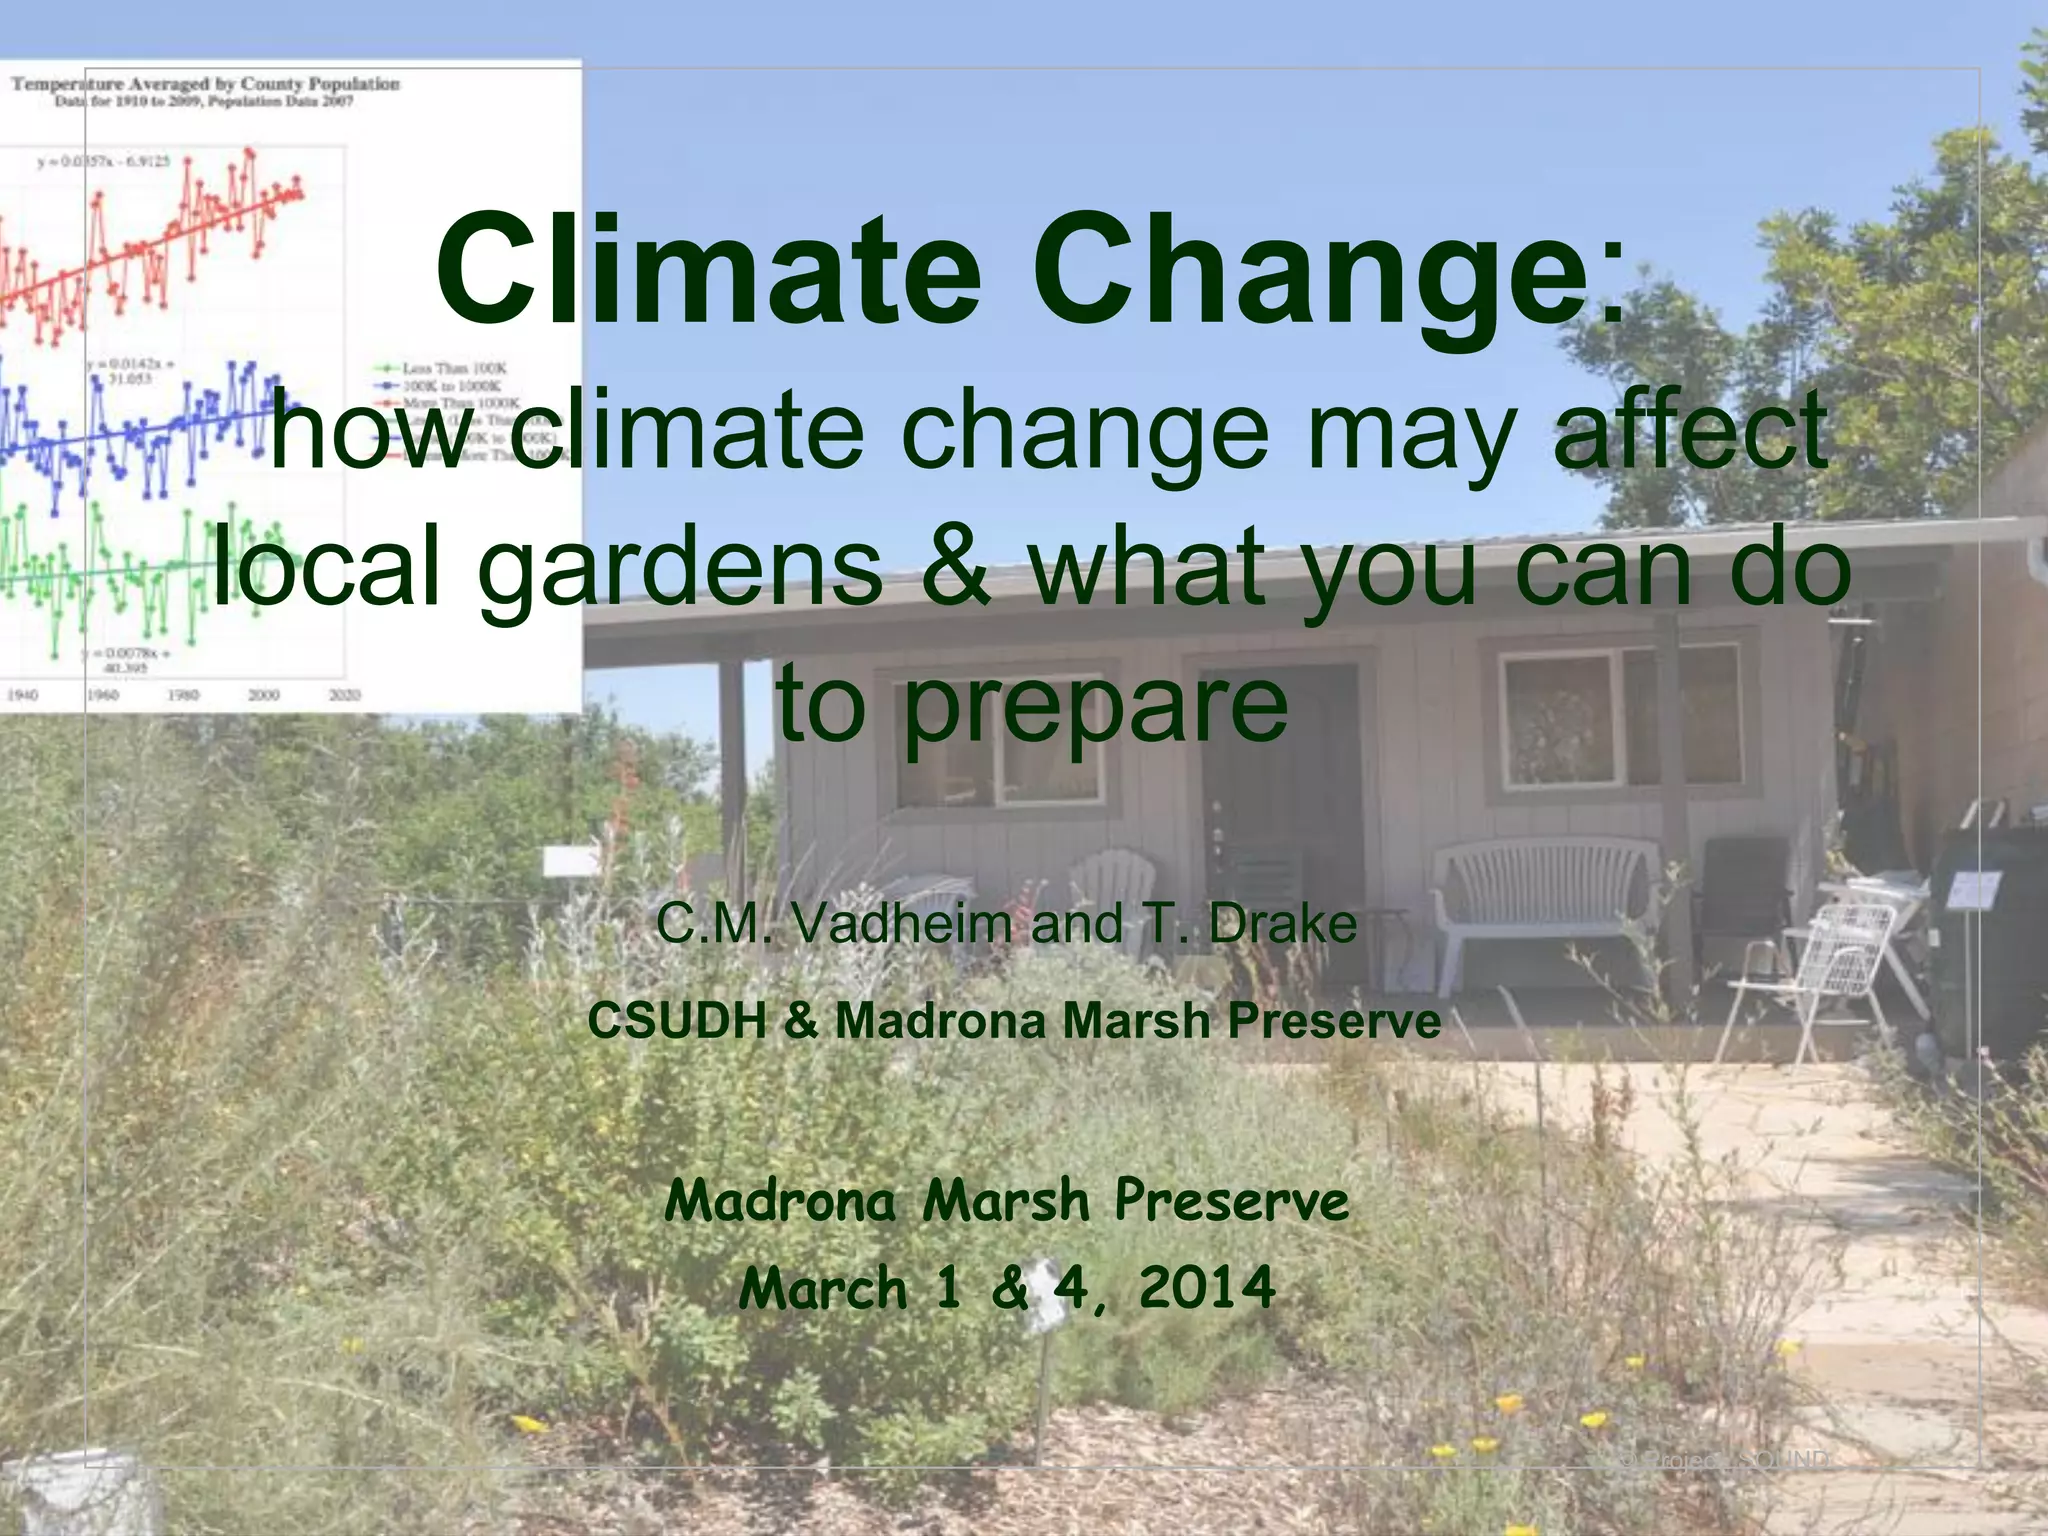
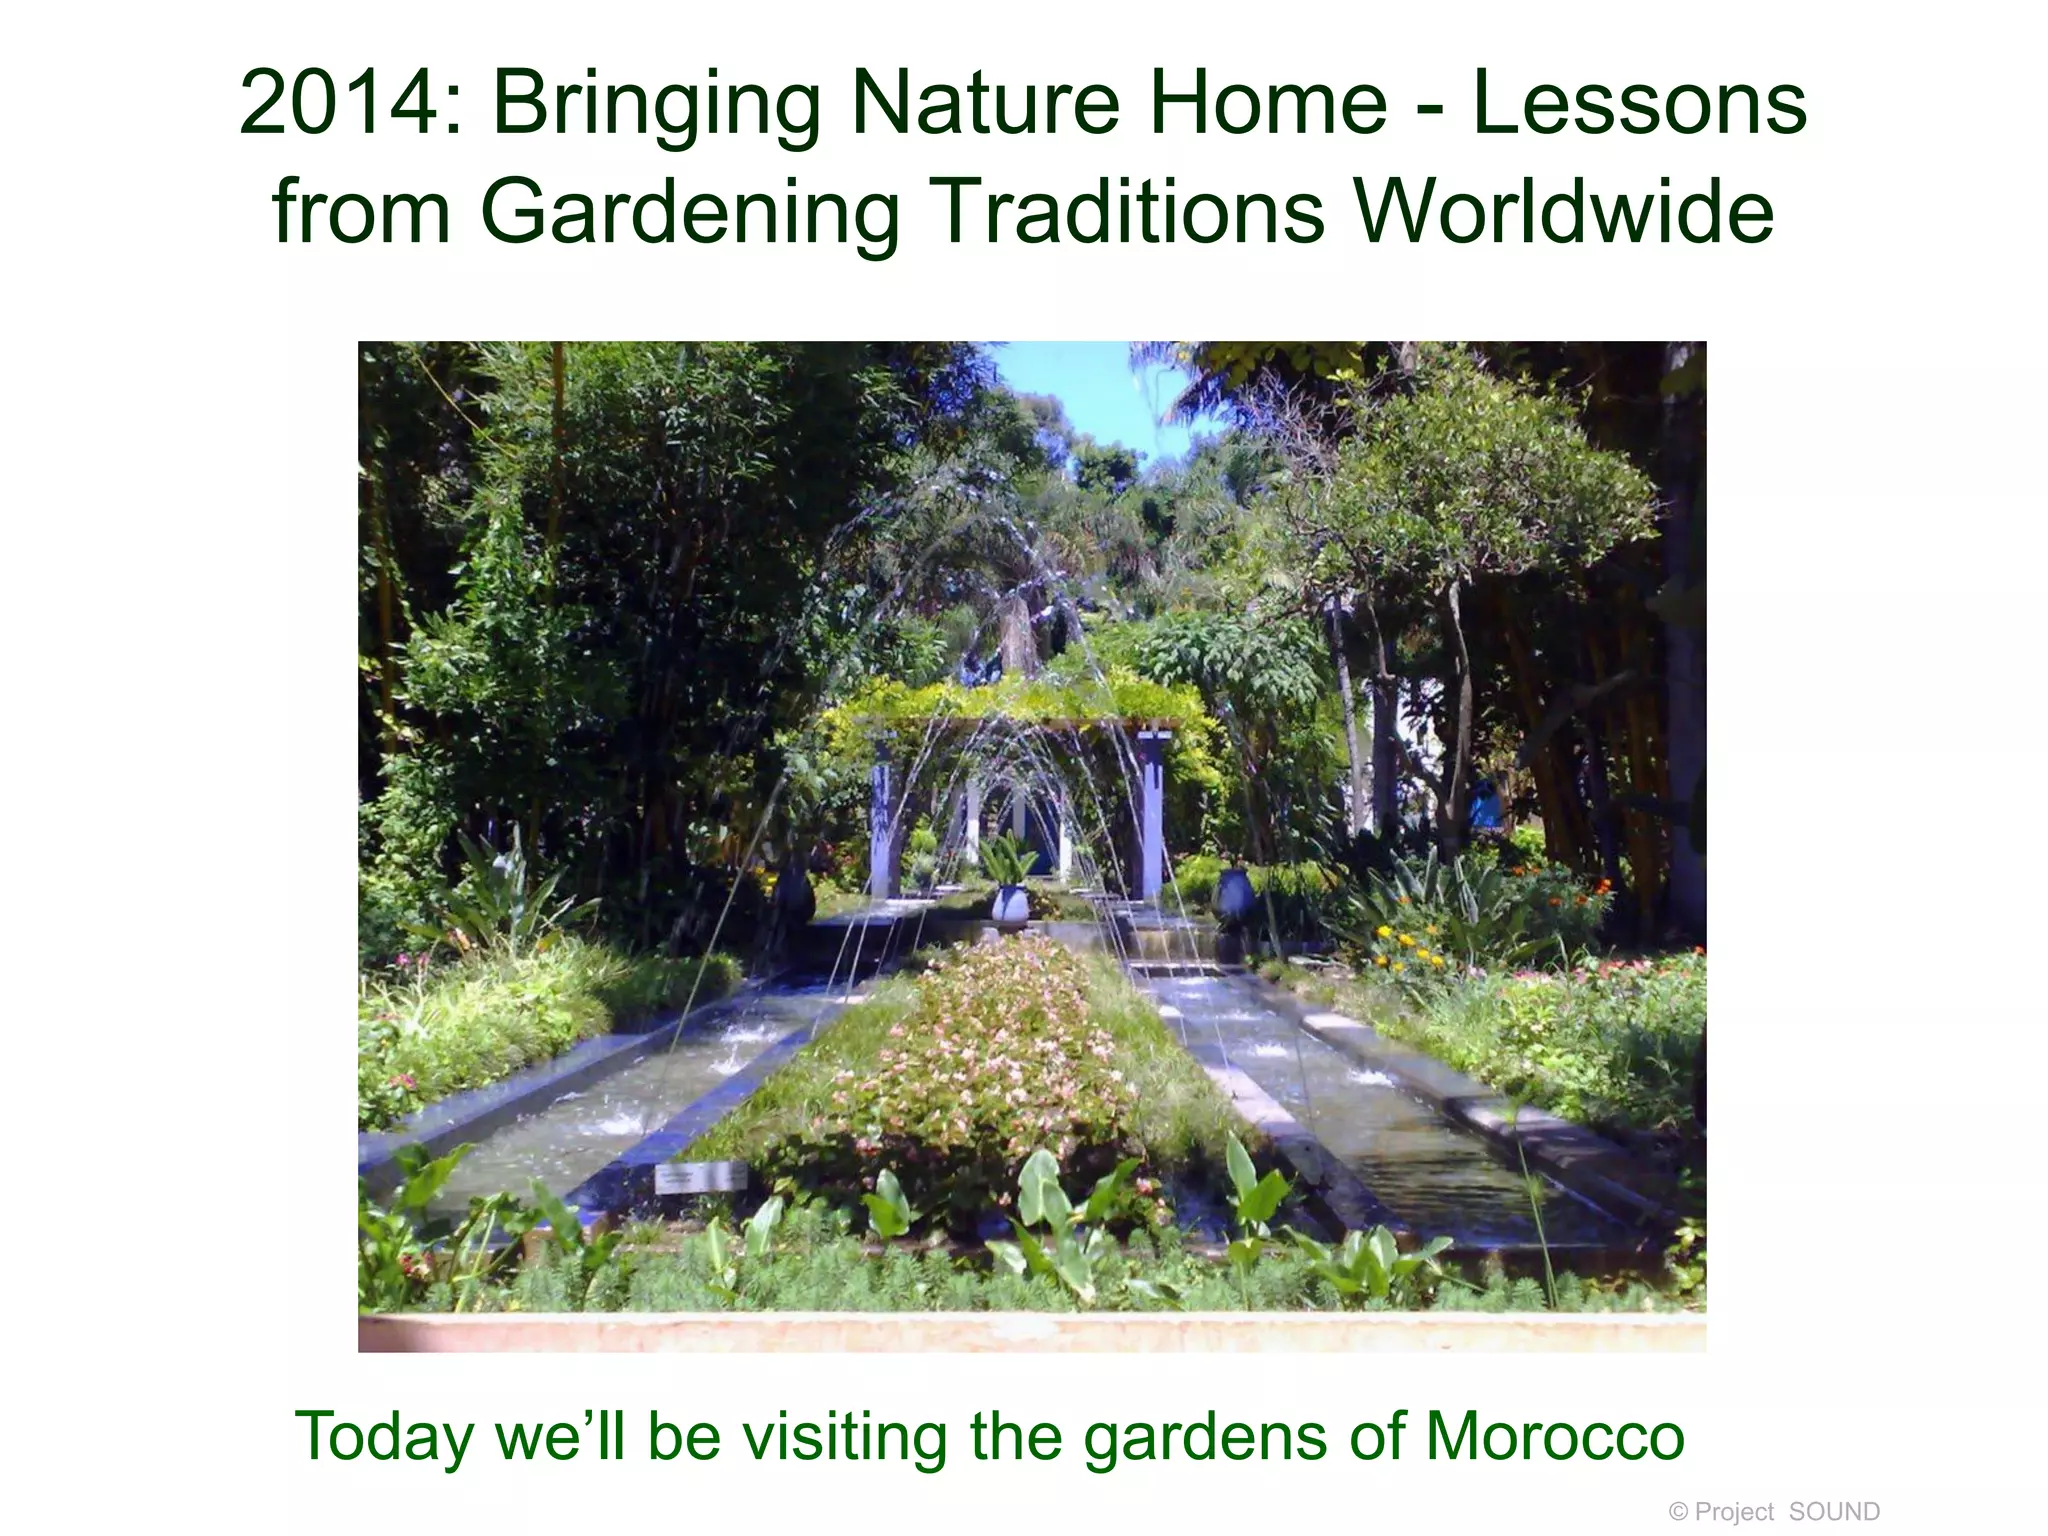
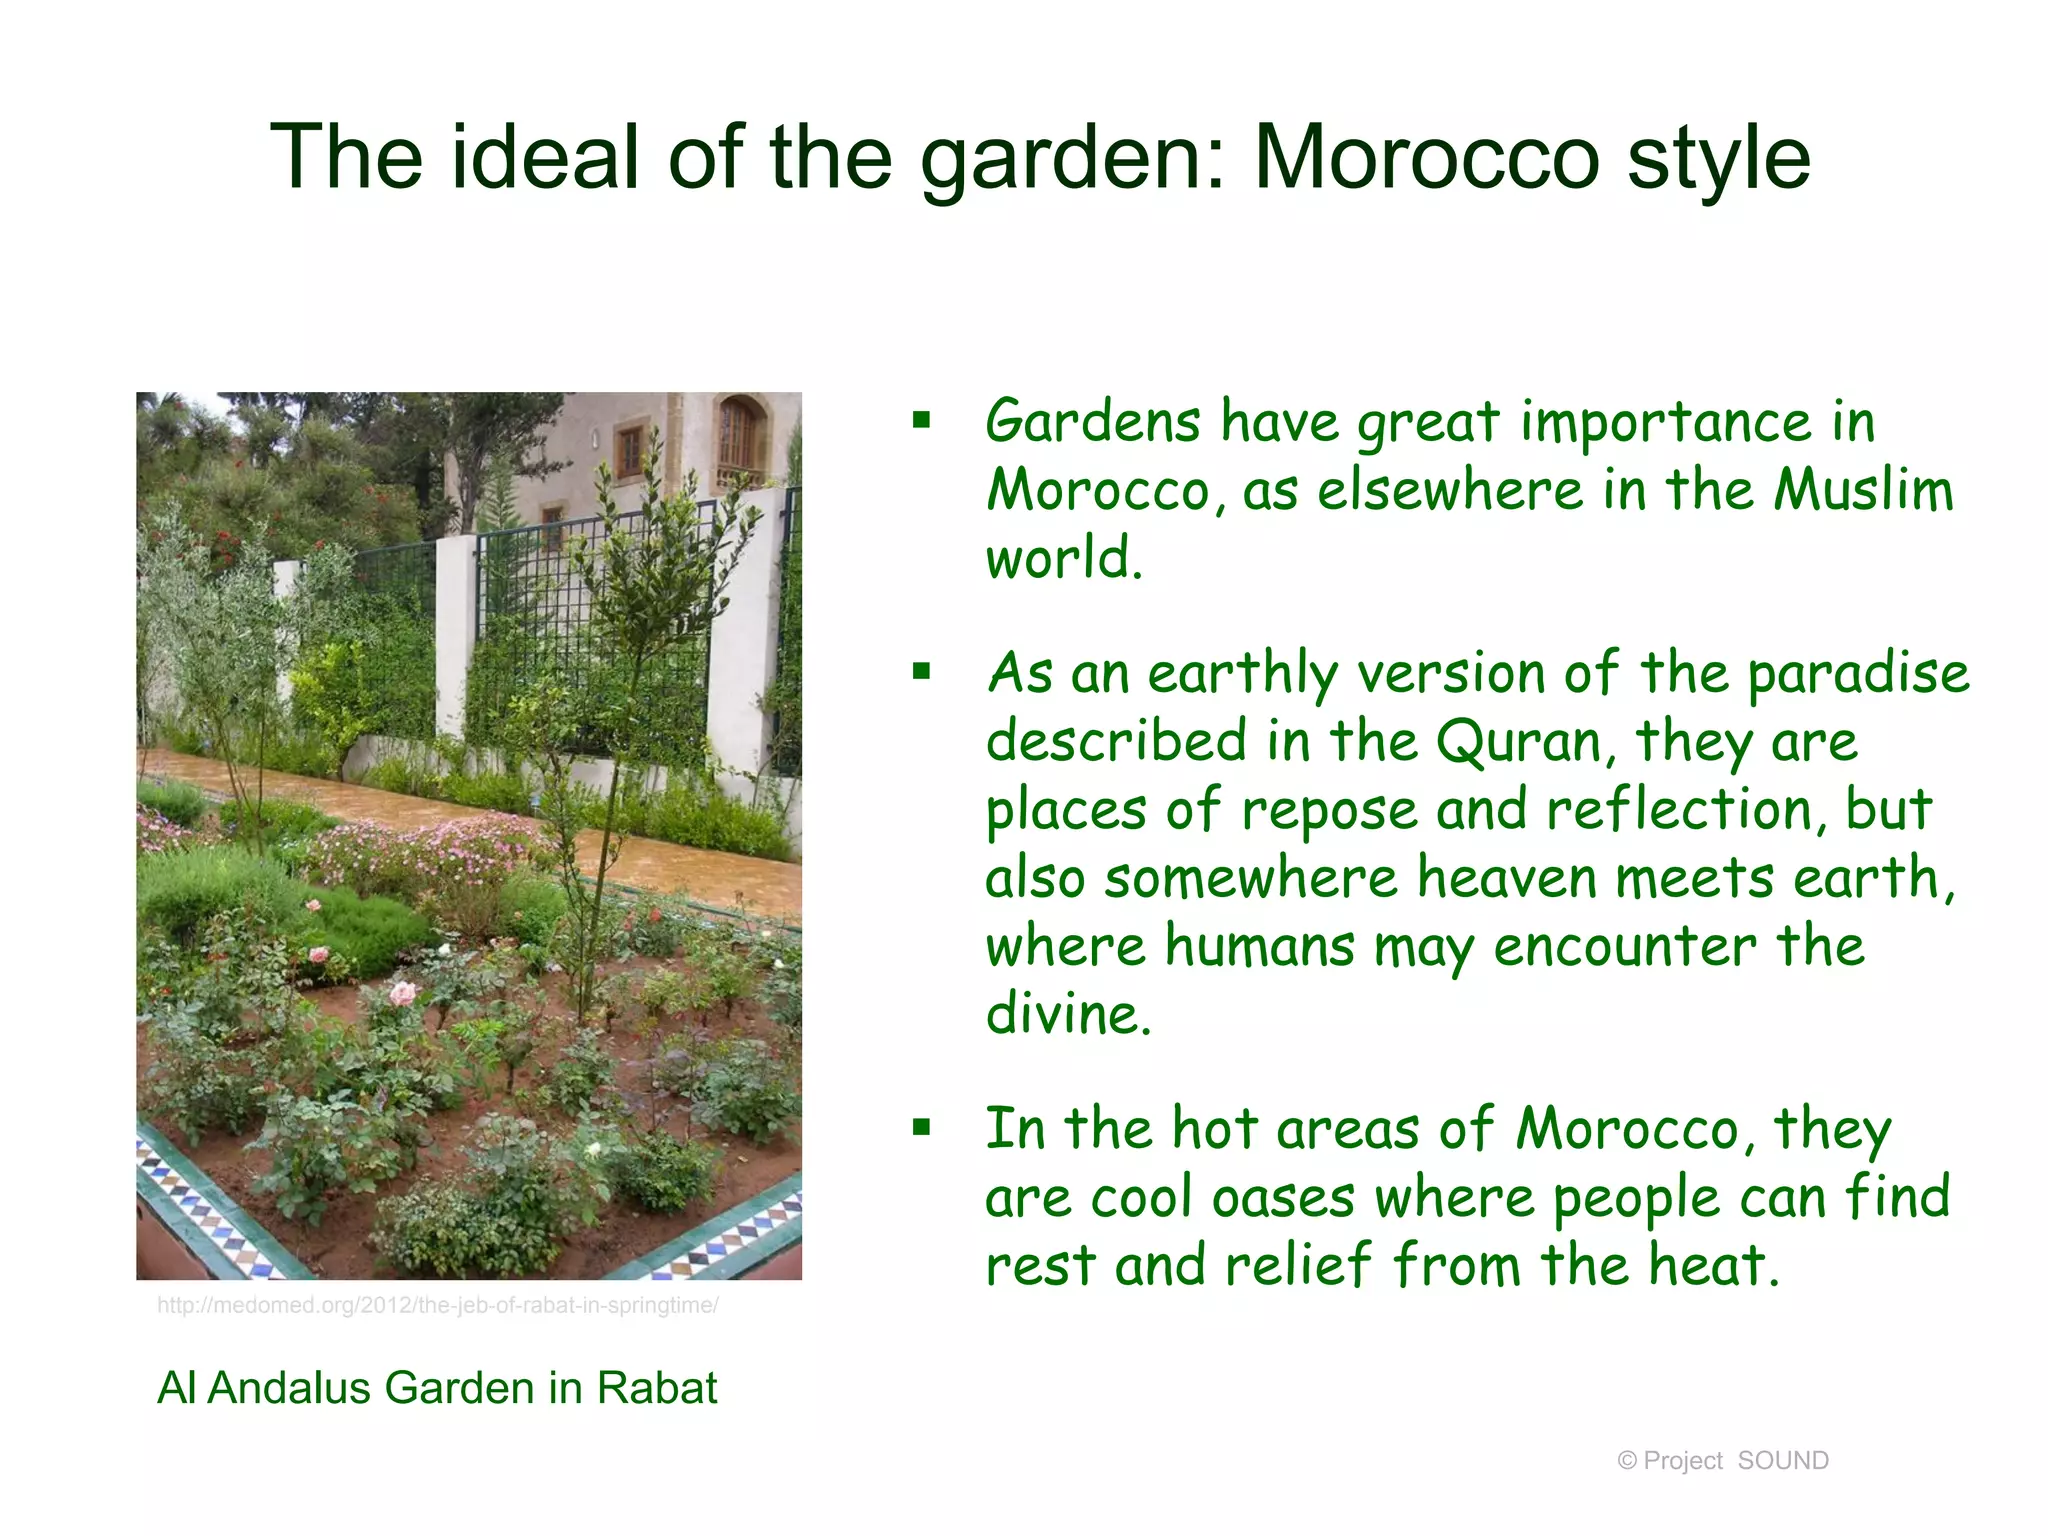
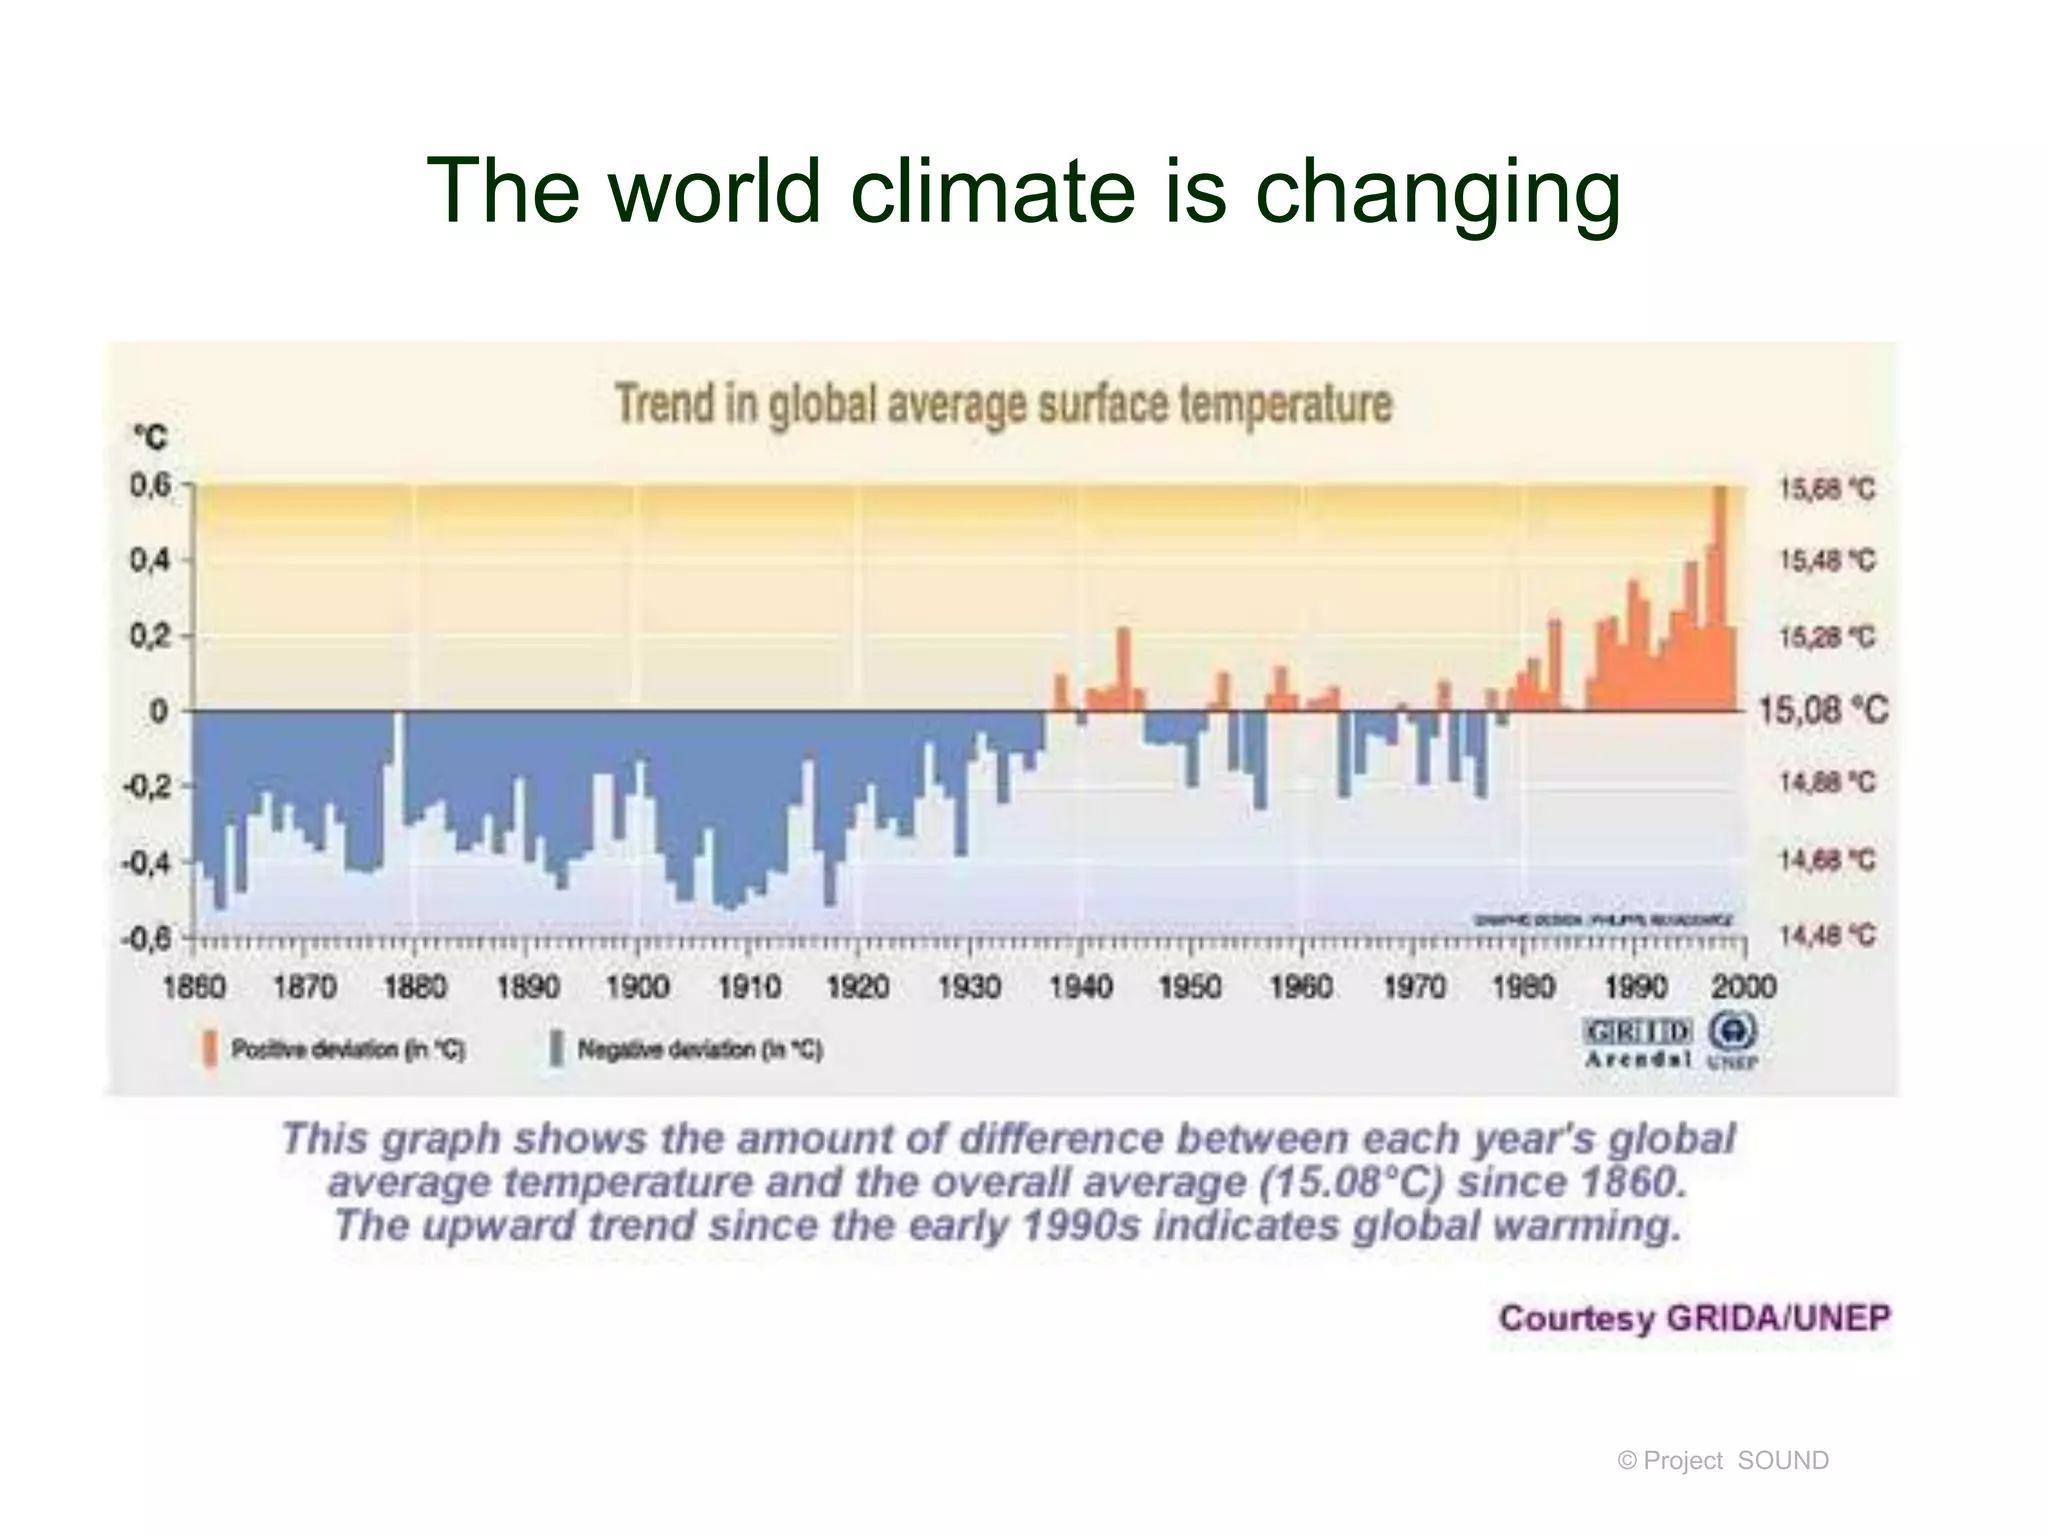
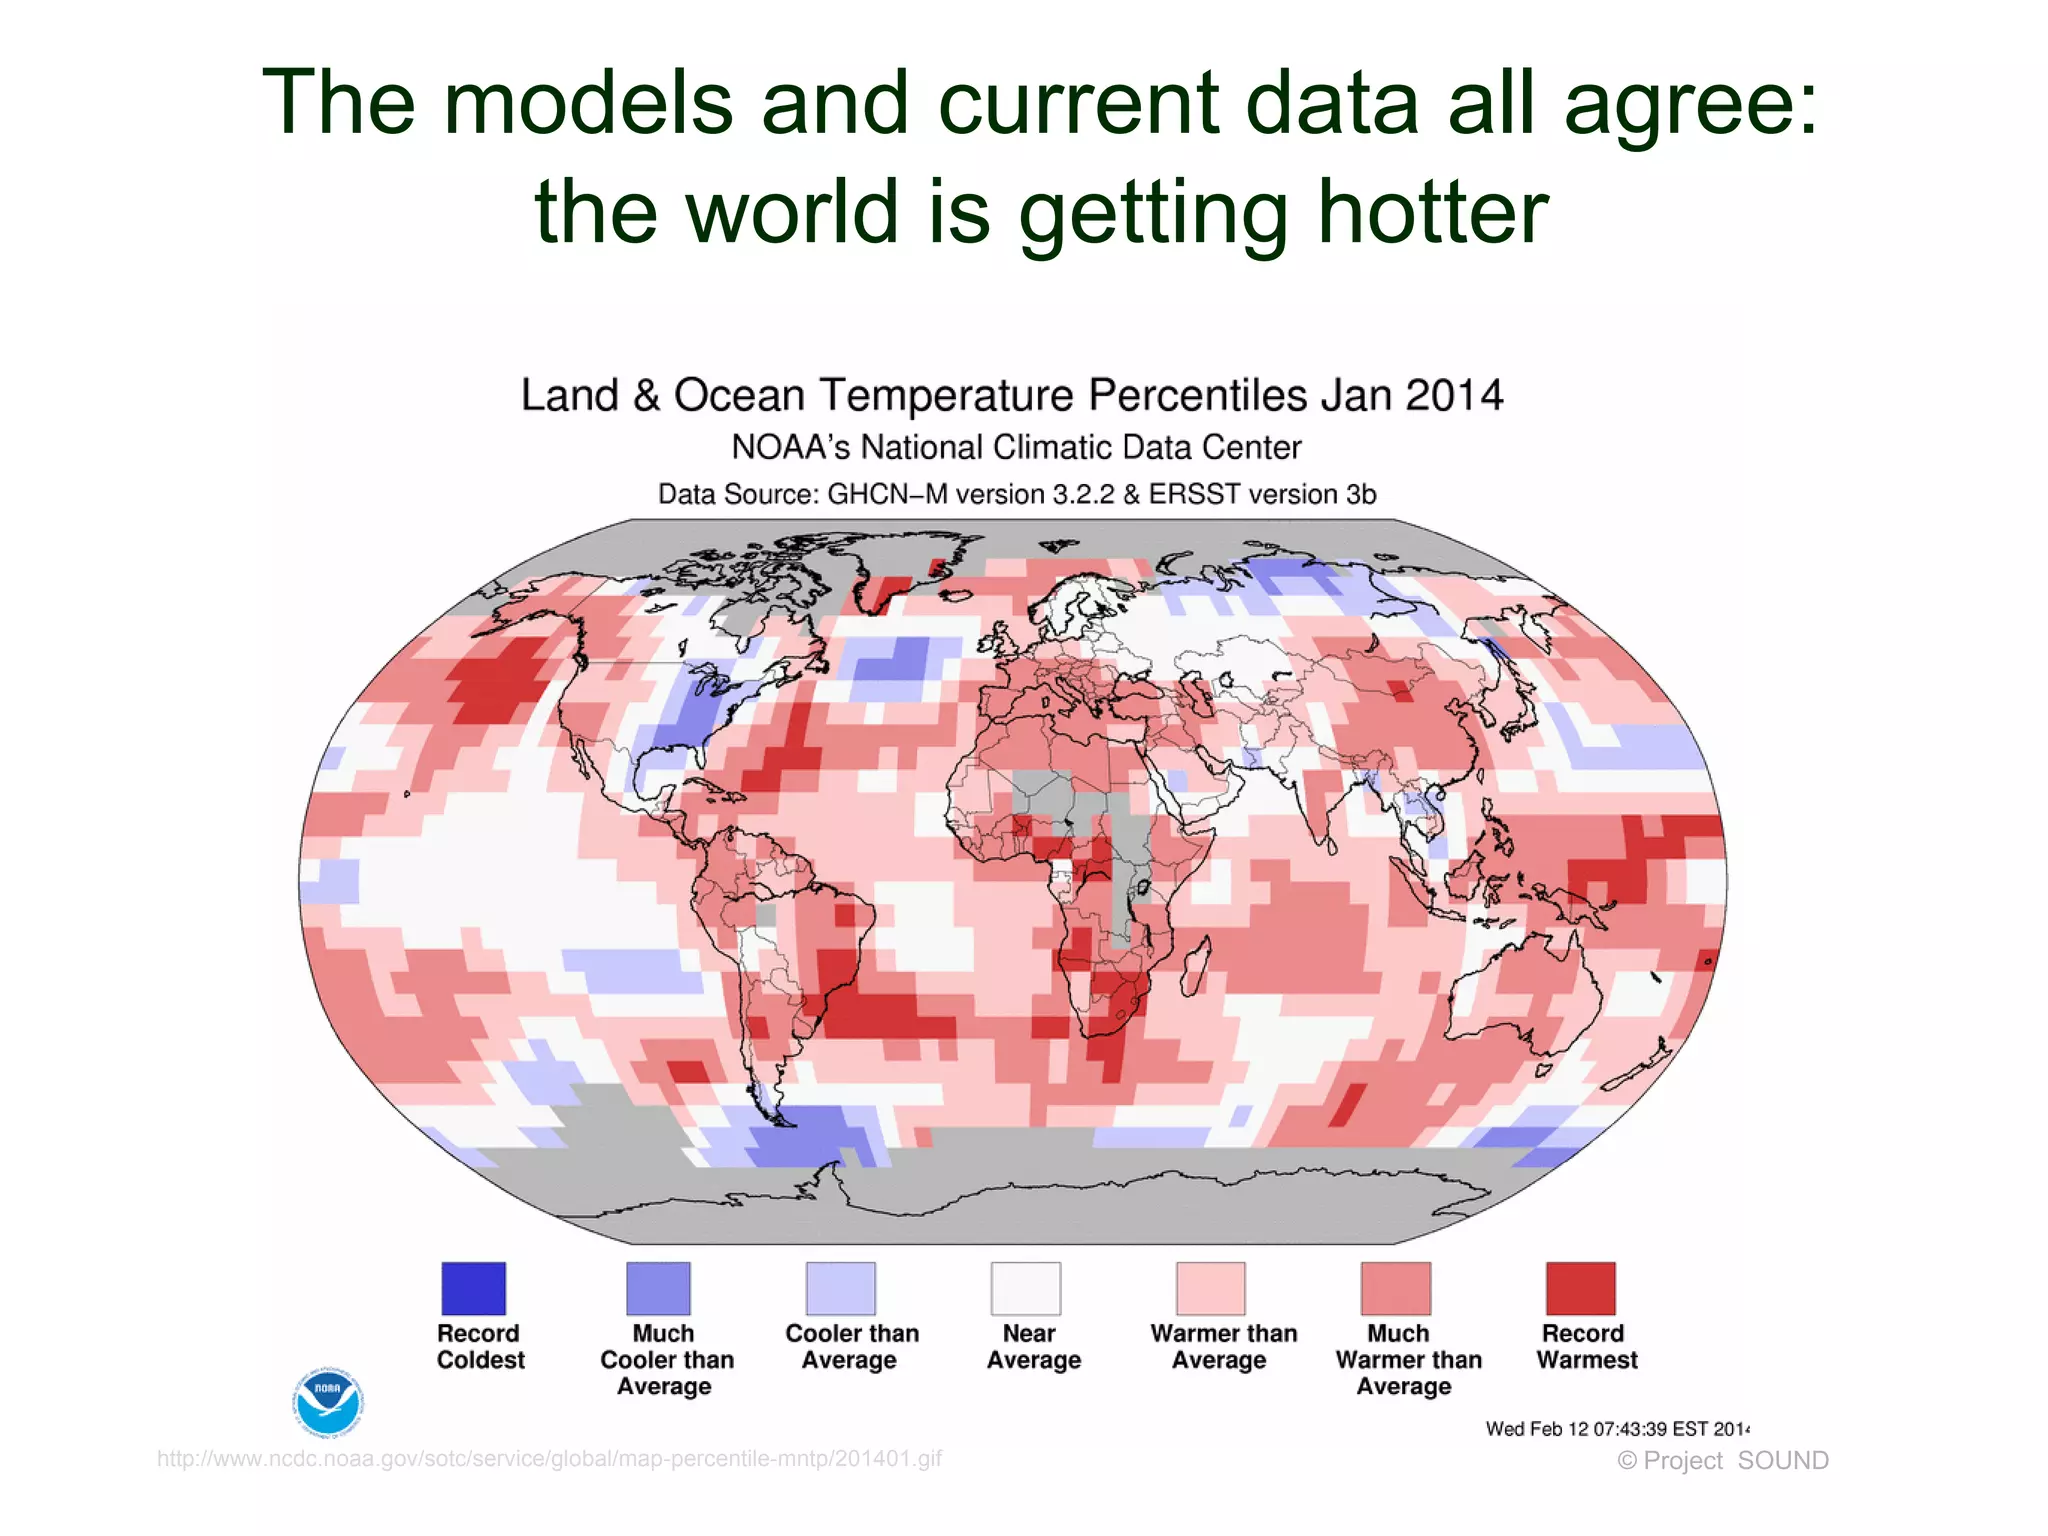
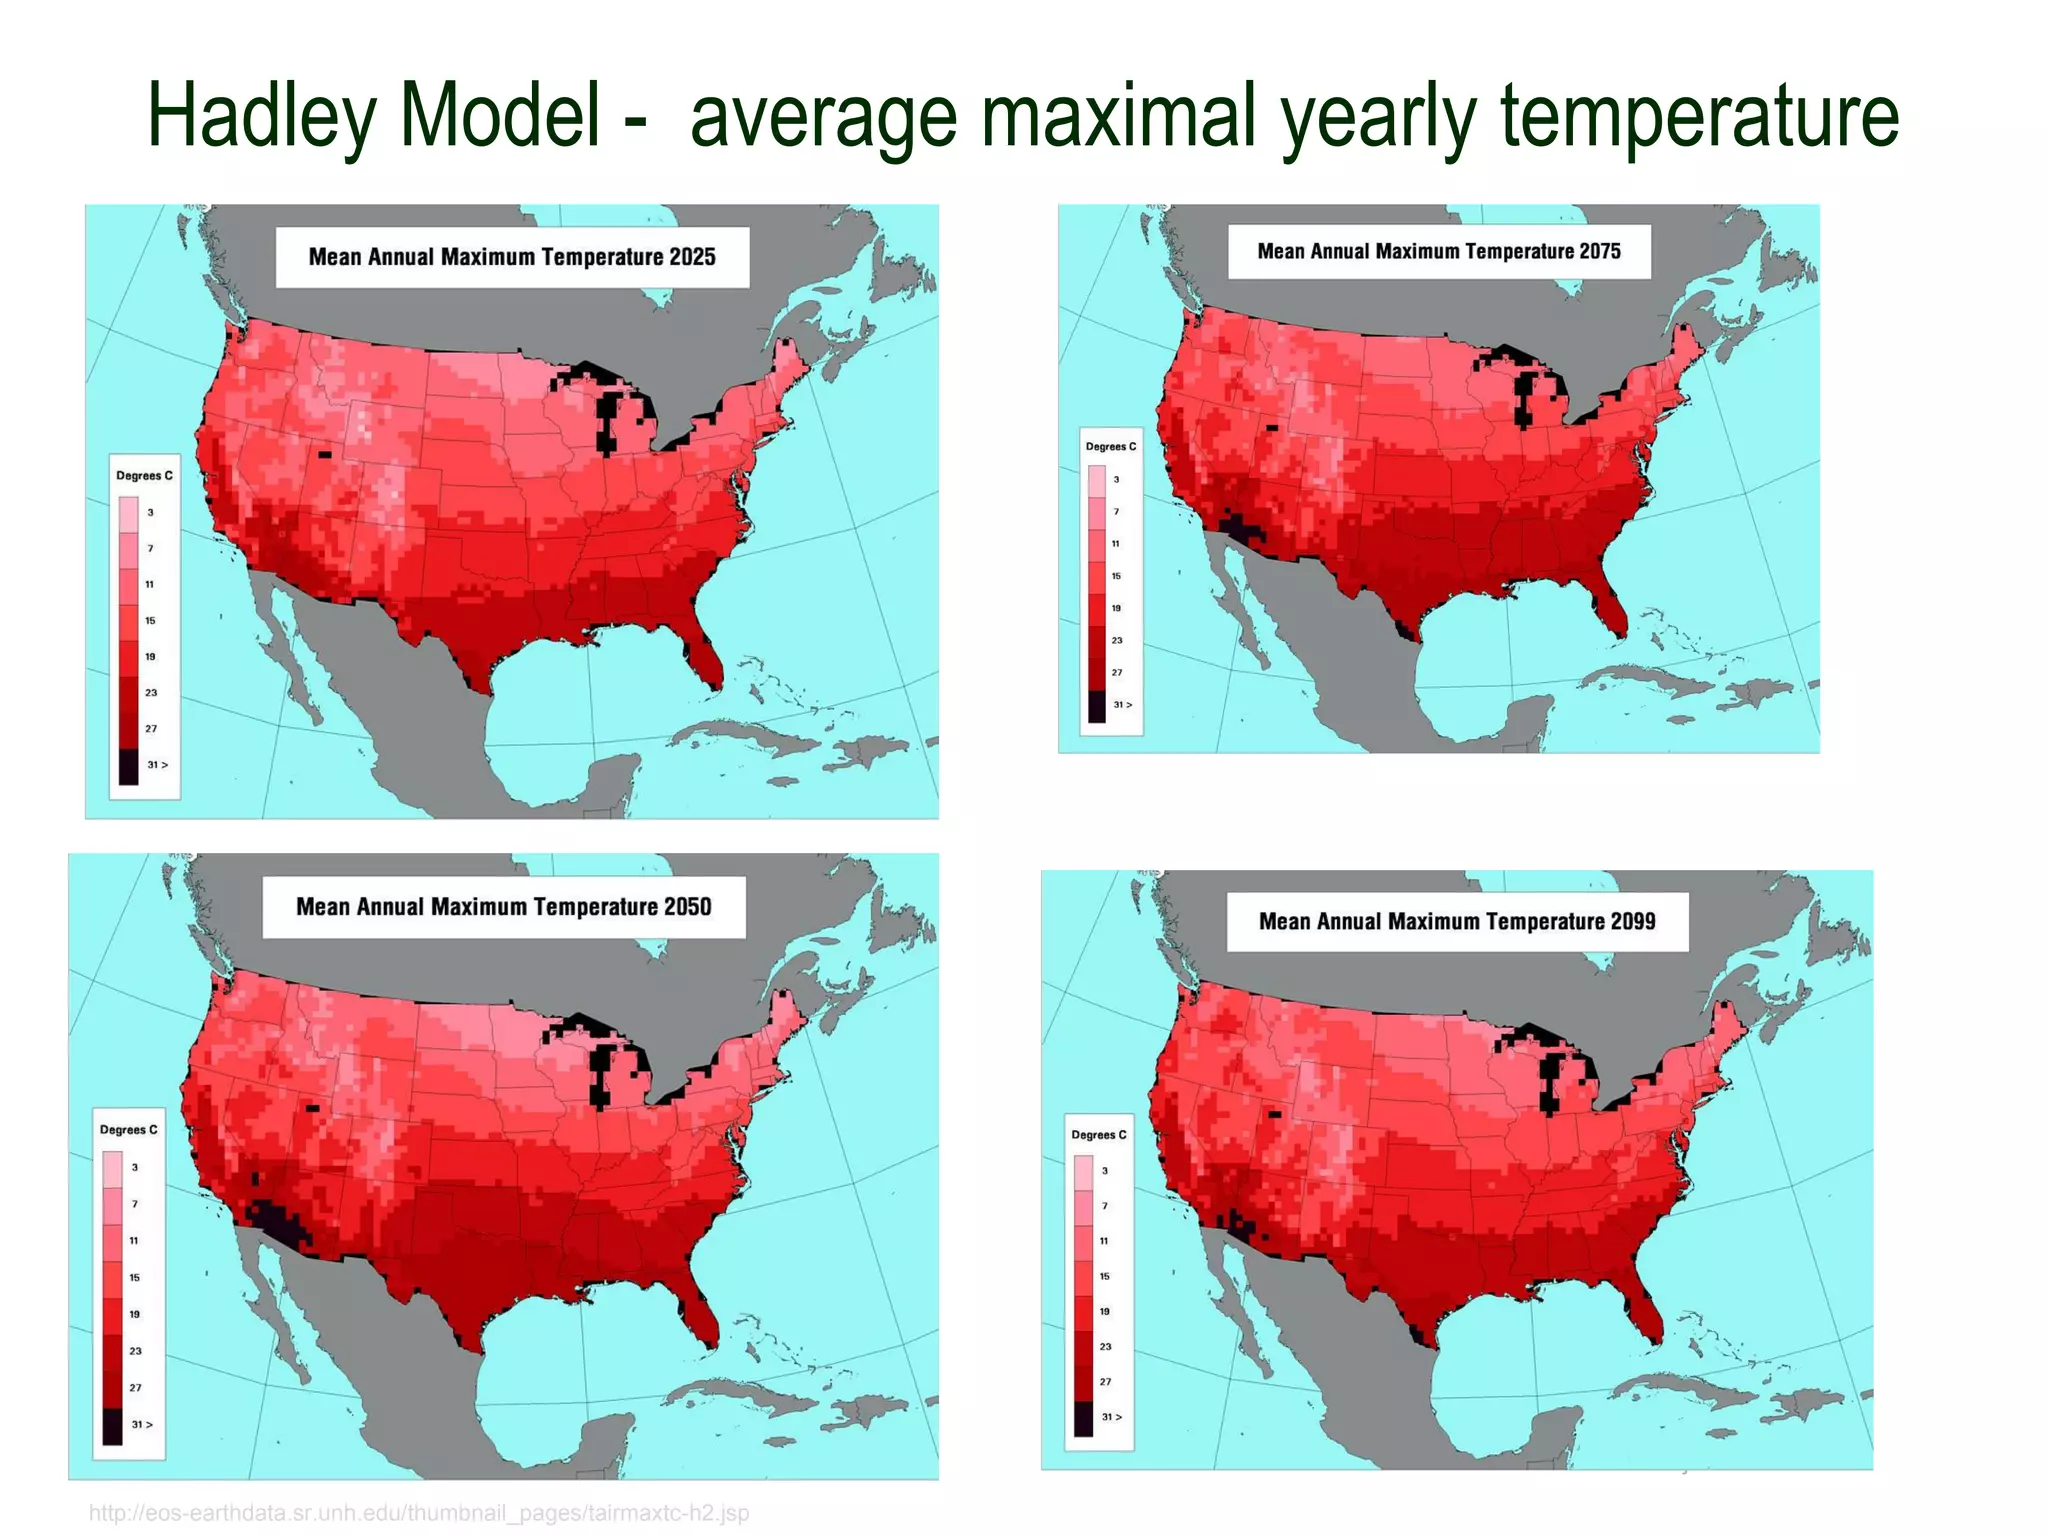
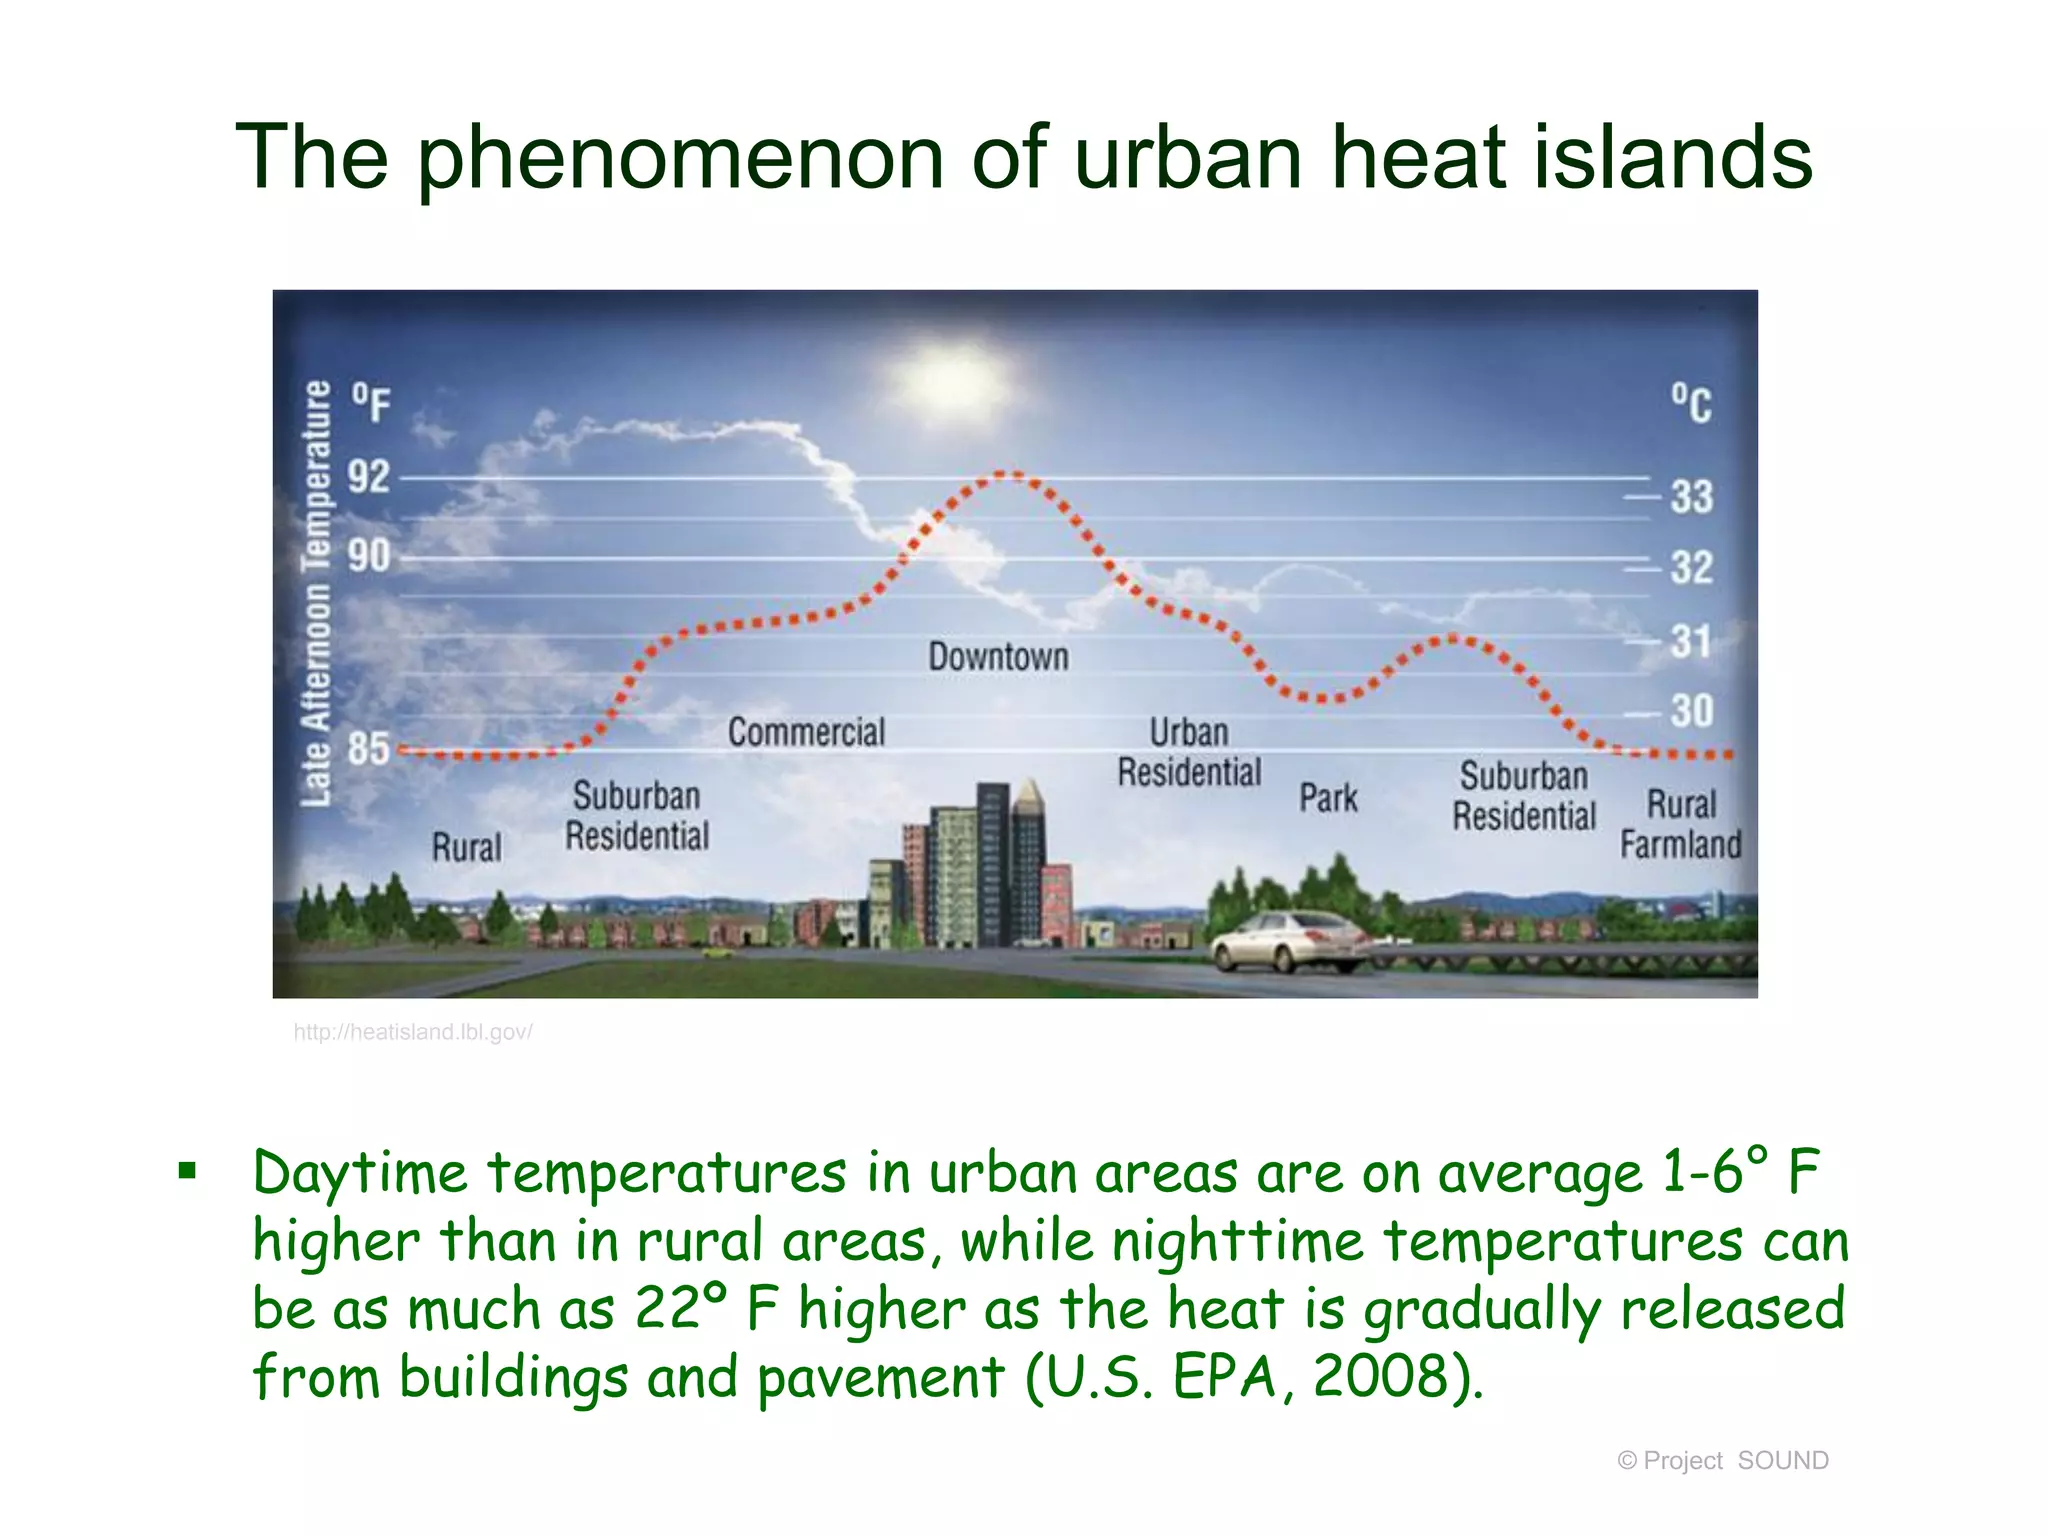
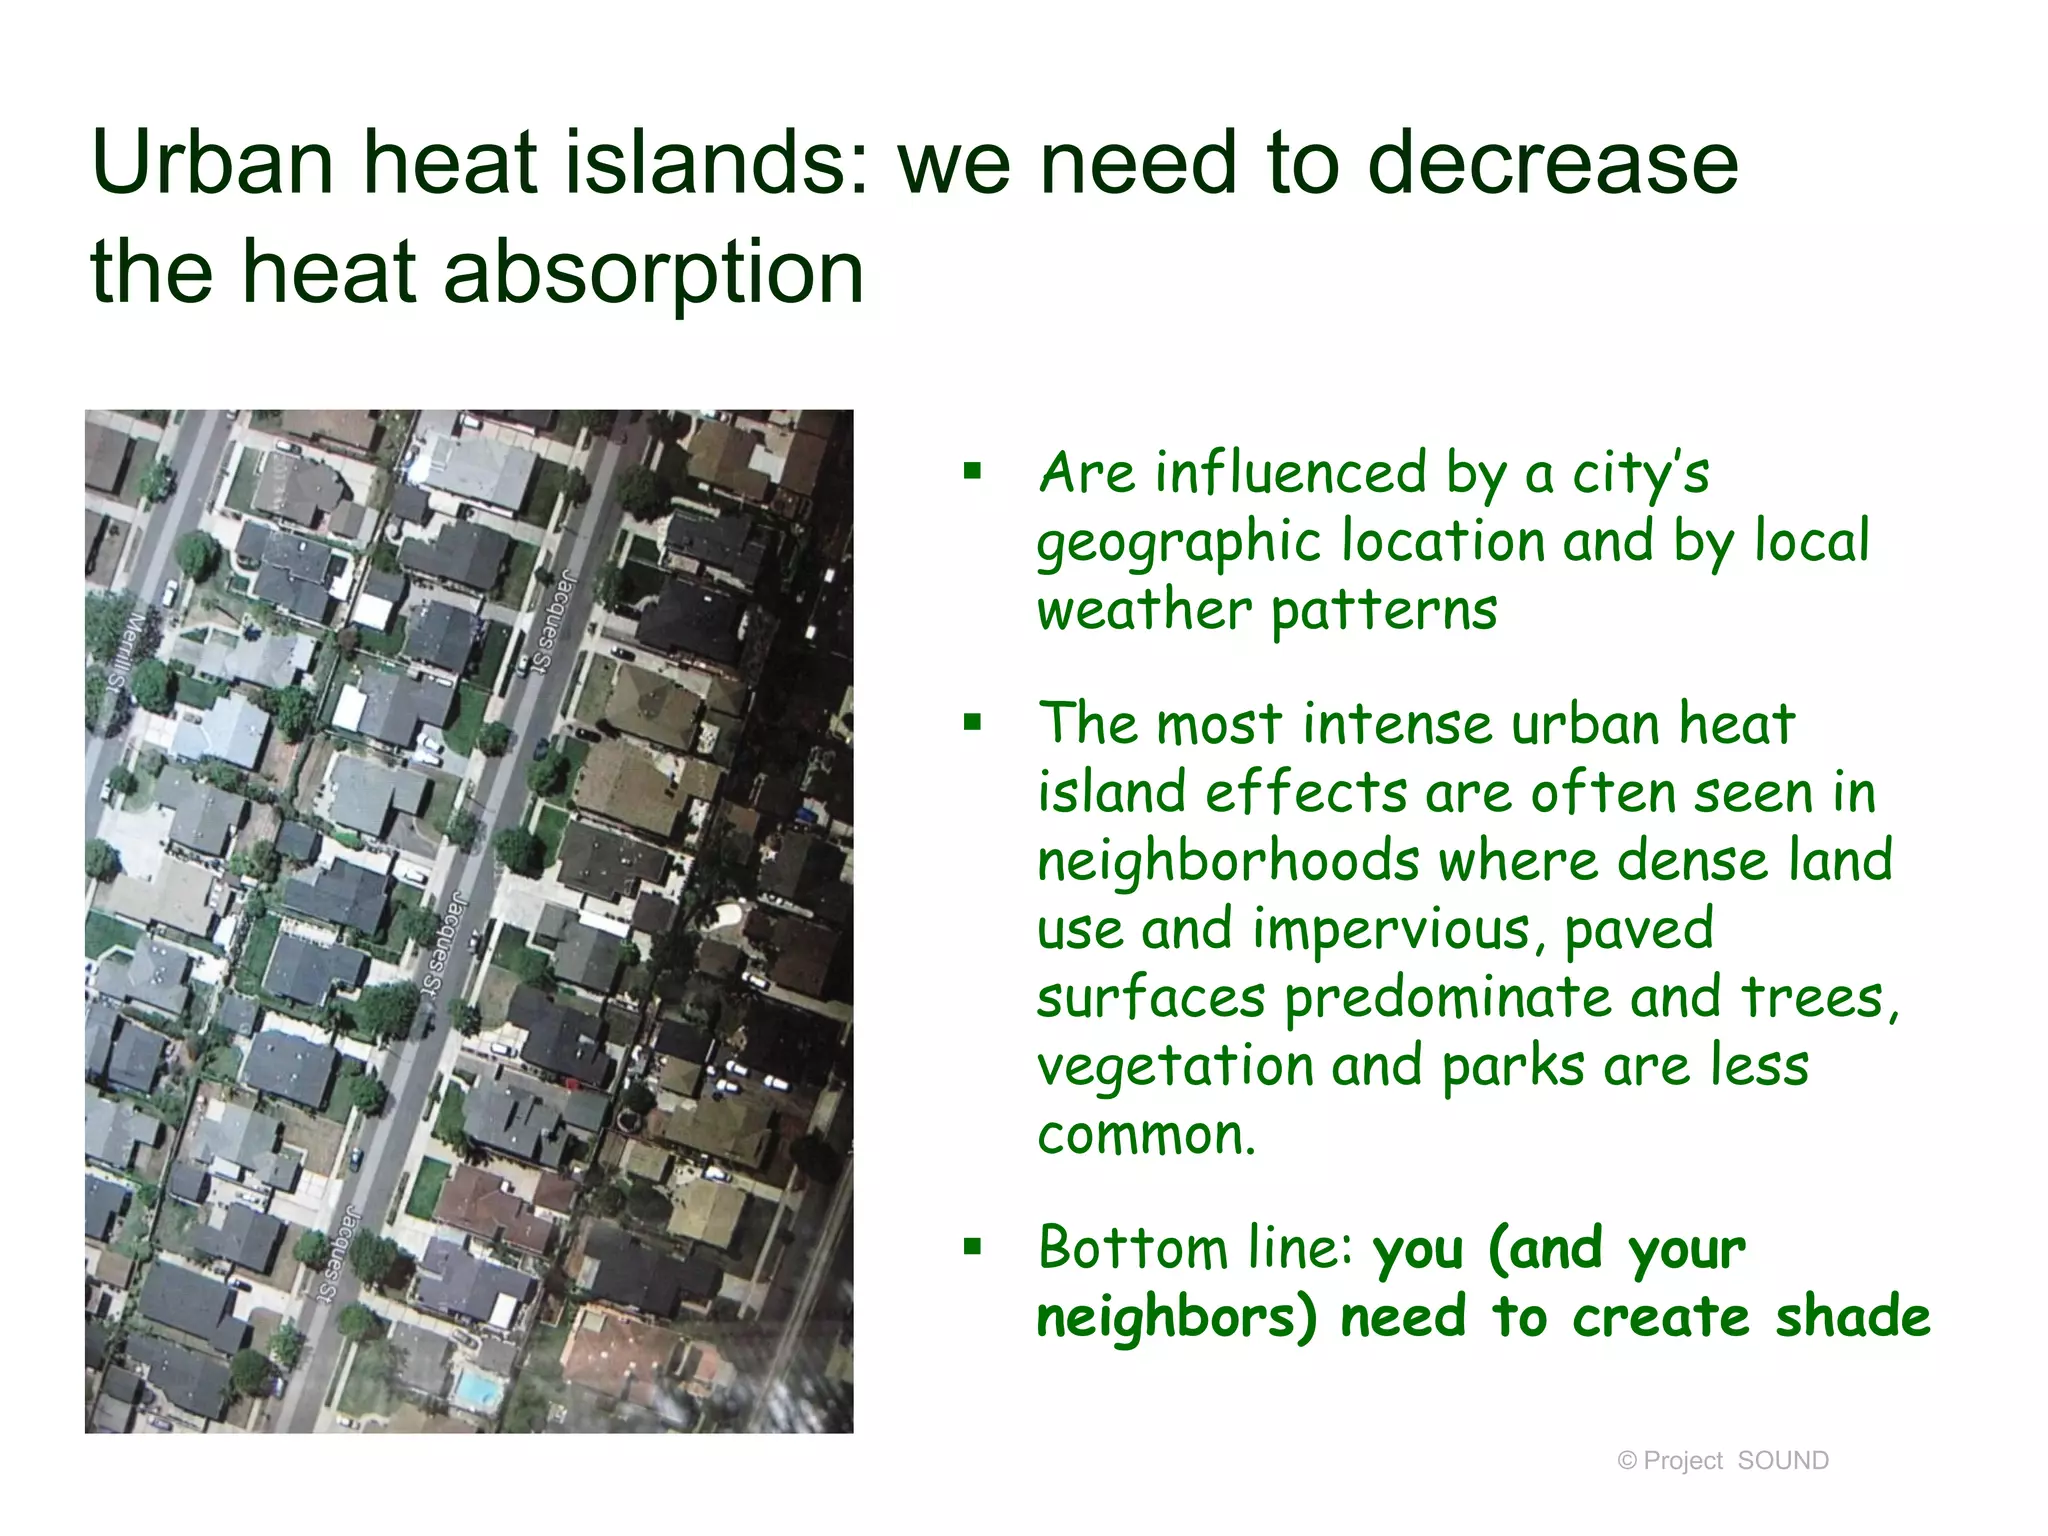
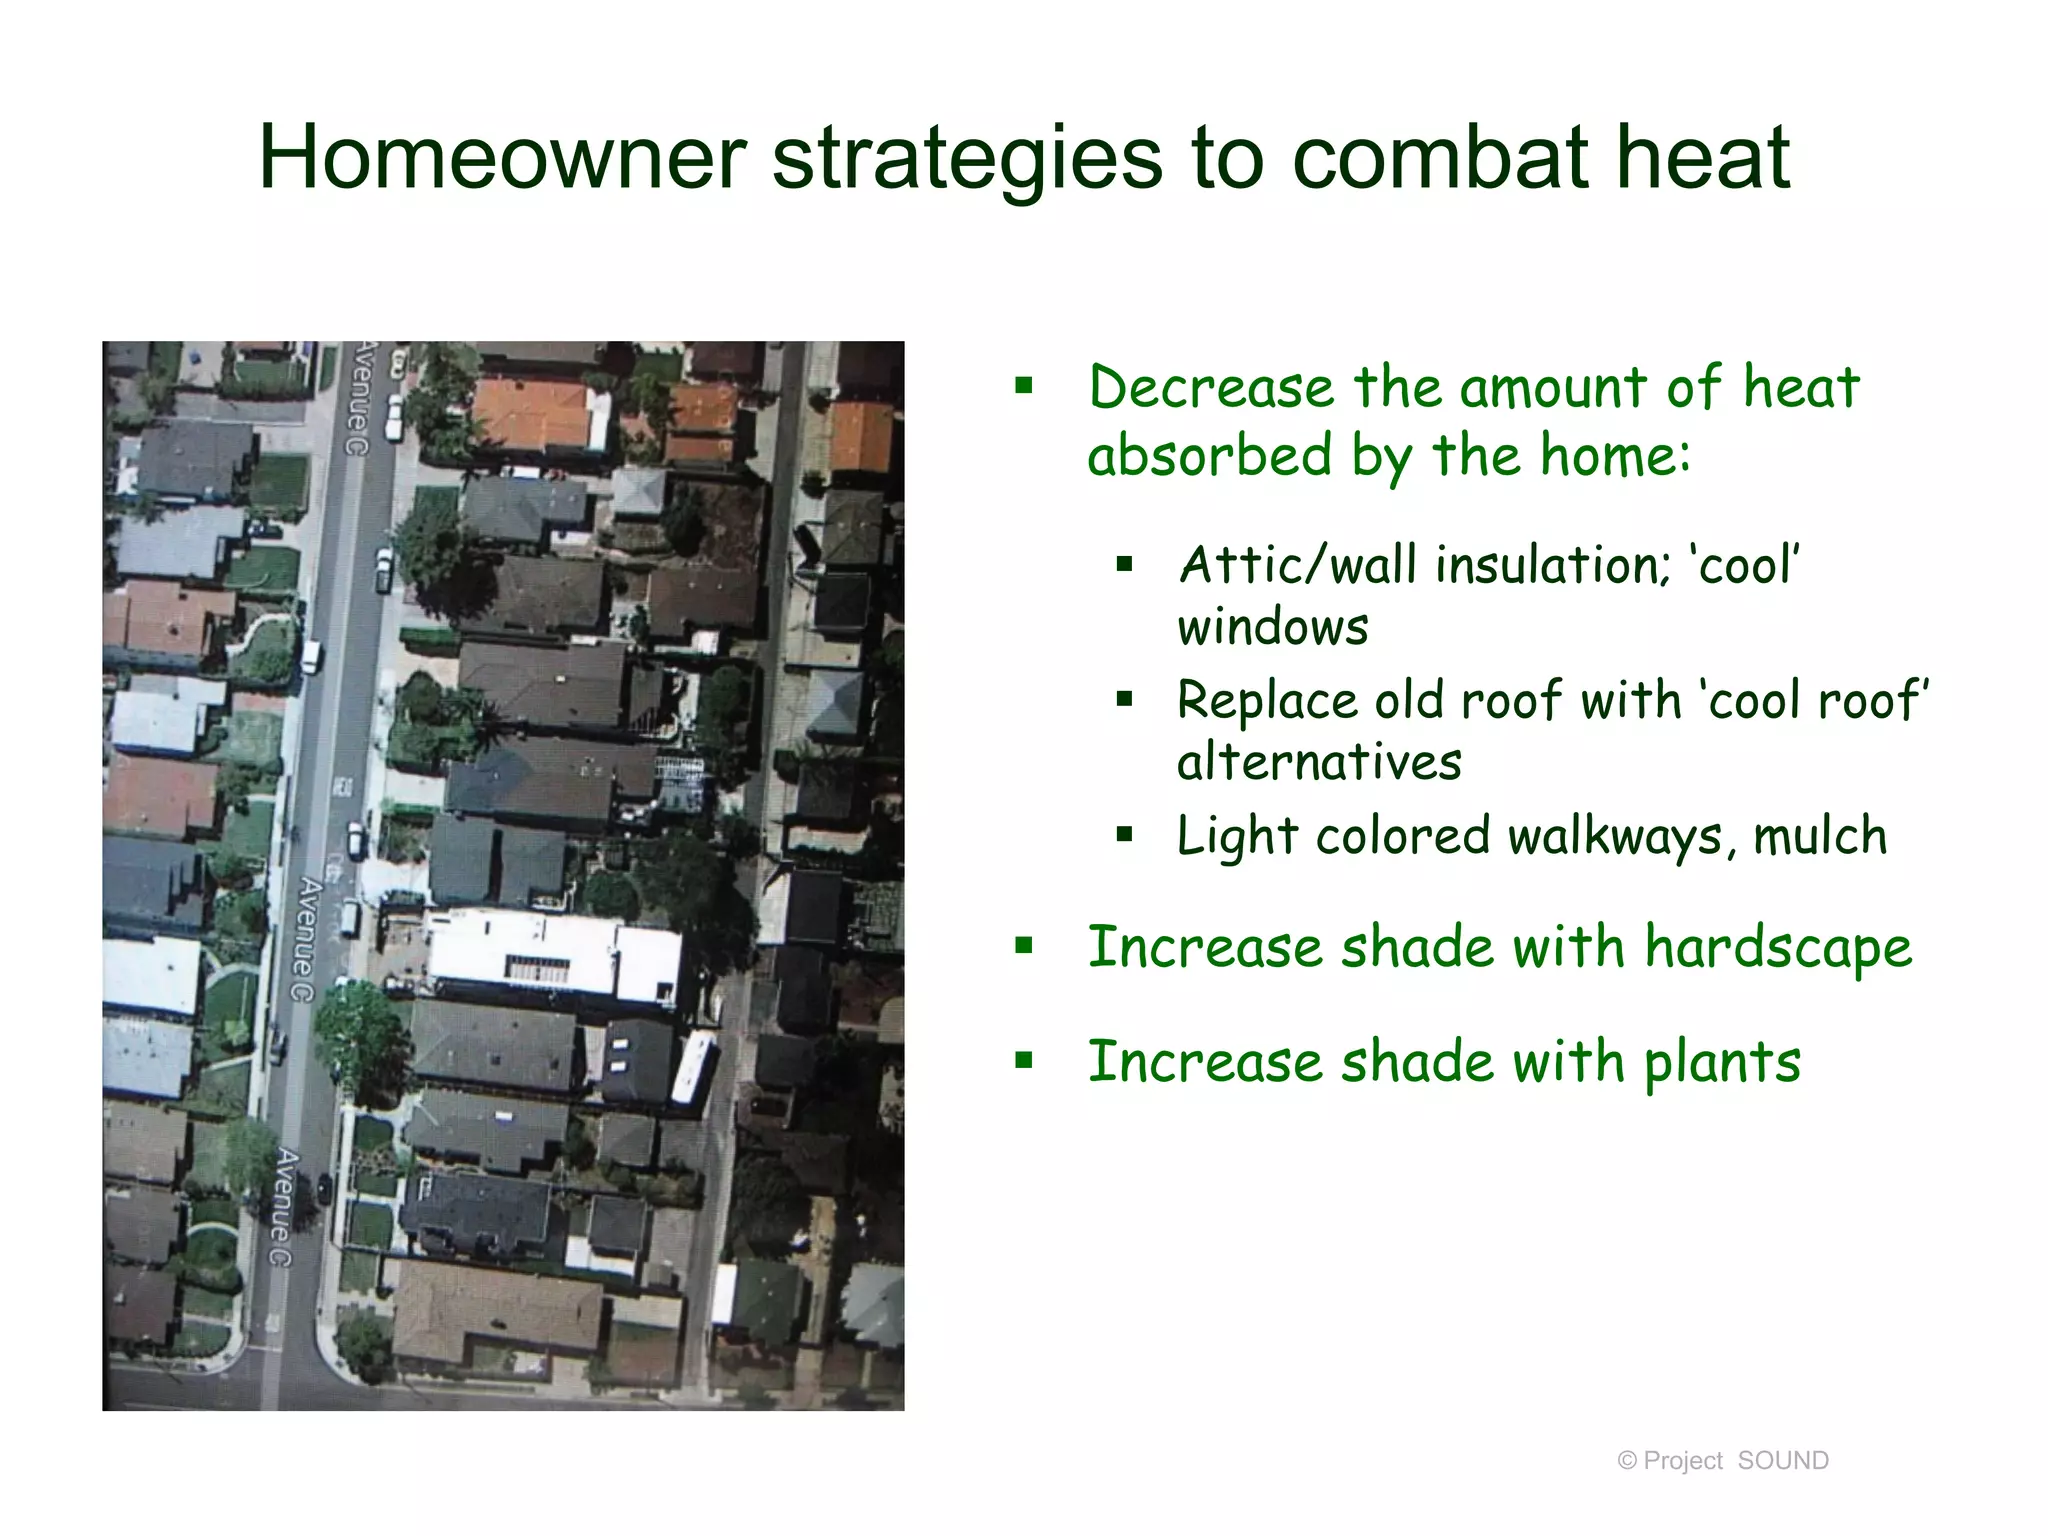
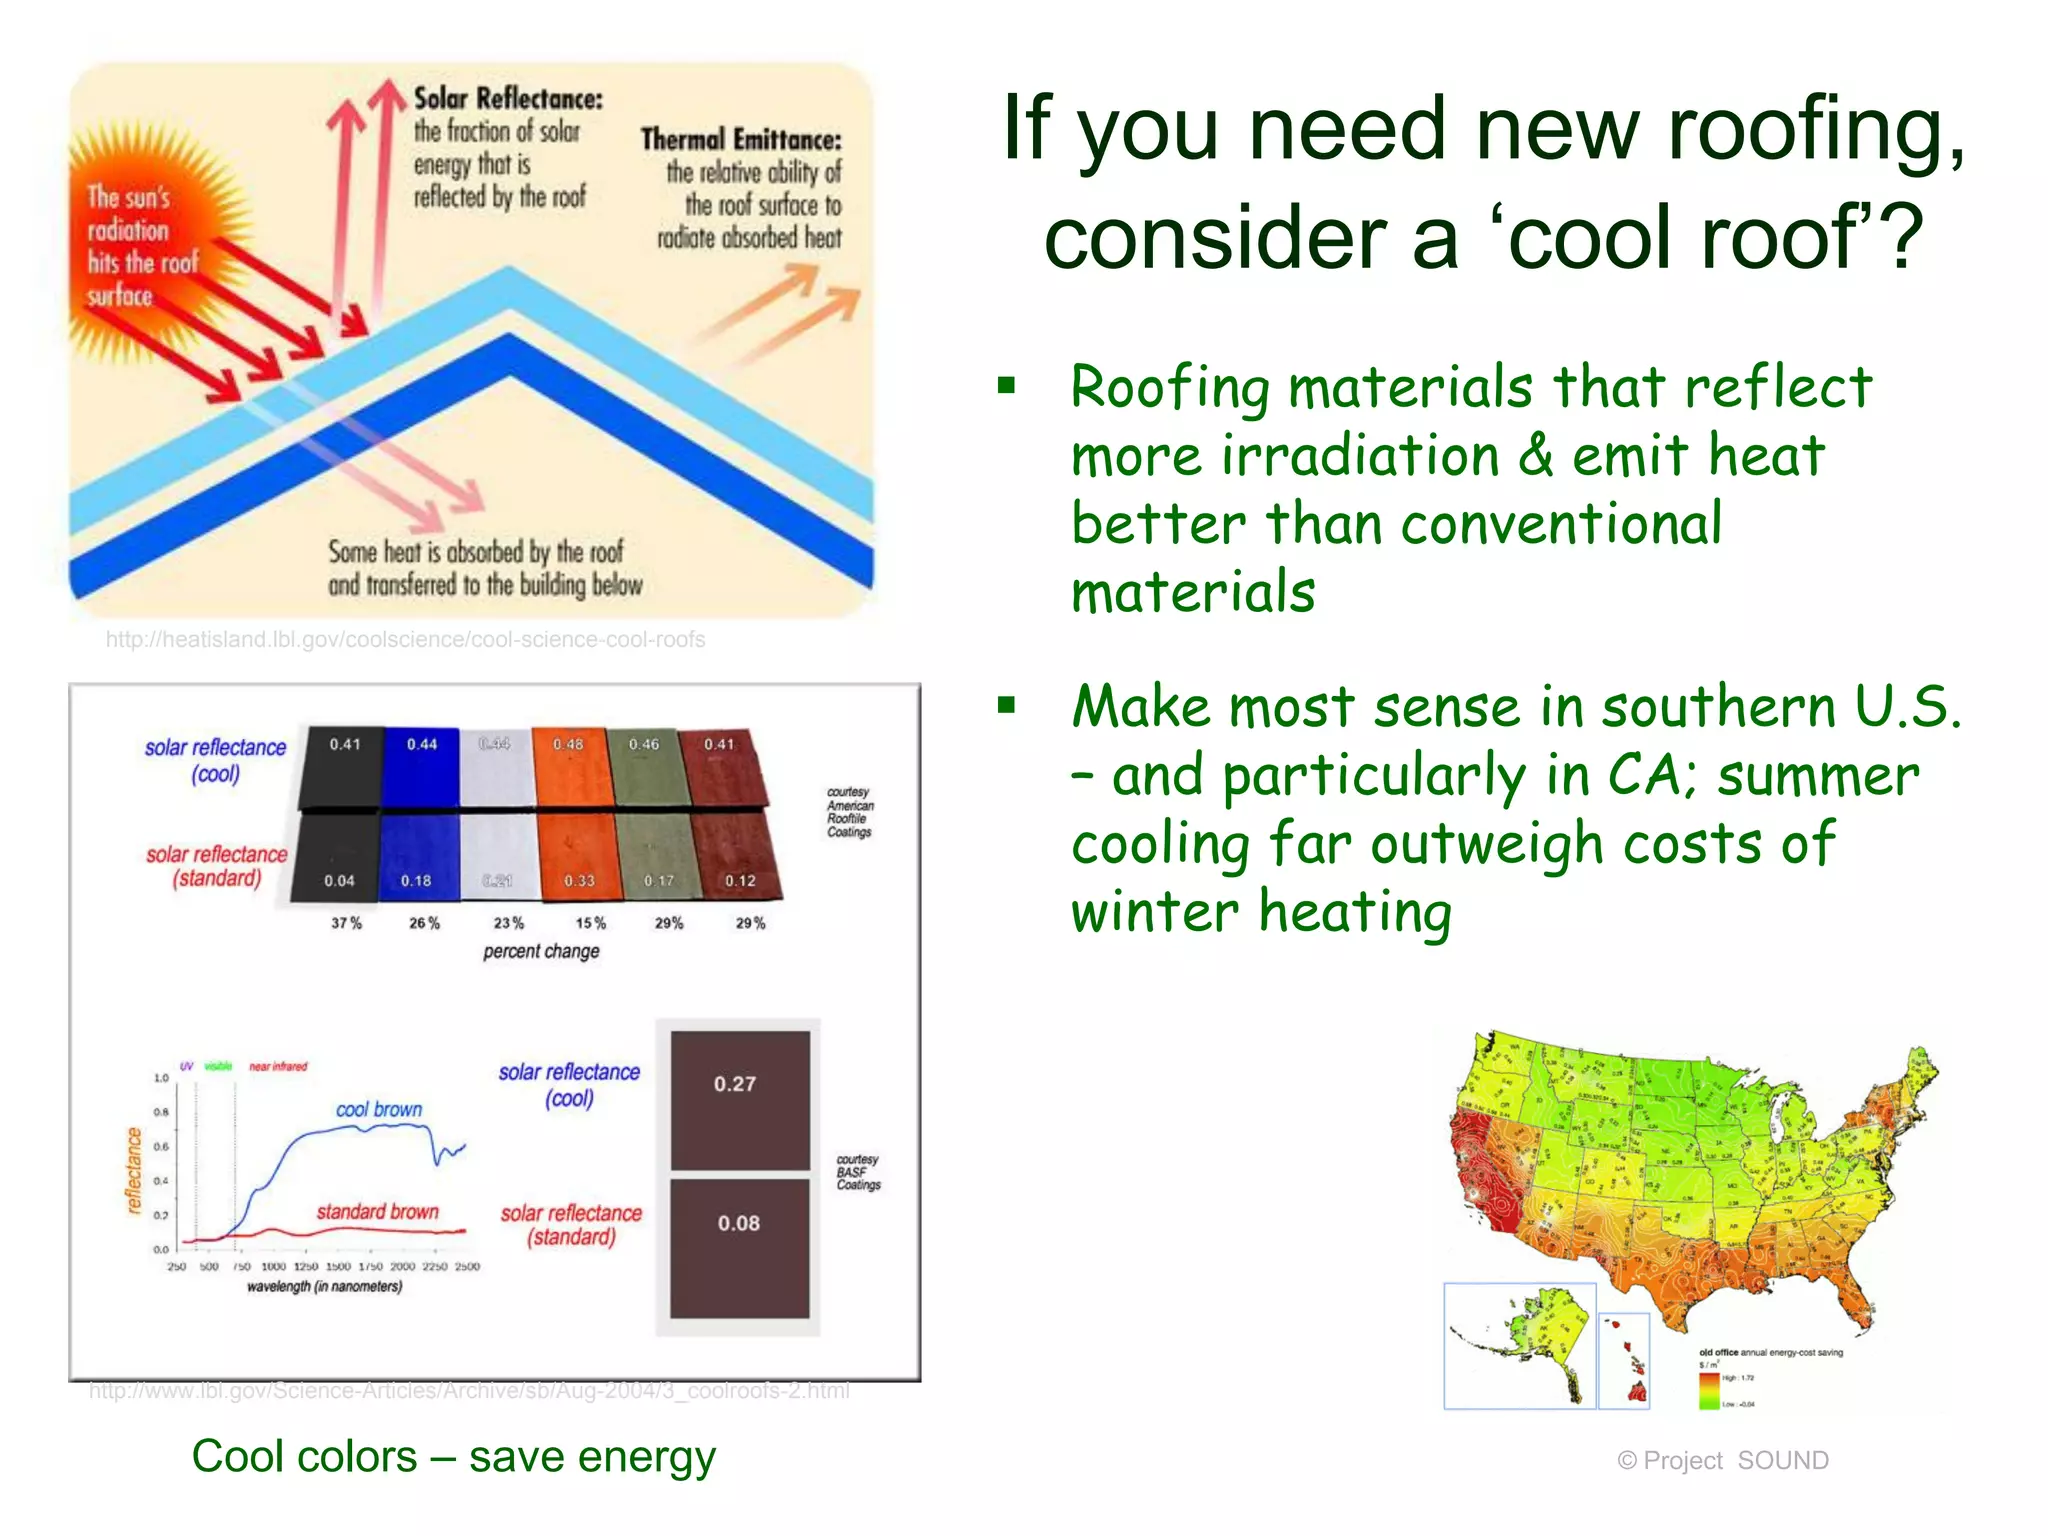
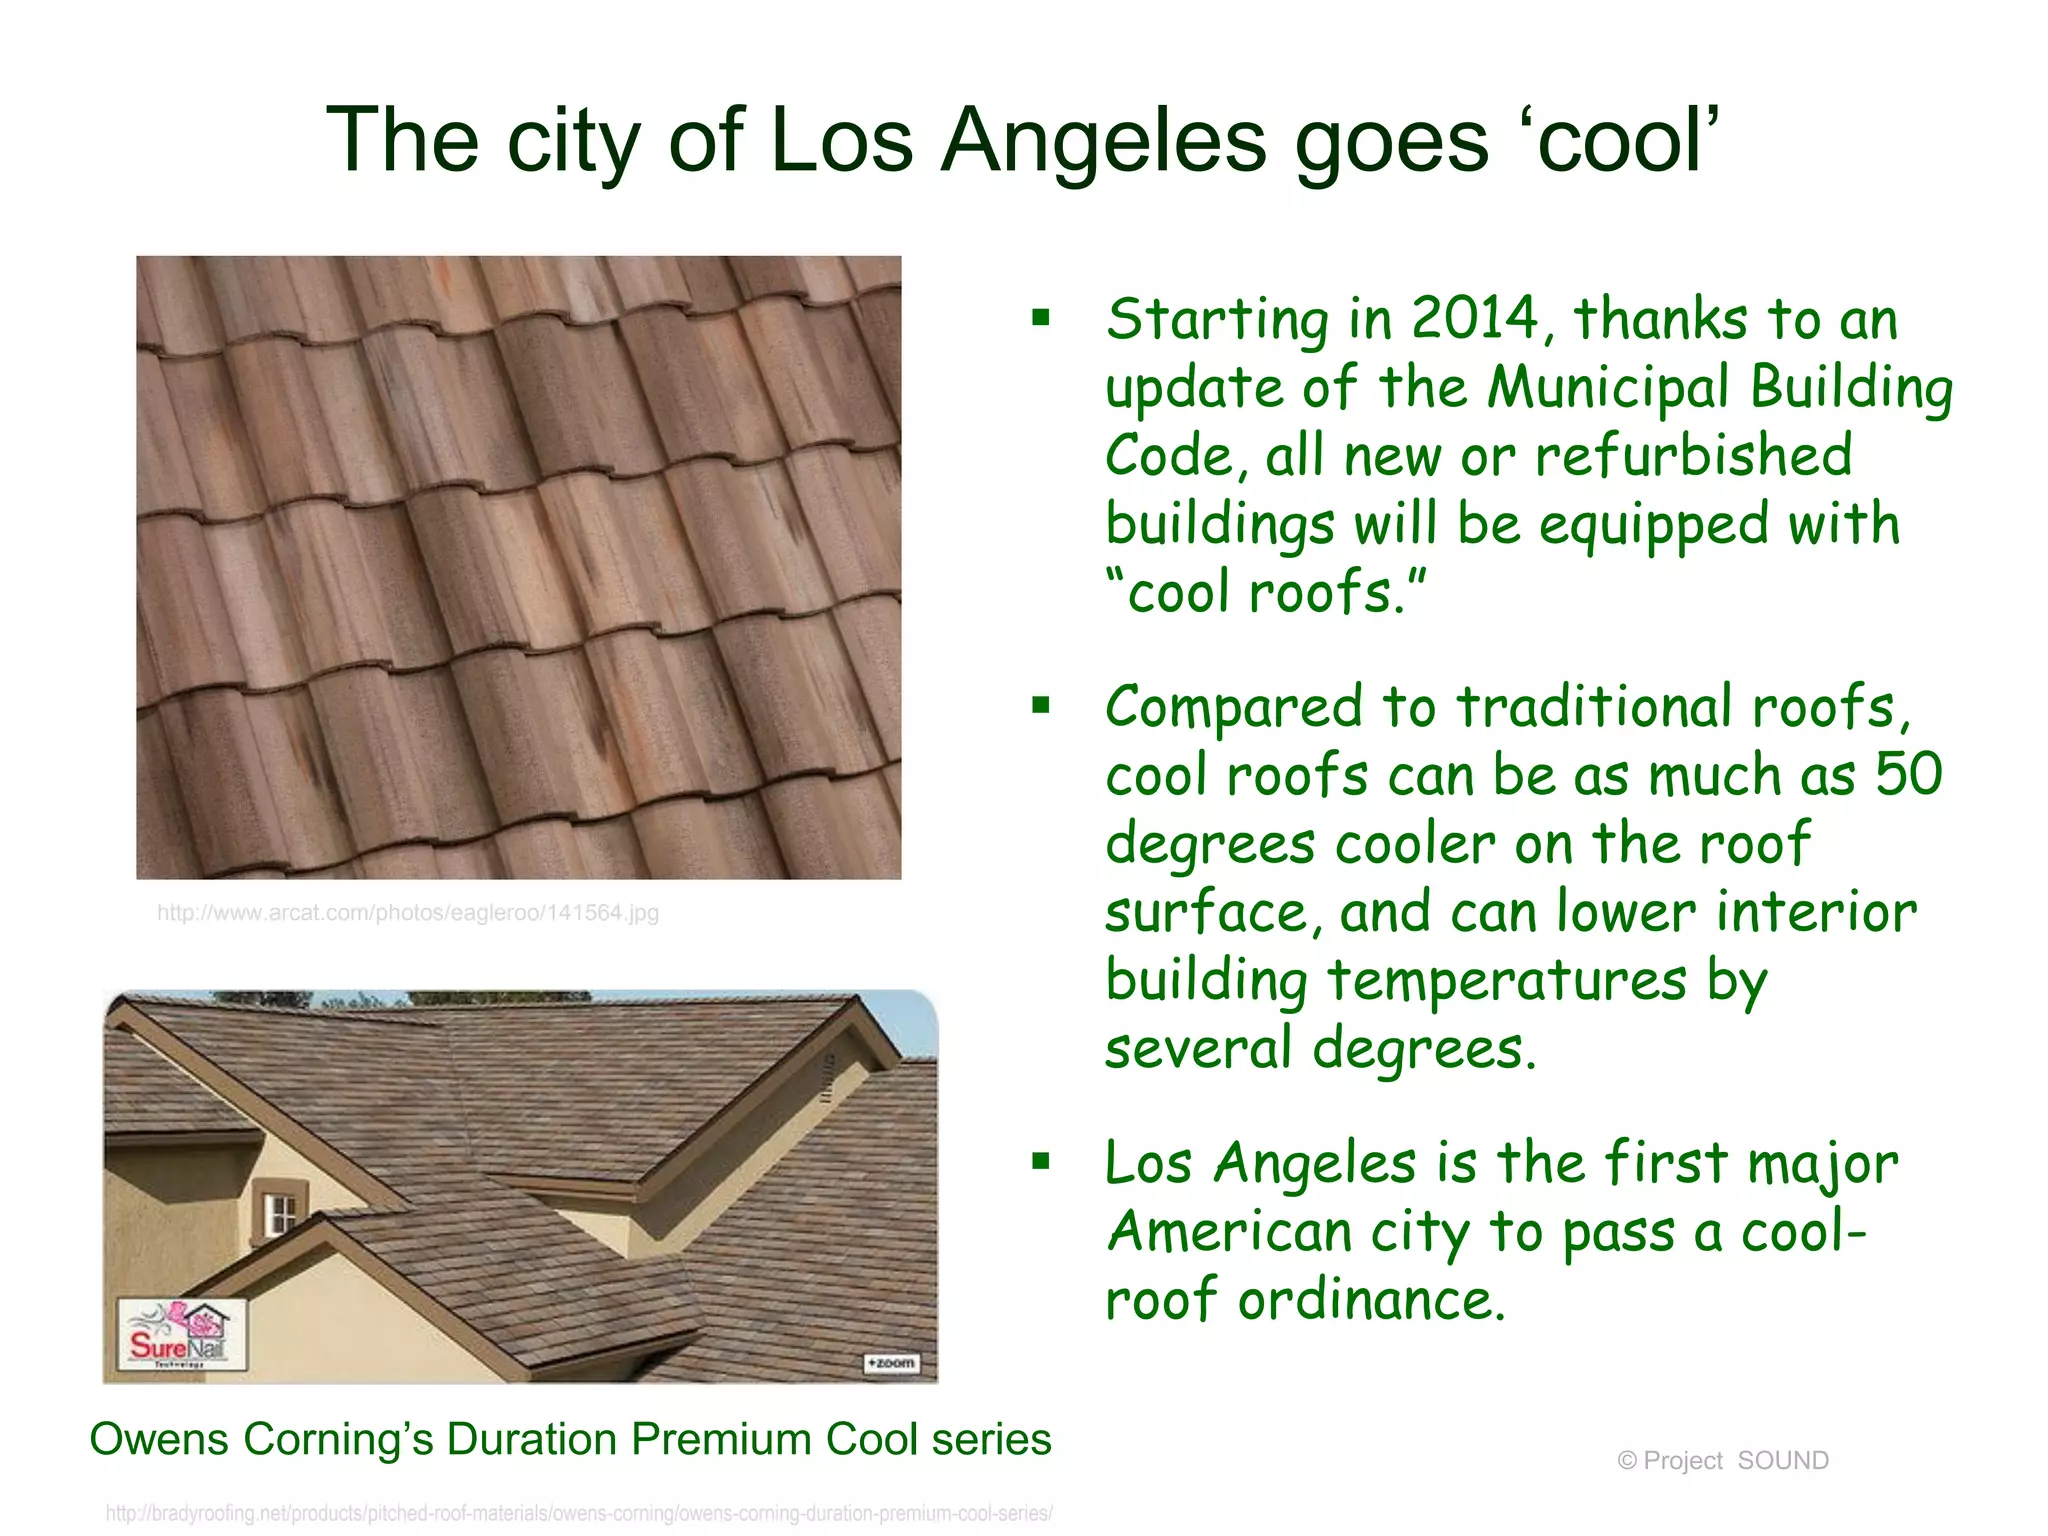
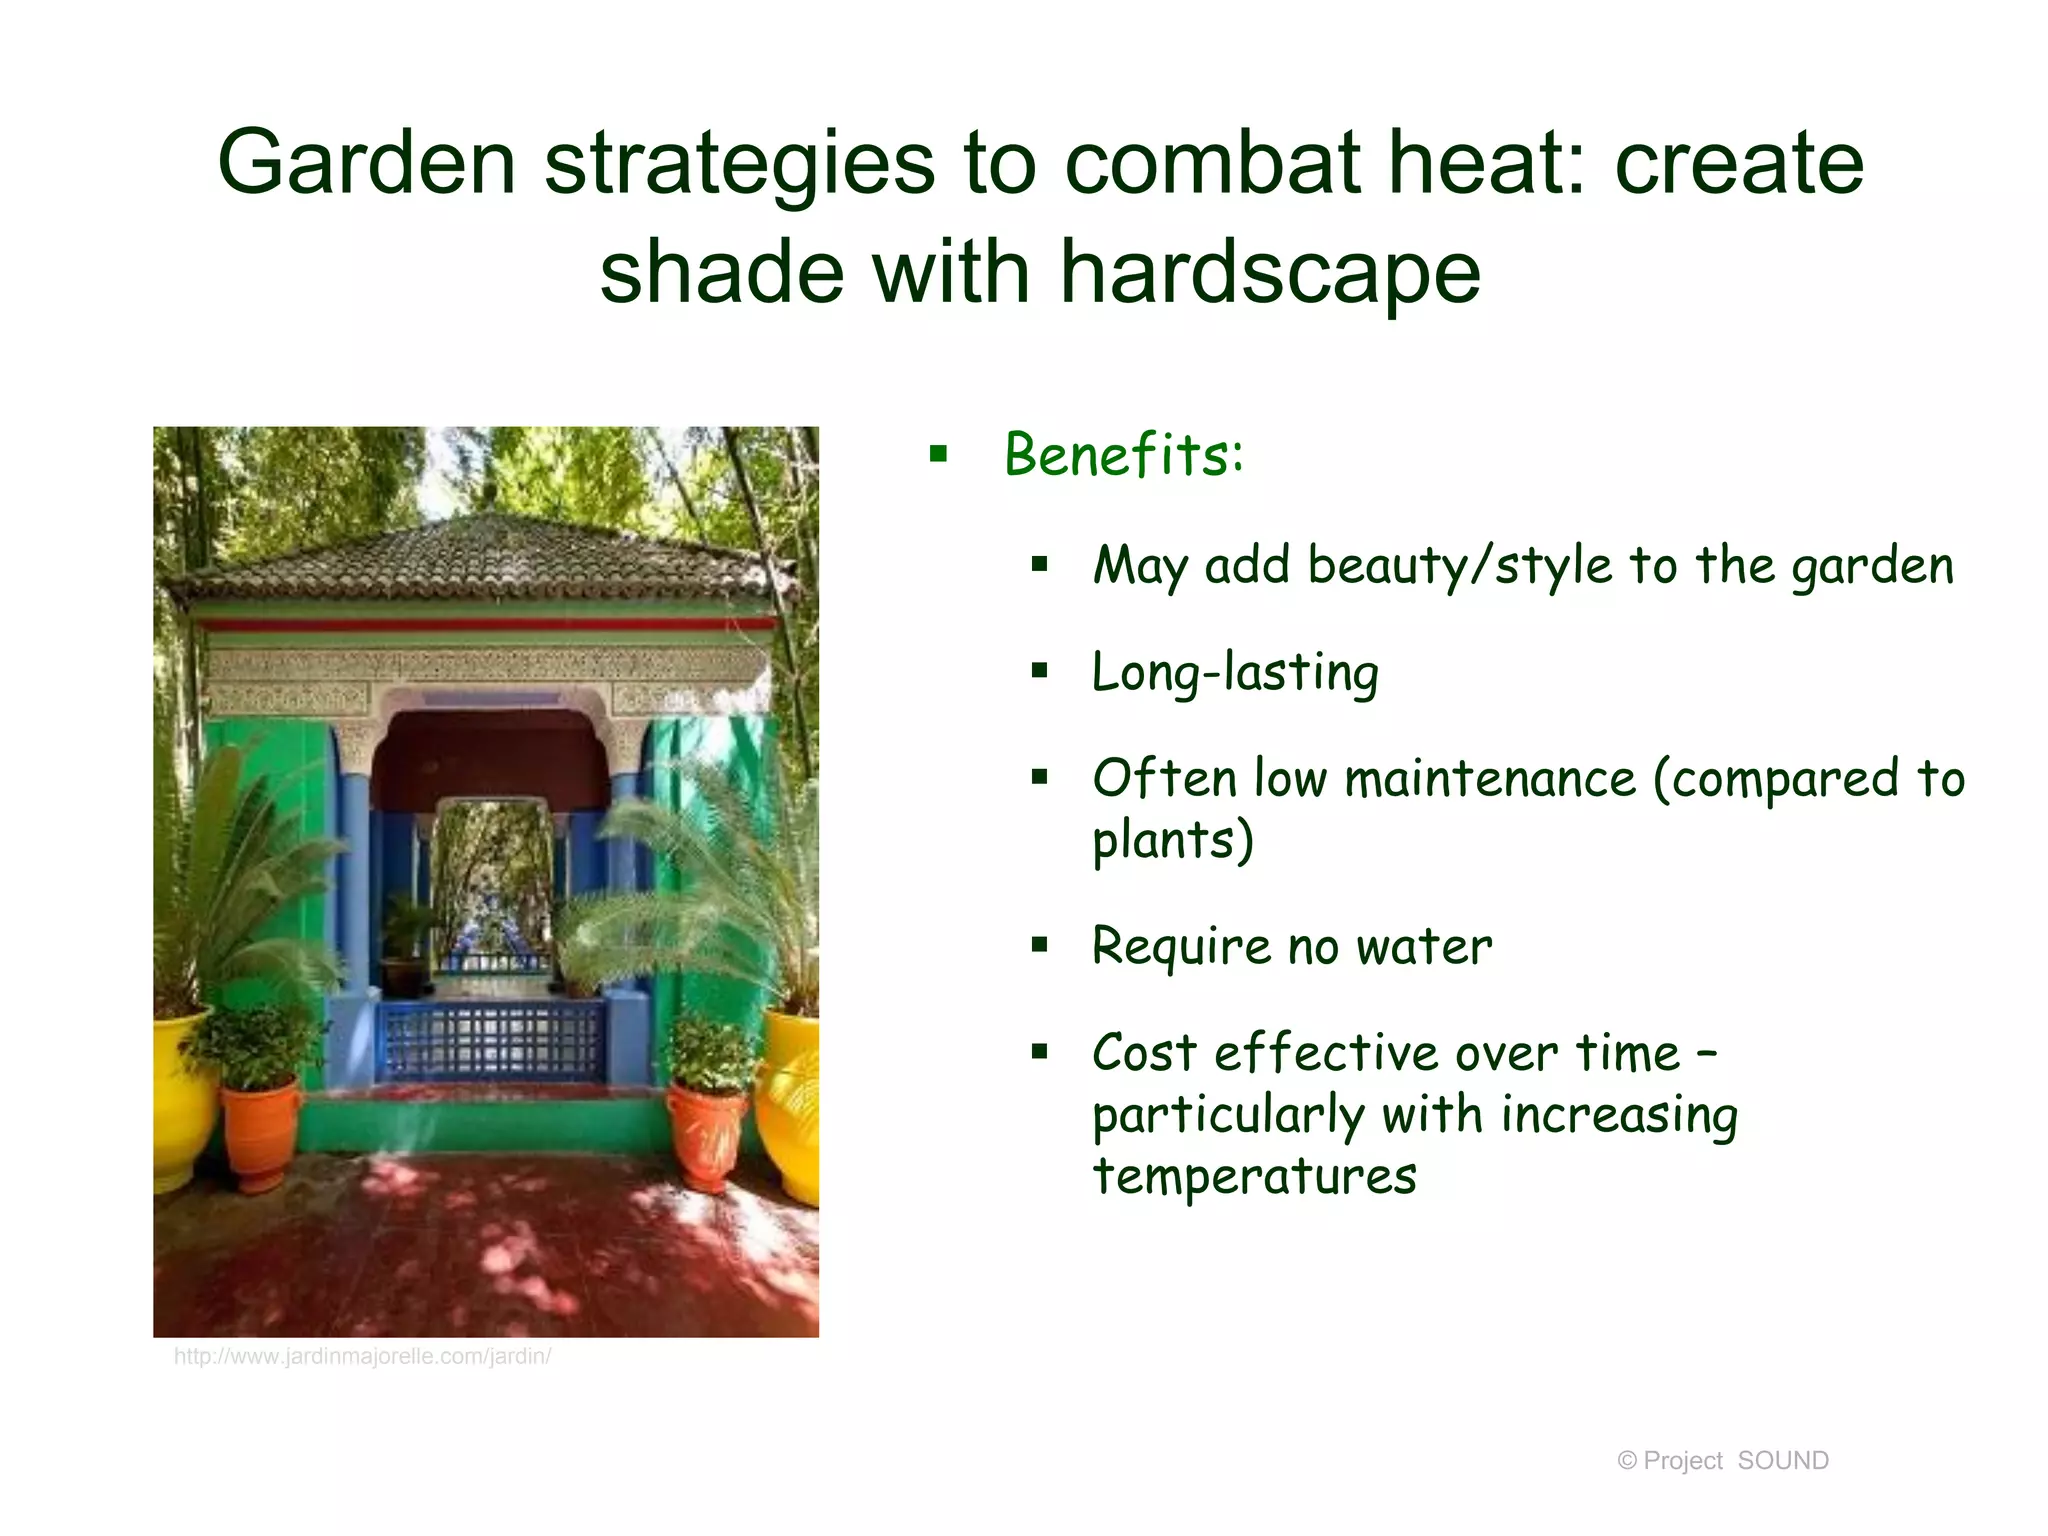
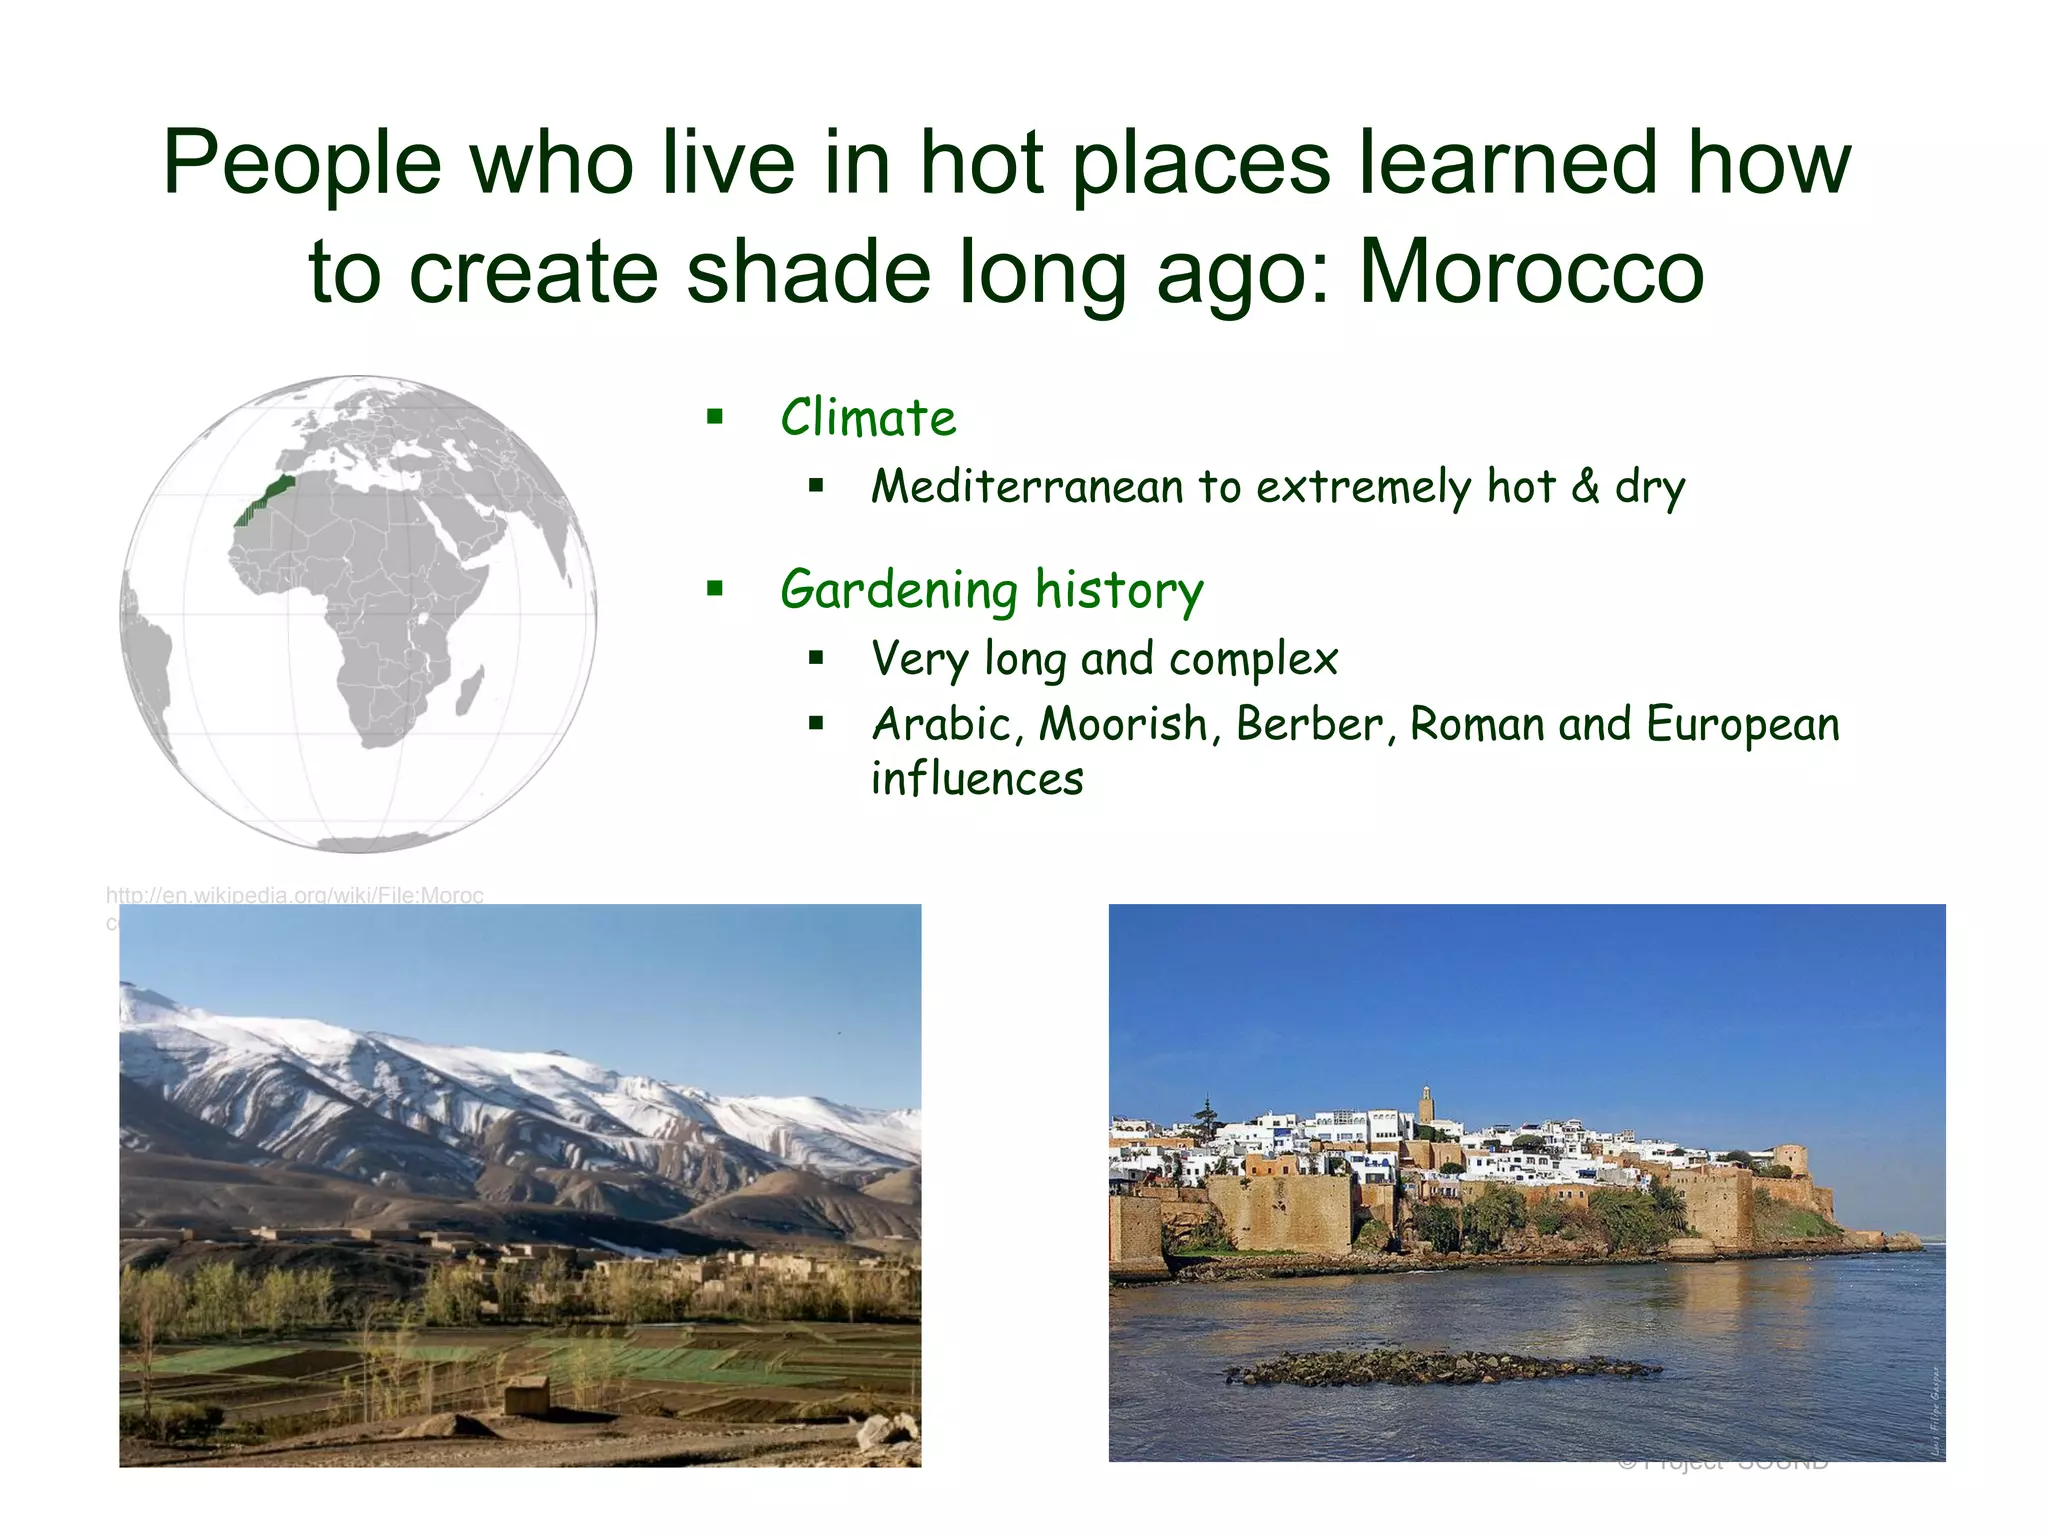
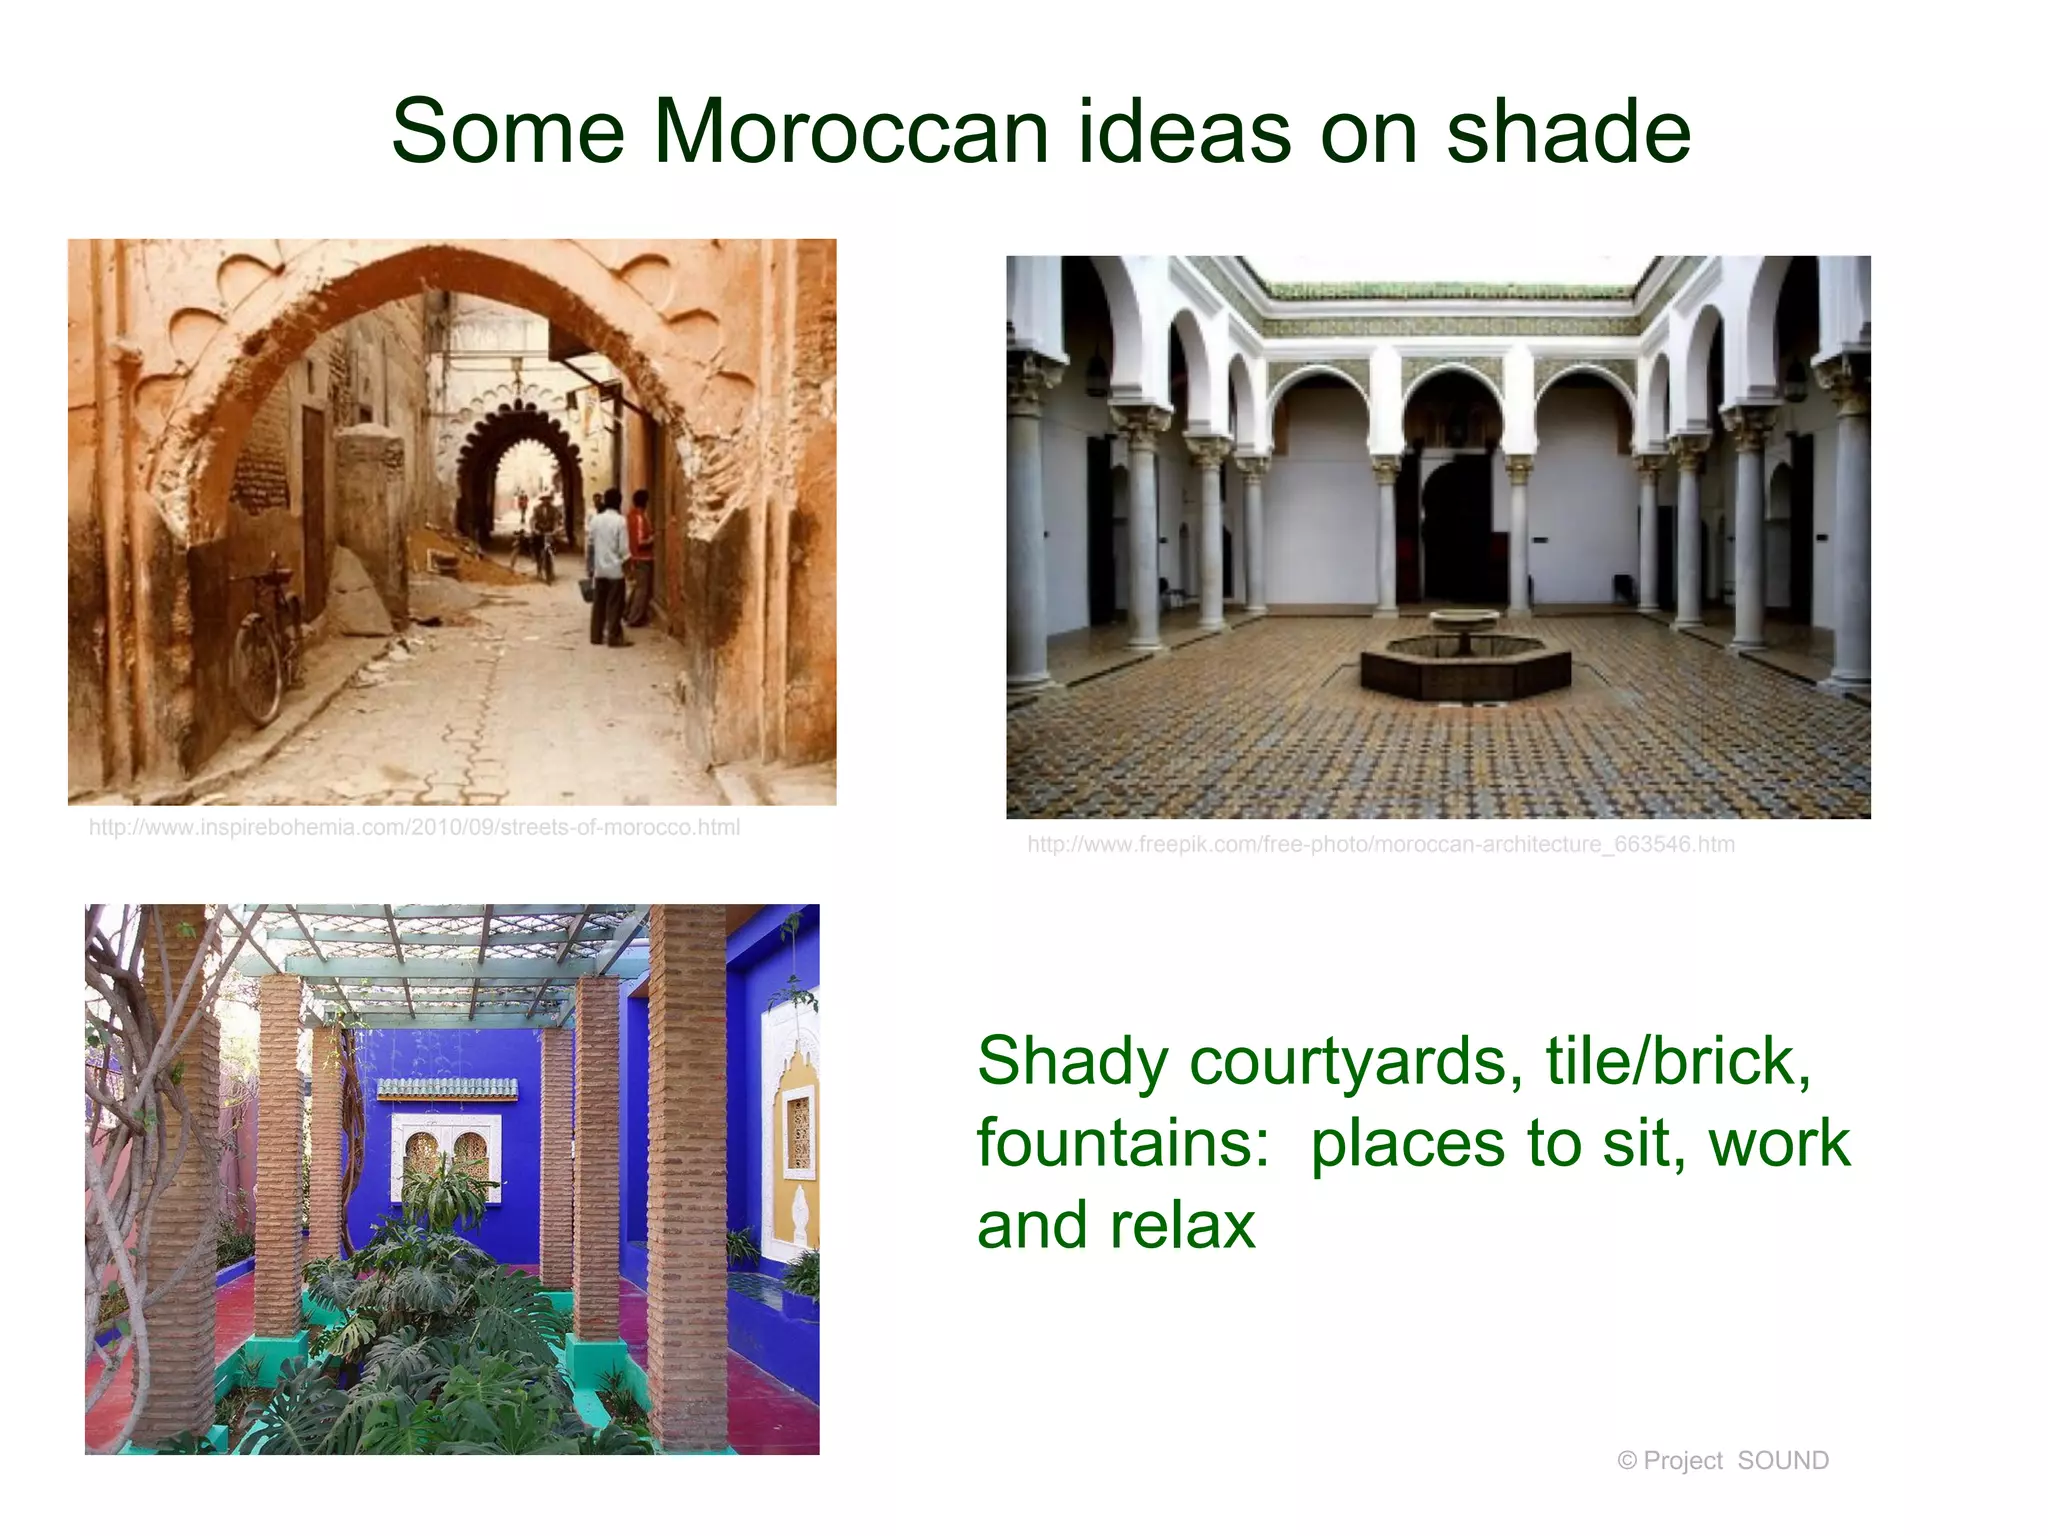
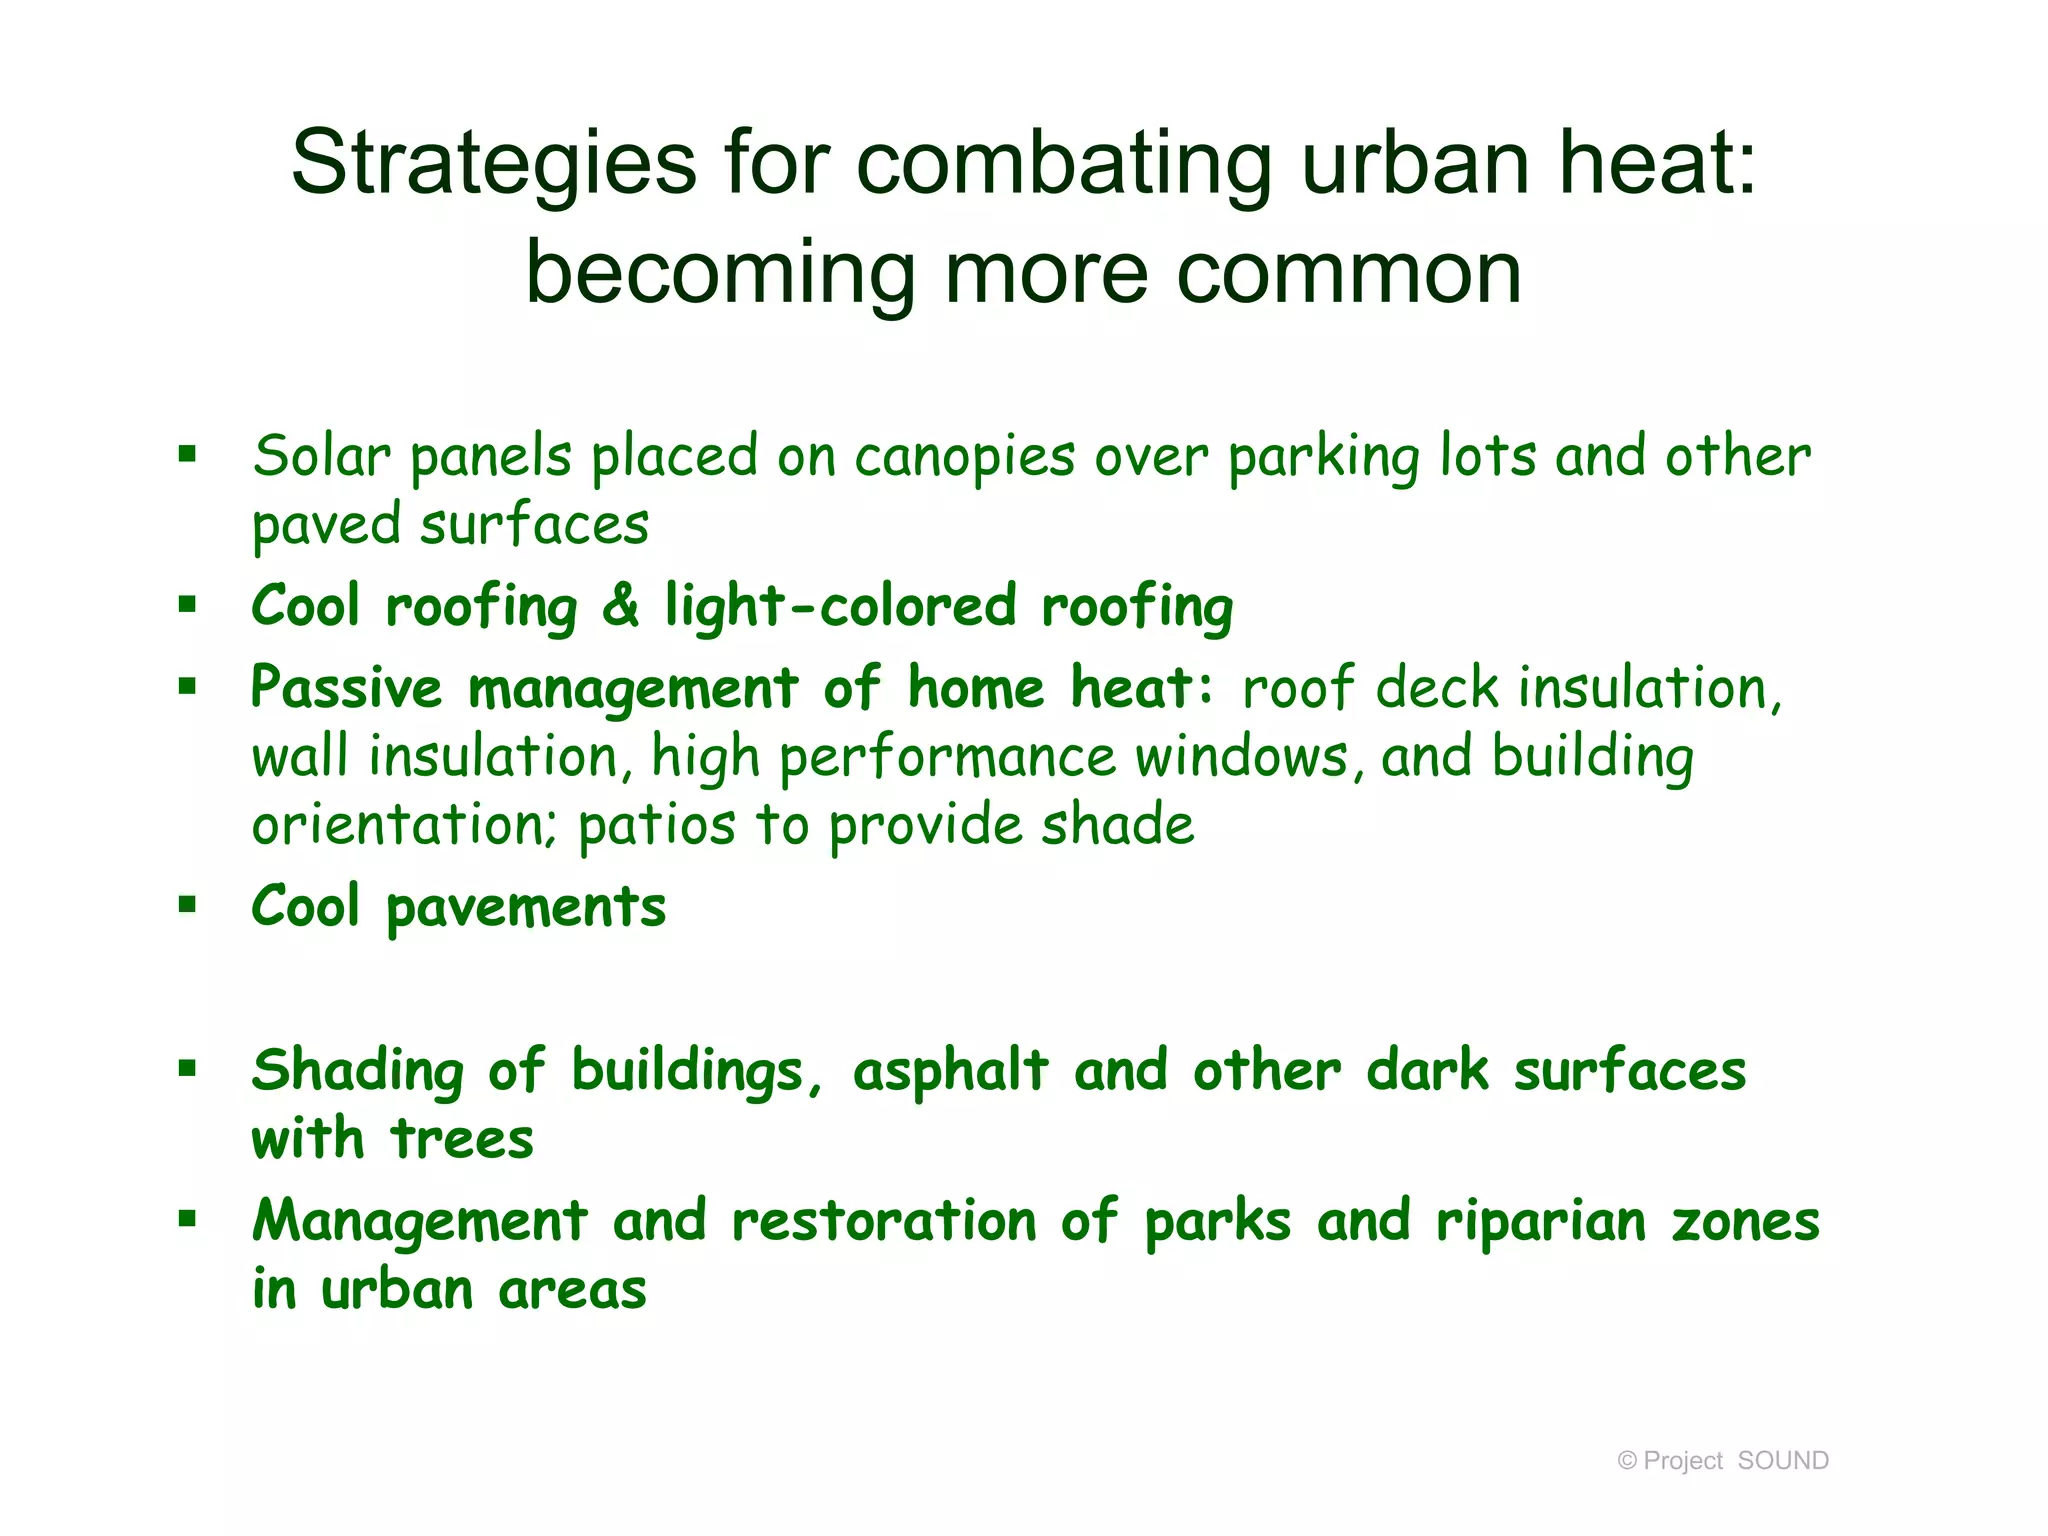
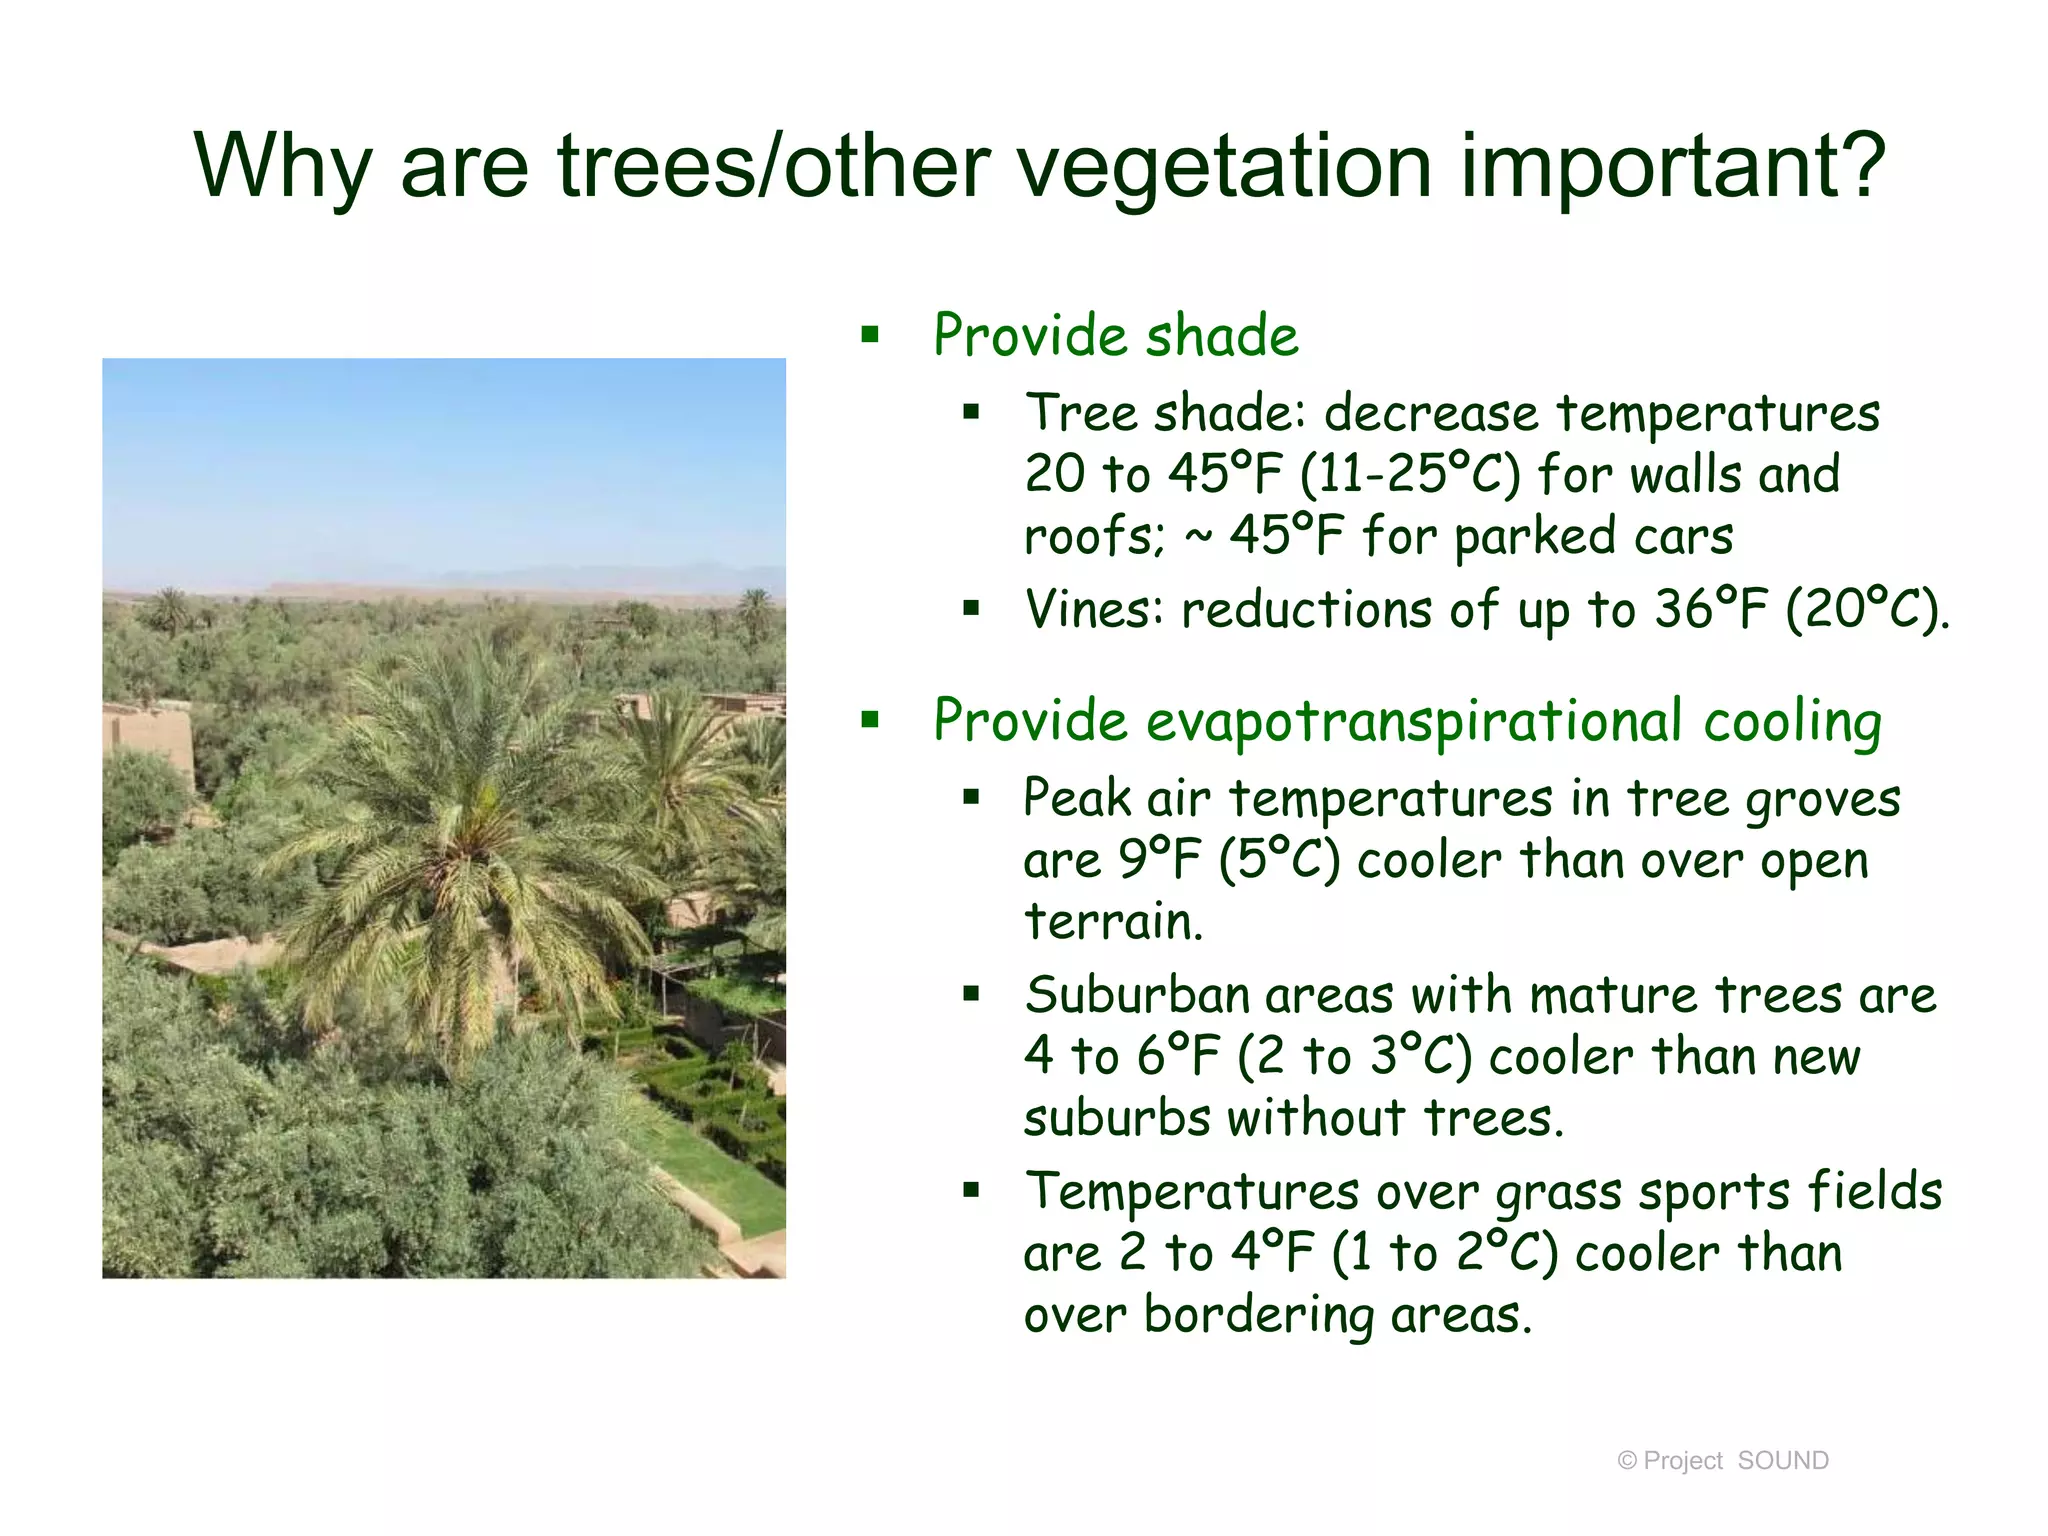
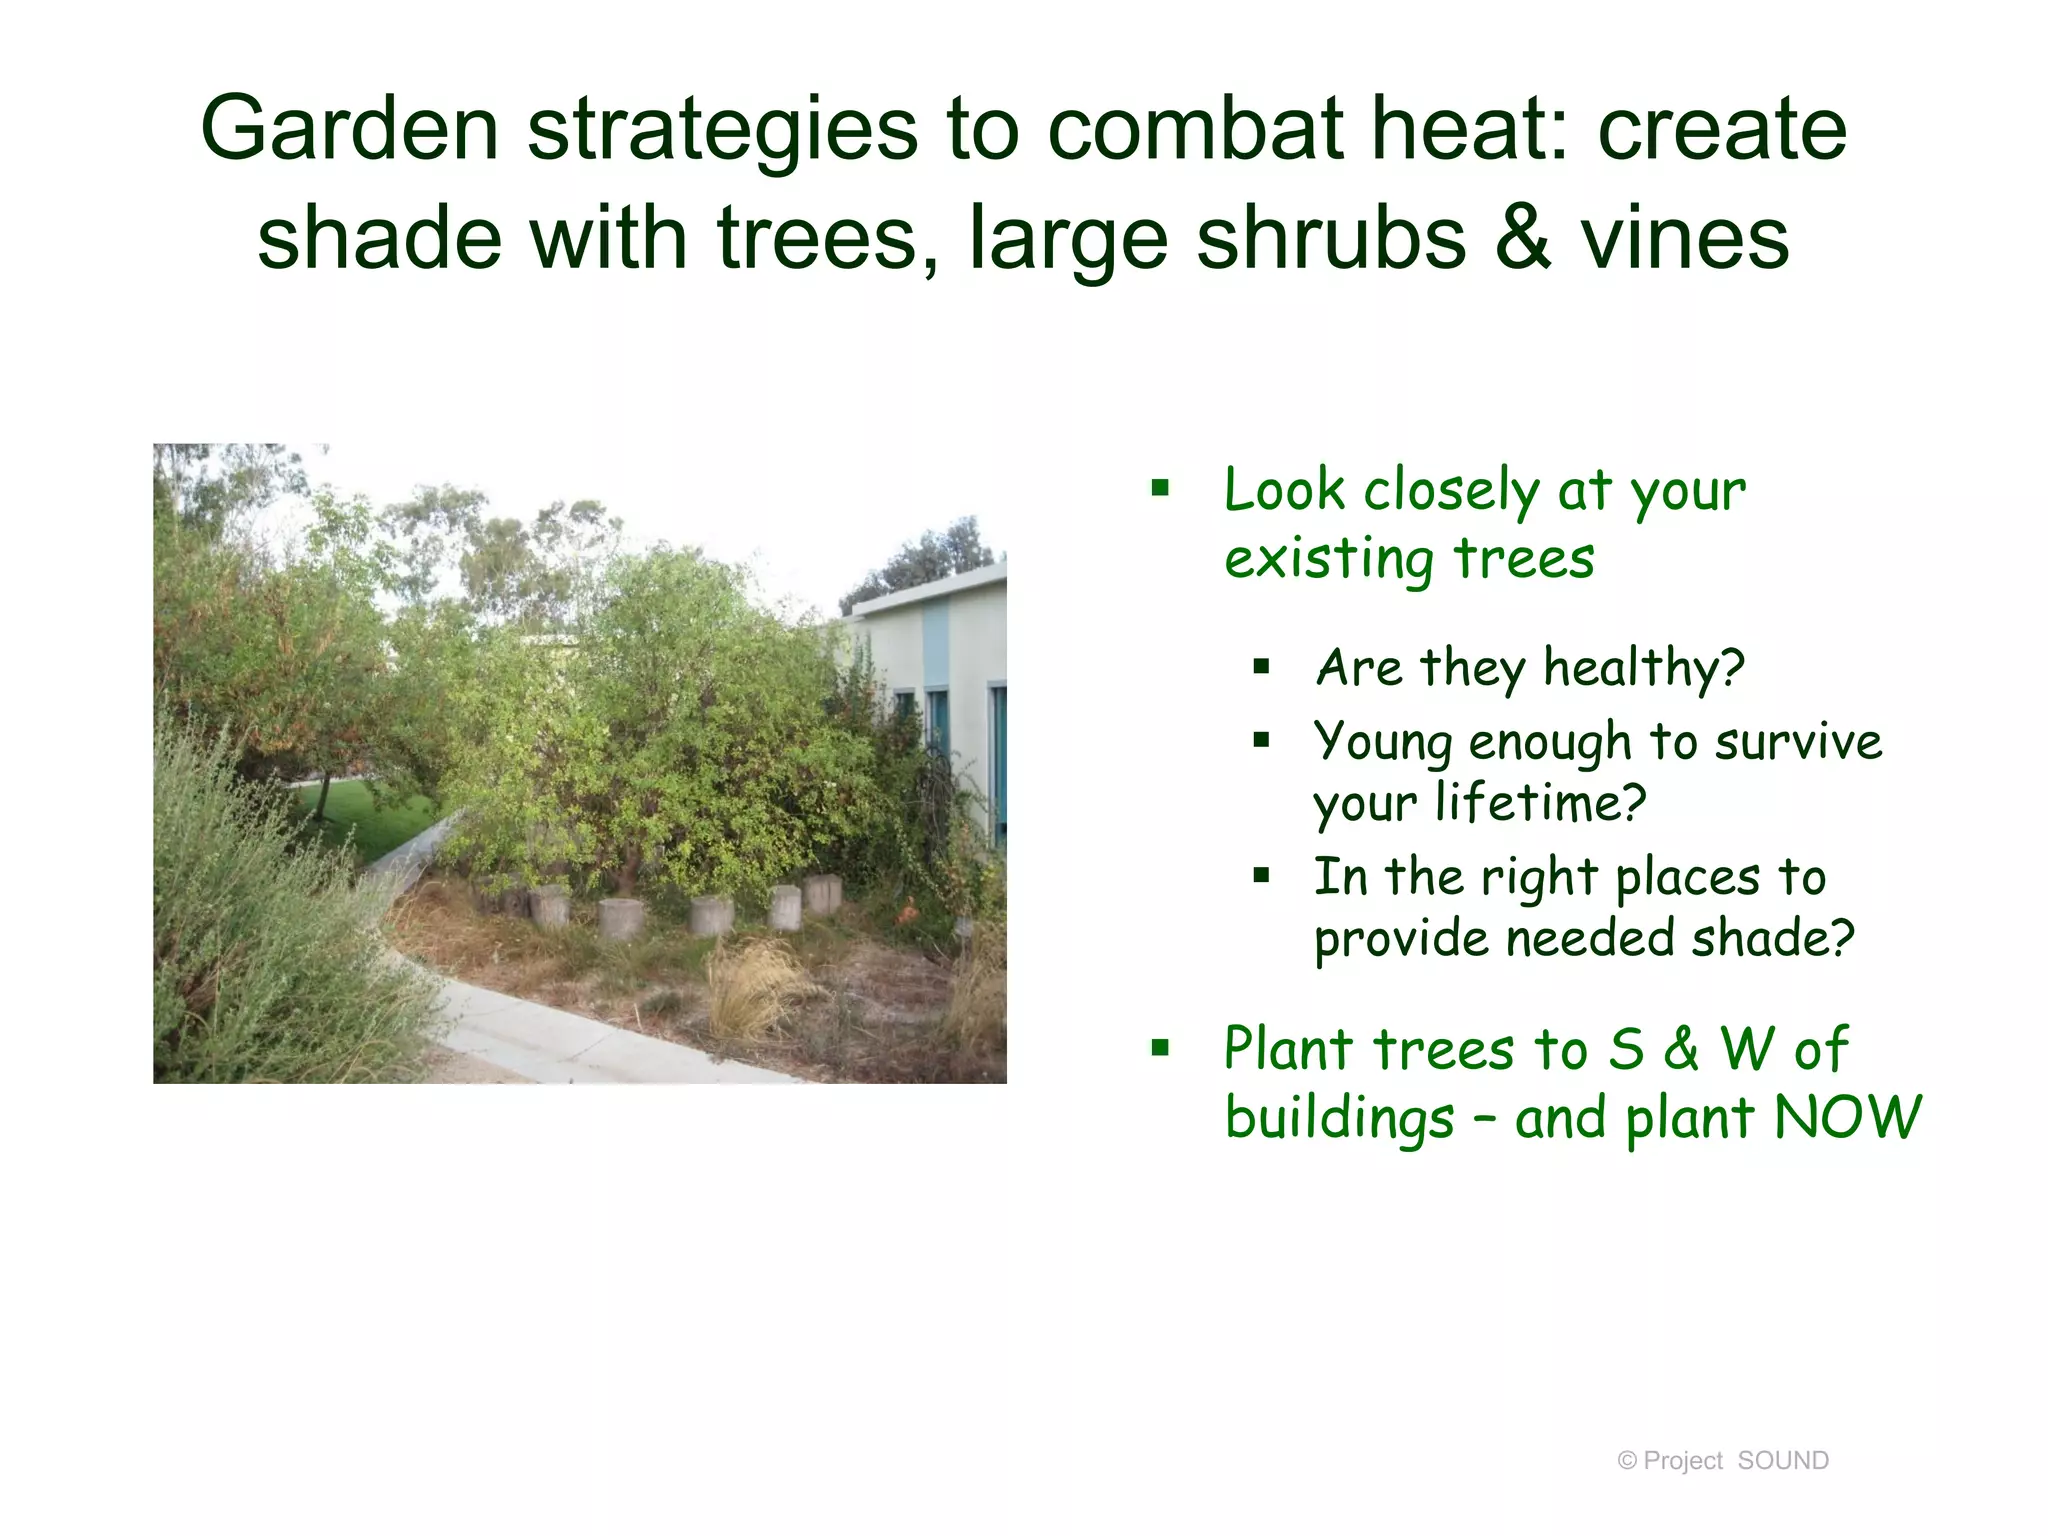
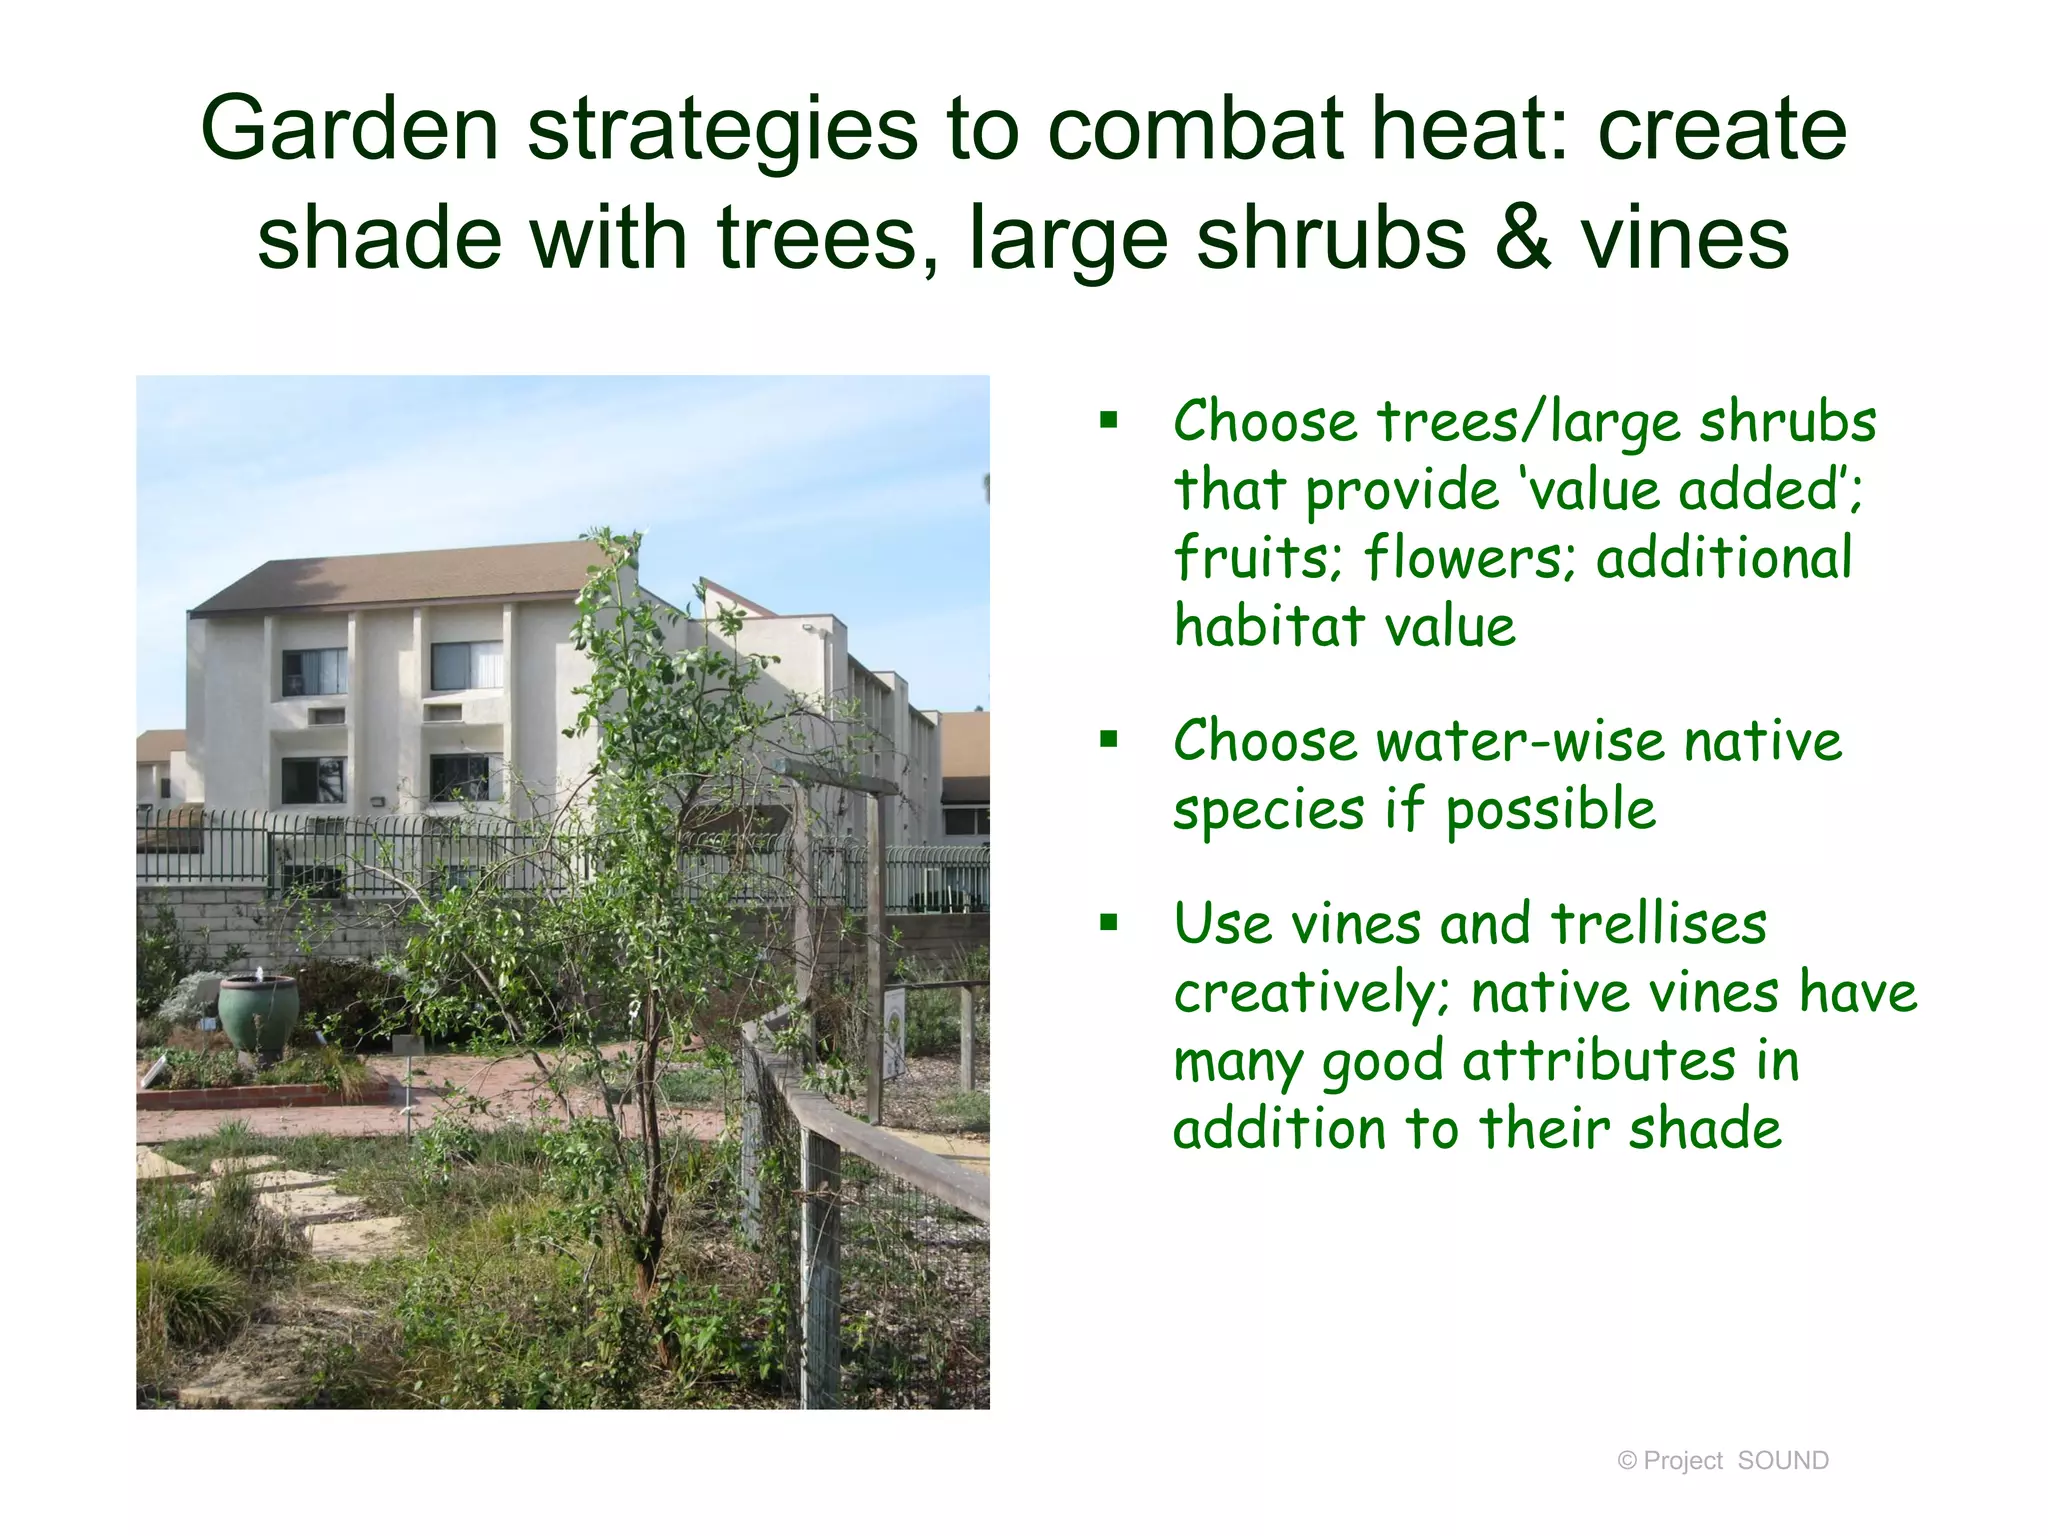
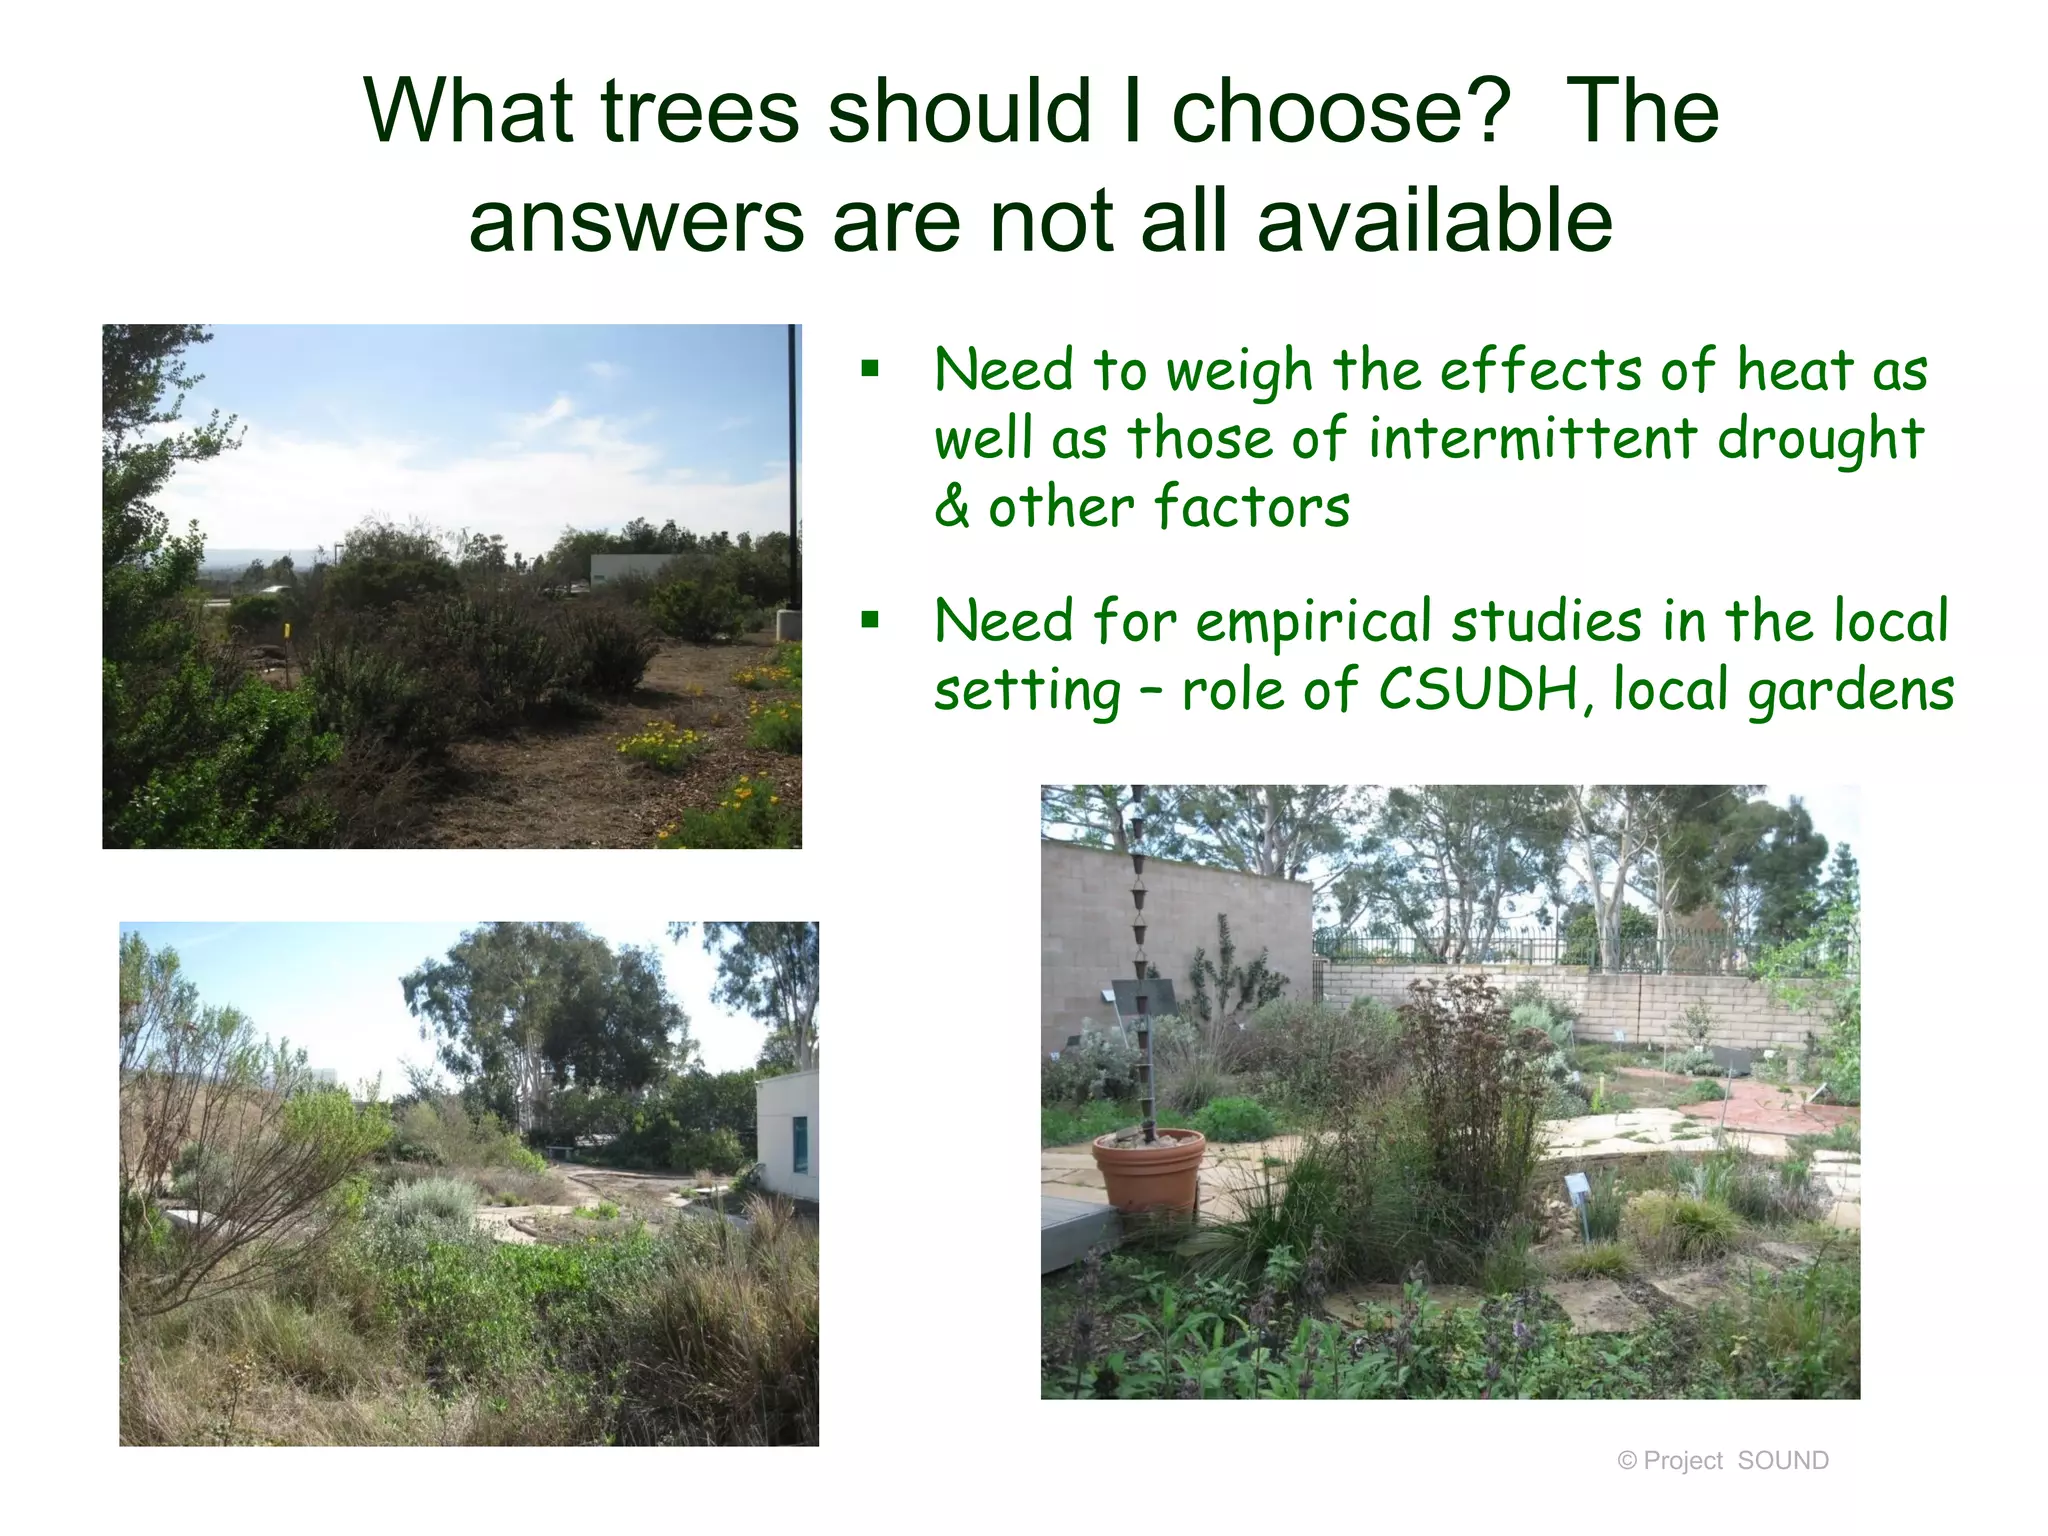
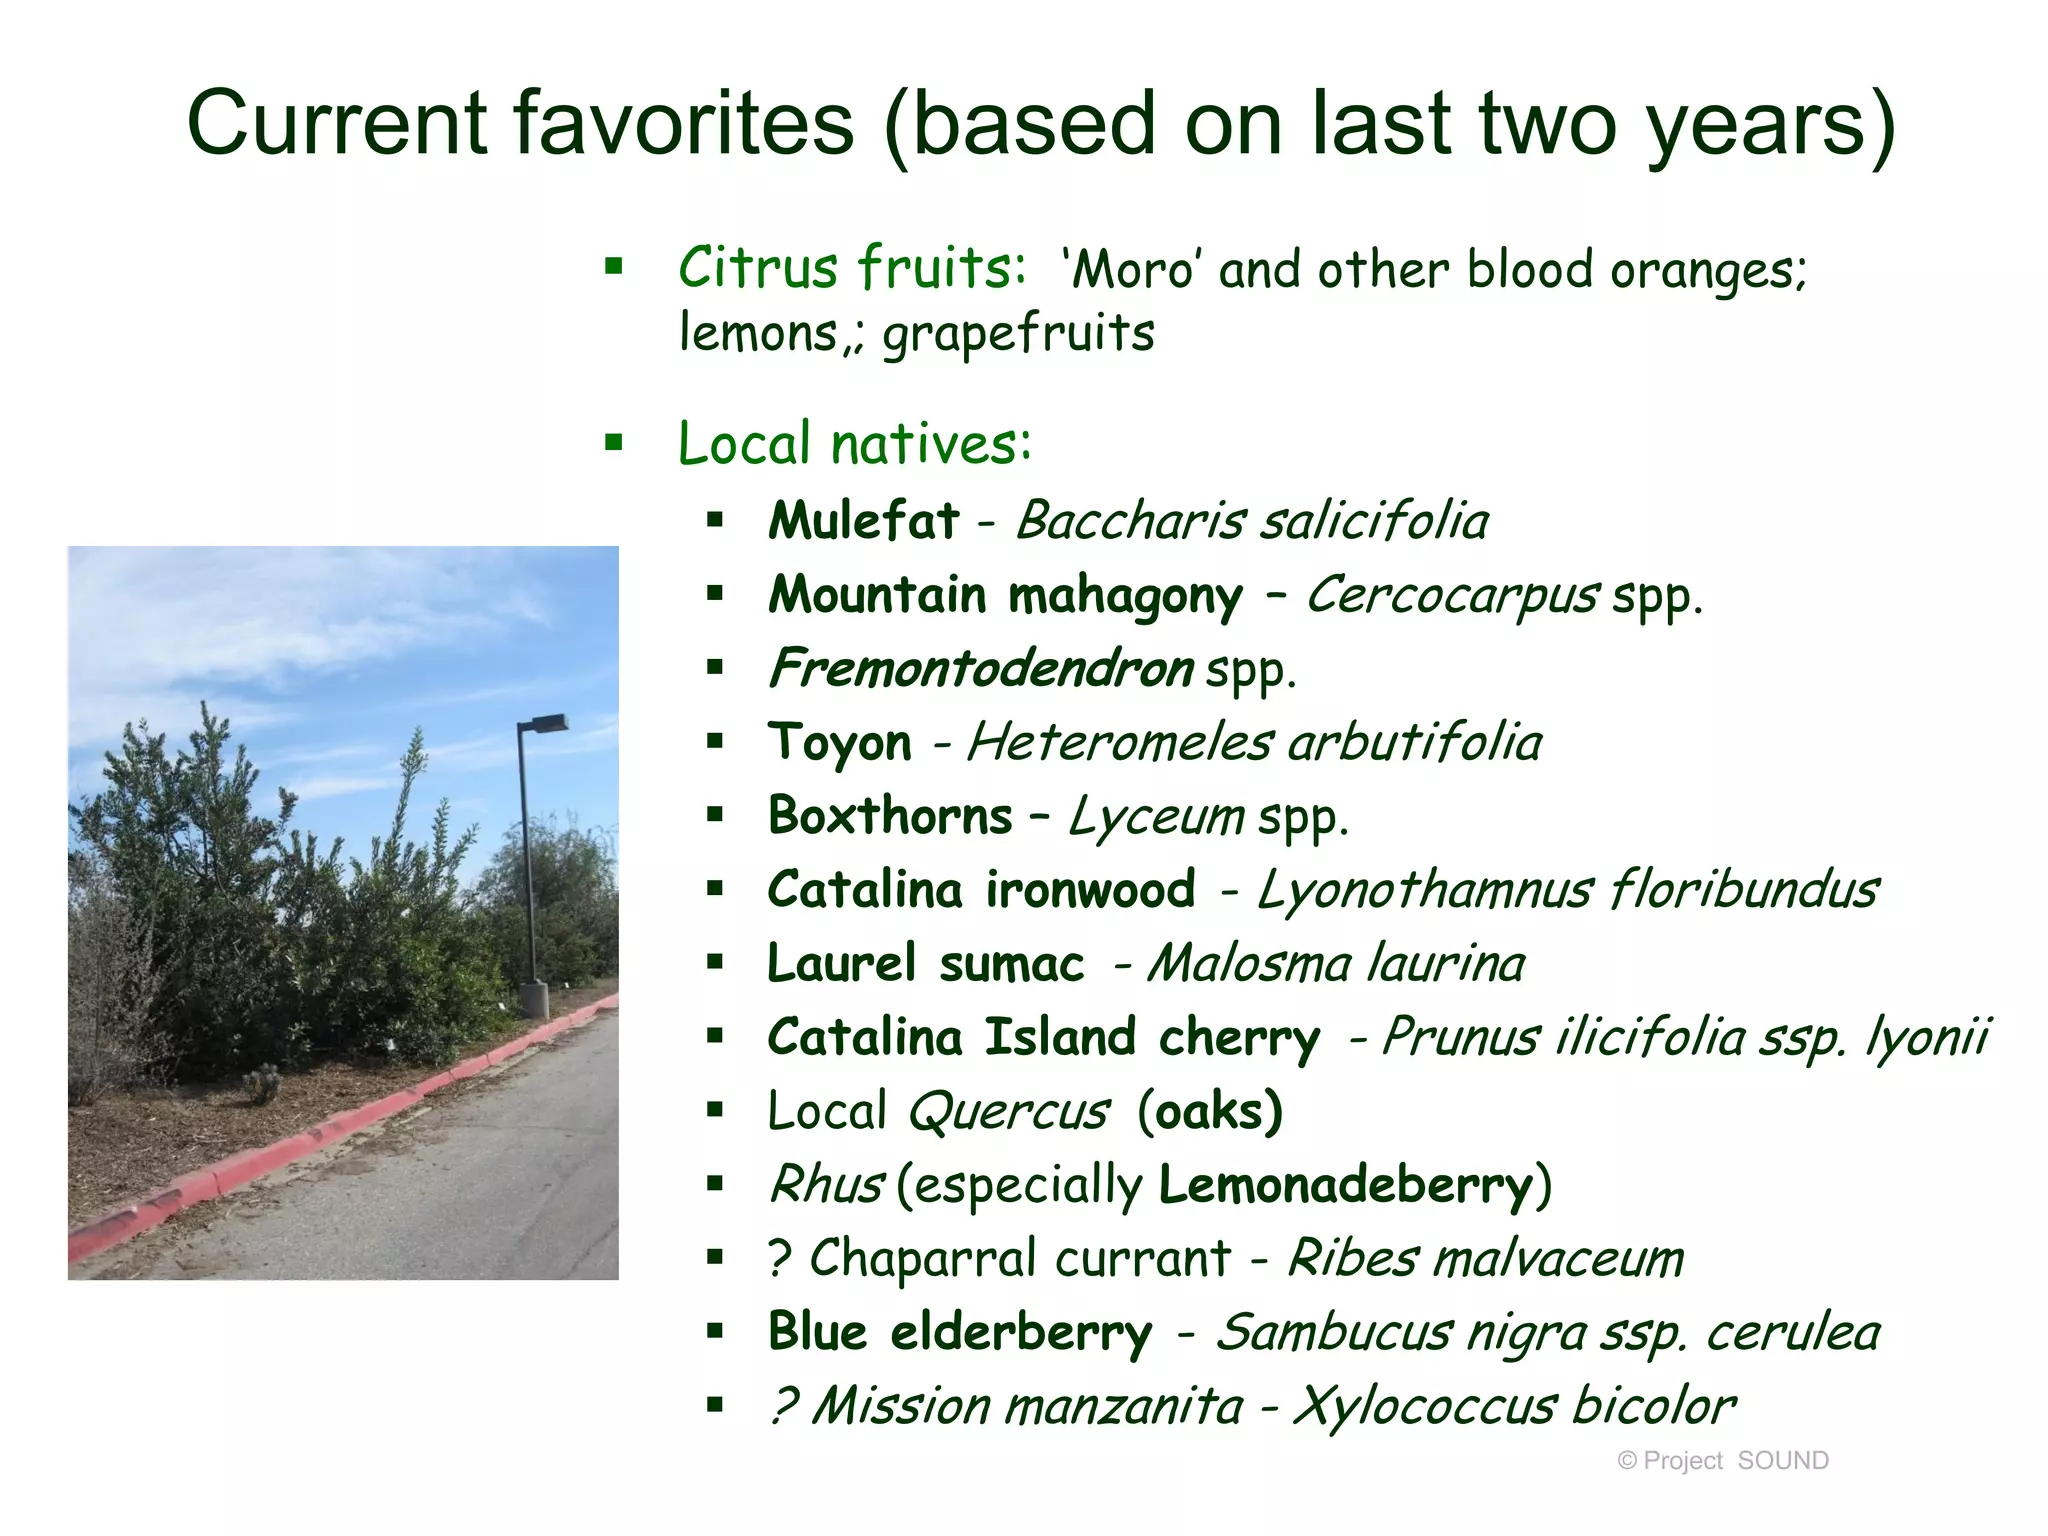
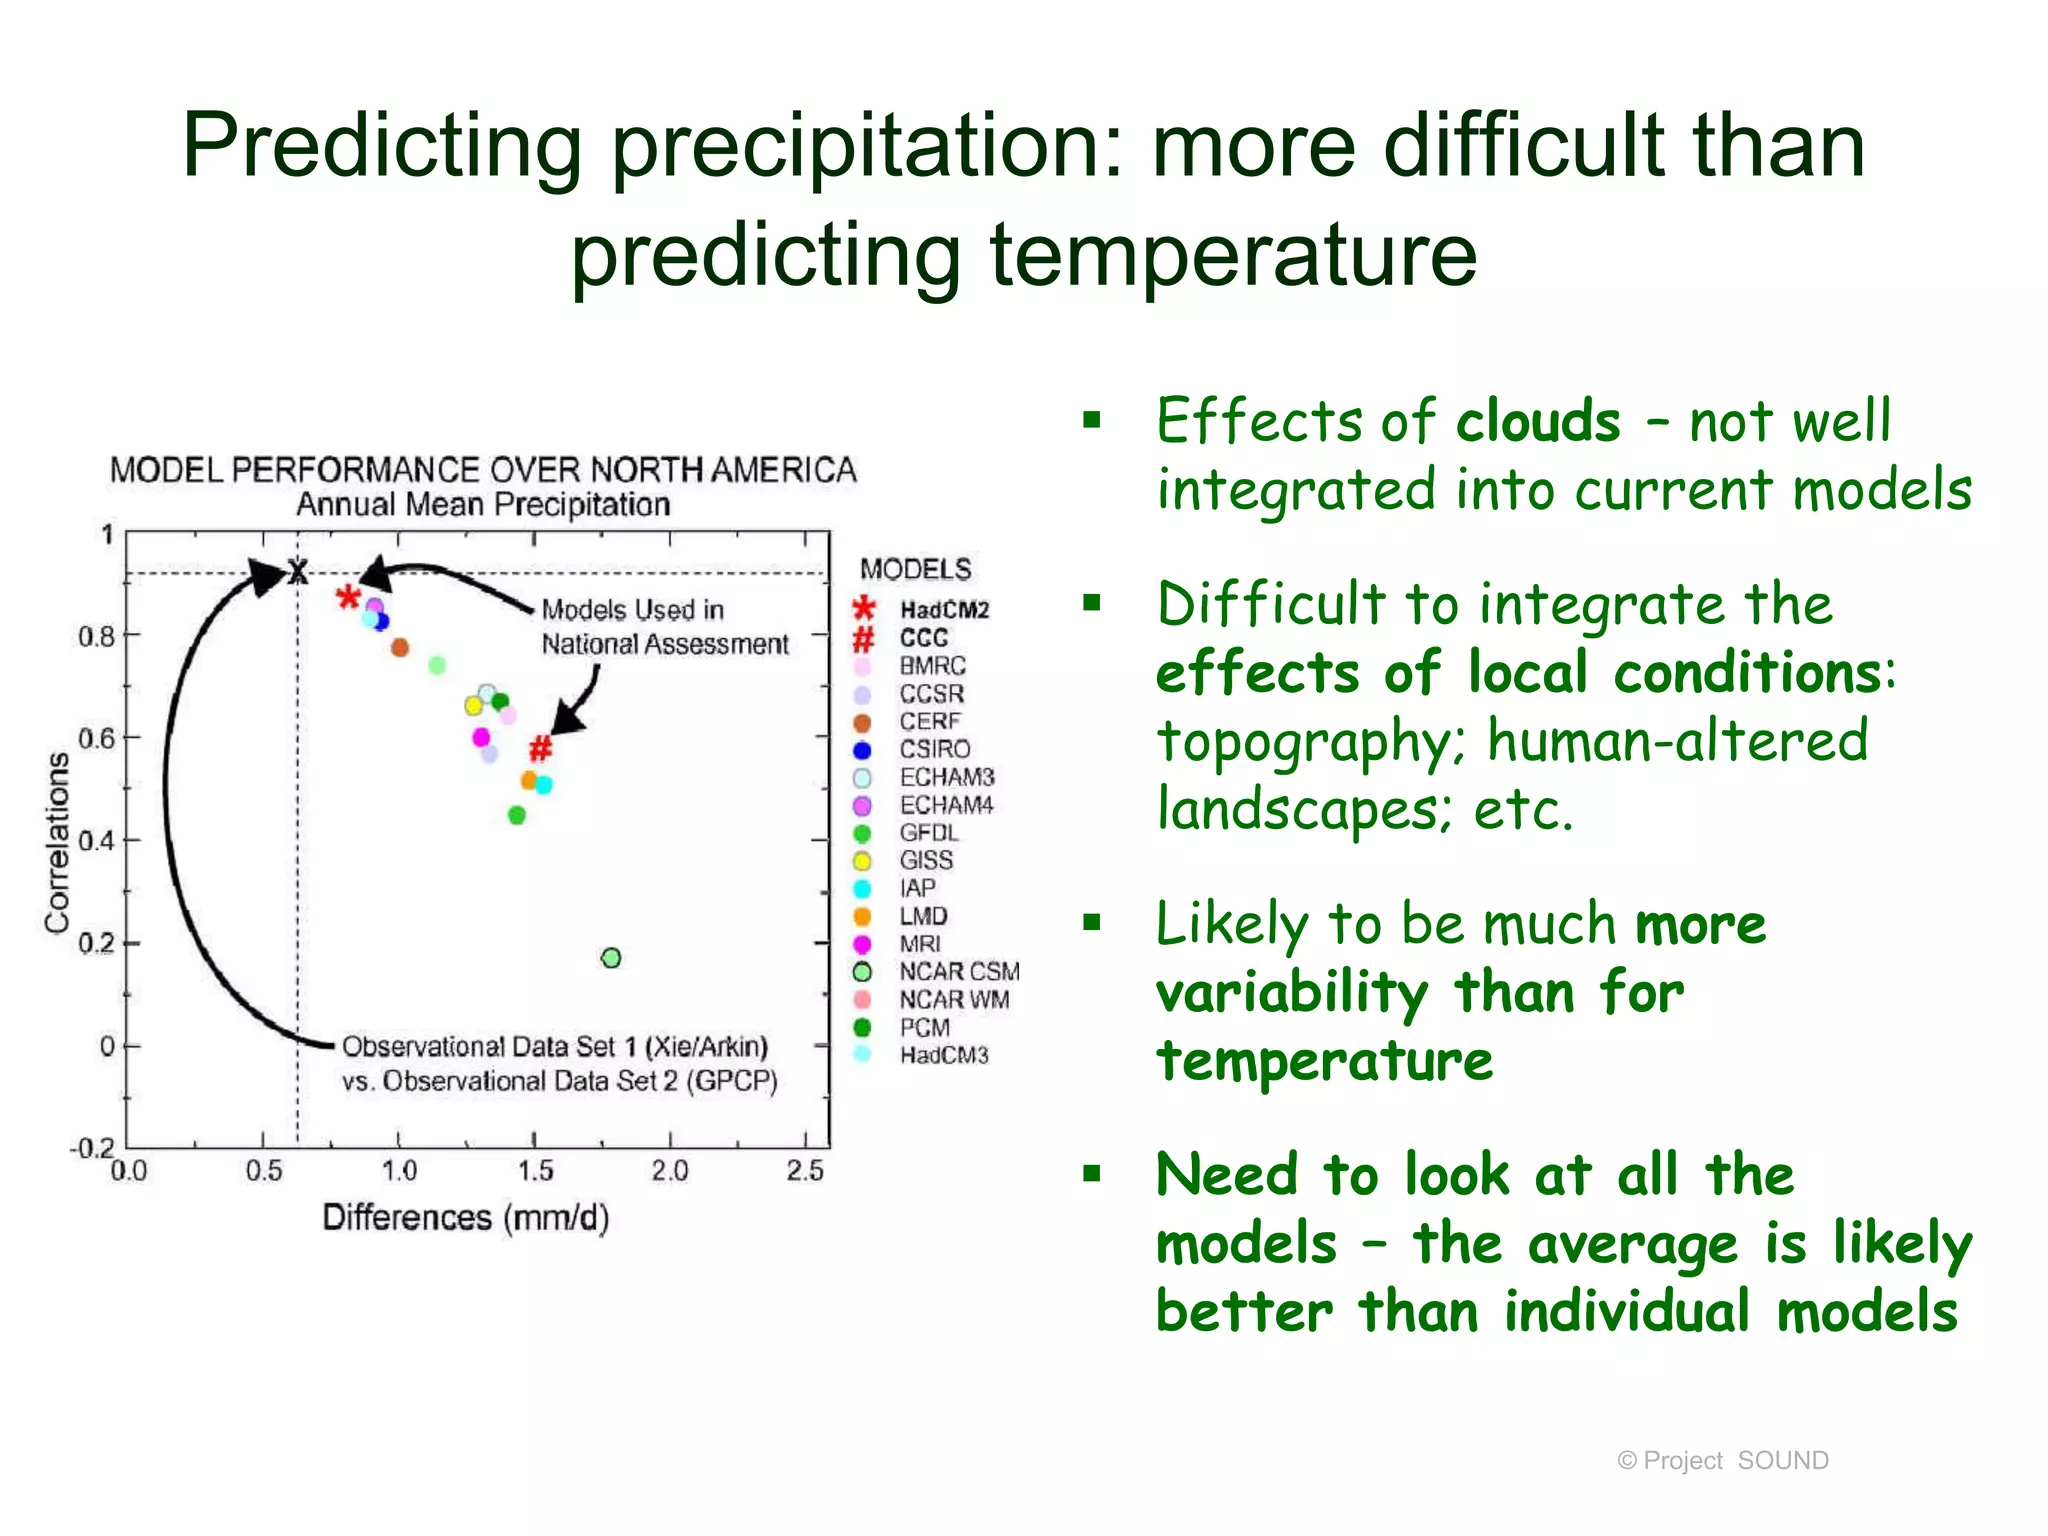
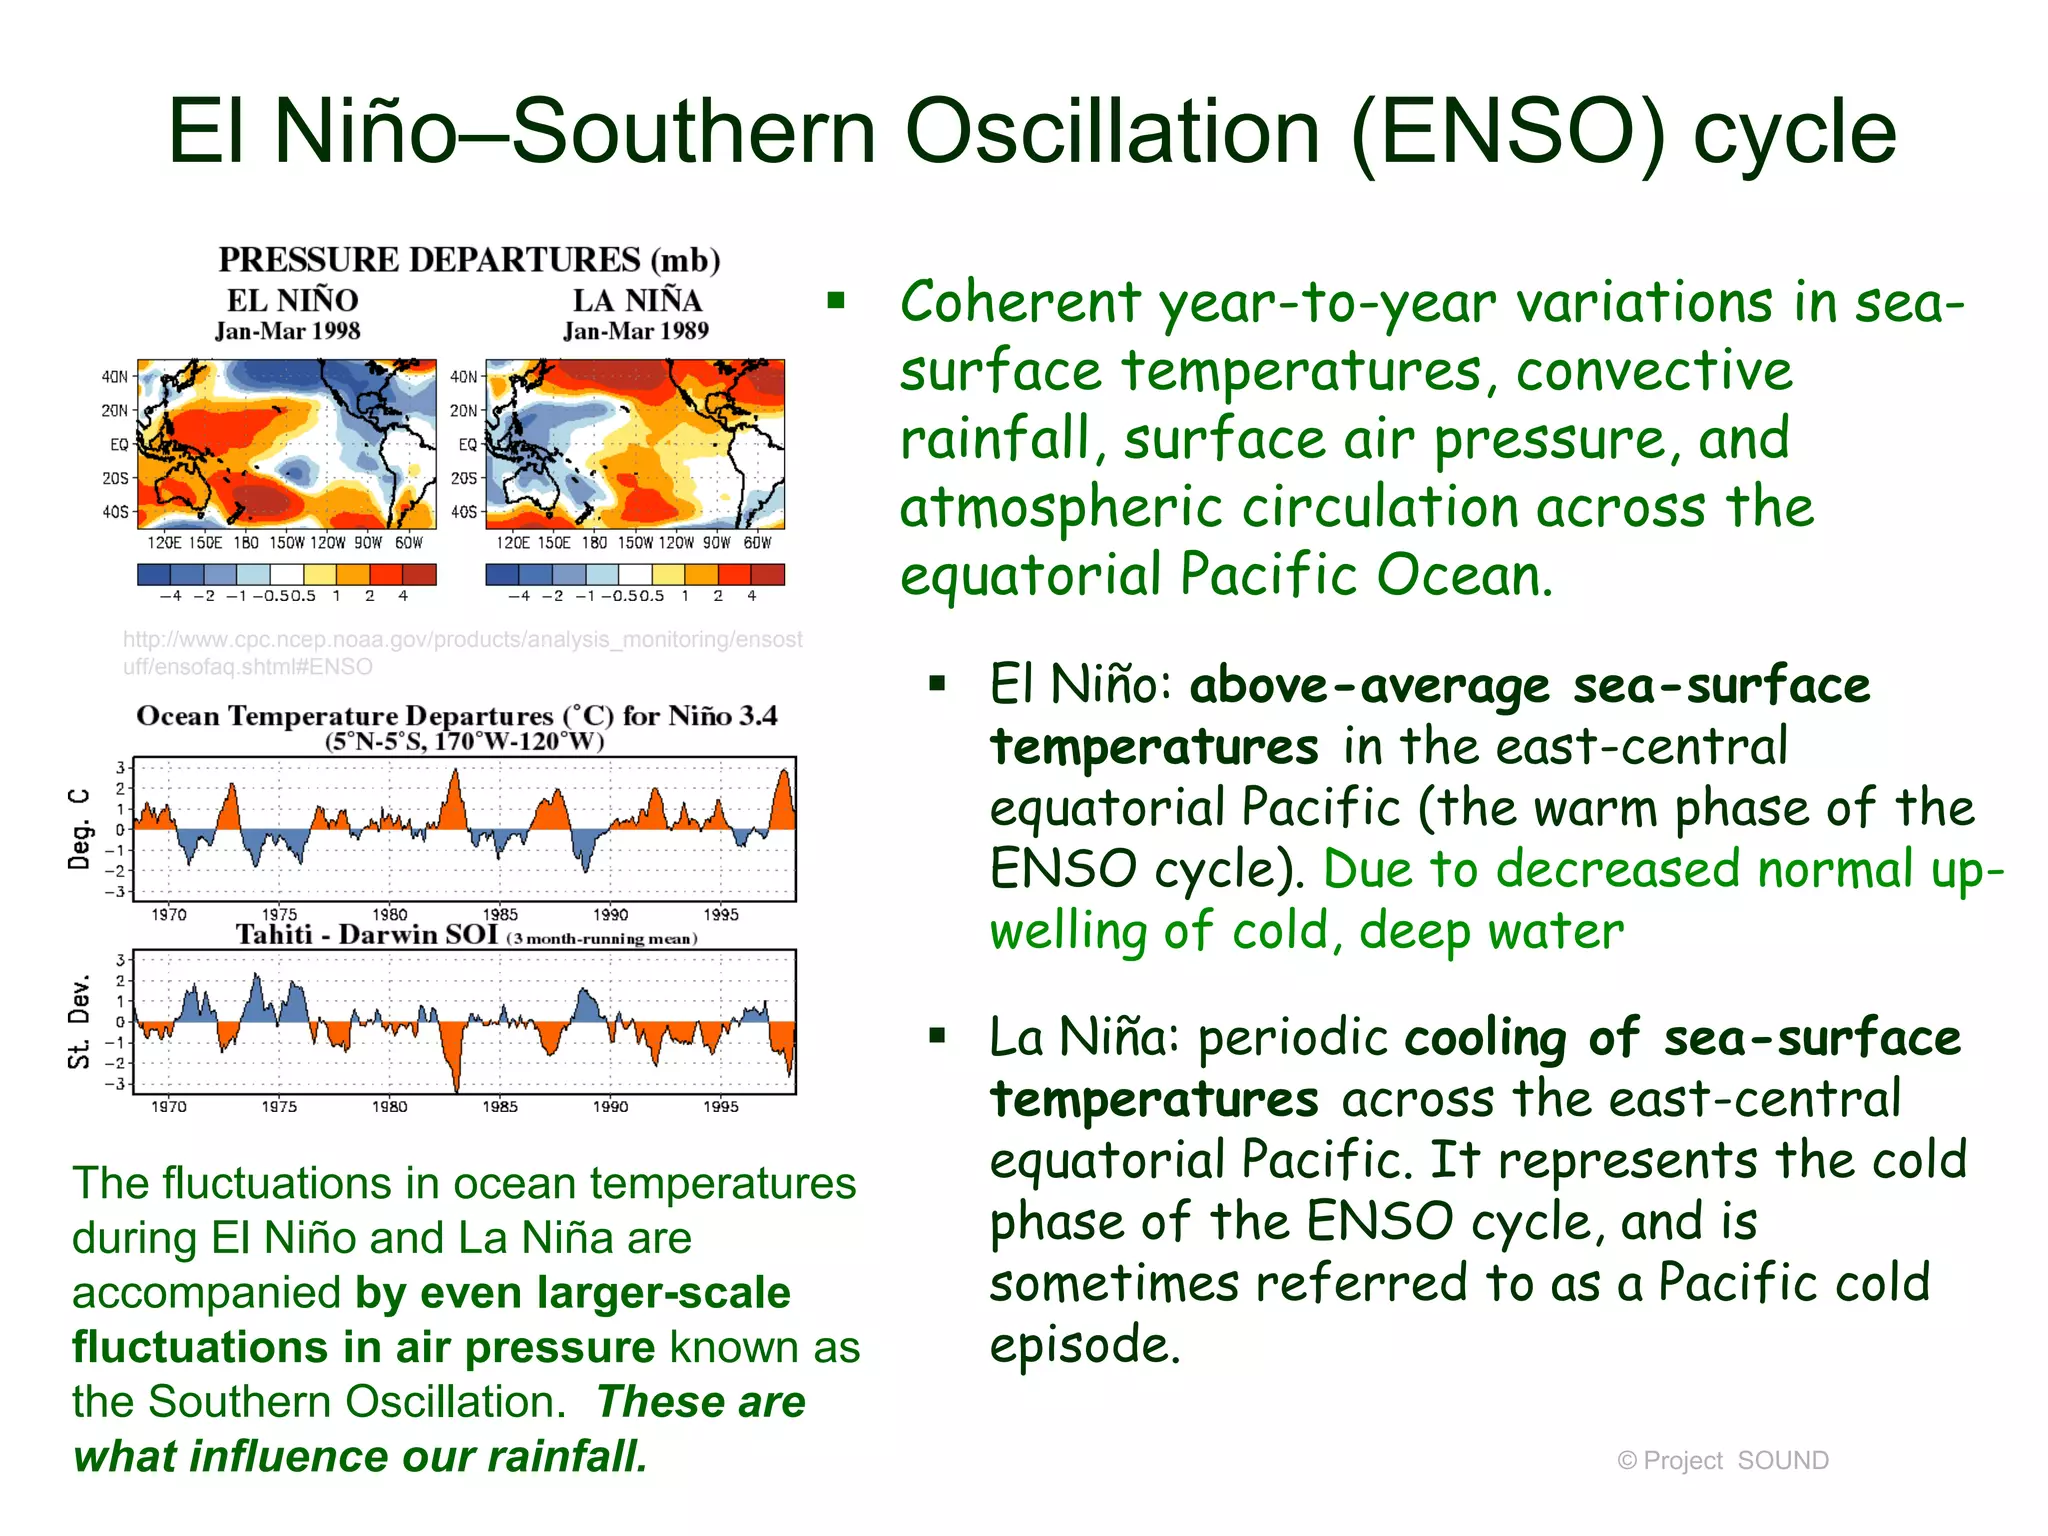
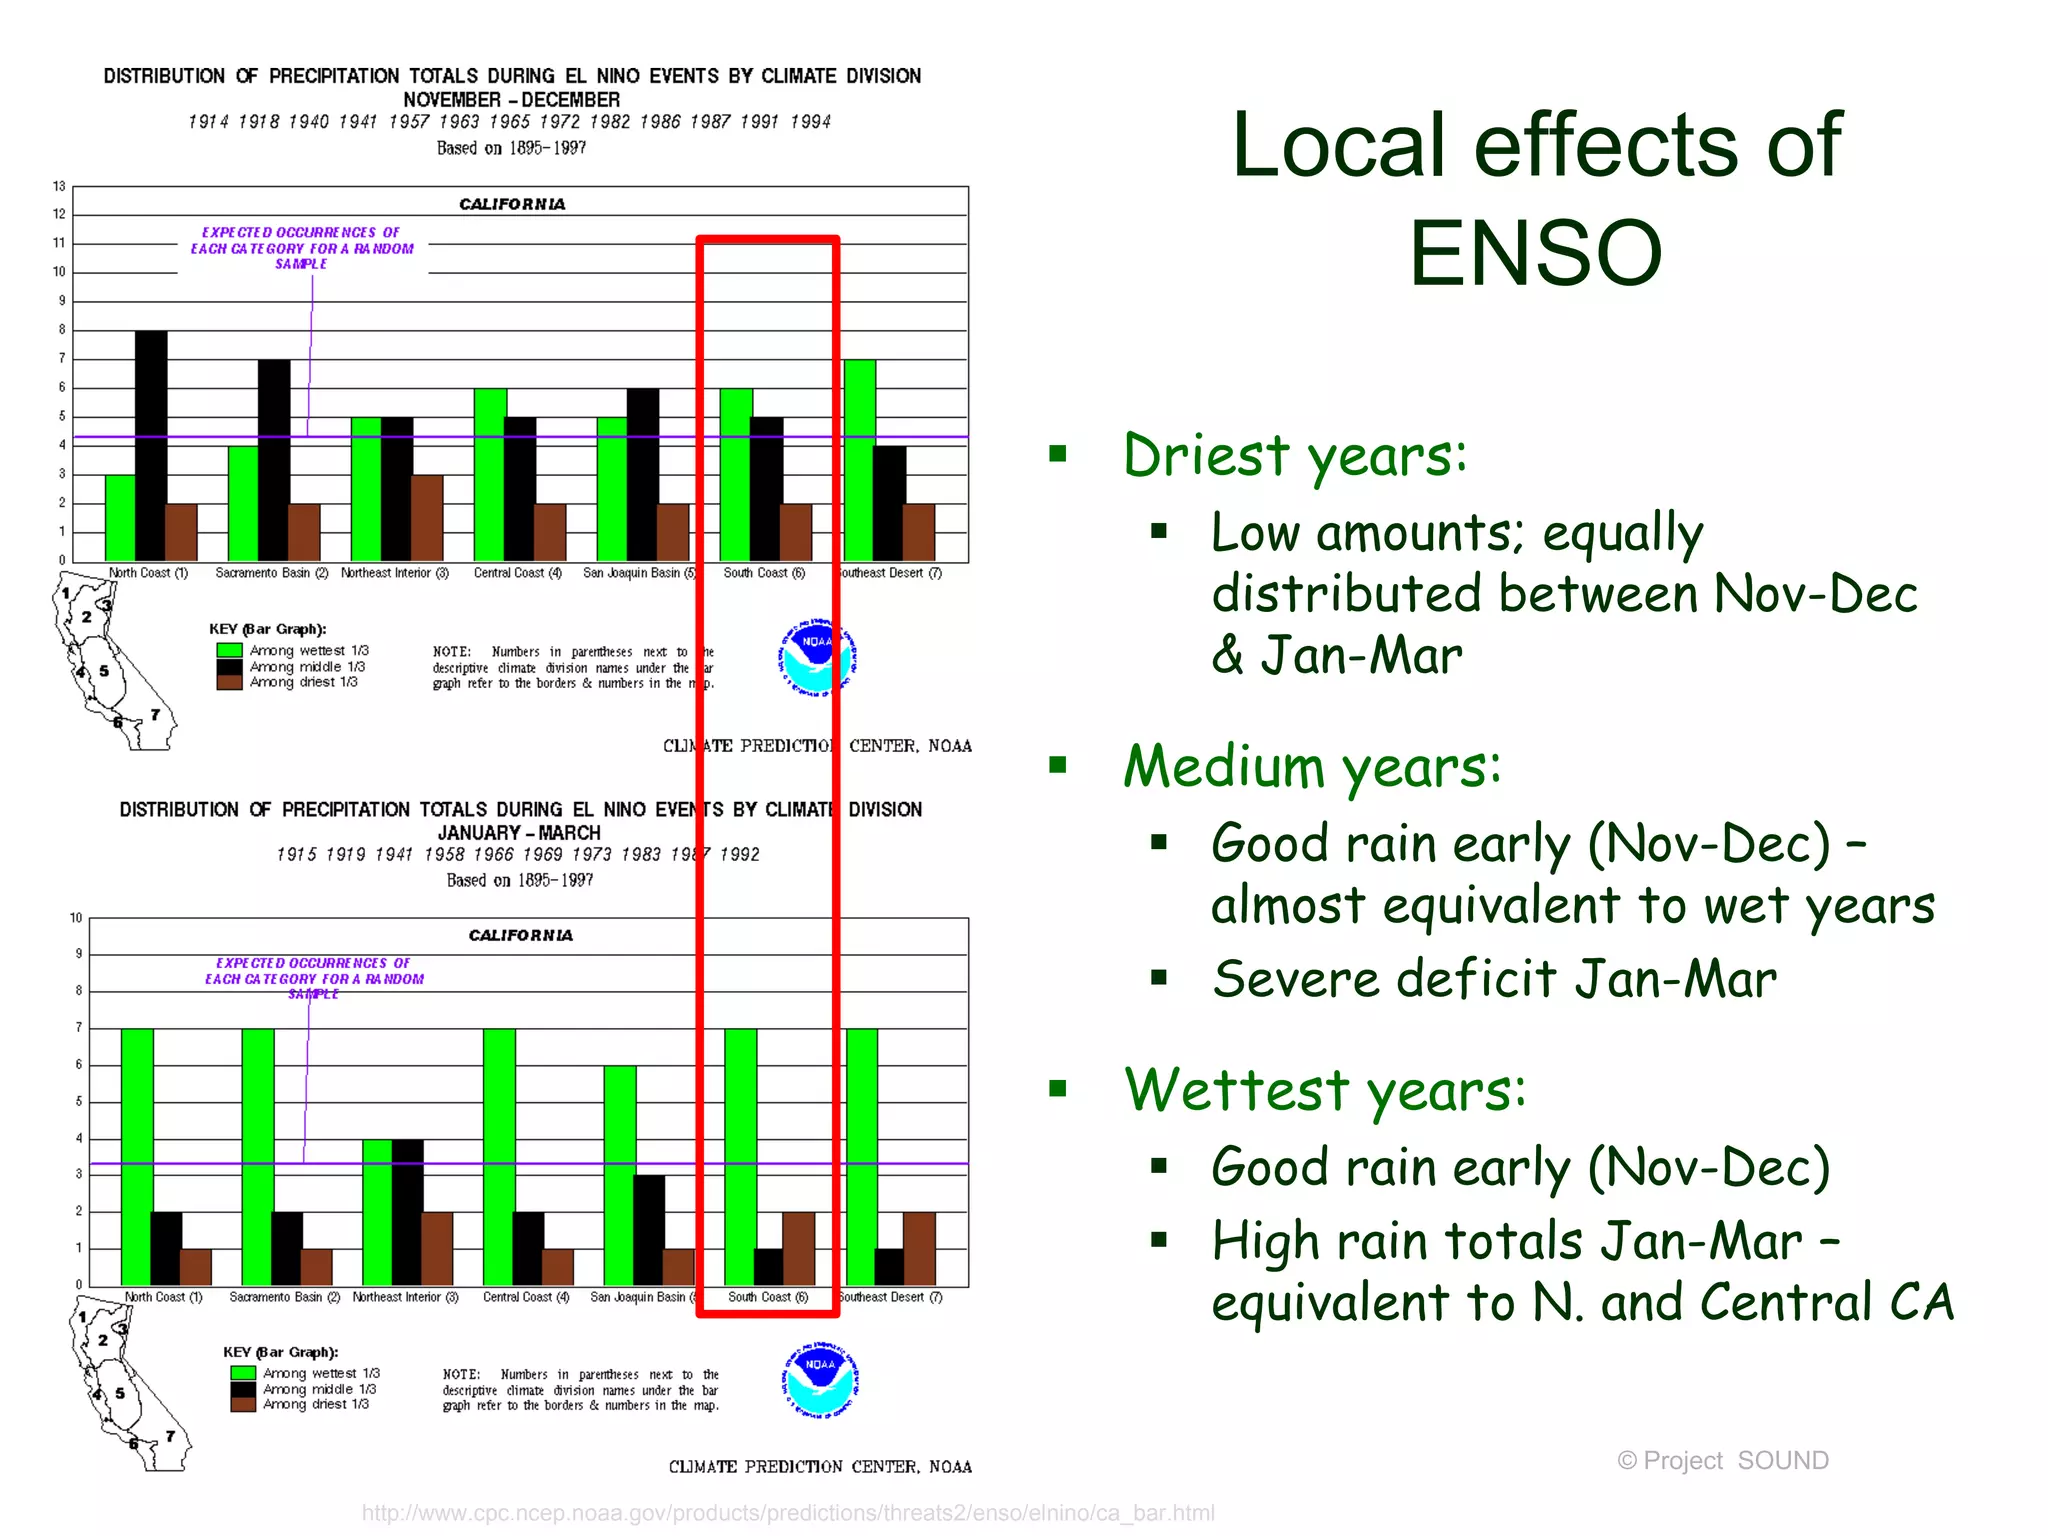
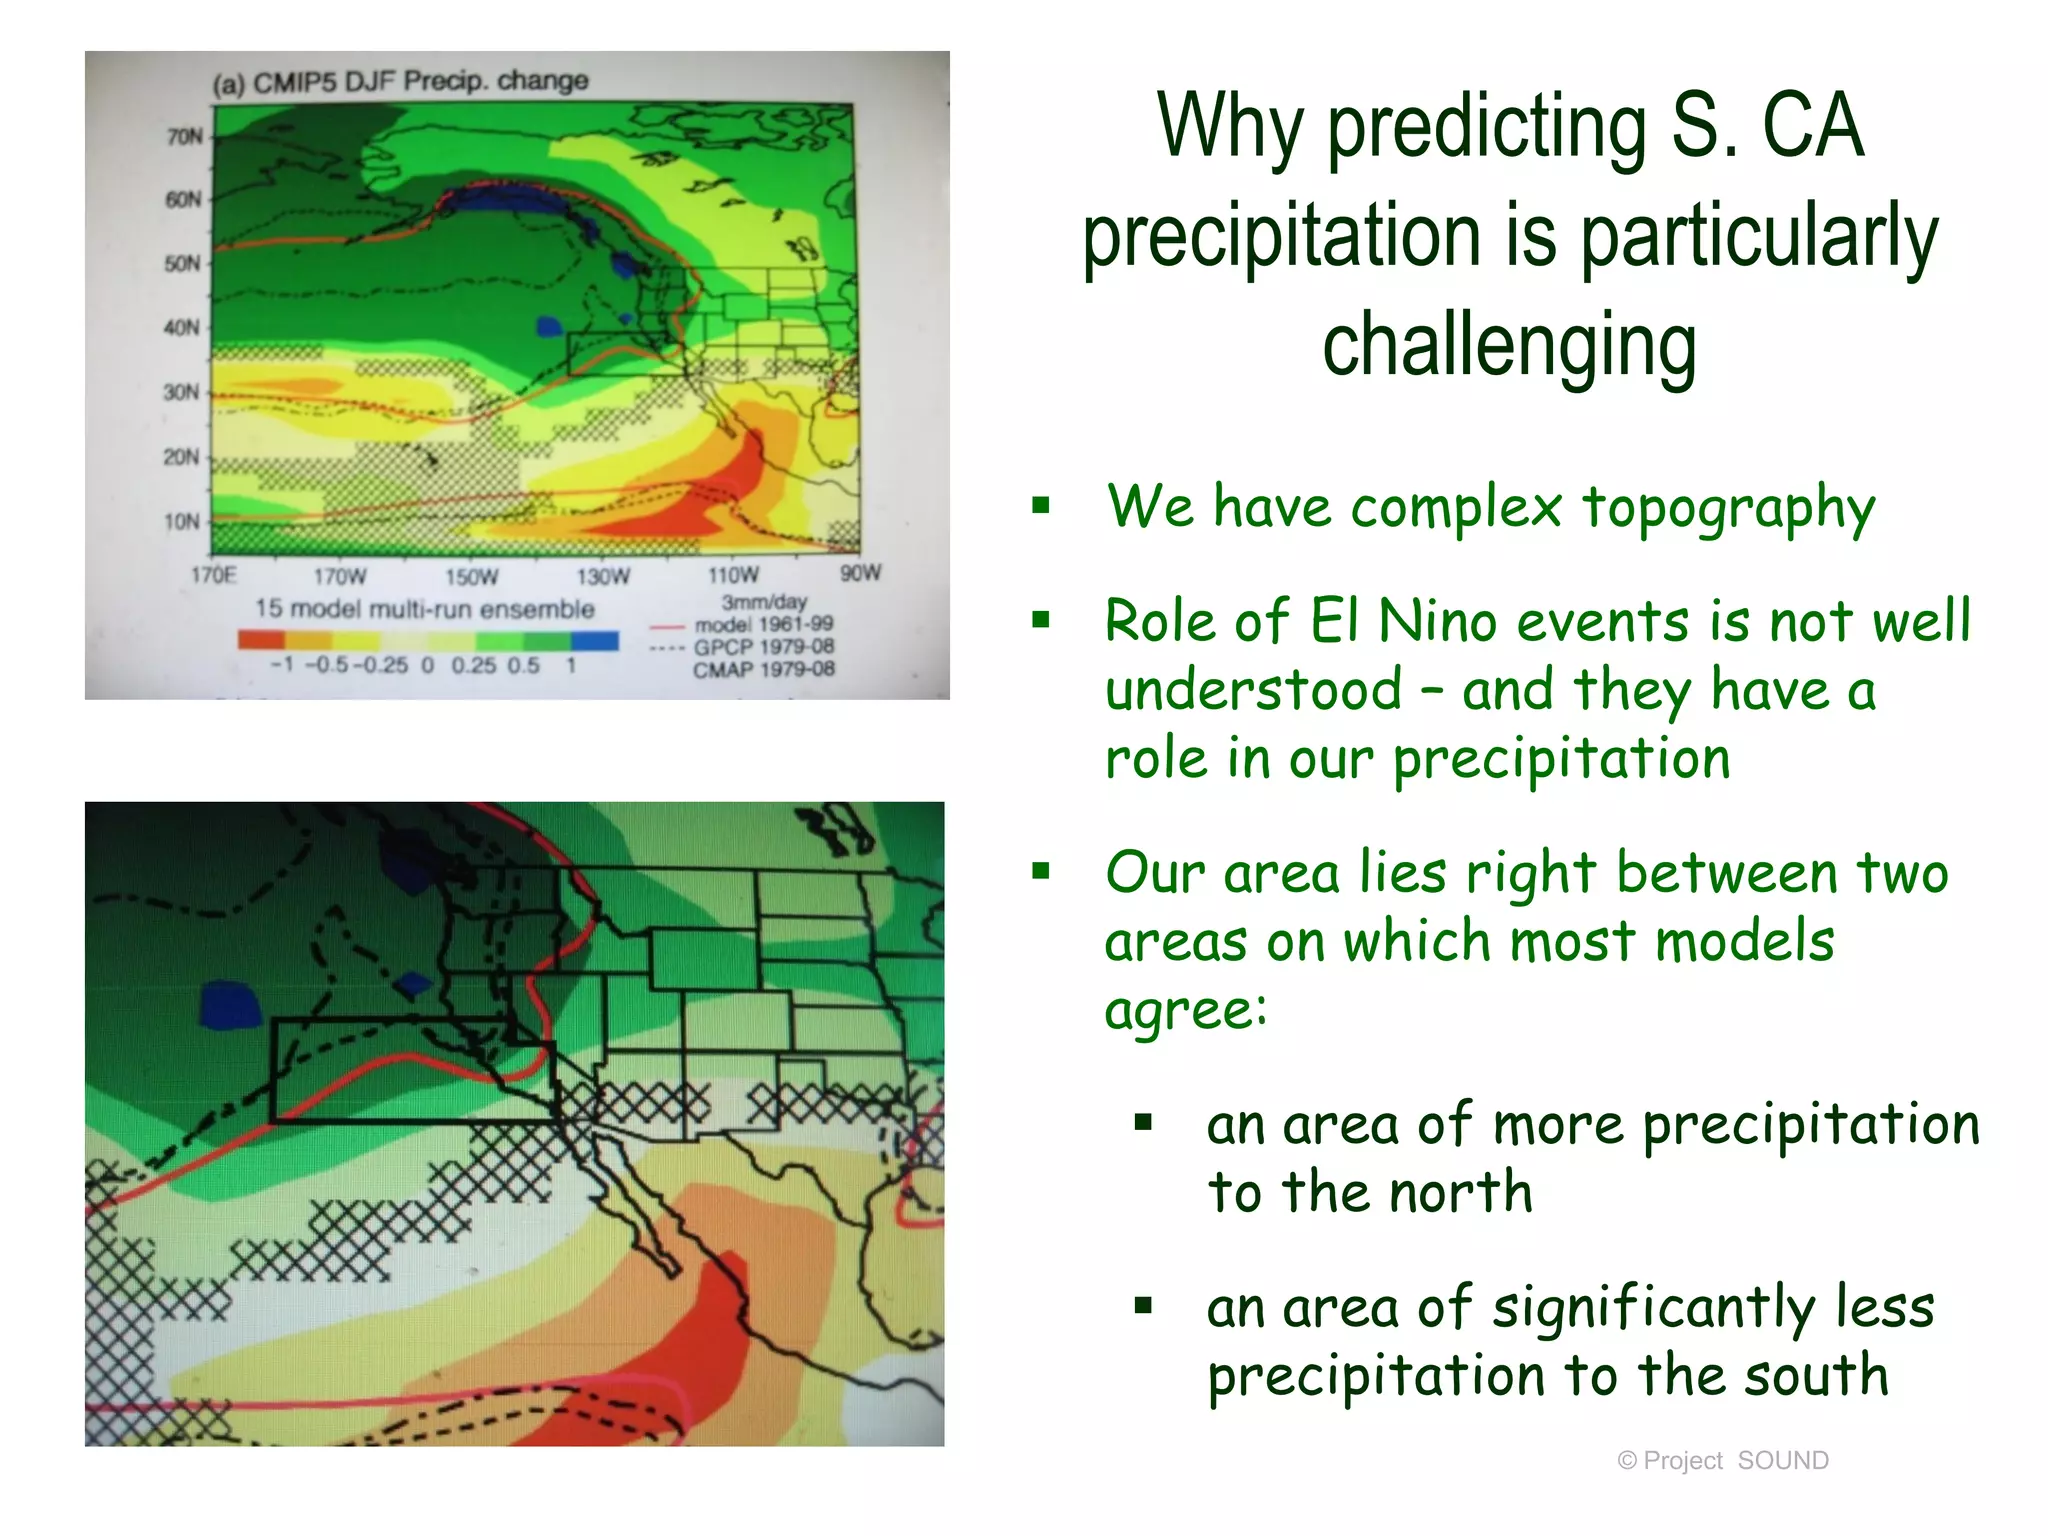
The document discusses gardening with California native plants in the context of climate change, highlighting its impact on local gardens in Western Los Angeles County. It explains the nature of climate and weather, how climate models predict future changes in temperature and precipitation, and the increasing frequency of extreme heat days expected in California. The document also suggests various strategies for homeowners and urban planners to mitigate heat, including creating shade with hardscapes and planting trees, while emphasizing the importance of trees for cooling, air quality, and overall human well-being.
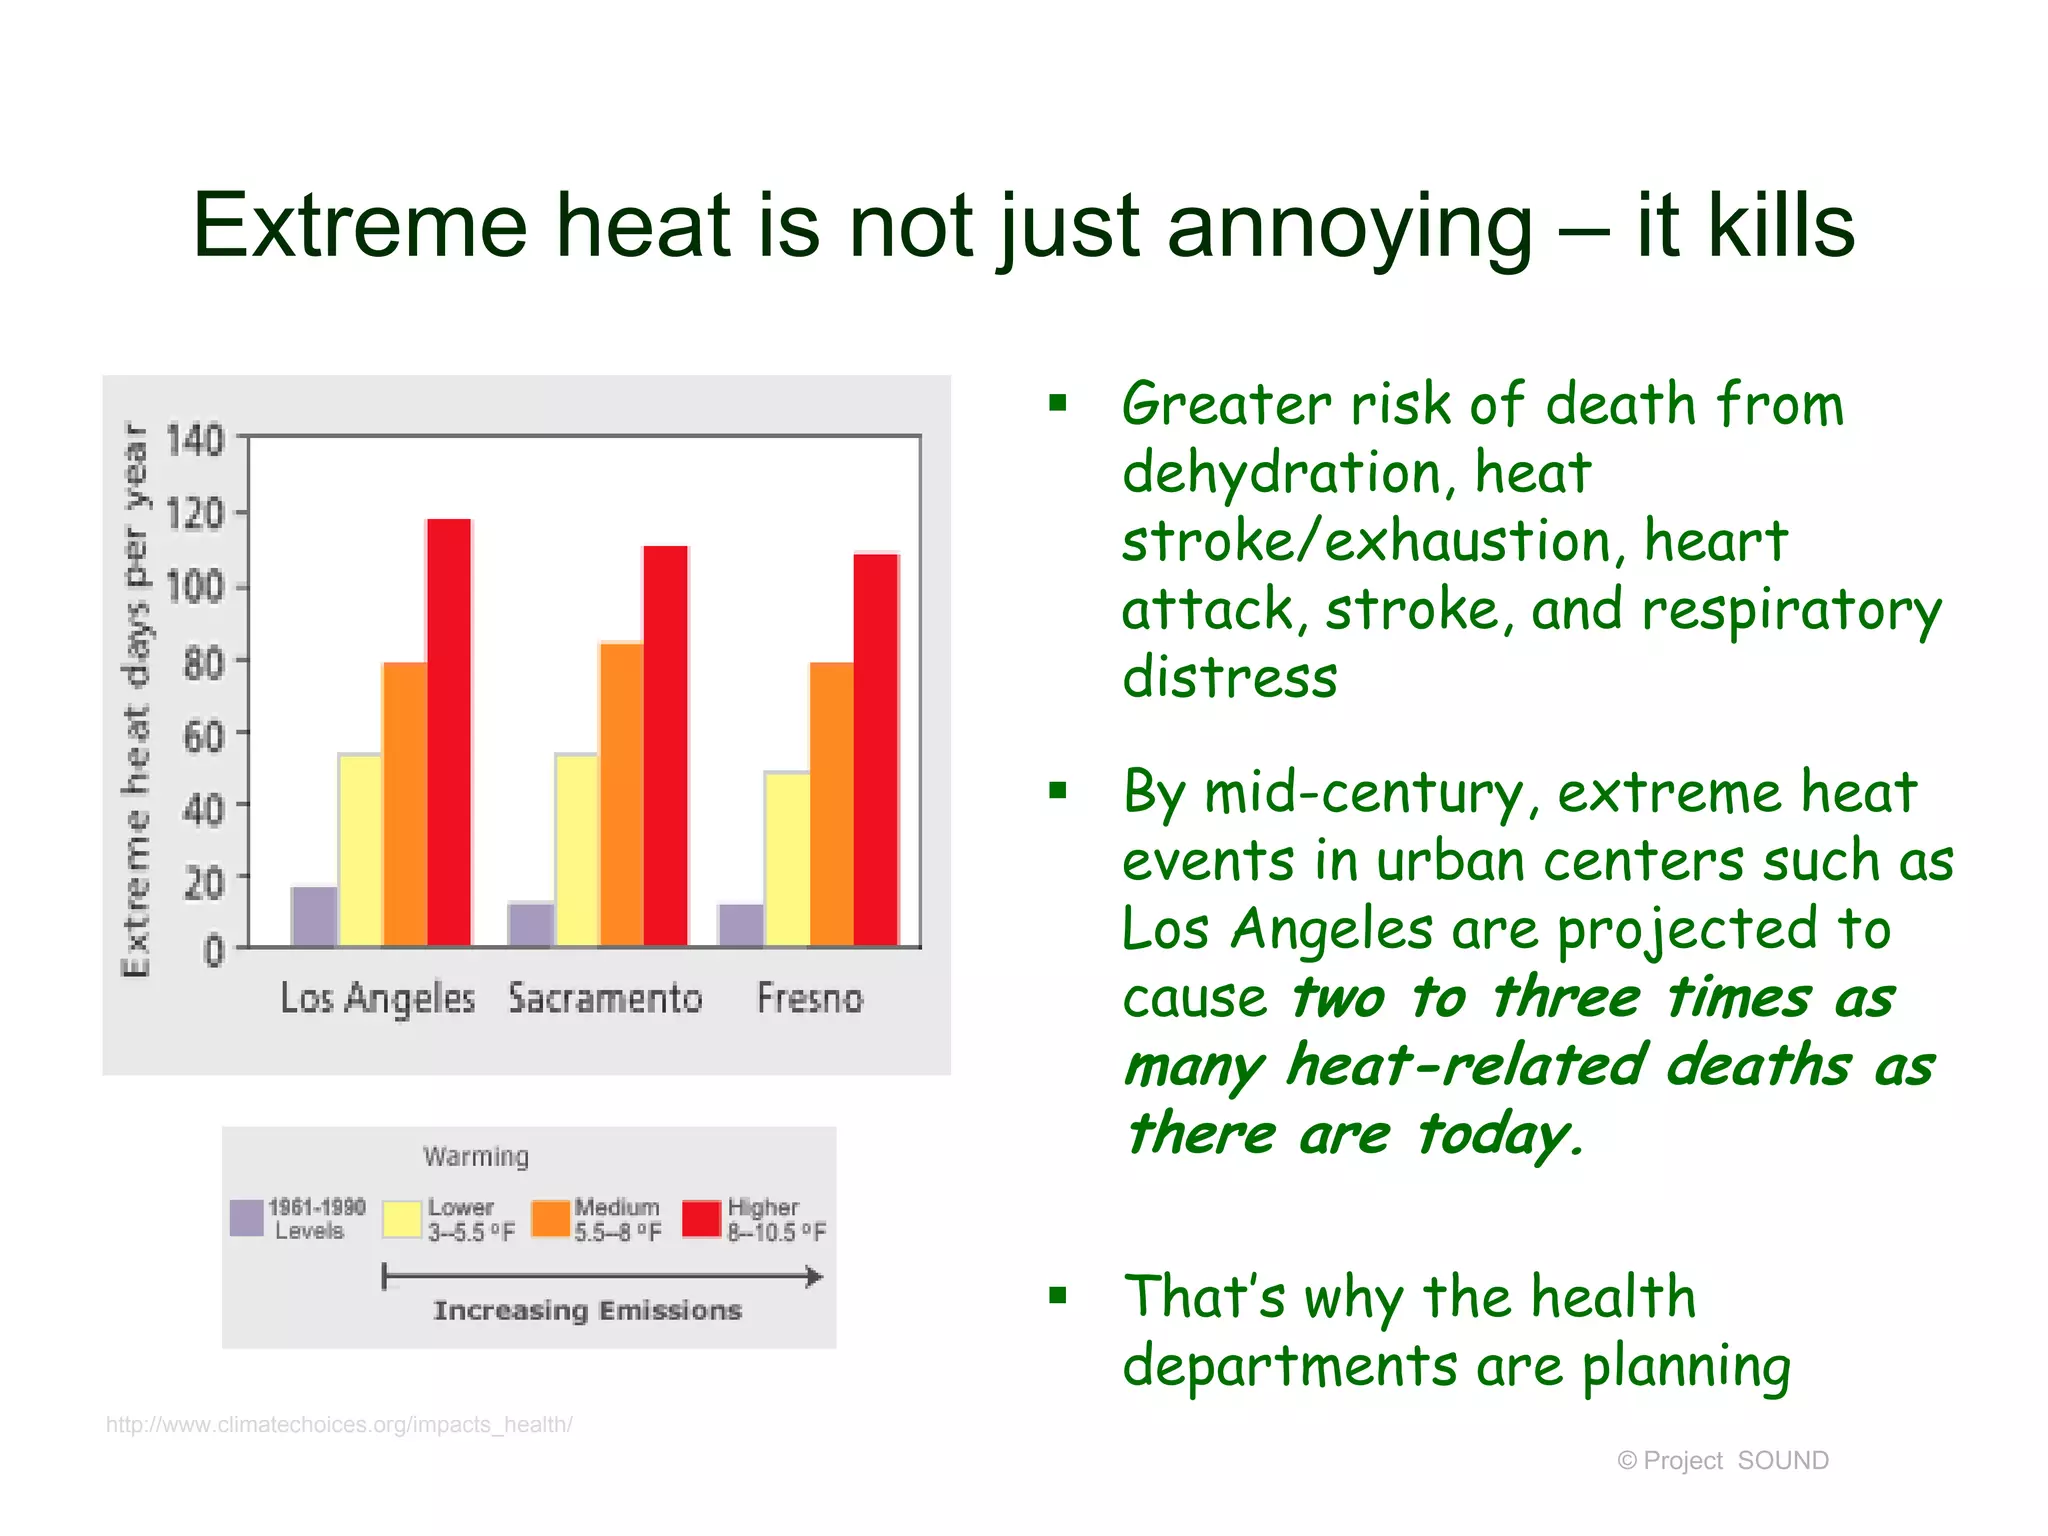
![More ‘extreme heat’ (> 95° F)
days in the future
Cal-Adapt projects that urban and rural
population centers throughout California
will experience:
An average of 40 to 53 extreme heat
days by 2050 [LA = 78]
An average of 40 to 99 days [LA = 110]
by 2099
This compares to a historical average of 4
per year (average throughout the state).
The number of “extreme heat” days is
projected to triple in downtown Los
Angeles, and quadruple in the San
Fernando and San Gabriel valleys
http://www.epa.gov/climatechange/impacts-adaptation/health.html
© Project SOUND](https://image.slidesharecdn.com/climatechange-2014-140302064306-phpapp01/75/Climate-change-2014-22-2048.jpg)
![Decreasing hours of chill: bad for agriculture
DECREASING CHILL HOURS,
2070-2099
Probably won’t have as much
effect on local gardens;
most local native plants will
not be affected
May affect those of us that
grow ‘low chill’ fruits in
home gardens [Anna apple;
Fuji apple; Black Mission fig;
Santa Rosa plum]
© Project SOUND](https://image.slidesharecdn.com/climatechange-2014-140302064306-phpapp01/75/Climate-change-2014-49-2048.jpg)

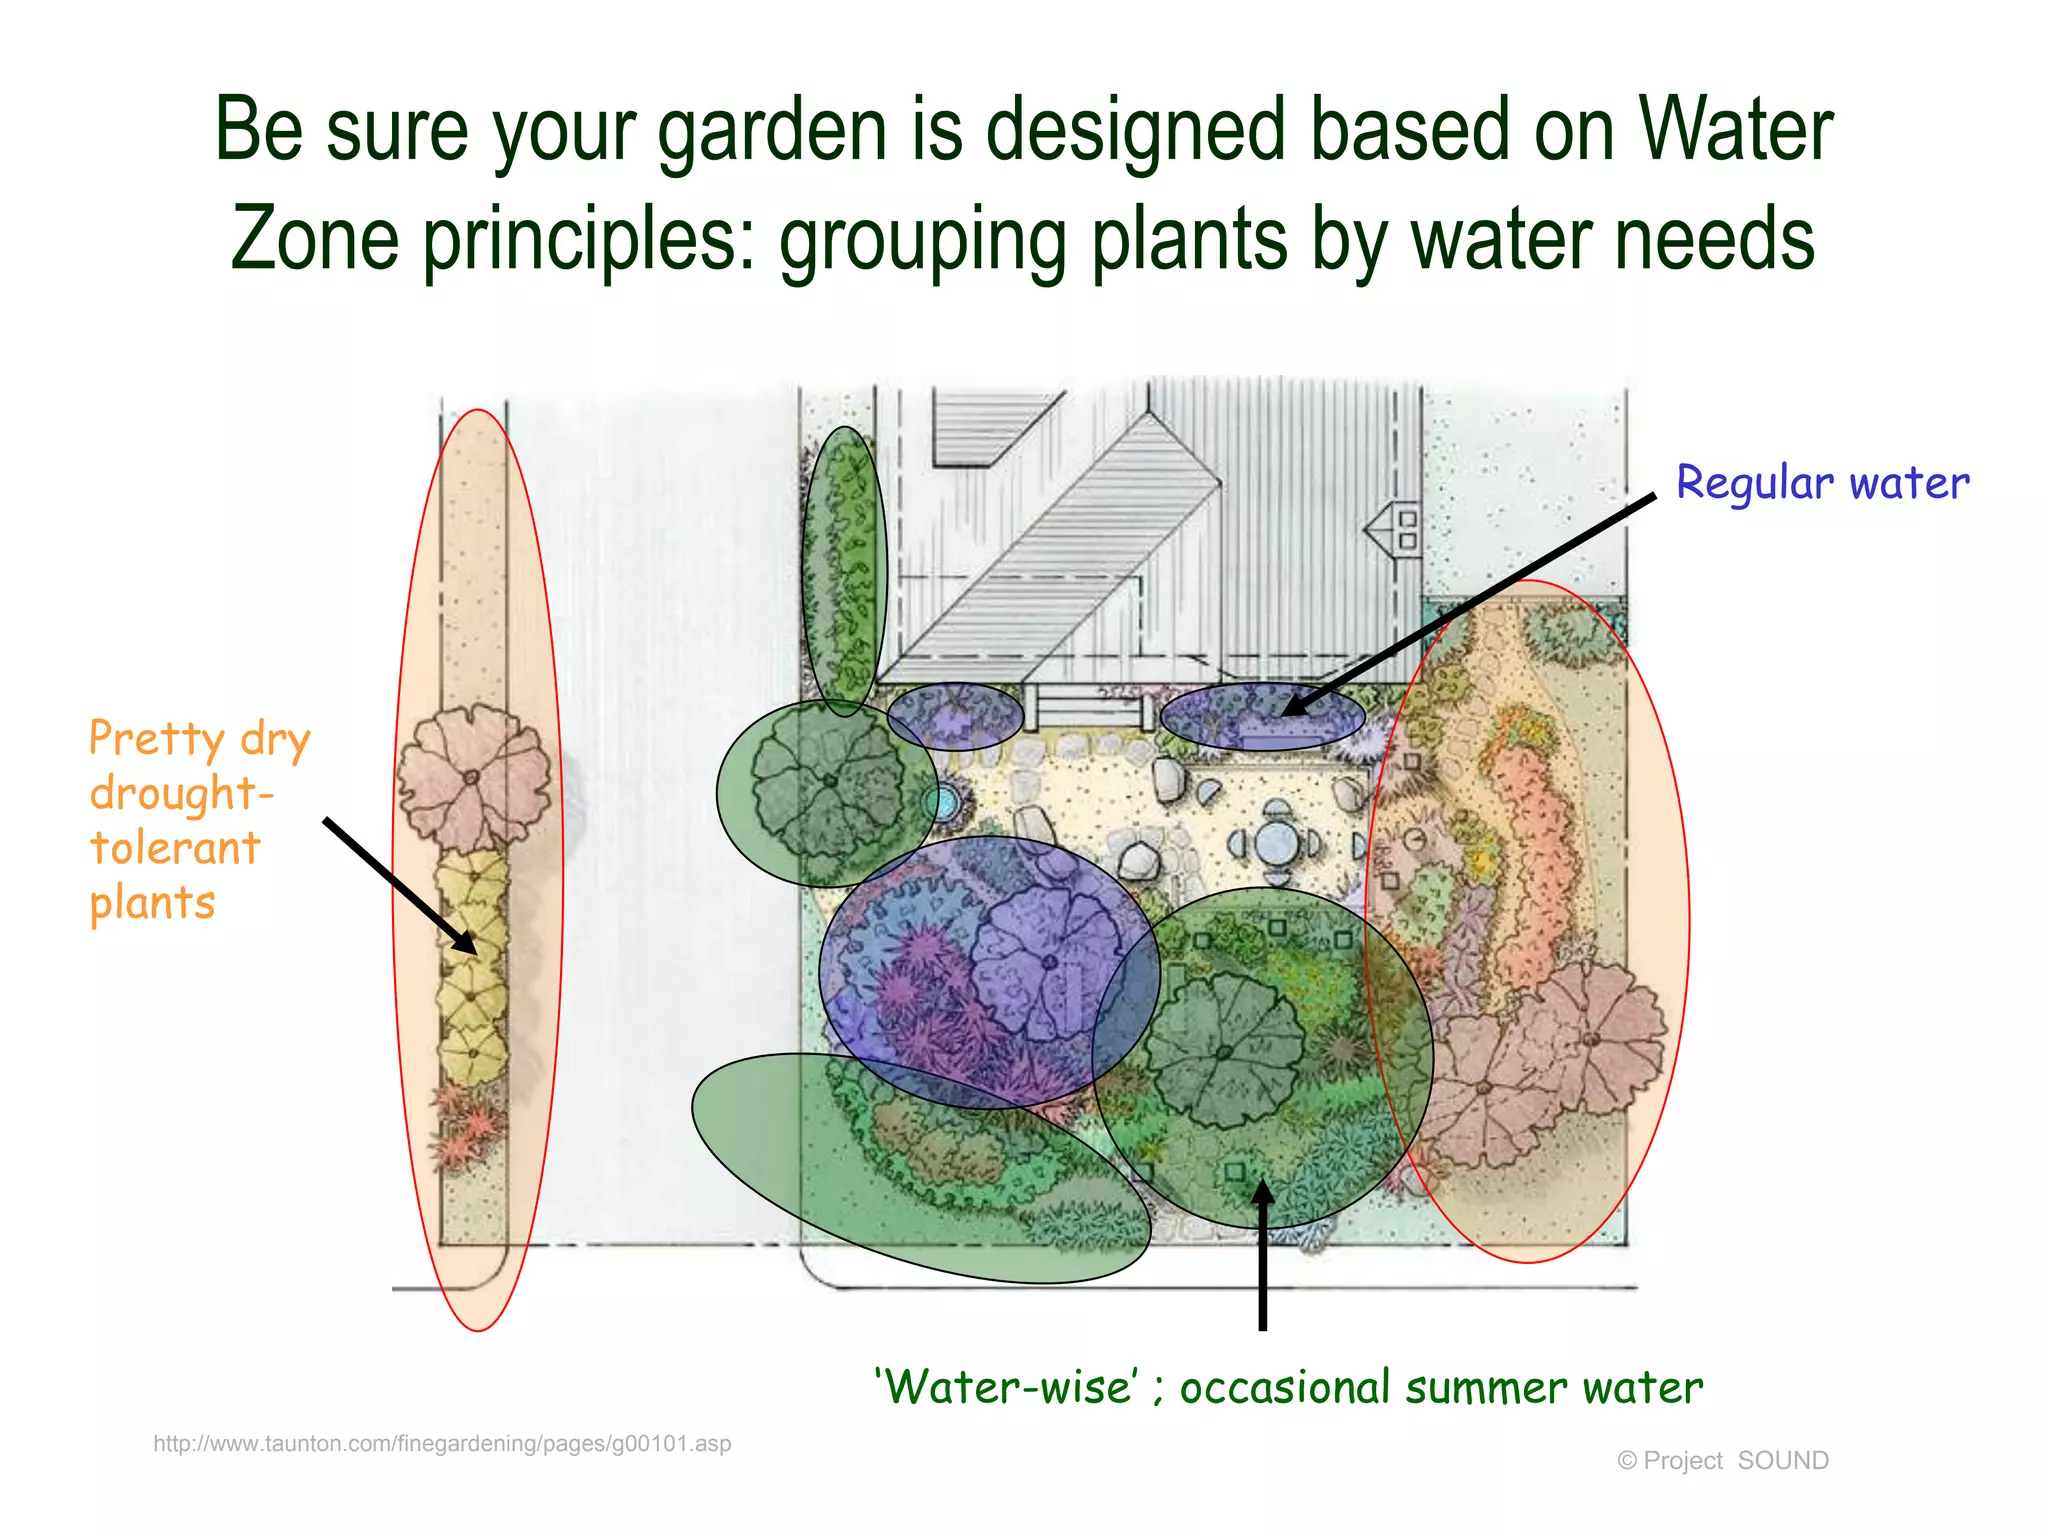
![What you can do now to become more
‘water-wise’
Read Mother Nature’s Garden series ‘Designing your New
California Garden’ (2013-14) and ‘Harvesting Rain’ (2013)
Consider decreasing areas that receive regular water – limit
regular water to only high priority plants [vegetable garden;
prize rose bush; etc]
Consider increasing non-planted areas [seating/dining areas;
utility areas]
As you replace older plants, consider replacements carefully:
Do they have flexible/drought-tolerant needs?
Do they fit into the water zone plan?
What else do they provide: shade? food? habitat? other?
© Project SOUND](https://image.slidesharecdn.com/climatechange-2014-140302064306-phpapp01/75/Climate-change-2014-74-2048.jpg)