SlideShare a Scribd company logo
1 of 84
Download to read offline
CITY COUNCIL MEETING
CITY OF EVANSTON, ILLINOIS
LORRAINE H. MORTON CIVIC CENTER
2100 RIDGE AVENUE, EVANSTON 60201
COUNCIL CHAMBERS
Monday, May 21, 2012
7:00 p.m.
ORDER OF BUSINESS
(I) Roll Call – Begin with Alderman Fiske
(II) Mayor Public Announcements and Proclamations
Public Works Week – May 20-26, 2012
Recognition for Employees with 25 years or More of Service
(III) City Manager Presentations and Announcements
Presentation by Constellation Energy Regarding Electricity Aggregation
Implementation
(IV) Citizen Comment
Members of the public are welcome to speak at City Council meetings. As part of the Council
agenda, a period for citizen comments shall be offered at the commencement of each regular
Council meeting. Those wishing to speak should sign their name, address and the agenda item
or topic to be addressed on a designated participation sheet. If there are five or fewer speakers,
fifteen minutes shall be provided for Citizen Comment. If there are more than five speakers, a
period of forty-five minutes shall be provided for all comment, and no individual shall speak longer
than three minutes. The Mayor will allocate time among the speakers to ensure that Citizen
Comment does not exceed forty-five minutes. The business of the City Council shall commence
forty-five minutes after the beginning of Citizen Comment. Aldermen do not respond during
Citizen Comment. Citizen comment is intended to foster dialogue in a respectful and civil manner.
Citizen comments are requested to be made with these guidelines in mind.
(V) Special Orders of Business
(VI) Adjournment
1 of 84
City Council Agenda May 21, 2012 Page 2 of 3
5/18/2012 2:27 PM
SPECIAL ORDERS OF BUSINESS
(SP1) City Council Goal “Visual and Performing Arts”
Staff recommends the City Council receive an oral status report on the
implementation of the City Council’s goal “Visual and Performing Arts.”
For Discussion
(SP2) City Council Goal “Efficiency and Effectiveness of Services”
Staff recommends City Council review proposed Citywide Performance
Measures and receive report on City Council Goal “Efficiency and Effectiveness
of Services.”
For Discussion
(SP3) Update Regarding FY2012 City Council Goals
Staff recommends the City Council receive an oral status report on the
implementation of the City Council’s FY 2012 goals.
For Discussion
(SP4) First Quarter Financial Report for FY2012
Staff recommends that City Council accept and place the First Quarter Financial
Report for FY 2012 on file.
For Action
(SP5) FY 2011 Capital Improvement Plan Year End Report
Staff recommends the City Council accept and place the Fiscal Year 2011
Capital Improvement Plan Year-End Report on file.
For Action
(SP6) Resolution 44-R-12 Amending the FY2012 City of Evanston Budget
Staff recommends approval of Resolution 44-R-12 – Authorization to amend the
FY 2012 Budget. The proposed amendment would increase the FY 2012 Budget
Appropriation by $7,393,000, from $250,096,993 to $257,489,993.
For Action
(SP7) Resolution 45-R-12 Approving the Amended FY 2012 Capital Improvement
Program
Staff recommends approval of Resolution 45-R-12 amending the FY 2012
Capital Improvement Program (CIP). The proposed resolution would increase
the FY 2012 CIP by $3,243,000 from $36,783,358 to $40,026,358.
For Action
2 of 84
City Council Agenda May 21, 2012 Page 3 of 3
5/18/2012 2:27 PM
MEETINGS SCHEDULED THROUGH MAY 2012
Upcoming Aldermanic Committee Meetings
Wednesday, May 23 6:00 PM Transportation/Parking
Wednesday, May 23 7:00 PM Economic Development
Thursday, May 24 5:30 PM Emergency Telephone Board
Tuesday, May 29 5:45 PM A&PW, Township and City Council
Information is available about Evanston City Council meetings at: www.cityofevanston.org/citycouncil.
Questions can be directed to the City Manager’s Office at 847-866-2936. The City is committed to
ensuring accessibility for all citizens. If an accommodation is needed to participate in this meeting, please
contact the City Manager’s Office 48 hours in advance so that arrangements can be made for the
accommodation if possible.
3 of 84
For City Council meeting of May 21, 2012 Item SP1
Council Goal: “Visual and Performing Arts”
For Discussion
To: Honorable Mayor and Members of the City Council
From: Wally Bobkiewicz, City Manager
Subject: City Council Goal – “Visual and Performing Arts”
Date: May 18, 2012
Recommended Action:
Staff recommends the City Council receive an oral status report on the implementation
of the City Council’s goal “Visual and Performing Arts.”
Summary:
Staff will make a presentation on efforts going on community-wide in the area of visual
and performing arts.
Staff will also discuss a proposed plan to develop a citywide arts plan.
Memorandum
4 of 84
Page 1 of 2
For City Council meeting of May 21, 2012 Item SP2
Council Goal: “Efficiency and Effectiveness of Services”
For Discussion
To: Honorable Mayor and Members of the City Council
From: Godwin Chen, ICMA Fellow
Subject: City Council Goal “Efficiency and Effectiveness of Services”
Date: May 18, 2012
Recommended Action:
Staff recommends City Council review proposed Citywide Performance Measures and
receive report on City Council Goal “Efficiency and Effectiveness of Services.”
Summary:
In pursuing the City Council’s goal of improving the “Efficiency and Effectiveness of
Services,” staff has compiled the attached list of Citywide Performance Measures
(CPM). As part of this process, Departments were asked to identify performance
measures for benchmarking City operations and service provision to the public. These
performance measures aim to capture all major operational activities of the organization
and yield meaningful and actionable information which can be utilized by the City
Council, managerial staff, residents and other community stakeholders.
Where possible, the Citywide Performance Measures were created utilizing the
guidance of standardized measures established by the International City / County
Managers Association (ICMA). However, the City of Evanston also provides services
which are relatively unique in comparison with other communities. To address this
issue, the performance measures developed by the Health and Utilities Departments
utilized industry standards and federal and state reporting requirements. A staff team
reviewed the proposed performance measures submitted by each Department and
compiled the CPM list, which has been provided as an attachment to this report.
As mentioned above, the overarching goal of the CPM process is to improve the
“Efficiency and Effectiveness of Services” by consolidating all major Citywide
performance measures into a single report. The implementation of the CPM Report will
provide the City Council and public with a simplified tool for quickly and easily assessing
the effectiveness of City service provision. With City Council approval, the CPM will be
collected and compiled on a semi-annual basis, and reports will be provided during the
mid-year and year-end City Council meetings. In addition, the CPM Report will be
published on the City website to address the City’s ongoing transparency efforts.
Memorandum
5 of 84
Page 2 of 2
Attachments
Citywide Performance Measures (CPM)
6 of 84
CITY OF EVANSTON
FY 2012 COMPREHENSIVE PERFORMANCE MEASURES
# Department Objective Performance Measure Calculation Guidance
1 City Manager's Office Sustainability - Reduce Energy Usage
Total energy savings Citywide during a specific period of time
calculated in terms of kWh and Therms.
2 City Manager's Office Sustainability Annual grant funding secured.
Total value of grants and support received
for sustainability projects calculated in
terms of annual dollar value.
3 City Manager's Office Citizen Engagement
Percentage of 311 requests completed within established
service level agreement.
4 City Manager's Office Citizen Engagement Number of administrative services assumed by 311.
5 City Manager's Office Citizen Engagement
Change in number of subscribers to City communication
channels annually.
6 City Manager's Office Intergovernmental Affairs
Federal, State and Regional dollars given/savings to City of
Evanston projects in a given year (grants included).
7 City Manager's Office Event and Activities Number of citizen engagement events and/or activities.
8 Law Ordinance Prosecution
Ordinance cases prosecuted during a specified period of time
(animal, aggressive panhandling, curfew, disorderly conduct).
9 Law Traffic Prosecution Traffic prosecution cases during a specific period of time.
10 Law Ordinances and resolutions
Ordinances and resolutions written and/or reviewed during a
specific period of time.
11 Law Loss minimization/Risk Management Cases tried to verdict.
Result of same, won at summary judgment
or dismissal stage, or litigation that resulted
in no adverse impact to the City.
12 Law Administrative adjudication
Number of administrative adjudication cases tried per year
(including appeals).
13 Administrative Services Purchasing
Calendar days from requisition to purchase order (formal and
informal bids).
Average number of days from requisition to
purchase order during a specific period of
time.
14 Administrative Services Human Resources
Calendar days from requisition to hire/recruitment for internal
and external hires.
Average number of days from requisition to
hire/recruitment during a specific period of
time.
15 Administrative Services
Telephone System and Network
Problem Resolution/Repair
Percentage of telephone system and network problems
corrected within 48 hours during a specific period of time.
16 Administrative Services Finance / Accounting
Total number of financial reporting documents published
and/or certified during a specific period of time.
17 Administrative Services Parking
Number of parking tickets issued and parking-related revenue
generated during a specific period of time.
Page 1 of 4
7 of 84
CITY OF EVANSTON
FY 2012 COMPREHENSIVE PERFORMANCE MEASURES
# Department Objective Performance Measure Calculation Guidance
18 Community & Economic Dev. Property Maintenance Compliance Total inspections performed per 1,000 population.
Total Property Maintenance Compliance
Inspections per 1,000 of City population
(Evanston population = 74,486 per 2010
Census)
19 Community & Economic Dev. Plan Reviews
Average number of days to review Single Family & Accessory
Structures and Commercial & Accessory Structures.
20 Community & Economic Dev. New Businesses
No. of announced economic development projects with no. of
new jobs and expected private investment.
This measure requires three numbers: No.
of announced projects per year, No. of jobs
projected with each announcement and it
private investment (capital).
21 Community & Economic Dev. Affordable Housing Production/Rehab
Number of housing units (owner and rental) improved per
$100,000 of grant funding.
22 Community & Economic Dev. Zoning Reviews Average number of days to review Zoning Analysis Application.
23 Police Crime Rates Benchmark of crime level against that of other communities.
24 Police Calls for Service
Number of police calls per 1,000 residential population
compared with the percentage of dispatched police calls.
25 Police Peacekeeping and Domestic Quarrels
Number of domestic quarrels, referrals to Victim Services and
follow-on services provided.
26 Police Crimes Solved
Percentage of UCR (Uniform Crime Reports) Part I Crimes
Cleared.
Part I Crimes as defined by FBI's Uniform
Crime Reports
27 Police Response Time Response time in minutes to Top Priority Calls. Locally defined "Top Priority Calls."
28 Police Seizure Data
Benchmark of quantity of illicit drugs and firearms seized
against that of other communities.
29 Police FTE to Population Sworn and civilian FTE's per 1,000.
30 Fire Response Time
Percentage of emergency fire calls with a response time of five
minutes and under from dispatch to arrival on scene,
compared with square miles served per fire Suppression
Station, and compared with population density.
This measure requires four numbers:
"Percent of calls with response time of five
minutes or less," "Total square miles of the
City," "Number of fire stations" and
"Population served"
31 Fire Fire Incidents Fire Incidents confined to room of origin.
32 Fire Injuries
Number of on the Job (OJI) related injuries per 100 members
that resulted in time lost from duty in a 1 year period.
33 Fire Vehicle Accidents
Job related vehicle crashes, deemed preventable, per 100
members in a 1 year period.
Page 2 of 4
8 of 84
CITY OF EVANSTON
FY 2012 COMPREHENSIVE PERFORMANCE MEASURES
# Department Objective Performance Measure Calculation Guidance
34 Fire FTE to Population Sworn and civilian FTE's per 1,000 population.
35 Fire EMS Response Time Emergency responses (in seconds). CAD Dispatch Time to Arrival on Scene
36 Fire Turnout Time for emergency and non-emergency alarms.
Time from Dispatch to the time of Enroute
to Scene.
37 Health
Communicable Disease
Epidemiological Investigations
Number of investigations and complaints.
This measure requires total number of
investigations, total number of lab reports,
and total number of investigations initiated
following lab reports
38 Health Educational Outreach
Number of individuals reached by educational activities per
1,000 population.
39 Health Health Inspections
Number of restaurant, temporary food and farmer's market
inspections (cont'd in comment).
40 Health Dental Care
Number of visits to dental clinic for preventative and restorative
care.
41 Health Vital Records Number of birth and death certificates issued.
42 Public Works Waste Diversion Total waste diversion rate.
43 Public Works Road Rehabilitation Road Rehabilitation Expenditures per paved lane mile.
44 Public Works Timely Capital Improvements
Percentage of capital improvement projects on time and under
budget.
45 Public Works Resident Satisfaction Survey of residents impacted by all Public Works projects.
46 Public Works
Time to complete maintenance and
minor repairs
Percent of minor vehicle repairs completed within 2 days and
percent of preventative maintenance completed within 30 days
of due date.
47 Public Works Cost of maintenance and minor repairs Average maintenance and repair cost per vehicle.
48 Public Works Snow Removal
Snow and ice control expenditures per capita compared with
inches of snowfall.
This measure requires two numbers:
"Snow and ice control expenditures per
capita" and "inches of snowfall"
49 Public Works Timely waste and recycling collection
Percent of residential and commercial waste and recycling
picked up on schedule.
50 Public Works Residential Street Sweeping Street-sweeping expenditures per linear mile swept.
51 Parks, Rec. and Comm. Serv. Youth Employment
Percentage of applicants for youth employment and vocational
training opportunities who received such opportunities.
This measure requires two numbers:
Percentage of applicants for youth
employment and vocational training
52 Parks, Rec. and Comm. Serv. Facilities Management
Total number and response time of completing in-house work
orders.
53 Parks, Rec. and Comm. Serv. Forestry Response
Total number and response time of completing Forestry
Division requests.
Page 3 of 4
9 of 84
CITY OF EVANSTON
FY 2012 COMPREHENSIVE PERFORMANCE MEASURES
# Department Objective Performance Measure Calculation Guidance
54 Parks, Rec. and Comm. Serv. Recreation User Activity
Evaluate total program participation and recreation services by
age and Ward.
55 Parks, Rec. and Comm. Serv. Youth Engagement
Evaluate employee and employer satisfaction with youth
employment programs.
56 Parks, Rec. and Comm. Serv. Park Attendance Attendance at PR&CS special events and park permits
57 Parks, Rec. and Comm. Serv. Park User Experience User survey of facility conditions, safety and cleanliness.
58 Library Customer Satisfaction Percentage of citizens who rated library service as satisfactory.
59 Library Customer Service
Percentage of library users who rated the helpfulness and the
general attitude of library staff as satisfactory.
60 Library Collection
Percentage of library users who rated the availability of library
materials as satisfactory.
61 Library Circulation Number of items circulated per resident.
62 Library Purchasing Costs Number of dollars spent for materials acquisition per resident.
63 Utilities Reliable Distribution Number of customers experiencing disruption.
64 Utilities Water Complaints Number of customer complaints for water's technical quality.
65 Utilities Sewer Complaints
Number of customer complaints for sewers' technical quality
(seepage, backups, overflows, etc.).
66 Utilities Employee Health and Safety Benchmark days lost from work due to illness or injury again.
67 Utilities Regulatory Compliance Number of EPA regulatory violations.
68 Utilities Water Main Failure Rate Number of known breaks/leaks per mile of water main.
69 Utilities Water Sales Millions of gallons of water sold to outside communities.
Page 4 of 4
10 of 84
For City Council meeting of May 21, 2012 Item SP3
Presentation: FY2012 City Council Goals
For Discussion
To: Honorable Mayor and Members of the City Council
From: Wally Bobkiewicz, City Manager
Subject: Update – FY 2012 City Council Goals
Date: May 18, 2012
Recommended Action:
Staff recommends the City Council receive an oral status report on the implementation
of the City Council’s FY 2012 goals.
Summary:
This evening’s City Council meeting will discuss in detail the City Council’s goals
pertaining to the arts and efficiency and effectiveness of services.
Staff will provide an update on the status of the other City Council goals.
Memorandum
11 of 84
7For the City Council Meeting of September 20, 2010
2nd
Quarter Financial Report
For City Council meeting of May 21, 2012 Item SP4
First Quarter Financial Report for Fiscal Year 2012
For Acceptance and Placement on File
To: Honorable Mayor and Members of the City Council
From: Marty Lyons, Assistant City Manager/Chief Financial Officer
Louis Gergits, Finance Division Manager
CC: Wally Bobkiewicz, City Manager
Subject: First Quarter Financial Report for Fiscal Year 2012
Date: May 15, 2012
Recommended Action:
Staff recommends that City Council accept and place the First Quarter Financial Report
for FY 2012 on file.
Summary:
The City ended the first quarter of the 2012 fiscal year in stable financial condition. The
City’s financial performance is the result of revenues remaining relatively consistent with
budget targets and expenditures being held below budgeted levels.
March represents the third month of the City of Evanston’s 2012 fiscal year. As a result,
it is too early to draw any meaningful conclusions or projections relative to the City’s
financial performance in FY12. In addition, the City shifted to a calendar fiscal year in
FY 2012. As a result, the First Quarter Financial Report for 2012 will not necessarily be
comparable to first quarter reports from prior years. Staff will continue to monitor City
revenues and expenditures/expenses throughout FY12 and will provide regular updates
to the City Council.
Attached are summaries of the City’s funds for the first quarter of FY 2012. In reviewing
these reports, please note the following:
• A majority of the revenues are recorded at the time they are actually received
(permits, property taxes, fees, etc.), however, some revenues are recorded at the
time of notification of the revenue being earned by the City (sales, income,
telecommunications taxes, etc).
• State revenue sources are delayed by one to three months based on the revenue
Memorandum
12 of 84
- 2 -
source in question.
• While some revenues are received on a monthly basis, other revenues are
received less uniformly throughout the year. An example is property taxes, which
are billed bi-annually and then distributed by the County as payments are
received. This disbursal method contrasts with other revenue sources such as
sales taxes, which are collected by the State and distributed on a monthly basis.
• Operating expenses, including payroll, are reported at the time they are incurred
during the year. At year-end, the City often receives invoices after the close of
the year, for services used or items purchased during the year. These expenses
are recorded into the previous year for which they were incurred.
• Operating expenses are incurred on a uniform basis for items such as payroll,
utilities, fuel, etc., and on an as needed basis for supplies, equipment and
specific outsourced services.
General Fund Revenues:
General Fund revenues through the March 31, 2012 were $22,880,530 or 27.7% of
budget, or slightly above the 25% budget target. The first quarter performance of major
General Fund revenue sources is summarized below:
• Through March 31, 2012 property tax revenue was $6,560,873 or 53.4% of
budget.
• State income tax was recorded in the amount of $1,508,416 through March 31,
2012, achieving 25.8% of the budget target for this revenue item. State income
tax is typically received in arrears by one or two months.
• Regular sales tax revenue in FY 2012 was $2,057,930 or 22.4% of budget.
Home rule sales tax revenue in FY 2012 was $1,308,485 or 21.8% of budget.
• Real estate transfer tax through March 31, 2012 totaled $404,201 achieving
23.4% of the budget target for this item. This includes large property sales.
• Through March 31, 2012, licenses, permits, and fees were approximately 23.1%
of budget. Permit revenue was $623,344 or 16.9% of budget. In comparison,
license revenue is $742,908 or 20.4% of target budget.
General Fund Expenditures:
13 of 84
- 3 -
Through March 31, 2012, General Fund expenditures were $18,283,456 or 22.1% of
budget for FY 2012. It is important to note, for the General Fund, many expenditures /
disbursements are not made evenly throughout the year. For example:
• Seasonal employee wages in Parks, Recreation and Community Services are
typically charged during the summer months.
• Police Department assigns additional patrol details during the summer months.
• While the previous winter was relatively mild, certain overtime wages in Public
Works for services such as snow/ice removal may occur during the months of
November and December.
Due to the uneven disbursements of many General Fund expenditures, it will be difficult
to project FY 2012 expenditure totals until additional monthly financial data is available.
Staff will continue to monitor expenditures throughout the year and will provide regular
reports to the City Council and public.
Enterprise Funds:
Revenues and expenses for the Parking, Water, Sewer and Solid Waste Funds were all
below the 25% budget target. Similar to the General Fund, many enterprise fund
revenues and expenses / disbursements do not occur evenly throughout the fiscal year.
In addition, Water and Sewer Fund revenues are typically lowest during the winter
months. As a result, it is difficult to project whether the enterprise funds will perform
close to budgeted levels at this time. Staff will continue to monitor and report on the
performance of City enterprise fund revenues and expenditures throughout FY 2012.
Legislative History:
N/A
Attachments
March 31, 2012 Monthly Financial Report
14 of 84
Revenues Budget Actual
% of
Budget Budget Actual
% of
Budget Budget Actual
% of
Budget Budget Actual
% of
Budget Budget Actual
% of
Budget
Property Tax 12,296,386$ 6,560,873$ 53.4% -$ -$ -$ -$ -$ -$ -$ -$
Sales Tax 15,206,475 3,366,415 22.1% - - - - - - - -
State Income Tax 5,853,839 1,508,416 25.8% - - - - - - - -
Utility Tax 8,672,006 2,150,567 24.8% - - - - - - - -
Real Estate Transfer Tax 1,725,000 404,201 23.4% - - - - - - - -
Liquor Tax 2,070,063 574,164 27.7% - - - - - - - -
Other Taxes 5,860,547 1,219,739 20.8% - - - - - - - -
Licenses, Permits, Fees 8,652,861 1,997,507 23.1% - - - - - - - -
Charges for Services 7,853,023 1,770,977 22.6% 6,171,637 1,580,030 25.6% 12,905,000 3,088,341 23.9% 12,908,000 3,100,921 24.0% 3,624,033 718,490 19.8%
Intergovernmental Revenues 669,897 163,935 24.5% - - 262,500 262,500 100.0% - - 140,000 3,067 2.2%
Interfund Transfers 7,890,068 1,919,389 24.3% 3,876,726 969,182 25.0% - - - - 1,245,967 311,492 25.0%
Other Non-Tax Revenue 5,950,622 1,244,347 20.9% 2,034,004 - 0.0% 5,600,557 106,302 1.9% 9,092,236 1,124 0.0% - -
Total Revenues 82,700,787$ 22,880,530$ 27.7% 12,082,367$ 2,549,212$ 21.1% 18,768,057$ 3,457,143$ 18.4% 22,000,236$ 3,102,045$ 14.1% 5,010,000$ 1,033,049$ 20.6%
Expenditures
Legislative 616,033$ 140,473$ 22.8% -$ -$ -$ -$ -$ -$ -$ -$
City Administration 1,856,258 330,801 17.8% - - - - - - - -
Law Department 999,107 218,092 21.8% - - - - - - - -
Administrative Services Department 8,643,197 1,914,149 22.1% - - - - - - - -
Community and Econ. Development 3,148,339 706,099 22.4% - - - - - - - -
Police Department 24,752,938 5,811,436 23.5% - - - - - - - -
Fire & Life Safety Services 13,314,621 3,144,785 23.6% - - - - - - - -
Health Department 2,413,969 519,304 21.5% - - - - - - - -
Public Works- Operating 9,559,460 2,205,774 23.1% 11,731,140 1,364,754 11.6% 12,664,258 2,983,280 23.6% 16,690,143 2,756,953 16.5% 5,187,861 725,232 14.0%
Public Works- Capital Outlay - - 0.0% 3,520,000 - 0.0% 7,999,500 645,302 8.1% 4,771,000 3,995 0.1% - -
Parks, Recreation & Comm. Services 17,392,621 3,292,543 18.9% - - - - - - - -
Total Expenditures 82,696,543$ 18,283,456$ 22.1% 15,251,140$ 1,364,754$ 8.9% 20,663,758$ 3,628,582$ 17.6% 21,461,143$ 2,760,948$ 12.9% 5,187,861$ 725,232$ 14.0%
As of March 31, 2012
City of Evanston
Report of Budget-to-Actual Revenues and Expenditures
Parking Fund Water Fund Solid Waste FundSewer FundGeneral Fund
(Target is 25% of FY 2012 Budget)
15 of 84
FY 2011 FY 2011 FY 2012 FY 2012
Budget Unaudited Budget YTD
Adopted Actual Adopted Actual
Tax - Property 16,516,200$ 16,009,204$ 12,296,386$ 6,560,873$
Tax - State Use 677,877 852,743 1,091,215 243,000
Tax - Sales Tax - Basic 7,300,000 7,403,517 9,209,455 2,057,930
Tax - Sales Tax - Home Rule 4,552,968 4,749,481 5,997,020 1,308,485
Tax - Auto Rental 29,155 34,004 36,445 9,761
Tax - Athletic Contest 550,000 154,227 700,000 -
Tax - State Income 4,635,565 4,855,460 5,853,839 1,508,416
Tax - Fire Insurance 90,000 - - -
Tax - Electric Utility 2,196,333 2,338,827 3,069,806 760,296
Tax - Natural Gas Utility 1,385,130 848,770 1,583,000 351,137
Tax - Natural Gas Use - Home Rule 709,044 528,650 869,000 244,134
Tax - Cigarette 295,284 304,827 485,000 90,000
Tax - Evanston Motor Fuel 550,378 481,751 761,587 154,682
Tax - Liquor 1,623,754 1,804,356 2,070,063 574,164
Tax - Parking 1,800,000 1,942,347 2,160,000 577,208
Tax - Personal Property Replacement 441,166 372,894 626,300 145,088
Tax - Real Estate Transfer 1,500,000 1,989,587 1,725,000 404,201
Tax - Telecommunications 2,691,834 2,628,397 3,150,200 795,000
License Fees - Vehicles 1,799,820 2,056,523 2,598,341 530,311
License Fees - Other 814,720 901,090 1,045,382 212,597
Permit Fees - Building 2,500,000 1,836,284 2,500,000 269,403
Permit Fees - Other 1,086,400 1,142,758 1,184,788 353,941
Other Fees 1,092,617 847,241 1,324,350 631,255
Fines and Forfeiture Revenue 3,806,864 3,230,763 4,721,639 880,283
Charges for Services Revenue 6,048,402 6,444,195 7,853,023 1,770,977
Intergovernmental Revenue 802,239 891,639 669,897 163,935
Other Revenue 1,575,183 1,966,283 1,216,983 362,762
Interfund Transfers In (Other Funds) 6,790,549 6,557,462 7,890,068 1,919,389
Interest Income 12,000 2,072 12,000 1,302
Total Revenue 73,873,482 73,175,352 82,700,787 22,880,530
Legislative 523,131 514,586 616,033 140,473
City Administration 1,675,952 1,329,524 1,856,258 330,801
Law Department 828,120 816,863 999,107 218,092
Administrative Services Department 8,206,488 6,684,499 8,643,197 1,914,149
Community and Economic Development 2,824,205 2,677,868 3,148,339 706,099
Police Department 20,263,642 20,631,944 24,752,938 5,811,436
Fire & Life Safety Services Department 11,192,783 11,120,092 13,314,621 3,144,785
Health Department 2,135,313 1,989,997 2,413,969 519,304
Public Works Department 6,862,268 6,576,242 9,559,460 2,205,774
Library (Note 1) 3,708,359 3,650,508 - -
Parks, Recreation & Community Services 15,653,221 15,407,209 17,392,621 3,292,543
Total Expenditures 73,873,482 71,399,332 82,696,543 18,283,456
Net Surplus (Deficit) -$ 1,776,020$ 4,244$ 4,597,074$
Beginning Unrestricted Fund Balance (Note 2) 20,008,876 15,284,896
Change in Property Tax Receivables for
Change in Fiscal Year (Note 3)
(6,500,000)
Ending Unreserved/Undesignated Fund Balance 15,284,896$ 19,881,970$
Note 1: The Library is budgeted as a separate fund in FY 2012.
Note 2: Unrestricted fund balance includes amounts designated for compensated absences and IMRF.
City of Evanston
General Fund
As of March 31, 2012
Note 3: March and April 2011 property tax payments are credited to the prior year as a result of the conversion to a
calendar fiscal year.
16 of 84
FY 2011 FY 2011 FY 2012 FY 2012
Budget Unaudited Budget YTD
Adopted Actual Adopted Actual
Revenue By Source
Library Fines & Fees -$ -$ 150,000$ 38,024$
Library Material Replacement - - 12,500 2,890
Copy Machine Charges - - 20,000 4,892
Meeting Room Fees - - 10,000 1,110
Non-resident Cards - - 2,460 492
North Branch Rental Income - - 47,325 16,885
State Per Capita Grant - - 75,900 76,385
Personal Property Repl. Tax - - 50,200 -
Video Rentals - - 28,000 9,606
Allocation - Property Taxes - - 4,253,214 2,652,949
Total Revenues - - 4,649,599 2,803,233
Expenditures
Youth Services - - 800,390 176,785
Adult Services - - 1,579,231 332,061
Circulation - - 589,769 140,304
North Branch - - 203,336 44,562
Technical Services - - 473,306 100,969
Maintenance - - 491,375 93,602
Administration - - 512,192 98,869
Total Expenditures - - 4,649,599 987,152
Net Surplus (Deficit) - - - 1,816,081$
Beginning Fund Balance - -
Ending Fund Balance -$ 1,816,081$
Note: The Library is budgeted as a separate fund in FY 2012. In prior fiscal years, the
Library was a department in the General Fund.
City of Evanston
Library Fund (Note)
As of March 31, 2012
17 of 84
FY 2011 FY 2011 FY 2012 FY 2012
Budget Unaudited Budget YTD
Adopted Actual Adopted Actual
Grant Proceeds 288,460$ 195,943$ 80,000$ 42,840$
Total Revenue 288,460 195,943 80,000 42,840
HPRP Administration 27,000 10,841 - -
Program Activities 261,460 185,102 80,000 42,840
Total Expenditures 288,460 195,943 80,000 42,840
Net Surplus (Deficit) -$ -$ -$ -$
Beginning Unreserved Fund Balance - -
Ending Unreserved Fund Balance -$ -$
City of Evanston
Homelessness Prevention & Rapid Re-Housing Program
As of March 31, 2012
18 of 84
FY 2011 FY 2011 FY 2012 FY 2012
Adopted Unaudited Budget YTD
Budget Actual Adopted Actual
Grant Proceeds 6,887,345$ 4,688,070$ 5,699,363$ 1,008,233$
Program Income 1,500,000 - 1,750,000 -
Total Revenue 8,387,345 4,688,070 7,449,363 1,008,233
Development Activities 7,985,000 4,364,094 6,771,363 926,503
Administration 124,345 164,902 338,749 53,513
Transfer to Debt Service - - 3,616 904
Transfer to Insurance - - 15,635 4,179
Transfer to General Fund 278,000 156,813 320,000 30,825
Total Expenditures 8,387,345 4,685,809 7,449,363 1,015,924
Net Surplus (Deficit) -$ 2,261$ -$ (7,691)$
Beginning Unreserved Fund Balance - 2,261
Ending Unreserved Fund Balance 2,261$ (5,430)$
City of Evanston
Neighborhood Stabilization Fund
As of March 31, 2012
19 of 84
FY 2011 FY 2011 FY 2012 FY 2012
Adopted Unaudited Adopted YTD
Budget Actual Budget Actual
State Allotment 1,900,000$ 1,876,906$ 1,900,000$ 464,191$
Investment Earnings 2,000 615 2,000 210
Miscellaneous Income - - - -
Total Revenue 1,902,000 1,877,521 1,902,000 464,401
Sheridan Rd./ Isabella St. Project
(JT with Wilmette) - - -
Street Resurfacing (2009) - - -
Street Resurfacing (2010) - - -
Street Resurfacing (2011) 1,200,000 980,941 1,400,000 726
Transfer to General Fund - Staff Engineering 110,606 110,606 132,727 33,182
Transfer to General Fund - Street Maintenance 586,886 586,886 704,263 176,066
Total Expenditures 1,897,492 1,678,433 2,236,990 209,974
Net Surplus (Deficit) 4,508$ 199,088$ (334,990)$ 254,428$
Beginning Unreserved Fund Balance 682,090 881,178
Ending Unreserved Fund Balance 881,178$ 1,135,606$
City of Evanston
Motor Fuel Fund
As of March 31, 2012
20 of 84
FY 2011 FY 2011 FY 2012 FY 2012
Adopted Unaudited Adopted YTD
Budget Actual Budget Actual
Landline Surcharge Revenue 525,000$ 479,969$ 617,400$ 160,678$
Wireless Surcharge Revenue 340,000 370,891 416,160 90,000
Interest Income 750 296 1,000 174
Miscellaneous Revenue - - - -
Total Revenue 865,750 851,156 1,034,560 250,852
Operating Expense 778,737 688,503 847,415 139,230
Transfer to General Fund 125,868 125,868 125,950 31,487
Transfer to Insurance Fund 95,095 23,717
Transfer to Debt Service Fund 10,385 2,596
Capital Replacement 229,353 121,649 188,000 -
Total Expenditures 1,133,958 936,020 1,266,845 197,030
Net Surplus (Deficit) (268,208)$ (84,864)$ (232,285)$ 53,822$
Beginning Unreserved Fund Balance 1,394,832 1,309,968
Ending Unreserved Fund Balance 1,309,968$ 1,363,790$
City of Evanston
E911 Fund
As of March 31, 2012
21 of 84
FY 2011 FY 2011 FY 2012 FY 2012
Adopted Unaudited Adopted YTD
Budget Actual Budget Actual
Property Tax Revenue 378,000$ 377,392$ 398,000$ 207,234$
Investment Income - 31 - 4
Total Revenues 378,000 377,423 398,000 207,238
Professional Fees (Evmark) 378,000 388,000 398,000 99,500
Total Expenditures 378,000 388,000 398,000 99,500
Net Surplus (Deficit) -$ (10,577)$ -$ 107,738$
Beginning Unreserved Fund Balance 112,325 101,748
Ending Unreserved Fund Balance 101,748$ 209,486$
City of Evanston
Special Service Area #4 Fund
As of March 31, 2012
22 of 84
FY 2011 FY 2011 FY 2012 FY 2012
Adopted Unaudited Adopted YTD
Budget Actual Budget Actual
Intergovernmental/Entitlement 2,095,180$ 1,478,686$ 1,490,500$ $ 408,484
Funds Reallocated from Prior Years 25,000 65,693 -
Program Income 20,000 15,302 140,000 1,841
Miscellaneous - - - -
Total Revenues 2,140,180 1,493,988 1,696,193 410,325
CDBG Administration/Planning 308,367 229,186 232,382 44,197
Development Activities 1,016,894 744,787 432,000 26,139
Capital Projects - - 255,000 -
Transfers to General Fund 772,000 646,267 776,811 193,044
Total Expenditures 2,097,261 1,620,240 1,696,193 263,380
Net Surplus (Deficit) 42,919$ (126,252)$ -$ 146,945$
Beginning Unreserved Fund Balance 422,799 296,547
Ending Unreserved Fund Balance 296,547$ 443,492$
City of Evanston
CDBG Fund
As of March 31, 2012
23 of 84
FY 2011 FY 2011 FY 2012 FY 2012
Adopted Unaudited Adopted YTD
Budget Actual Budget Actual
Intergovernmental Revenue -$ 158,988$ -$ 12,023$
Program Income 9,000 4,800 9,000 52,650
Interest Income - 268 - 35
Total Revenues 9,000 164,056 9,000 64,708
Program Expenses 20,000 194,225 20,000 22,617
Transfer to CDBG - - - -
Development Activities - - - -
Total Expenditures 20,000 194,225 20,000 22,617
Net Surplus (Deficit) (11,000)$ (30,169)$ (11,000)$ 42,091$
Beginning Unreserved Fund Balance 2,004,722 1,974,553
Ending Unreserved Fund Balance 1,974,553$ 2,016,644$
City of Evanston
CDBG Loan Fund
As of March 31, 2012
24 of 84
FY 2011 FY 2011 FY 2012 FY 2012
Adopted Unaudited Adopted YTD
Budget Actual Budget Actual
Hotel Tax 1,350,000$ 1,201,088$ 1,600,000$ 210,000$
Amusement Tax 300,000 214,156 300,000 46,483
Howard-Ridge Loan Repayment - - 48,500 -
Investment Income 8,000 179 8,000 105
Total Revenues 1,658,000 1,415,423 1,956,500 256,588
Economic Development Activities 1,640,247 1,479,759 1,802,825 247,066
Capital Projects - - 50,000 -
Tax Rebate Agreement - - - -
Transfer to Debt Service - - 12,752 3,188
Transfer to Insurance - - 75,334 18,833
Transfers to General Fund 377,256 377,256 452,707 113,177
Total Expenditures 2,017,503 1,857,015 2,393,618 382,264
Net Surplus (Deficit) (359,503)$ (441,592)$ (437,118)$ (125,676)$
Beginning Unreserved Fund Balance 2,423,201 1,981,609
Ending Unreserved Fund Balance 1,981,609$ 1,855,933$
City of Evanston
Economic Development Fund
As of March 31, 2012
25 of 84
FY 2011 FY 2011 FY 2012 FY 2012
Adopted Unaudited Adopted YTD
Budget Actual Budget Actual
Taxes 20,000$ 20,000$ 20,000$ -$
Transfers From Other Funds - - - -
Interest Income - - - -
Total Revenues 20,000 20,000 20,000 -
Program Expenses 50,000 - 50,000 -
Transfers to Other Funds - - - -
Total Expenditures 50,000 - 50,000 -
Net Surplus (Deficit) (30,000)$ 20,000$ (30,000)$ -$
Beginning Unreserved Fund Balance 89,915 109,915
Ending Unreserved Fund Balance 109,915$ 109,915$
City of Evanston
Neighborhood Improvement Fund
As of March 31, 2012
26 of 84
FY 2011 FY 2011 FY 2012 FY 2012
Adopted Unaudited Adopted YTD
Budget Actual Budget Actual
Intergovernmental /Entitlement 560,000$ 57,860$ 500,000$ 139,978$
Program Income 10,000 22,820 10,000 6,846
Total Revenues 570,000 80,680 510,000 146,824
Home Administration/Planning 56,000 4,789 - -
CHDO Operating 28,000 - - -
Development Activities 429,600 40,422 604,000 43,953
Transfers to General Fund 56,400 40,650 59,958 12,195
Total Expenditures 570,000 85,861 663,958 56,148
Net Surplus (Deficit) -$ (5,181)$ (153,958)$ 90,676$
Beginning Unreserved Fund Balance 2,636,531 2,631,350
Ending Unreserved Fund Balance 2,631,350$ 2,722,026$
City of Evanston
Home Fund
As of March 31, 2012
27 of 84
FY 2011 FY 2011 FY 2012 FY 2012
Adopted Unaudited Adopted YTD
Budget Actual Budget Actual
Demolition Taxes 8,330 10,000 - -
Developer Contributions - 2,000 125,000 -
Rehab Repayments 20,000 7,500 - 2,083
Interest Income 1,000$ 166$ 125$ 138$
Miscellaneous - - - -
Total Revenues 29,330 19,666 125,125 2,221
Housing - Land 41,650 - - -
Housing - Buildings - - - -
Down Payment Assistance 166,600 27,165 166,600 6,250
Transfers to General Fund 19,992 19,992 23,990 5,998
Miscellaneous 39,984 - 40,000 -
Total Expenditures 268,226 47,157 230,590 12,248
Net Surplus (Deficit) (238,896)$ (27,491)$ (105,465)$ (10,027)$
Beginning Unreserved Fund Balance 2,299,153 2,271,662
Ending Unreserved Fund Balance 2,271,662$ 2,261,635$
City of Evanston
Affordable Housing Fund
As of March 31, 2012
28 of 84
FY 2011 FY 2011 FY 2012 FY 2012
Adopted Unaudited Adopted YTD
Budget Actual Budget Actual
Net Property Tax Increment 4,800,000$ 5,168,428$ 5,073,000$ 2,697,573$
Interest Income 25,000 6,709 25,000 3,525
Total Revenue 4,825,000 5,175,137 5,098,000 2,701,098
Series 1997 Principal
(refunded by 1999 & 2008D)
325,000 325,000 405,000 -
Series 1997 Interest
(refunded by 1999 and 2008D)
128,200 118,200 100,650 -
Contributions to Other Agencies - - 800,000 -
Economic Development Projects 500,000 30,000
Capital Improvements 773,715 113,213 1,936,000 -
Contractual Services 125,000 - 35,000 -
Transfer to Parking Fund (Sherman) 3,419,636 3,419,636 3,876,726 969,182
Transfer to General Fund 325,000 325,000 325,000 81,250
Total Expenditures 5,096,551 4,301,049 7,978,376 1,080,432
Net Surplus (Deficit) (271,551)$ 874,088$ (2,880,376)$ 1,620,666$
Beginning Unreserved Fund Balance 9,162,676 10,036,764
Ending Unreserved Fund Balance 10,036,764$ 11,657,430$
City of Evanston
Washington National TIF Fund
As of March 31, 2012
29 of 84
FY 2011 FY 2011 FY 2012 FY 2012
Adopted Unaudited Adopted YTD
Budget Actual Budget Actual
Net Property Taxes 428,756$ 426,899$ 428,756$ 229,590$
Interest Income 100 37 - 5
Total Revenue 428,856 426,936 428,756 229,595
Series 2002C Bonds Principal 340,000 - 325,000 325,000
Series 2002C Bonds Interest 88,756 53,853 98,232 53,853
General Management Support - - - -
Total Expenditures 428,756 53,853 423,232 378,853
Net Surplus (Deficit) 100$ 373,083$ 5,524$ (149,258)$
Beginning Unreserved Fund Balance 238,422 611,505
Ending Unreserved Fund Balance 611,505$ 462,247$
City of Evanston
Special Service Area #5
As of March 31, 2012
30 of 84
FY 2011 FY 2011 FY 2012 FY 2012
Adopted Unaudited Adopted YTD
Budget Actual Budget Actual
Net Property Tax Increment 1,300,000$ 1,212,637$ 1,073,000$ 644,221$
Interest Income 5,000 1,825 5,000 3,073
Total Revenue 1,305,000 1,214,462 1,078,000 647,294
1994 & 1996 Bonds Principal (refunded by
1999 and 2008D bonds) 570,000 570,000 605,000 -
1994 & 1996 Bonds Interest (refunded by
1999 and 2008D bonds) 141,804 141,057 109,603 -
Other Expenses 460,000 1,200 - -
Operating Transfer to General Fund 141,600 141,600 141,600 35,400
Total Expenditures 1,313,404 853,857 856,203 35,400
Net Surplus (Deficit) (8,404)$ 360,605$ 221,797$ 611,894$
Beginning Unreserved Fund Balance 5,211,765 5,572,370
Ending Unreserved Fund Balance 5,572,370$ 6,184,264$
City of Evanston
SW II TIF (Howard Hartrey)
As of March 31, 2012
31 of 84
FY 2011 FY 2011 FY 2012 FY 2012
Adopted Unaudited Adopted YTD
Budget Actual Budget Actual
Net Property Tax Increment 656,000$ 451,421$ 470,000$ 255,091$
Interest Income 500 31 500 5
Total Revenue 656,500 451,452 470,500 255,096
Economic Development Activities 700,000 700,000 - -
Capital Improvement Projects - - 580,000 -
Operating Transfer to General Fund 24,100 24,100 28,920 7,230
Total Expenditures 724,100 724,100 608,920 7,230
Net Surplus (Deficit) (67,600)$ (272,648)$ (138,420)$ 247,866$
Beginning Unreserved Fund Balance 397,497 124,849
Ending Unreserved Fund Balance 124,849$ 372,715$
City of Evanston
Southwest TIF
As of March 31, 2012
32 of 84
FY 2011 FY 2011 FY 2012 FY 2012
Adopted Unaudited Adopted YTD
Budget Actual Budget Actual
Net Property Tax- Current 10,806,574$ 10,405,238$ 11,863,898$ 5,645,520$
Bond Proceeds/Premium/ Discounts - 2,143,285 - -
Transfer from Other Funds - IMRF 871,528 727,560 755,846 188,962
Interest Income 1,000 1,626 1,500 252
Transfer from Special Assessment Fund 317,660 285,894 317,660 79,415
Total Revenue 11,996,762 13,563,603 12,938,904 5,914,149
Series 2002 C- Principal - - 660,000 675,000
Series 2002 C- Interest 117,400 63,547 96,044 63,546
Series 2003 B- Principal - 2,780,000 - -
Series 2003 B- Interest 46,623 59,832 - -
Series 2004- Principal 735,000 815,000 760,000 -
Series 2004- Interest 533,250 558,450 506,250 -
Series 2004 B- Principal 1,210,000 1,535,000 1,630,000 -
Series 2004 B- Interest 145,494 253,200 195,640 -
Series 2005- Principal 525,000 545,000 730,000 -
Series 2005- Interest 721,500 740,800 700,500 -
Series 2006- Principal 75,000 125,000 80,000 -
Series 2006- Interest 454,620 467,220 451,582 -
Series 2006 B Bonds- Principal 302,063 302,063 35,000 -
Series 2006 B Bonds- Interest - - 604,126 302,063
Series 2007 - Principal 1,115,000 1,150,000 1,150,000 -
Series 2007 - Interest 626,520 663,239 598,958 -
Series 2008A - Principal 195,000 195,000 195,000 -
Series 2008A - Interest 138,162 138,162 132,313 -
Series 2008C - Principal 343,800 361,800 351,440 -
Series 2008C - Interest 398,044 418,884 387,730 -
Series 2008D - Principal 520,000 520,000 425,000 -
Series 2008D - Interest 47,874 47,874 93,554 -
Series 2010 A - Principal DSF 240,000 240,000 300,000 -
Series 2010 A - Interest DSF 190,138 190,137 185,337 -
Series 2010 B - Principal DSF 695,000 580,533 613,946 -
Series 2010 B - Interest DSF 176,528 147,453 141,648 -
Series 2011 A - Principal DSF - - 1,081,678 -
Series 2011 A - Interest DSF - - 630,961 -
Series 2004- Principal SAF 80,000 - 85,000 -
Series 2004- Interest SAF 25,200 - 19,600 -
Series 2005- Principal SAF 20,000 - 20,000 -
Series 2005- Interest SAF 19,300 - 18,500 -
Series 2006- Principal SAF 50,000 - 50,000 -
Series 2006- Interest SAF 12,600 - 10,576 -
Series 2007 - Principal SAF 35,000 - 35,000 -
Series 2007 - Interest SAF 36,720 - 35,320 -
Series 2008C - Principal SAF 18,000 - 18,400 -
Series 2008C - Interest SAF 20,840 - 20,300 -
General Management and Support 5,000 - 5,000 -
Bond Issuance Costs 75,000 86,535 60,000 -
Fiscal Agent Fees 8,000 10,152 8,000 -
Total Expenditures 9,957,676 12,994,881 13,122,403 1,040,609
Net Surplus (Deficit) 2,039,086$ 568,722$ (183,499)$ 4,873,540$
Beginning Unreserved Fund Balance (325,466) 243,256
Ending Unreserved Fund Balance 243,256$ 5,116,796$
City of Evanston
Debt Service Fund
As of March 31, 2012
33 of 84
FY 2011 FY 2011 FY 2012 FY 2012
Adopted Unaudited Adopted YTD
Budget Actual Budget Actual
Net Property Taxes 689,000$ 659,271$ 862,000$ 328,654$
Interest Income 400 100 400 39
Miscellaneous - 17,618 - -
Total Revenue 689,400 676,989 862,400 328,693
General Management Support - 25,412 - -
Economic Dev. Projects 300,000 -
Capital Improvements 430,000 3,502
Developer Agreement Payments 668,836 -
Repayments to Econ. Dev. Fund 48,500 -
Transfers to General Fund 120,400 120,400 120,400 30,100
Total Expenditures 120,400 145,812 1,567,736 33,602
Net Surplus (Deficit) 569,000$ 531,177$ (705,336)$ 295,091$
Beginning Unreserved Fund Balance 751,950 1,283,127
Ending Unreserved Fund Balance 1,283,127$ 1,578,218$
City of Evanston
Howard Ridge TIF
As of March 31, 2012
34 of 84
FY 2011 FY 2011 FY 2012 FY 2012
Adopted Unaudited Adopted YTD
Budget Actual Budget Actual
Net Property Taxes 580,000$ 491,966$ 605,000$ 254,462$
Bond Proceeds - - 2,270,000 -
Interest Income 1,000 2,285 1,000 200
Total Revenue 581,000 494,251 2,876,000 254,662
General Management Support - - - -
Economic Development Projects - - 1,200,000 -
Other Charges - - 490,000 9,125
Transfers to General Fund 50,000 50,000 60,000 15,000
Capital Projects 490,000 63,875 2,270,000 -
Total Expenditures 540,000 113,875 4,020,000 24,125
Net Surplus (Deficit) 41,000$ 380,376$ (1,144,000)$ 230,537$
Beginning Unreserved Fund Balance 1,254,443 1,634,819
Ending Unreserved Fund Balance 1,634,819$ 1,865,356$
City of Evanston
West Evanston TIF
As of March 31, 2012
35 of 84
FY 2011 FY 2011 FY 2012 FY 2012
Adopted Unaudited Adopted YTD
Budget Actual Budget Actual
Bond Proceeds 5,078,500$ 5,177,539$ 6,280,213$ -$
Grants 4,231,473 213,333 3,048,000 173,109
Private Contributions 575,000 - 1,301,200 -
Miscellaneous 149,000 73,547 - -
Interest Income - 17,546 - 3,598
Total Revenue 10,033,973 5,481,965 10,629,413 176,707
Administration 95,680 102,964 - 7,355
Capital Outlay (includes
prior year rollovers)
13,014,138 7,559,955 12,242,358 382,542
Interfund Transfers Out 300,000 300,000 475,000 118,750
Total Expenditures 13,409,818 7,962,919 12,717,358 508,647
Net Surplus (Deficit) (3,375,845)$ (2,480,954)$ (2,087,945)$ (331,940)$
Beginning Unreserved Fund Balance 5,905,344 3,424,390
Ending Unreserved Fund Balance 3,424,390$ 3,092,450$
City of Evanston
Capital Improvement Fund
As of March 31, 2012
36 of 84
FY 2011 FY 2011 FY 2012 FY 2012
Adopted Unaudited Adopted YTD
Budget Actual Budget Actual
Special Assessments Collected 550,000$ 231,589$ 300,000$ 77,451$
Bond Proceeds - - -
Investment Income 25,000 7,687 10,000 1,440
Total Revenue 575,000 239,276 310,000 78,891
Transfer to Debt Service Fund 317,659 285,894 317,660 79,415
Capital Outlay 1,575,000 740,120 1,155,000 -
Total Expenditures 1,892,659 1,026,014 1,472,660 79,415
Net Surplus (Deficit) (1,317,659)$ (786,738)$ (1,162,660)$ (524)$
Beginning Unreserved Fund Balance 3,759,955 2,973,217
Ending Unreserved Fund Balance 2,973,217$ 2,972,693$
City of Evanston
Special Assessment Fund
As of March 31, 2012
37 of 84
FY 2011 FY 2011 FY 2012 FY 2012
Adopted Unaudited Adopted YTD
Budget Actual Budget Actual
Parking Lots & Meters Operations 2,349,060$ 2,405,392$ 2,870,000$ 724,354$
Church Street Garage Operations 583,333 540,431 767,092 136,527
Maple Avenue Garage Operations 1,138,711 899,397 1,151,800 320,012
Sherman Avenue Garage Operations 1,331,134 1,162,451 1,356,275 395,372
Washington National TIF Interfund Transfers-In 2,820,455 3,419,636 3,876,726 969,182
Interest Income 34,900 7,432 15,070 3,665
Miscellaneous Revenue - - 11,400 100
Reserve for Future Repairs (Contra Depreciation) 2,044,000 - 2,034,004 -
Total Revenue 10,301,593 8,434,739 12,082,367 2,549,212
7005 - Parking System Administration 743,677 517,187 655,747 183,954
7015 - Parking Lots and Meters 799,498 737,568 1,584,510 186,710
7025 - Church Street Self Park 674,084 353,469 608,255 135,225
7030 - Church Street Debt Payments 133,030 169,336 173,126 -
7036 - Sherman Avenue Garage 5,324,706 4,254,606 5,772,432 318,254
7037 - Maple Avenue Garage 1,680,189 732,703 1,736,960 286,641
Transfer to Insurance Fund - - 503,877 79,912
Transfer to General Fund - - 644,242 161,060
Transfer to Fleet - - 21,991 5,498
Transfer to Equipment Replacement - - 30,000 7,500
7039 - Parking Debt - 22,950 - -
7050- Interfund Transfers Out 803,242 803,241 - -
Capital Outlay - - 120,000 -
Capital Improvements 3,242,598 - 3,400,000 -
Total Expenditures 13,401,024 7,591,060 15,251,140 1,364,754
Net Surplus (Deficit) (3,099,431)$ 843,679$ (3,168,773)$ 1,184,458$
Further Operating Expense Breakdown:
7015 Parking Meter Activities 762,846 737,568 1,547,858 186,710
7015 Parking Meter Depreciation 36,652 - 36,652 -
SUBTOTAL 799,498 737,568 1,584,510 186,710
7025- Church Garage Activities 494,156 353,469 428,327 135,225
7025- Church Garage Depreciation 179,928 - 179,928 -
SUBTOTAL 674,084 353,469 608,255 135,225
7036 Sherman Garage Activities 1,199,756 1,004,606 1,194,182 318,254
7036 Debt Service Payments 3,250,300 3,250,000 3,703,600 -
7036 Reserve (Depreciation) 874,650 - 874,650 -
SUBTOTAL 5,324,706 4,254,606 5,772,432 318,254
7037 Maple Garage Activities 1,013,991 732,703 1,070,762 286,641
7037 Debt Service Payments - - - -
7037 Reserve (Depreciation) 666,198 - 666,198 -
SUBTOTAL 1,680,189 732,703 1,736,960 286,641
Beginning Unreserved Fund Balance 22,046,297 22,889,976
Ending Unreserved Fund Balance 22,889,976$ 24,074,434$
City of Evanston
Parking Fund
As of March 31, 2012
38 of 84
FY 2011 FY 2011 FY 2012 FY 2012
Adopted Unaudited Adopted YTD
Budget Actual Budget Actual
Evanston 4,647,499$ 4,674,981$ 5,600,000$ 1,361,563$
Skokie 2,286,500 2,508,333 2,800,000 667,128
Northwest Commission 3,570,300 3,710,581 4,414,000 1,059,650
Cross Connection Control Fees 80,000 91,000 -
Investment Earnings 9,996 6,569 2,500 2,630
Debt Proceeds 3,340,000 4,019,889 4,800,000 -
Debt Proceeds (zero interest) - - - -
Fees and Merchandise Sales 35,000 42,261 35,000 30,232
Fees and Outside Work 66,640 189,164 80,000 66,651
Grants 350,000 116,121 262,500 262,500
Insurance Reimbursements - - 420,000 -
Phosphate Sales 49,980 43,655 60,000 6,789
Property Sales and Rentals 193,388 157,329 203,057 -
Misc Revenue - 573,132 - -
Total Revenue 14,629,303 16,042,015 18,768,057 3,457,143
General Support 681,872 571,077 832,838 169,386
Pumping 2,270,869 1,922,009 2,368,467 409,308
Filtration 2,138,628 1,965,689 2,563,022 465,773
Distribution 1,260,167 972,405 1,464,106 215,715
Meter Maintenance 320,115 262,028 313,840 85,438
Other Operating Expenses 219,791 133,341 285,530 81,790
Debt Service 82,542 166,386 944,157 599,672
Debt Service - IEPA Loan 3382 - - 67,506 -
Capital Outlay 115,500 56,883 162,500 11,846
Capital Improvements 7,670,000 5,146,698 7,837,000 633,456
Depreciation - - - -
Interfund Transfers Out - General
Fund 2,737,748 2,737,748 3,356,300 839,075
Interfund Transfers Out -
Insurance Fund 390,410 390,410 468,492 117,123
Total Expense 17,887,642 14,324,674 20,663,758 3,628,582
Net Surplus (Deficit) (3,258,339)$ 1,717,341$ (1,895,701)$ (171,439)$
Beginning Unreserved Fund Balance 6,133,887 7,851,228
Ending Unreserved Fund Balance 7,851,228$ 7,679,789$
City of Evanston
Water Fund
As of March 31, 2012
39 of 84
FY 2011 FY 2011 FY 2012 FY 2012
Adopted Unaudited Adopted YTD
Budget Actual Budget Actual
Operations 10,931,000$ 11,217,554$ 12,908,000$ 3,100,921$
Debt Proceeds 8,687,475 8,797,105 5,000,000 -
Debt Proceeds - 2012 IEPA Loan - - 4,000,000 -
Investment Earnings 3,332 2,094 1,000 1,124
Miscellaneous 89,586 131,312 91,236 -
Total Revenue 19,711,393 20,148,065 22,000,236 3,102,045
Sewer Operations 1,673,727 1,552,272 1,869,650 339,377
Other Operating Expenses 21,000 21,000 48,100 2,100
Interfund Transfers Out - General Fund 446,657 446,658 142,200 35,550
Interfund Transfers Out - Insurance Fund - - 269,988 67,497
Capital Outlay 12,000 10,830 18,000 3,995
Capital Improvement Account 687,475 523,619 4,753,000 -
Depreciation - - - -
Debt Service 14,215,356 13,737,377 14,242,990 2,312,429
Debt Service - ERI - - 117,215 -
Total Expenses 17,056,215 16,291,756 21,461,143 2,760,948
Net Surplus (Deficit) 2,655,178$ 3,856,309$ 539,093$ 341,098$
Beginning Unreserved Fund Balance (889,063) 2,967,246
Ending Unreserved Fund Balance 2,967,246$ 3,308,344$
City of Evanston
Sewer Fund
As of March 31, 2012
40 of 84
FY 2011 FY 2011 FY 2012 FY 2012
Adopted Unaudited Adopted YTD
Budget Actual Budget Actual
Property Tax Transfer from General Fund -$ -$ 1,245,967$ 311,492$
Solid Waste Franchise Fees 141,610 148,773 175,000 -
SWANCC Recycling Incentive 124,950 283,870 140,000 3,067
Recycling Service Charge 1,826,269 1,875,044 2,954,033 689,864
Sanitation Service Charge Penalty 16,660 34,887 30,000 6,591
Special Pickup Fees 100,000 57,815 100,000 9,053
State Recycling Grant 45,000 139,774 - -
Trash Cart Sales 15,000 39,058 15,000 4,324
Yard Waste Fees 680,000 241,790 350,000 8,658
Total Revenue 2,949,489 2,821,011 5,010,000 1,033,049
Refuse Collection & Disposal 1,975,110 2,839,845 3,077,218 467,860
Residential Recycling Collection 960,841 694,831 1,360,393 257,372
Yard Waste Collection 1,031,334 678,395 750,250 -
Total Expense 3,967,285 4,213,071 5,187,861 725,232
Net Surplus (Deficit) (1,017,796)$ (1,392,060)$ (177,861)$ 307,817
Beginning Unreserved Fund Balance - (1,392,060)
Ending Unreserved Fund Balance (1,392,060)$ (1,084,243)
City of Evanston
Solid Waste
As of March 31, 2012
41 of 84
FY 2011 FY 2011 FY 2012 FY 2012
Adopted Unaudited Adopted YTD
Budget Actual Budget Actual
General Fund 2,877,885$ 2,877,887$ 2,457,356$ 614,339$
Library Fund - - 2,381 595
Parking Fund 24,740 24,740 21,992 5,498
Water Fund 162,518 162,518 122,751 30,688
Sewer Fund 254,482 254,482 177,729 44,432
Solid Waste Fund 396,000 396,000 298,071 74,518
Sale of Surplus Property 350,000 85,109 75,000 43,533
Damage to City Property 24,798 - 24,789 -
Miscellaneous Revenue - 302,718 20,000 11,540
Interest Income 4,165 272 4,165 160
Total Revenues 4,094,588 4,103,726 3,204,234 825,303
General Support 236,857 207,442 284,571 50,685
Major Maintenance 2,934,771 2,683,338 3,211,873 554,216
Transfer to Equipment Repl. Fund - - 2,222,069 555,517
Capital Outlay 1,933,320 1,030,272 - -
Total Expenditures 5,104,948 3,921,052 5,718,513 1,160,418
Net Surplus (Deficit) (1,010,360)$ 182,674$ (2,514,279)$ (335,115)$
Beginning Unreserved Fund Balance 2,393,958 2,576,632
Ending Unreserved Fund Balance 2,576,632$ 2,241,517$
City of Evanston
Fleet Fund
As of March 31, 2012
42 of 84
FY 2011 FY 2011 FY 2012 FY 2012
Adopted Unaudited Adopted YTD
Budget Actual Budget Actual
General Fund -$ -$ 1,242,590$ 310,648$
Library Fund - - 1,700 425
Parking Fund - - 30,000 7,500
Water Fund - - 72,275 -
Sewer Fund - - 127,650 -
Solid Waste Fund - - 177,131 44,283
Sale of Surplus Property - - 210,217 -
Transfer from Fleet Fund - - 2,222,069 555,517
Total Revenues - - 4,083,632 918,373
Capital Outlay - - 2,400,000 -
Capital Leases - - 50,000 -
Total Expenditures - - 2,450,000 -
Net Surplus (Deficit) -$ -$ 1,633,632$ 918,373$
Beginning Unreserved Fund Balance - -
Ending Unreserved Fund Balance -$ 918,373$
City of Evanston
Equipment Replacement Fund
As of March 31, 2012
43 of 84
FY 2011 FY 2011 FY 2012 FY 2012
Adopted Unaudited Adopted YTD
Budget Actual Budget Actual
General Admin Contribution- General 105,624 98,582$ 121,207$ 30,302$
General Admin Contribution- E911 775 775 930 233
General Admin Contribution- CDBG 775 775 930 233
General Admin Contribution- E.D. 775 775 930 233
General Admin Contribution- Parking 14,193 14,193 17,032 4,258
General Admin Contribution- Water Fund 20,793 20,793 24,962 6,241
General Admin Contribution- Sewer Fund 11,992 11,992 14,385 3,596
Liability/Property Contribution- General 792,266 739,448 909,150 227,288
Liability/Property Contribution- E911 5,810 5,810 6,972 1,743
Liability/Property Contribution- CDBG 5,810 5,810 6,972 1,743
Liability/Property Contribution- E.D. 5,810 5,810 6,972 1,743
Liability/Property Contribution- Parking 106,442 106,442 127,731 31,933
Liability/Property Contribution- Water Fund 155,945 155,945 187,209 46,802
Liability/Property Contribution- Sewer Fund 89,942 89,942 107,887 26,972
Workers' Comp Contribution- General 1,084,816 1,013,938 1,244,860 311,215
Workers' Comp Contribution- Library Fund - - 5,898 1,475
Workers' Comp Contribution- E911 7,955 7,955 9,546 2,387
Workers' Comp Contribution- CDBG 7,955 7,955 9,546 2,387
Workers' Comp Contribution- E.D. 7,955 7,955 9,546 2,387
Workers' Comp Contribution- Parking 145,738 145,738 174,886 43,721
Workers' Comp Contribution- Water Fund 213,516 213,516 256,322 64,081
Workers' Comp Contribution- Sewer Fund 123,146 123,146 147,716 36,929
Subrogation Proceeds 83,300 77,876 83,300 21,119
Investment Income 41,650 313 41,650 180
Workers Comp & Liability - Subtotal 3,032,983 2,855,484 3,516,536 869,201
Health Insurance Chargebacks- General 8,124,110 7,961,902 7,602,935 1,900,734
Health Insurance Chargebacks - Library - - 308,920 77,230
Health Insurance Chargebacks - NSP2 5,463 5,463 15,635 3,909
Health Insurance Chargebacks- E911 74,836 74,836 77,647 19,412
Health Insurance Chargebacks- CDBG 19,137 19,137 10,780 2,695
Health Insurance Chargebacks- E.D. Fund 36,576 36,575 57,886 14,471
Health Insurance Chargebacks- Parking 89,573 89,573 184,229 46,057
Health Insurance Chargebacks- Water 523,267 537,497 561,211 140,303
Health Insurance Chargebacks- Sewer 142,501 142,501 140,199 35,050
Health Insurance Chargebacks - Solid Waste 145,937 145,944 158,577 39,644
Health Insurance Chargebacks- Fleet 184,760 184,761 196,271 49,068
Retiree Health Insurance Contributions 1,695,988 1,415,378 1,903,503 399,697
Employee Health Insurance Contributions 1,200,000 1,145,551 1,209,056 48,665
One Time IPBC Distribution - - 200,000 -
Health & Life insurance - Subtotal 12,242,148 11,759,118 12,626,849 2,776,935
Total Revenues 15,275,131 14,614,602 16,143,385 3,646,136
City of Evanston
Insurance Fund
As of March 31, 2012
44 of 84
FY 2011 FY 2011 FY 2012 FY 2012
Adopted Unaudited Adopted YTD
Budget Actual Budget Actual
City of Evanston
Insurance Fund
As of March 31, 2012
General Administration & Support 251,843 250,248 354,104 78,783
Liability/Property Insurance Premiums 391,510 372,834 470,000 412,433
Liability Legal Fees 175,000 494,715 350,000 45,332
Liability Settlement Payments 300,000 250,290 400,000 4,840
Workers' Comp Insurance Premiums 120,000 81,437 114,400 101,700
Workers' Comp Legal Fees 71,000 56,692 60,000 20,820
Workers' Comp Medical Payments 900,000 781,652 850,000 165,626
Workers' Comp Settlement Payments 833,000 652,848 700,000 248,596
Workers' Comp TPA Pymts (non specific) 108,750 113,375 145,000 24,167
Workers' Comp TTD Pymts (non sworn) 249,000 85,822 140,000 6,209
Workers' Comp & Liability - Subtotal 3,400,103 3,139,913 3,583,504 1,108,506
General Administration & Support - - 98,878 6,598
Health Insurance Premiums 11,138,960 10,673,050 13,005,609 3,235,401
Health Insurance Opt Out Payments 64,974 58,080 78,000 11,375
Health & Life Insurance - Subtotal 11,203,934 10,731,130 13,182,487 3,253,374
Total Expenditures 14,604,037 13,871,043 16,765,991 4,361,880
Net Surplus (Deficit) 671,094$ 743,559$ (622,605)$ (715,744)$
Beginning Unreserved Fund Balance (4,937,497) (4,193,938)
Ending Unreserved Fund Balance (4,193,938)$ (4,909,682)$
45 of 84
FY 2011 FY 2011 FY 2012 FY 2012
Adopted Unaudited Adopted YTD
Budget Actual Budget Actual
Property Taxes 6,913,759$ 5,932,983$ 6,119,393$ 3,218,932$
Personal Property Repl Tax 235,000 158,694 282,000 53,444
Interest on Investment 625,000 672,222 600,000 1,042
Participant Contributions 750,000 742,223 900,000 212,154
Unrealized Gain - (111,673) - 134
Total Revenue 8,523,759 7,394,449 7,901,393 3,485,706
Administrative Expenses 170,000 223,144 154,000 24,023
Legal Fees - - 50,000 -
Retiree Pensions 3,500,000 3,794,696 4,700,000 1,178,749
Widows' Pensions 750,000 866,915 1,070,000 275,307
Disability Pensions 720,000 885,842 1,060,000 312,736
QUILDRO 18,000 61,399 75,000 19,659
Reserve for Future Payments - - - -
Total Expenditures 5,158,000 5,831,996 7,109,000 1,810,474
Net Surplus (Deficit) 3,365,759$ 1,562,453$ 792,393$ 1,675,232$
Beg Net Assets held in Trust 54,358,822 55,921,275 55,921,275
End Net Assets held in Trust 55,921,275$ 56,713,668$ 57,596,507$
City of Evanston
Fire Pension Fund
As of March 31, 2012
46 of 84
FY 2011 FY 2011 FY 2012 FY 2012
Adopted Unaudited Adopted YTD
Budget Actual Budget Actual
Property Taxes 8,561,091$ 7,279,970$ 8,196,751$ 3,945,788$
Personal Property Repl Tax 270,833 185,055 325,000 61,747
Interest Income 1,420,000 1,611,444 1,600,000 176
Participant Contributions 1,153,600 1,149,735 1,385,000 311,482
Miscellaneous 8,088 - 50
Unrealized Gain / (Loss) - 10,947 - (31,172)
Total Revenue 11,405,524 10,245,239 11,506,751 4,288,071
Administrative Expenses 155,000 193,035 186,000 27,266
Retiree Pensions 5,750,000 5,802,426 7,250,000 1,785,905
Widow Pensions 512,500 675,909 818,000 214,941
Disability Pensions 437,500 571,045 625,000 162,414
Separation Refunds - 128,188 - -
QUILDRO 12,000 11,889 12,000 3,567
Reserve for Future Payments - - - -
Total Expenditures 6,867,000 7,382,492 8,891,000 2,194,093
Net Surplus (Deficit) 4,538,524$ 2,862,747$ 2,615,751$ 2,093,978$
Beg Net Assets held in Trust 72,465,514 75,328,261 75,328,261
End Net Assets held in Trust 75,328,261$ 77,944,012$ 77,422,239$
City of Evanston
Police Pension Fund
As of March 31, 2012
47 of 84
January February March April May June July August September October November December
FY 2012 Unreserved Fund Balance 14,685,117$ 16,337,797$ 19,881,970$
FY 2011 Unreserved Fund Balance 15,876,431$ 13,696,626$ 15,222,768$
FY 2012 Cash Balance 8,894,526$ 8,902,327$ 13,603,167$
FY 2011 Cash Balance 10,098,061$ 10,059,185$ 8,500,193$
$-
$5,000,000
$10,000,000
$15,000,000
$20,000,000
$25,000,000
City of Evanston General Fund
Comparison of Fund and Cash Balances
Fiscal Year 2012 vs Fiscal Year 2011
FY 2012 Unreserved Fund Balance
FY 2011 Unreserved Fund Balance
FY 2012 Cash Balance
FY 2011 Cash Balance
48 of 84
Page 1 of 2
For City Council meeting of May 21, 2012 Item SP5
Fiscal Year 2011 Capital Improvement Plan – Year-End Report
For Acceptance and Placement on File
To: Honorable Mayor and Members of the City Council
From: Martin Lyons, Assistant City Manager/Chief Financial Officer
Louis Gergits, Finance Division Manager
Brandon Dieter, Senior Management Analyst
Subject: FY 2011 Capital Improvement Plan – Year-End Report
Date: May 15, 2012
Recommended Action:
Staff recommends the City Council accept and place the Fiscal Year 2011 Capital
Improvement Plan Year-End Report on file.
Funding Source:
N/A
Summary:
The approved FY 2011 budget for capital projects was $32,437,959. Through
December 31, 2011, a total of $18,492,522 or 57% of budget was expended on capital
projects. A summary of FY 2011 capital expenditures by fund is provided in the table
below:
Fund
2011 CIP
Budget
2011 Year-End
CIP Expenses
Percent
Spent
MFT Fund Funding 1,200,000$ 680,941$ 56.7%
E911 Fund Funding 229,353$ 242,206$ 105.6%
CDBG Fund Funding 480,000$ 377,382$ 78.6%
Economic Development Funding 80,000$ -$ 0.0%
Washington National TIF Fund Funding 773,715$ -$ 0.0%
Southwest TIF Fund Funding 700,000$ 700,000$ 100.0%
West Evanston TIF Fund Funding 490,000$ 63,875$ 13.0%
CIP Fund Funding 13,409,818$ 5,667,688$ 42.3%
SA Fund Funding 1,575,000$ 1,057,780$ 67.2%
Parking Fund Funding 3,242,598$ 2,297,720$ 70.9%
Water Fund Funding 7,670,000$ 5,373,943$ 70.1%
Sewer Fund Funding 687,475$ 523,619$ 76.2%
Fleet Fund Funding 1,900,000$ 1,507,398$ 79.3%
TOTAL 32,437,959$ 18,492,552$ 57.0%
Memorandum
49 of 84
Page 2 of 2
As part of the FY 2012 Budget process, staff recommended the carryover of funds for
2011 capital projects into Fiscal Year 2012. As a result, approximately $6.8M of funding
for capital projects was carried over and has been re-budgeted as part of the FY 2012
Capital Improvement Program.
As the table above indicates, the FY 2011 budget for capital projects in the CIP Fund
was $13.4M. As of December 31, 2011, approximately $5.7M was spent on capital
projects in the CIP Fund. Capital expenses in the CIP Fund were significantly below
budget due to approximately $4M of anticipated grants for CIP Fund capital projects
which were not awarded to the City. As a result, associated expenditures for grant-
funded projects in the CIP Fund were not incurred in FY 2011.
The complete FY 2011 Capital Improvement Plan Year-End Report has been provided
as an attachment to this memorandum. Included in the attached report are the
expenses for individual 2011 capital projects through December 31, 2011. The status of
individual capital projects as of December 31, 2011 has also been included in the
attached report.
Legislative History:
The City Council approved the amended FY 2011 Capital Improvement Plan in the
amount of $32,437,959 on July 25, 2011.
-------------------------------------------------------------------------------------
Attachments:
FY 2011 Capital Improvement Plan Year End Report
50 of 84
1
2
3
4
5
6
7
8
9
10
11
12
13
14
15
16
17
18
19
20
21
22
23
24
25
26
27
28
29
30
31
32
33
34
35
36
37
38
39
40
41
42
43
44
45
46
A C D F G K L N O U
City of Evanston
Capital Improvement Plan - Year-End Report
Sorted by Fund & Funding Source
Fiscal Year 2011
Unspent
Funding Carry Fund Approved 12/31/2011 Project FY12 Carryover
Description Department Source Over Responsible FY11 YTD Expenses Budget Request Project Status
FUND SUMMARY
MFT Fund Funding N/A N/A 1,200,000 680,941 519,059 -
E911 Fund Funding N/A N/A 229,353 242,206 (12,853) -
CDBG Fund Funding N/A N/A 480,000 377,382 102,618 -
Economic Development Funding N/A N/A 80,000 - 80,000 50,000
TIF Funds Funding N/A N/A 1,963,715 763,875 1,199,840 81,000
CIP Fund - General Obligation (GO) Debt N/A N/A 5,078,500 2,504,366 2,574,134 1,396,787
CIP Fund - Fund Reserves N/A N/A 3,375,845 2,244,746 1,497,389 1,316,158
CIP Fund - Grants N/A N/A 4,196,473 875,103 3,321,370 1,474,000
CIP Fund - Loan N/A N/A 149,000 42,023 106,977 -
CIP Fund - IDNR Grant Funding N/A N/A 35,000 1,450 33,550 -
CIP Fund - Private Donations N/A N/A 575,000 - 575,000 575,000
SA Fund Funding N/A N/A 1,575,000 1,057,780 517,220 -
Parking Fund Funding N/A N/A 3,242,598 2,297,720 944,878 740,000
Water Fund Funding N/A N/A 7,320,000 4,893,289 2,426,711 852,000
Water Fund - Grants N/A N/A 350,000 330,844 19,156 350,000
Water Fund - Insurance N/A N/A - 149,810 - -
Sewer Fund Funding N/A N/A 687,475 523,619 163,856 -
Fleet Fund Funding N/A N/A 1,900,000 1,507,398 392,602 -
TOTAL 32,437,959 18,492,552 14,461,507 6,834,945
EXPENDITURE DETAIL
Street Resurfacing - MFT Public Works MFT Revenues MFT 1,200,000 680,941 519,059 - Completed
SUBTOTAL 1,200,000 680,941 519,059 -
AS400 Redundancy Police E911 Revenue E911 45,000 69,145 (24,145) - Completed
UPS (Uninterruptible Power Supply) Replacement Police E911 Revenue E911 35,000 35,000 - - Completed
Radio System Narrowbanding Police E911 Revenue E911 20,000 20,000 - - Completed
Computer / Radio Replacement Police E911 Revenue E911 40,000 40,000 - - Completed
911 Center Flooring (New Funding - FY11) PRCS E911 Revenue E911 3,968 3,968 - - Completed
911 Center flooring (Carryover) PRCS E911 Revenue Yes E911 8,570 7,140 1,430 - Completed
Phone room A/C unit replacement PRCS E911 Revenue Yes E911 1,882 1,400 482 - Completed
Police 911 Center HVAC Replacement PRCS E911 Revenue Yes E911 74,933 65,553 9,380 - Completed
SUBTOTAL 229,353 242,206 (12,853) -
Page 1 of 851 of 84
1
2
3
4
5
6
7
8
9
A C D F G K L N O U
City of Evanston
Capital Improvement Plan - Year-End Report
Sorted by Fund & Funding Source
Fiscal Year 2011
Unspent
Funding Carry Fund Approved 12/31/2011 Project FY12 Carryover
Description Department Source Over Responsible FY11 YTD Expenses Budget Request Project Status
47
48
49
50
51
52
53
54
55
56
57
58
59
60
61
62
63
64
65
66
67
68
69
70
71
72
73
74
ADA Ramps Public Works Grant CDBG CDBG 50,000 45,000 5,000 - Completed
Alley Paving Public Works Grant CDBG CDBG 150,000 8,501 141,499 - Completed
Block Curb & Sidewalk Replacement Public Works Grant CDBG CDBG 100,000 159,048 (59,048) - Completed
Brummel Richmond Park Renovations PRCS Grant CDBG Yes CDBG 50,000 50,000 - - Completed
Fleetwood-Jourdain Center Arts & Crafts Room Renovations PRCS Grant CDBG CDBG 30,000 - 30,000 - Completed
SNAP Lighting Public Works Grant CDBG CDBG 50,000 39,941 10,059 - Completed
Twiggs Park Renovations PRCS Grant CDBG CDBG 50,000 74,892 (24,892) - Completed
SUBTOTAL 480,000 377,382 102,618 -
1817 Church Rehabilitation CED Econ. Develop. ED 30,000 - 30,000 -
Property sale contemplated so
project was not performed.
Grandmother Park PRCS Econ. Develop. ED 50,000 - 50,000 50,000
Project on hold pending
receipt of private donations.
SUBTOTAL 80,000 - 80,000 50,000
Sherman Avenue Public Art PRCS TIF Increment Yes Wash TIF 85,000 - 85,000 81,000
Public Art Selection
Committee has selected a
project and will be making a
recommendation to the
Human Services Committee in
April.
2011 Comprehensive Parking Garage Repair Project PRCS TIF Increment Wash TIF 473,715 - 473,715 -
All work is complete but final
payments to consultant and
contractor pending.
Neighborhood Traffic Calming and Ped/Bike Accom Public Works TIF Increment Wash TIF 10,000 - 10,000 -
Downtown Brick Replacement Program Public Works TIF Increment Wash TIF 205,000 - 205,000 - Completed
SUBTOTAL 773,715 - 773,715 81,000
TIF Assistance for Ward Manufacturing Community Dev. TIF Increment Southwest TIF 700,000 700,000 - - Completed
SUBTOTAL 700,000 700,000 - -
Page 2 of 852 of 84
1
2
3
4
5
6
7
8
9
A C D F G K L N O U
City of Evanston
Capital Improvement Plan - Year-End Report
Sorted by Fund & Funding Source
Fiscal Year 2011
Unspent
Funding Carry Fund Approved 12/31/2011 Project FY12 Carryover
Description Department Source Over Responsible FY11 YTD Expenses Budget Request Project Status
75
76
77
78
79
80
81
82
83
84
85
86
87
88
89
90
91
92
93
94
95
96
97
98
West Evanston Planning Community Dev. TIF Increment Yes West Evanston TIF 200,000 - 200,000 - Deferred
Demo costs Community Dev. TIF Increment Yes West Evanston TIF 60,000 - 60,000 - Deferred
Misc capital project costs Community Dev. TIF Increment Yes West Evanston TIF 230,000 63,875 166,125 - In process
SUBTOTAL 490,000 63,875 426,125 -
Contingency Admin Serv 2011 GO Debt CIP 350,000 - 350,000 - N/A
Accela Software Purchase IT 2011 GO Debt CIP 245,000 243,764 1,236 - Completed
Library Entrance Door Renovation PRCS 2011 GO Debt CIP 10,000 10,000 - - Completed
Ecology Center HVAC Improvements PRCS 2011 GO Debt CIP 15,000 10,294 4,706 - Completed
Brummel Richmond Park Renovations PRCS 2011 GO Debt CIP 20,000 - 20,000 - Completed
Crown Center Improvements - Minor Projects PRCS 2011 GO Debt CIP 20,000 4,500 15,500 6,000
Studio rink painting complete.
Reflective ceiling materials
ordered with install expected
in mid-February. Rink
refrigeration equipment
received with installation
expected in February.
James Park Pavement Repairs PRCS 2011 GO Debt CIP 20,000 57,211 (37,211) - Completed
Crown Center Electrical Panel Replacements PRCS 2011 GO Debt CIP 30,000 7,890 22,110 - Completed
James Park Irrigation System Improvements PRCS 2011 GO Debt CIP 80,000 80,000 - - Completed
Service Center Fleet Service Make-Up Air Unit PRCS 2011 GO Debt CIP 85,000 86,458 (1,458) -
All work is complete but final
payment to contractor is
pending.
Service Center BAS Replacement PRCS 2011 GO Debt CIP 100,000 97,000 3,000 - Completed
Ecology Center Greenhouse PRCS 2011 GO Debt CIP 125,000 - 125,000 125,000
Project is on hold pending
direction from the CMO.
Library Chiller Replacement PRCS 2011 GO Debt CIP 275,000 256,092 18,908 - Completed
Emerson/Green Bay Pedestrian Safety Improvement Public Works 2011 GO Debt CIP 100,000 10,289 89,711 - Completed
Chicago Ave. Signals CMAQ Construction/CBBEL (CE &
Const.)
Public Works 2011 GO Debt CIP 260,000 - 260,000 75,000
Complete - IDOT final
reimbursement invoice yet to
be received
Sheridan/Isabella (JTW/ Wilmette) Public Works 2011 GO Debt CIP 270,000 - 270,000 270,000
Completed - Awaiting Bill from
IDOT
Sheridan Rd Resurface-Burnham to Chicago (CE, Const.)-
IDOT
Public Works 2011 GO Debt CIP 400,000 274,516 125,484 150,000 Completed
Traffic Signal Upgrades - Sheridan Road - (DE, CE & Const.) Public Works 2011 GO Debt CIP 476,000 - 476,000 411,000 Deferred to 2012
Page 3 of 853 of 84
1
2
3
4
5
6
7
8
9
A C D F G K L N O U
City of Evanston
Capital Improvement Plan - Year-End Report
Sorted by Fund & Funding Source
Fiscal Year 2011
Unspent
Funding Carry Fund Approved 12/31/2011 Project FY12 Carryover
Description Department Source Over Responsible FY11 YTD Expenses Budget Request Project Status
99
100
101
102
103
104
105
106
107
108
109
110
111
112
113
114
115
116
City Works - Sign Inventory Public Works 2011 GO Debt CIP 100,000 46,594 53,406 55,000
Project expected to be
completed by end of Spring
2012
Chicago Avenue Streetscape - Reimbursement to IDOT Public Works 2011 GO Debt CIP 250,000 - 250,000 250,000 Deferred to 2012
Fire Station 1 Mechanical Upgrade PRCS 2011 GO Debt CIP 20,000 627 19,373 5,000
Project is currently being
designed. Construction
funding has been provided in
2012 CIP.
Fire #2 Boiler/Chimney & Apparatus Floor Heating
Replacement
PRCS 2011 GO Debt CIP 20,000 - 20,000 -
Project is currently being
designed. Construction
funding has been provided in
2012 CIP.
Service Center Renovations - Locker Room Renovation Public Works 2011 GO Debt CIP 37,500 29,436 8,064 7,500
Project is under construction.
Construction funding provided
in 2012 CIP.
Civic Center Renovation PRCS 2011 GO Debt CIP 450,000 264,768 185,232 42,287
All work is complete except
Fire Pump replacement which
is currently under construction
and scheduled for completion
in April.
Service Center Parking Deck Repairs Public Works 2011 GO Debt CIP 50,000 27,160 22,840 - In process
CIP Street Resurfacing - Watermain Projects I Public Works 2011 GO Debt CIP 1,270,000 997,767 272,233 - Completed
SUBTOTAL 5,078,500 2,504,366 2,574,134 1,396,787
Services to General Fund Admin Serv 2010 GO Debt CIP 300,000 300,000 - - Completed
West Evanston Planning Community Dev. 2010 GO Debt Yes CIP 50,000 - 50,000 - In process
Police Investigations Furniture Replacement Police 2010 GO Debt Yes CIP - 201 - -
Evanston Digital Camera System Police 2010 GO Debt Yes CIP - 136,625 - -
311 Center - CIP Expenses PRCS 2011 GO Debt Yes CIP 28,000 6,730 21,270 - Completed
Animal Shelter Renovation PRCS 2010 GO Debt Yes CIP 98,102 - 98,102 98,102
Project was delayed due to
City's consideration to develop
property. Project now delayed
due to scope coordination
issues with new sports
complex group who plan to
develop the Recycling Center.
Brummel Richmond Park Renovations PRCS 2010 GO Debt Yes CIP 278,259 213,767 64,492 - Completed
Page 4 of 854 of 84
1
2
3
4
5
6
7
8
9
A C D F G K L N O U
City of Evanston
Capital Improvement Plan - Year-End Report
Sorted by Fund & Funding Source
Fiscal Year 2011
Unspent
Funding Carry Fund Approved 12/31/2011 Project FY12 Carryover
Description Department Source Over Responsible FY11 YTD Expenses Budget Request Project Status
117
118
119
120
121
122
123
124
125
126
127
128
129
130
131
132
133
134
135
136
137
138
139
140
141
142
143
144
145
146
147
Civic Center Roof PRCS 2010 GO Debt Yes CIP 105,392 108,412 (3,020) - Completed
Crown Center Improvements PRCS 2010 GO Debt Yes CIP 19,467 19,995 (528) - Completed
Crown Center Partnership Study PRCS 2010 GO Debt Yes CIP 141,445 67,329 74,116 73,070
Proposals were received on
2/23/12
Crown Tennis Courts & Lighting PRCS 20?? GO Debt Yes CIP 53,346 - 53,346 - Completed
Lakefront Master Plan Implementation PRCS 2010 GO Debt Yes CIP 700,000 2,909 697,091 621,238
All work is complete but IDOT
invoicing and final payments
to consultant are pending.
Library Chiller Replacement PRCS 2010 GO Debt Yes CIP 6,600 6,600 - - Completed
Police Firing Range PRCS 2010 GO Debt Yes CIP 422,220 249,976 172,244 -
All work is complete but final
payments to consultant and
contractor are pending.
Twiggs Park Renovations PRCS 2010 GO Debt Yes CIP 218,748 - 218,748 218,748
All work is complete but final
payments to IDOT pending
Evanston Art Center Flat Roof Repair PRCS 2010 GO Debt Yes CIP - 19,960 - -
EECBG - Interior Lights PRCS 2010 GO Debt Yes CIP - 6,310 - -
Fleetwood Jourdain Auto Door Operation Repair PRCS 2010 GO Debt Yes CIP - 4,734 - -
Uninterruptable Power Supply Replacement PRCS 2010 GO Debt Yes CIP - 316 - -
Roof Repair - Fire Stations 1 & 2 PRCS 2010 GO Debt Yes CIP - 6,691 - -
Foster Park PRCS 2010 GO Debt Yes CIP - 400 - -
1817 Church Street PRCS 2010 GO Debt Yes CIP - 2,450 - -
Bridge Rehab Program Public Works 2010 GO Debt Yes CIP 90,000 133,771 (43,771) -
Phase II Engineering has not
started
Chicago Ave Signals CMAQ Constrct/CBBEL (CE & Const) Public Works 2010 GO Debt Yes CIP 40,000 - 40,000 - Completed
City Works Upgrade for PW Field Personnel Public Works 2010 GO Debt Yes CIP 37,746 36,441 1,305 - Completed
CTA Yellow Line Infill Station Study Public Works 2010 GO Debt Yes CIP 55,000 240,631 (185,631) 55,000 Final report being prepared
Downtown Brick Repair Public Works 2010 GO Debt Yes CIP 50,000 284,718 (234,718) - Completed
Lake Street LAPP - IDOT Payment Public Works 2010 GO Debt Yes CIP 471,520 55,285 416,235 250,000 Completed
Traffic Signal Upgrades Sheridan Road Public Works 2010 GO Debt Yes CIP 210,000 151,892 58,108 - Awaiting final invoice
EECBG - Street Light Upgrade Public Works 2010 GO Debt Yes CIP - 188,603 - -
SUBTOTAL 3,375,845 2,244,746 1,497,389 1,316,158
Lakefront Master Plan Implementation PRCS Grant Yes CIP 877,473 - 877,473 - Completed
Bridge Rehab Program (IDOT Reimbursement) Public Works Grant CIP 200,000 - 200,000 - Deferred
Chicago Ave. Streetscape Public Works Grant CIP 800,000 - 800,000 800,000 Deferred to 2012
CTA Yellow Line Infill Station Study Public Works Grant Yes CIP 220,000 - 220,000 - Deferred
Emergency Repair Program - Emerson & Isabella Public Works Grant CIP 1,025,000 875,103 149,897 - Completed
Page 5 of 855 of 84
1
2
3
4
5
6
7
8
9
A C D F G K L N O U
City of Evanston
Capital Improvement Plan - Year-End Report
Sorted by Fund & Funding Source
Fiscal Year 2011
Unspent
Funding Carry Fund Approved 12/31/2011 Project FY12 Carryover
Description Department Source Over Responsible FY11 YTD Expenses Budget Request Project Status
148
149
150
151
152
153
154
155
156
157
158
159
160
161
162
163
164
165
166
167
168
169
170
171
172
173
174
175
176
177
Sheridan Road - Burnham Place to Chicago Avenue (IDOT
Reimb)
Public Works Grant CIP 400,000 - 400,000 - In process
Traffic Signal Upgrades - Sheridan / Chicago Public Works Grant Yes CIP 674,000 - 674,000 674,000 Deferred to 2012
SUBTOTAL 4,196,473 875,103 3,321,370 1,474,000
Infrastructure- servers network and systems IT Loan Yes CIP 149,000 42,023 106,977 - Completed
SUBTOTAL 149,000 42,023 106,977 -
Grandmother Park PRCS IDNR Grant CIP 35,000 1,450 33,550 - Grant not awarded
SUBTOTAL 35,000 1,450 33,550 -
Animal Shelter Renovation PRCS Private Donation Yes CIP 450,000 - 450,000 450,000
Project was delayed due to
City's consideration to develop
property. Project now delayed
due to scope coordination
issues with new sports
complex group who plan to
develop the Recycling Center.
Grandmother Park PRCS Private Donation CIP 125,000 - 125,000 125,000 Donations not received yet.
SUBTOTAL 575,000 - 575,000 575,000
50/50 Sidewalk Public Works SA Reserves Special Assessment 200,000 72,406 127,594 - Completed
Alley Maintenance Public Works SA Reserves Special Assessment 125,000 - 125,000 - Completed
Alley Paving City Share Public Works SA Reserves Special Assessment 350,000 351,290 (1,290) - Completed
Alley Paving City Share - CDBG Match Public Works SA Reserves Special Assessment 150,000 111,149 38,851 - Completed
Alley Paving Private Share Public Works SA Reserves Special Assessment 250,000 200,000 50,000 - Completed
Block Curb & Sidewalk Replacement Public Works SA Reserves Special Assessment 200,000 - 200,000 - Completed
Streetlight Upgrade Program-luminaire Replacement Public Works SA Reserves Special Assessment 100,000 100,000 - - In process
Streetlight Upgrade Program-Power Center Replacement Public Works SA Reserves Special Assessment 100,000 148,631 (48,631) - In process
Striping, Lighting and Signal Maintenance Public Works SA Reserves Special Assessment 100,000 74,304 25,696 - In process
SUBTOTAL 1,575,000 1,057,780 517,220 -
Page 6 of 856 of 84
1
2
3
4
5
6
7
8
9
A C D F G K L N O U
City of Evanston
Capital Improvement Plan - Year-End Report
Sorted by Fund & Funding Source
Fiscal Year 2011
Unspent
Funding Carry Fund Approved 12/31/2011 Project FY12 Carryover
Description Department Source Over Responsible FY11 YTD Expenses Budget Request Project Status
178
179
180
181
182
183
184
185
186
187
188
189
190
191
192
193
194
195
196
197
198
199
200
201
202
203
204
205
206
2011 Comprehensive Parking Garage Repair Project PRCS Parking Parking 2,406,598 2,206,340 200,258 -
All work is complete but final
payments to consultant and
contractor pending.
Parking Lot 60 Membrane Installation PRCS Parking Parking 96,000 91,380 4,620 - Completed
Service Center Parking Deck Repairs Public Works Parking Parking 50,000 - 50,000 50,000 In process
Parking Lot 4 Improvements Public Works Parking Parking 540,000 - 540,000 540,000 Deferred to 2012
Maple Garage Store Front Improvement Public Works Parking Parking 150,000 - 150,000 150,000 Deferred to 2012
SUBTOTAL 3,242,598 2,297,720 944,878 740,000
Tuckpointing Utilities 2011 Water Bonds Yes Water 220,000 - 220,000 -
Project was deferred to pay for
switchgear replacement costs
not covered by insurance
Security Improvements Utilities 2011 Water Bonds Water 50,000 17,054 32,946 - Completed
Zebra Mussel System Repair Utilities 2011 Water Bonds Water 150,000 - 150,000 90,000 Completed
Water Main Installation Utilities 2011 Water Bonds Water 2,890,000 2,162,633 727,367 - Completed
Asbestos Removal Utilities 2011 Water Bonds Water 50,000 37,949 12,051 - Completed
Filter and Filter Roof Rehab Utilities Water Yes Water 2,900,000 2,243,879 656,121 -
Anticipated completion date is
6/30/12
Scada System Improvements Utilities Water Yes Water 950,000 341,774 608,226 640,000
Anticipated completion date is
12/31/12
Switchgear Repair Utilities Water Water - 90,000 (90,000) 12,000
6/30/12 anticipated completion
date
High Lift Window Replacement Utilities Water Water 110,000 - 110,000 110,000 Deferred to 2012
SUBTOTAL 7,320,000 4,893,289 2,426,711 852,000
Scada System Improvements Utilities Water Grant Yes Water 350,000 330,844 19,156 350,000
Anticipated completion date is
12/31/12
SUBTOTAL 350,000 330,844 19,156 350,000
Switchgear Repair Utilities Water - Insurance No Water - 149,810 - -
6/30/12 anticipated completion
date
SUBTOTAL - 149,810 - -
Emergency Sewer Work Utilities 2011 Sewer Bonds Sewer 62,475 - 62,475 -
There were no emergency
sewer repairs in FY2011
Page 7 of 857 of 84
1
2
3
4
5
6
7
8
9
A C D F G K L N O U
City of Evanston
Capital Improvement Plan - Year-End Report
Sorted by Fund & Funding Source
Fiscal Year 2011
Unspent
Funding Carry Fund Approved 12/31/2011 Project FY12 Carryover
Description Department Source Over Responsible FY11 YTD Expenses Budget Request Project Status
207
208
209
210
211
212
213
214
215
216
217
Sewer Lining Utilities 2012 Sewer Bonds Sewer 250,000 250,000 - - Completed
Sewer Repairs on Street Improvements Utilities 2011 Sewer Bonds Sewer 375,000 273,619 101,381 - Completed
SUBTOTAL 687,475 523,619 163,856 -
Fleet Capital Replacements Public Works / Fleet Fleet Revenues Fleet 1,900,000 1,507,398 392,602 - Completed
SUBTOTAL 1,900,000 1,507,398 392,602 -
TOTAL EXPENDITURES 32,437,959 18,492,552 14,461,507 6,834,945
Page 8 of 858 of 84
Page 1 of 3
For City Council meeting of May 21, 2012 Item SP6
Resolution 44-R-12: Amending the FY 2012 Budget
For Action
To: Honorable Mayor and Members of the City Council
From: Martin Lyons, Assistant City Manager/Chief Financial Officer
Subject: Resolution 44-R-12 Amending the FY 2012 Budget
Date: May 10, 2012
Recommended Action:
Staff recommends approval of Resolution 44-R-12 – Authorization to amend the FY
2012 Budget. The proposed amendment would increase the FY 2012 Budget
Appropriation by $7,393,000, from $250,096,993 to $257,489,993.
Funding Source:
The funding adjustments associated with the proposed FY 2012 Budget Amendment
are summarized in the table below:
Fund Amount
General Fund (Reserves) $ 1,750,000
Southwest II (Howard-Hartrey) TIF Fund (Reserves) 2,800,000
Howard-Ridge TIF Fund (G.O. Bonds) 470,000
Capital Improvement Fund (Transfer from General Fund) 1,273,000
Equipment Replacement Fund (Reserves & Transfers) 1,100,000
Total Appropriation Amendment Requested: $ 7,393,000
Summary:
Staff recommends approval of Resolution 44-R-12 – Authorization to amend the FY
2012 Budget. The proposed amendment would increase the FY 2012 Budget
Appropriation by $7,393,000, from $250,096,993 to $257,489,993. An explanation of
the proposed FY 2012 Budget Amendment is provided below:
• General Fund – The proposed FY 2012 Budget Amendment would increase
General Fund expenditures by $1,750,000. The General Fund transfer is
proposed for $1,250,000 to the Capital Improvement Fund (CIF) and the
remaining $500,000 to the Equipment Replacement Fund.
Memorandum
59 of 84
Page 2 of 3
• Southwest II (Howard-Hartrey) TIF Fund – The proposed FY 2012 Budget
Amendment would increase the Southwest II (Howard-Hartrey) TIF Fund
expenditures by $2,800,000. $1.3M of this amendment provides for the surplus
distribution from Howard-Hartrey to all taxing bodies. The surplus distribution
resolution will be provided to the City Council at the May 29, 2012 meeting.
In addition, as part of public infrastructure improvements for the Howard-Hartrey
TIF Fund (Southwest II TIF), the following projects, totaling $1.5M are proposed:
o Installation of sidewalk and pedestrian lighting along access drive parallel
to Hartrey from Howard Street North to Target - $350,000
o Installation of a new bus shelter at Howard Street and Access Drive
(Hartrey) including bump out - $250,000
o Streetscape improvement along Hartrey from Howard Street to the Dead
end on east side of wall including the gateway into James park - $550,000
o Howard Street and Jewel Osco Driveway reconfiguration, bump out and
bus shelter - $350,000
• Howard-Ridge TIF Fund – The proposed FY 2012 Budget Amendment would
increase the Howard-Ridge TIF Fund expenditures by $470,000 for capital
projects. The adopted FY 2012 CIP included $430,000 for economic
development projects in the Howard-Ridge TIF. The proposed amendment
would replace this item with the project “CIP Improvements on City Owned
Buildings” in the amount of $900,000.
• Capital Improvement Fund – On March 19, 2012, the City Council approved
additional modifications to the 2012 Street Resurfacing and Street Light Power
Center projects. These modifications totaled $1.25M and will be funded through
a transfer from the General Fund to the Capital Improvements Fund. A summary
of the projects included in this modification is provided below:
Funding
Description Source Fund Amount
Asbury Avenue (Central to Chancellor) General Fund Transfer CIP 60,000$
Bennett Avenue (Simpson to Payne) General Fund Transfer CIP 71,000$
Brummel Street (Ridge to Elmwood) General Fund Transfer CIP 70,000$
Dewey Avenue (Kirk to Oakton) General Fund Transfer CIP 82,000$
Elmwood Avenue (Lee to Crain) General Fund Transfer CIP 193,000$
Hartrey Avenue (Lincoln to Central) General Fund Transfer CIP 120,000$
Isabella Street (Highland to Central) General Fund Transfer CIP 70,000$
Jenks Street (Eastwood - Dead End East) General Fund Transfer CIP 30,000$
Milburn Street (Ridge to Orrington, Dead End) General Fund Transfer CIP 180,000$
Pitner Avenue (Lee to Greenleaf) General Fund Transfer CIP 124,000$
Street Light Power Center Reserves General Fund Transfer CIP 250,000$
TOTAL 1,250,000$
In addition to the modifications listed above, staff proposes two new projects for
inclusion in the amended FY 2012 CIP. The first item is the Noyes Roof project
60 of 84
Page 3 of 3
totaling $120,000 to be funded by Capital Improvement Fund grants. The
second item is the installation of seven public streetlights in the right-of-way
parallel to the new AMLI development. The total proposed budget for this item
is $40,000, which will be added to the Chicago Avenue Streetscape Project.
Finally, several Capital Improvement Fund project budget adjustments are
proposed to reflect favorable bid pricing, project revisions and additional funding
sources. A complete list of the proposed Capital Improvement Fund
modifications has been provided as an attachment to this report.
• Equipment Replacement Fund – The proposed FY 2012 Budget Amendment
would increase expenditures for the Equipment Replacement Fund by
$1,100,000 for additional vehicle purchases. This item will be partially funded by
the surplus transfer of $500,000 from the General Fund and from Equipment
Replacement Fund reserves.
No new revenues are proposed or needed to fund this amendment.
Legislative History:
N/A
-------------------------------------------------------------------------------------
Attachments:
Resolution 44-R-12 – Budget Amendment
General Fund Budget Summary
Howard-Hartrey (Southwest II) TIF Fund Summary
Howard-Ridge TIF Fund Summary
Capital Improvement Fund Summary
Equipment Replacement Fund Summary
Proposed FY 2012 Capital Improvement Plan Amendment
61 of 84
05/14/2012
44-R-12
A RESOLUTION
Authorizing the City of Evanston City Manager to Increase the
Total Fiscal Year 2012 Appropriation
$7,393,000.00, to a New Total of $257,489,993.00
WHEREAS, a total appropriation amendment for seven million,
three hundred ninety-three thousand dollars ($7,393,000.00) is required due to
the following items:
a) General Fund $ 1,750,000.00
b) Southwest II (Howard-Hartrey) TIF Fund 2,800,000.00
c)
d)
e)
Howard-Ridge TIF Fund
Capital Improvement Fund
Equipment Replacement Fund
470,000.00
1,273,000.00
1,100,000.00
Total Appropriation Amendment Requested: $ 7,393,000.00
NOW, THEREFORE, BE IT RESOLVED BY THE CITY COUNCIL
OF THE CITY OF EVANSTON, COOK COUNTY, ILLINOIS:
SECTION 1: That the foregoing recitals are hereby found as fact
and made a part hereof.
SECTION 2: That the Council authorize the Fiscal Year 2012
appropriation be increased from two hundred and fifty million, ninety-six
thousand, nine-hundred and ninety-three dollars ($250,096,993.00) to two
hundred fifty-seven million, four hundred and eighty-nine thousand, nine-hundred
62 of 84
44-R-12
~2~
and ninety-three dollars ($257,489,993.00), as summarized in the document
attached hereto and incorporated herein as Exhibit A.
SECTION 3: That approval of this resolution shall authorize the
City Manager to expend and/or encumber up to two hundred fifty-seven million,
four hundred and eighty-nine thousand, nine-hundred and ninety-three dollars
($257,489,993.00) for Fiscal Year 2012 for all Funds.
SECTION 4: That this Resolution shall be in full force and effect
from and after the date of its passage and approval in the manner
provided by law.
_______________________________
Elizabeth B. Tisdahl, Mayor
Attest:
_______________________________
Rodney Greene, City Clerk
Adopted: __________________, 2012
63 of 84
44-R-12
~3~
City of Evanston- Fiscal Year 2012 - Amended Budget Summary
Fund Name Fund #
2012 Amended
Budget
General 100 84,446,543$
Homelessness Prev. & Rapid Re-Housing Program 190 80,000
Neighborhood Stabilization Program 195 7,449,363
Motor Fuel 200 2,236,990
Emergency Telephone 205 1,266,845
Special Service Area # 4 210 398,000
CDBG 215 1,696,193
CDBG Loan 220 20,000
Economic Development 225 2,393,618
Neighborhood Improvement 235 50,000
HOME 240 663,958
Affordable Housing Fund 250 230,590
Library Fund 260 4,649,599
Washington National TIF 300 7,978,376
Special Service Area # 5 305 423,232
Southwest II TIF (Howard-Hartrey) 310 3,656,203
Southwest TIF 315 608,920
Debt Service (G.O. Bonds) 320 13,122,403
Howard-Ridge TIF 330 2,037,736
West Evanston TIF 335 4,020,000
Capital Improvement 415 13,990,358
Special Assessment 420 1,472,660
Parking 505 15,251,140
Water 510 20,663,758
Sewer 515 21,461,143
Solid Waste 520 5,187,861
Fleet 600 5,718,513
Equipment Replacement 601 3,550,000
Insurance 605 16,765,991
Fire Pension 700 7,109,000
Police Pension 705 8,891,000
Total All Funds 257,489,993$
City of Evanston
Budget Summary of All Funds
Fiscal Year 2012
64 of 84
Proposed
2010-2011 2011 2011 Budget-to-Budget 2012 Budget 2012 Budget 2012 Budget
Actual Budget* Estimate*
Increase
(Decrease)
Proposed Adjustments Amendment
Operating Revenue
Property Tax 16,159,345$ 16,516,200$ 16,546,460$ $ 33,400 16,549,600$ (4,253,214)$ 12,296,386$
Other Taxes 37,870,903 31,028,488 30,938,488 8,255,979 39,284,467 103,463$ 39,387,930
Licenses/Permits/Fees 8,667,275 7,293,557 7,465,902 1,304,454 8,598,011 54,850$ 8,652,861
Fines and Forfeitures 4,002,700 3,806,864 3,340,670 372,280 4,179,144 542,495$ 4,721,639
Charges for Services 9,702,647 6,048,402 6,348,672 934,449 6,982,851 870,172$ 7,853,023
Intergovernmental Revenue 1,152,632 802,239 748,239 (106,442) 695,797 (25,900)$ 669,897
Other Revenue 3,236,875 1,478,601 1,620,434 (777,618) 700,983 516,000$ 1,216,983
Interest Income 11,454 12,000 12,000 - 12,000 -$ 12,000
Transfers In (Other Funds) 7,608,746 6,790,549 6,774,060 1,099,519 7,890,068 -$ 7,890,068
Library Revenues 113,102 96,582 112,850 23,703 120,285 (120,285)$ -
Total Revenue 88,525,679 73,873,482 73,907,775 11,139,724 85,013,206 (2,312,419) 82,700,787
Operating Expense
Legislative 589,865 523,131 563,323 104,033 627,164 (11,131) 616,033
City Administration 1,921,782 1,675,952 1,321,106 145,930 1,821,882 34,376 1,856,258
Law Department 960,007 828,120 760,793 177,152 1,005,272 (6,165) 999,107
Administrative Services 9,266,548 8,206,488 7,994,305 593,419 8,799,907 (156,710) 8,643,197
Community & Economic Development 3,904,597 2,824,205 2,696,632 580,759 3,404,964 (256,625) 3,148,339
Police Department 22,439,417 20,263,642 20,151,111 4,930,931 25,194,573 (441,635) 24,752,938
Fire & Life Safety Services 12,819,555 11,192,783 11,226,020 2,329,904 13,522,687 (208,066) 13,314,621
Health Department 2,079,737 2,135,313 2,040,321 213,191 2,348,504 65,465 2,413,969
Public Works Department 12,618,306 6,862,268 6,726,621 1,689,616 8,551,884 1,007,576 9,559,460
Public Library 4,214,554 3,708,359 3,662,448 801,240 4,509,599 (4,509,599) -
Parks/Recreation and Comm. Services 16,157,573 15,653,221 15,822,574 1,996,343 17,649,564 (256,943) 17,392,621
Total Expenditures 86,971,941 73,873,482 72,965,254 13,562,518 87,436,000 (4,739,457) 82,696,543
-
Net Surplus (Deficit) 1,553,738$ -$ 942,521$ (2,422,794)$ (2,422,794)$ 2,427,038$ 4,244$
Beginning Fund Balance 14,581,963 15,524,484 15,524,484
Transfer to Capital Improvement Fund (Proposed) (1,250,000)
Transfer to Equipment Replacement Fund (Proposed) (500,000)
Ending Fund Balance 15,524,484 13,101,690 13,778,728
City of Evanston
General Fund Summary (Fund #100)
65 of 84
Howard-Hartrey TIF (Southwest II) Debt Service Fund Summary (Fund #310)
Financial Summary
2011 2011 2012
2010-11 Adopted Estimated Adopted
Actual Budget Actual Budget
Revenue By Source
Net Property Tax Increment 883,463 1,300,000 1,073,000 1,073,000
Interest Income 1,549 5,000 5,000 5,000
Total Revenue 885,012 1,305,000 1,078,000 1,078,000
Expenditures
1994 & 1996 Bonds (refunded by 1999 and then
2008D bonds) Principal
535,000 570,000 570,000 605,000
1994 & 1996 Bonds (refunded by 1999 and then
2008 D bonds) Interest
170,483 141,804 141,804 109,603
Other Expenses 785 460,000 - -
Capital Projects - - - 1,500,000
Surplus Distribution to General Fund - - - 1,300,000
Operating Transfer to General Fund 141,600 141,600 141,600 141,600
Total Expenditures 847,868 1,313,404 853,404 3,656,203
Net Surplus (Deficit) 37,144 (8,404) 224,596 (2,578,203)
Beginning Fund Balance 5,174,621 5,211,765 5,436,361
Ending Fund Balance 5,211,765 5,436,361 2,858,158
Description of Major Activities
City of Evanston
The City Council adopted the Southwest II Tax Increment Finance (TIF) District – also called the Howard-
Hartrey TIF – on April 27, 1992. The TIF District consists of a 23-acre site located at 2201 West Howard
Street in the southwest corner of the City. The development consists of a shopping center with several
large stores. The total project cost is estimated to be $39,266,932, of which the City provided $7,390,000
in land acquisition and public improvement costs.
This Fund is responsible for the payment of principal and interest on any outstanding debt service
associated with this TIF. The debt service payment schedule extends through FY2014.
66 of 84
Financial Summary
2011 2011 2012
2010-11 Adopted Estimated Adopted
Actual Budget Actual Budget
Revenue By Source
Net Property Taxes 248,025 689,000 666,700 862,000
Interest Income 239 400 400 400
Miscellaneous 1,126 - - -
Total Revenue 249,390 689,400 667,100 862,400
Expenditures
General Management Support 495,246 - - -
Economic Development Projects - - - 300,000
Capital Improvements - - - 900,000
Developer Agreement Payments - - - 668,836
Repayment to Ec Dev Fund - - - 48,500
Property Acquisitions - - -
Transfer Out- General Fund 120,396 120,400 120,400 120,400
Total Expenditures 615,642 120,400 120,400 2,037,736
Net Surplus (Deficit) (366,252) 569,000 546,700 (1,175,336)
Beginning Fund Balance 1,118,202 751,950 1,298,650
Ending Fund Balance 751,950 1,298,650 123,314
Description of Major Activities
Projects anticipated for 2012 include:
1. Improvements to City-owned commercial building(s) to allow for active re-use of street-level spaces.
2. The possibility of initial reimbursement of TIF increment to the owners of 415 Howard Street, per
the Redevelopment Agreement.
City of Evanston
Howard-Ridge TIF (Fund #330)
The City Council adopted the Howard-Ridge Tax Increment Financing (TIF) District on January 26,
2004. The TIF District is generally bounded on the north by various parcels that front Howard Street
and Chicago Avenue, on the east by the City of Evanston's boundaries and the Chicago Transit
Authority (CTA) Red Line, on the south by City boundaries and on the west by Ridge Avenue. The TIF
District contains mixed residential uses, retail/commercial properties and institutional uses.
67 of 84
Financial Summary
2011 2011 2012
2010-11 Adopted Estimated Adopted
Actual Budget Actual Budget
Revenue By Source
Bond Proceeds 6,572,922 5,078,500 5,177,539 3,900,000
Grants 1,957,587 4,231,473 3,800,000 3,168,000
Private Contributions - 575,000 - 1,301,200
General Fund Allocation - - - 1,250,000
Miscellaneous - 149,000 149,000 -
Interest Income 49,068 - - -
Total Revenue 8,579,577$ 10,033,973$ 9,126,539$ 9,619,200$
Expenditures
Administration - 95,680 102,964 -
Capital Outlay 7,816,007 13,014,138 7,788,631 13,515,358
Interfund Transfers Out 300,000 300,000 300,000 475,000
Total Expenditures 8,116,007$ 13,409,818$ 8,088,631$ 13,990,358$
Net Surplus (Deficit) 463,570$ (3,375,845)$ 1,037,908$ (4,371,158)$
Beginning Fund Balance 5,441,774 5,905,344 6,943,252
Ending Fund Balance 5,905,344 6,943,252 2,572,094
Description of Major Activities
City of Evanston
Capital Improvement Fund (Fund #415)
This Fund accounts for all capital outlay expenditures not included in another Fund as outlined in the
detailed Capital Improvement Plan.
68 of 84
05.21.12 council agenda packet

More Related Content

What's hot

PROCEEDINGS OF A ONE DAY FORUM -final copy
PROCEEDINGS OF A ONE DAY FORUM -final copyPROCEEDINGS OF A ONE DAY FORUM -final copy
PROCEEDINGS OF A ONE DAY FORUM -final copy
Magdaline Agbor
 
Urban infrastructure-india-2011-report
Urban infrastructure-india-2011-reportUrban infrastructure-india-2011-report
Urban infrastructure-india-2011-report
Anuj Chaturvedi
 
Reforms & District Development [Autosaved]
Reforms & District Development [Autosaved]Reforms & District Development [Autosaved]
Reforms & District Development [Autosaved]
Victor lee DANIEL
 

What's hot (20)

Back to Basics Overview Presentation - North West Provincial Launch 2014
Back to Basics Overview Presentation - North West Provincial Launch 2014Back to Basics Overview Presentation - North West Provincial Launch 2014
Back to Basics Overview Presentation - North West Provincial Launch 2014
 
Roll Out of Back to Basics Programme - Western Cape
Roll Out of Back to Basics Programme - Western CapeRoll Out of Back to Basics Programme - Western Cape
Roll Out of Back to Basics Programme - Western Cape
 
Municipal periodic plan in nepalese context [compatibility mode]
Municipal periodic plan in nepalese context [compatibility mode]Municipal periodic plan in nepalese context [compatibility mode]
Municipal periodic plan in nepalese context [compatibility mode]
 
Mbbl model building bylaws 2016
Mbbl  model building bylaws 2016Mbbl  model building bylaws 2016
Mbbl model building bylaws 2016
 
Jnnurm
JnnurmJnnurm
Jnnurm
 
CDBG Recommendations, 08-2013 Somerville, MA- Feldman
CDBG Recommendations, 08-2013 Somerville, MA- FeldmanCDBG Recommendations, 08-2013 Somerville, MA- Feldman
CDBG Recommendations, 08-2013 Somerville, MA- Feldman
 
state of urban service delivery in inda
state of urban service delivery in indastate of urban service delivery in inda
state of urban service delivery in inda
 
State of urban networks and services
State of urban networks and servicesState of urban networks and services
State of urban networks and services
 
Amdavadi
AmdavadiAmdavadi
Amdavadi
 
PROCEEDINGS OF A ONE DAY FORUM -final copy
PROCEEDINGS OF A ONE DAY FORUM -final copyPROCEEDINGS OF A ONE DAY FORUM -final copy
PROCEEDINGS OF A ONE DAY FORUM -final copy
 
Somerville, MA: CDBG Recommendations FY06, from Disability Commission Chair
Somerville, MA: CDBG Recommendations FY06, from Disability Commission ChairSomerville, MA: CDBG Recommendations FY06, from Disability Commission Chair
Somerville, MA: CDBG Recommendations FY06, from Disability Commission Chair
 
National Slum Development Program (NSDP)
National Slum Development Program (NSDP) National Slum Development Program (NSDP)
National Slum Development Program (NSDP)
 
Urban infrastructure-india-2011-report
Urban infrastructure-india-2011-reportUrban infrastructure-india-2011-report
Urban infrastructure-india-2011-report
 
Governance structure mahesana nagarpalika
Governance structure mahesana nagarpalikaGovernance structure mahesana nagarpalika
Governance structure mahesana nagarpalika
 
Basic services to Urban poors(BSUP)
Basic services to Urban poors(BSUP)Basic services to Urban poors(BSUP)
Basic services to Urban poors(BSUP)
 
Stonnington youth strategy 2010 2014
Stonnington youth strategy 2010 2014Stonnington youth strategy 2010 2014
Stonnington youth strategy 2010 2014
 
Jalna Municipal Council Budget Analysis
Jalna Municipal Council Budget AnalysisJalna Municipal Council Budget Analysis
Jalna Municipal Council Budget Analysis
 
2020-24 Consolidated Plan Process
2020-24 Consolidated Plan Process2020-24 Consolidated Plan Process
2020-24 Consolidated Plan Process
 
Smart cities - Comparison among EU models
Smart cities - Comparison among EU modelsSmart cities - Comparison among EU models
Smart cities - Comparison among EU models
 
Reforms & District Development [Autosaved]
Reforms & District Development [Autosaved]Reforms & District Development [Autosaved]
Reforms & District Development [Autosaved]
 

Viewers also liked

Smar tvt june magazine 2013
Smar tvt june magazine 2013Smar tvt june magazine 2013
Smar tvt june magazine 2013
www.SMARTvt.org
 
alltel 3Q05_Highlights
alltel  3Q05_Highlightsalltel  3Q05_Highlights
alltel 3Q05_Highlights
finance27
 
Amalkard 87 abfar kermanshah
Amalkard 87 abfar kermanshahAmalkard 87 abfar kermanshah
Amalkard 87 abfar kermanshah
guest7c1fb78
 
Fizyka dla programistów gier
Fizyka dla programistów gierFizyka dla programistów gier
Fizyka dla programistów gier
Wydawnictwo Helion
 
简单随机抽样
简单随机抽样简单随机抽样
简单随机抽样
dj870127
 

Viewers also liked (20)

Informe Estatístico do Café - Junho 2011‏
Informe Estatístico do Café - Junho 2011‏Informe Estatístico do Café - Junho 2011‏
Informe Estatístico do Café - Junho 2011‏
 
Smar tvt june magazine 2013
Smar tvt june magazine 2013Smar tvt june magazine 2013
Smar tvt june magazine 2013
 
Headless Android at AnDevCon3
Headless Android at AnDevCon3Headless Android at AnDevCon3
Headless Android at AnDevCon3
 
International Journal of Computational Engineering Research(IJCER)
International Journal of Computational Engineering Research(IJCER)International Journal of Computational Engineering Research(IJCER)
International Journal of Computational Engineering Research(IJCER)
 
nucleonicsweek
nucleonicsweeknucleonicsweek
nucleonicsweek
 
Online forum innovation
Online forum innovation Online forum innovation
Online forum innovation
 
Doing Business with Antigua & Barbuda
Doing Business with Antigua & BarbudaDoing Business with Antigua & Barbuda
Doing Business with Antigua & Barbuda
 
May thi cong chuyen dung
May thi cong chuyen dungMay thi cong chuyen dung
May thi cong chuyen dung
 
SAP BI-A
SAP BI-ASAP BI-A
SAP BI-A
 
Paybux by Ingenious Mobile Business
Paybux by Ingenious Mobile BusinessPaybux by Ingenious Mobile Business
Paybux by Ingenious Mobile Business
 
alltel 3Q05_Highlights
alltel  3Q05_Highlightsalltel  3Q05_Highlights
alltel 3Q05_Highlights
 
Amalkard 87 abfar kermanshah
Amalkard 87 abfar kermanshahAmalkard 87 abfar kermanshah
Amalkard 87 abfar kermanshah
 
Erwin. aplicando la evidencia
Erwin. aplicando la evidenciaErwin. aplicando la evidencia
Erwin. aplicando la evidencia
 
Fizyka dla programistów gier
Fizyka dla programistów gierFizyka dla programistów gier
Fizyka dla programistów gier
 
简单随机抽样
简单随机抽样简单随机抽样
简单随机抽样
 
משפט איזבל
משפט איזבלמשפט איזבל
משפט איזבל
 
Rubber Cone Mounts by GMT
Rubber Cone Mounts by GMTRubber Cone Mounts by GMT
Rubber Cone Mounts by GMT
 
2 plan de_ordenamiento_territorial_Ibague
2 plan de_ordenamiento_territorial_Ibague2 plan de_ordenamiento_territorial_Ibague
2 plan de_ordenamiento_territorial_Ibague
 
Pdfnew
PdfnewPdfnew
Pdfnew
 
P kvsh1
P kvsh1P kvsh1
P kvsh1
 

Similar to 05.21.12 council agenda packet

Katie Nash -Street map for Frederick
Katie Nash -Street map for FrederickKatie Nash -Street map for Frederick
Katie Nash -Street map for Frederick
Mike Catoe
 
Indian cst bbmp case study 13 07-2014
Indian cst bbmp case study 13 07-2014Indian cst bbmp case study 13 07-2014
Indian cst bbmp case study 13 07-2014
Raja Seevan
 

Similar to 05.21.12 council agenda packet (20)

Budget Committee Presentation
Budget Committee PresentationBudget Committee Presentation
Budget Committee Presentation
 
Katie Nash -Street map for Frederick
Katie Nash -Street map for FrederickKatie Nash -Street map for Frederick
Katie Nash -Street map for Frederick
 
Paul O’Day, Part 1: Vision for Highways Maintenance and Management in Birmingham
Paul O’Day, Part 1: Vision for Highways Maintenance and Management in BirminghamPaul O’Day, Part 1: Vision for Highways Maintenance and Management in Birmingham
Paul O’Day, Part 1: Vision for Highways Maintenance and Management in Birmingham
 
Infallibles
InfalliblesInfallibles
Infallibles
 
Secrets of a Successful Land Development Approval Process
Secrets of a Successful Land Development Approval ProcessSecrets of a Successful Land Development Approval Process
Secrets of a Successful Land Development Approval Process
 
jnnurm-100130063313-phpapp01 (1).pptx
jnnurm-100130063313-phpapp01 (1).pptxjnnurm-100130063313-phpapp01 (1).pptx
jnnurm-100130063313-phpapp01 (1).pptx
 
FY16 - City Manager's Budget Message
FY16 - City Manager's Budget MessageFY16 - City Manager's Budget Message
FY16 - City Manager's Budget Message
 
Item # 5 - Water and Wastewater Rate Study
Item # 5 - Water and Wastewater Rate StudyItem # 5 - Water and Wastewater Rate Study
Item # 5 - Water and Wastewater Rate Study
 
Urban Regeneration in Greater Manchester - Professor Steve Curwell
Urban Regeneration in Greater Manchester - Professor Steve CurwellUrban Regeneration in Greater Manchester - Professor Steve Curwell
Urban Regeneration in Greater Manchester - Professor Steve Curwell
 
2023 07 10 City Commission Budget Workshop Agenda Packet
2023 07 10 City Commission Budget Workshop Agenda Packet2023 07 10 City Commission Budget Workshop Agenda Packet
2023 07 10 City Commission Budget Workshop Agenda Packet
 
Play Your Part: Understanding How Cities Can Take Advantage of IRA Grants, Ne...
Play Your Part: Understanding How Cities Can Take Advantage of IRA Grants, Ne...Play Your Part: Understanding How Cities Can Take Advantage of IRA Grants, Ne...
Play Your Part: Understanding How Cities Can Take Advantage of IRA Grants, Ne...
 
Smart city presentation
Smart city presentationSmart city presentation
Smart city presentation
 
SMART CITY.pdf
SMART CITY.pdfSMART CITY.pdf
SMART CITY.pdf
 
2012-2013 Proposed Budget in Brief
2012-2013 Proposed Budget in Brief2012-2013 Proposed Budget in Brief
2012-2013 Proposed Budget in Brief
 
9/8 THUR 14:30 | Regulatory Re-think
9/8 THUR 14:30 | Regulatory Re-think9/8 THUR 14:30 | Regulatory Re-think
9/8 THUR 14:30 | Regulatory Re-think
 
Annual Plan for Fiscal Year 2014 Presentation - Manhattan
Annual Plan for Fiscal Year 2014 Presentation - ManhattanAnnual Plan for Fiscal Year 2014 Presentation - Manhattan
Annual Plan for Fiscal Year 2014 Presentation - Manhattan
 
Evaluations of SEAPs: strengths and weaknesses - Melica
Evaluations of SEAPs: strengths and weaknesses - MelicaEvaluations of SEAPs: strengths and weaknesses - Melica
Evaluations of SEAPs: strengths and weaknesses - Melica
 
Indian cst bbmp case study 13 07-2014
Indian cst bbmp case study 13 07-2014Indian cst bbmp case study 13 07-2014
Indian cst bbmp case study 13 07-2014
 
Somerville FY23 Proposed Budget
Somerville FY23 Proposed BudgetSomerville FY23 Proposed Budget
Somerville FY23 Proposed Budget
 
Manhattan Community Board Budget Training
Manhattan Community Board Budget TrainingManhattan Community Board Budget Training
Manhattan Community Board Budget Training
 

More from cityofevanston

Zs city of evanston presentation 28 january 2015
Zs city of evanston presentation 28 january 2015Zs city of evanston presentation 28 january 2015
Zs city of evanston presentation 28 january 2015
cityofevanston
 

More from cityofevanston (20)

SBA & City of Evanston Economic Injury Webinar - 4/1/2020
SBA & City of Evanston Economic Injury Webinar - 4/1/2020SBA & City of Evanston Economic Injury Webinar - 4/1/2020
SBA & City of Evanston Economic Injury Webinar - 4/1/2020
 
Zs city of evanston presentation 28 january 2015
Zs city of evanston presentation 28 january 2015Zs city of evanston presentation 28 january 2015
Zs city of evanston presentation 28 january 2015
 
Human services funding summit jan 27 2015 presentation
Human services funding summit jan 27 2015 presentationHuman services funding summit jan 27 2015 presentation
Human services funding summit jan 27 2015 presentation
 
Age friendlyhealth summit
Age friendlyhealth summitAge friendlyhealth summit
Age friendlyhealth summit
 
Divvy Community Meeting Presentation
Divvy Community Meeting PresentationDivvy Community Meeting Presentation
Divvy Community Meeting Presentation
 
Human services noyes ctr successes 2014
Human services noyes ctr successes 2014Human services noyes ctr successes 2014
Human services noyes ctr successes 2014
 
Hs cagngfrndlyupdte
Hs cagngfrndlyupdteHs cagngfrndlyupdte
Hs cagngfrndlyupdte
 
Leathers & Associates Penny Park Presentation
Leathers & Associates Penny Park PresentationLeathers & Associates Penny Park Presentation
Leathers & Associates Penny Park Presentation
 
Penny Park Renovations
Penny Park RenovationsPenny Park Renovations
Penny Park Renovations
 
Sheridan Road Improvement Project
Sheridan Road Improvement ProjectSheridan Road Improvement Project
Sheridan Road Improvement Project
 
FY 2014 Second Quarter Financial Review
FY 2014 Second Quarter Financial ReviewFY 2014 Second Quarter Financial Review
FY 2014 Second Quarter Financial Review
 
SP1 Second Quarter Financial Review
SP1 Second Quarter Financial ReviewSP1 Second Quarter Financial Review
SP1 Second Quarter Financial Review
 
A5 Chicago Ave Project Plan
A5 Chicago Ave Project PlanA5 Chicago Ave Project Plan
A5 Chicago Ave Project Plan
 
P1 Sports Dome Planned Development
P1 Sports Dome Planned DevelopmentP1 Sports Dome Planned Development
P1 Sports Dome Planned Development
 
Sheridan Road City Council Presentation
Sheridan Road City Council PresentationSheridan Road City Council Presentation
Sheridan Road City Council Presentation
 
Sp1 2013 street resurfacing presentation
Sp1 2013 street resurfacing presentationSp1 2013 street resurfacing presentation
Sp1 2013 street resurfacing presentation
 
Presentation - japanese visitors
Presentation - japanese visitorsPresentation - japanese visitors
Presentation - japanese visitors
 
Evanston committee 3 5-2012
Evanston committee 3 5-2012Evanston committee 3 5-2012
Evanston committee 3 5-2012
 
A8 a10 chicago main intro of ordinances 2012 12/10
A8 a10 chicago main intro of ordinances 2012 12/10A8 a10 chicago main intro of ordinances 2012 12/10
A8 a10 chicago main intro of ordinances 2012 12/10
 
Council meeting 3.20.12 cross fit e-town
Council meeting 3.20.12  cross fit e-townCouncil meeting 3.20.12  cross fit e-town
Council meeting 3.20.12 cross fit e-town
 

Recently uploaded

2024 asthma jkdjkfjsdklfjsdlkfjskldfgdsgerg
2024 asthma jkdjkfjsdklfjsdlkfjskldfgdsgerg2024 asthma jkdjkfjsdklfjsdlkfjskldfgdsgerg
2024 asthma jkdjkfjsdklfjsdlkfjskldfgdsgerg
MadhuKothuru
 
Unique Value Prop slide deck________.pdf
Unique Value Prop slide deck________.pdfUnique Value Prop slide deck________.pdf
Unique Value Prop slide deck________.pdf
ScottMeyers35
 
Top profile Call Girls In Haldia [ 7014168258 ] Call Me For Genuine Models We...
Top profile Call Girls In Haldia [ 7014168258 ] Call Me For Genuine Models We...Top profile Call Girls In Haldia [ 7014168258 ] Call Me For Genuine Models We...
Top profile Call Girls In Haldia [ 7014168258 ] Call Me For Genuine Models We...
gajnagarg
 

Recently uploaded (20)

Kolkata Call Girls Halisahar 💯Call Us 🔝 8005736733 🔝 💃 Top Class Call Girl ...
Kolkata Call Girls Halisahar  💯Call Us 🔝 8005736733 🔝 💃  Top Class Call Girl ...Kolkata Call Girls Halisahar  💯Call Us 🔝 8005736733 🔝 💃  Top Class Call Girl ...
Kolkata Call Girls Halisahar 💯Call Us 🔝 8005736733 🔝 💃 Top Class Call Girl ...
 
Private Call Girls Bidar 9332606886Call Girls Advance Cash On Delivery Service
Private Call Girls Bidar  9332606886Call Girls Advance Cash On Delivery ServicePrivate Call Girls Bidar  9332606886Call Girls Advance Cash On Delivery Service
Private Call Girls Bidar 9332606886Call Girls Advance Cash On Delivery Service
 
Just Call VIP Call Girls In Bangalore Kr Puram ☎️ 6378878445 Independent Fem...
Just Call VIP Call Girls In  Bangalore Kr Puram ☎️ 6378878445 Independent Fem...Just Call VIP Call Girls In  Bangalore Kr Puram ☎️ 6378878445 Independent Fem...
Just Call VIP Call Girls In Bangalore Kr Puram ☎️ 6378878445 Independent Fem...
 
2024 asthma jkdjkfjsdklfjsdlkfjskldfgdsgerg
2024 asthma jkdjkfjsdklfjsdlkfjskldfgdsgerg2024 asthma jkdjkfjsdklfjsdlkfjskldfgdsgerg
2024 asthma jkdjkfjsdklfjsdlkfjskldfgdsgerg
 
Call Girls Mehsana / 8250092165 Genuine Call girls with real Photos and Number
Call Girls Mehsana / 8250092165 Genuine Call girls with real Photos and NumberCall Girls Mehsana / 8250092165 Genuine Call girls with real Photos and Number
Call Girls Mehsana / 8250092165 Genuine Call girls with real Photos and Number
 
Genuine Call Girls in Salem 9332606886 HOT & SEXY Models beautiful and charm...
Genuine Call Girls in Salem  9332606886 HOT & SEXY Models beautiful and charm...Genuine Call Girls in Salem  9332606886 HOT & SEXY Models beautiful and charm...
Genuine Call Girls in Salem 9332606886 HOT & SEXY Models beautiful and charm...
 
Vasai Call Girls In 07506202331, Nalasopara Call Girls In Mumbai
Vasai Call Girls In 07506202331, Nalasopara Call Girls In MumbaiVasai Call Girls In 07506202331, Nalasopara Call Girls In Mumbai
Vasai Call Girls In 07506202331, Nalasopara Call Girls In Mumbai
 
Cheap Call Girls In Hyderabad Phone No 📞 9352988975 📞 Elite Escort Service Av...
Cheap Call Girls In Hyderabad Phone No 📞 9352988975 📞 Elite Escort Service Av...Cheap Call Girls In Hyderabad Phone No 📞 9352988975 📞 Elite Escort Service Av...
Cheap Call Girls In Hyderabad Phone No 📞 9352988975 📞 Elite Escort Service Av...
 
An Atoll Futures Research Institute? Presentation for CANCC
An Atoll Futures Research Institute? Presentation for CANCCAn Atoll Futures Research Institute? Presentation for CANCC
An Atoll Futures Research Institute? Presentation for CANCC
 
74th Amendment of India PPT by Piyush(IC).pptx
74th Amendment of India PPT by Piyush(IC).pptx74th Amendment of India PPT by Piyush(IC).pptx
74th Amendment of India PPT by Piyush(IC).pptx
 
Delivery in 20 Mins Call Girls Malappuram { 9332606886 } VVIP NISHA Call Girl...
Delivery in 20 Mins Call Girls Malappuram { 9332606886 } VVIP NISHA Call Girl...Delivery in 20 Mins Call Girls Malappuram { 9332606886 } VVIP NISHA Call Girl...
Delivery in 20 Mins Call Girls Malappuram { 9332606886 } VVIP NISHA Call Girl...
 
Pakistani Call girls in Sharjah 0505086370 Sharjah Call girls
Pakistani Call girls in Sharjah 0505086370 Sharjah Call girlsPakistani Call girls in Sharjah 0505086370 Sharjah Call girls
Pakistani Call girls in Sharjah 0505086370 Sharjah Call girls
 
NAP Expo - Delivering effective and adequate adaptation.pptx
NAP Expo - Delivering effective and adequate adaptation.pptxNAP Expo - Delivering effective and adequate adaptation.pptx
NAP Expo - Delivering effective and adequate adaptation.pptx
 
Scaling up coastal adaptation in Maldives through the NAP process
Scaling up coastal adaptation in Maldives through the NAP processScaling up coastal adaptation in Maldives through the NAP process
Scaling up coastal adaptation in Maldives through the NAP process
 
Election 2024 Presiding Duty Keypoints_01.pdf
Election 2024 Presiding Duty Keypoints_01.pdfElection 2024 Presiding Duty Keypoints_01.pdf
Election 2024 Presiding Duty Keypoints_01.pdf
 
Unique Value Prop slide deck________.pdf
Unique Value Prop slide deck________.pdfUnique Value Prop slide deck________.pdf
Unique Value Prop slide deck________.pdf
 
Call Girls Basheerbagh ( 8250092165 ) Cheap rates call girls | Get low budget
Call Girls Basheerbagh ( 8250092165 ) Cheap rates call girls | Get low budgetCall Girls Basheerbagh ( 8250092165 ) Cheap rates call girls | Get low budget
Call Girls Basheerbagh ( 8250092165 ) Cheap rates call girls | Get low budget
 
Bhubaneswar Call Girls Bhubaneswar 👉👉 9777949614 Top Class Call Girl Service ...
Bhubaneswar Call Girls Bhubaneswar 👉👉 9777949614 Top Class Call Girl Service ...Bhubaneswar Call Girls Bhubaneswar 👉👉 9777949614 Top Class Call Girl Service ...
Bhubaneswar Call Girls Bhubaneswar 👉👉 9777949614 Top Class Call Girl Service ...
 
Top profile Call Girls In Haldia [ 7014168258 ] Call Me For Genuine Models We...
Top profile Call Girls In Haldia [ 7014168258 ] Call Me For Genuine Models We...Top profile Call Girls In Haldia [ 7014168258 ] Call Me For Genuine Models We...
Top profile Call Girls In Haldia [ 7014168258 ] Call Me For Genuine Models We...
 
Call Girls Koregaon Park - 8250092165 Our call girls are sure to provide you ...
Call Girls Koregaon Park - 8250092165 Our call girls are sure to provide you ...Call Girls Koregaon Park - 8250092165 Our call girls are sure to provide you ...
Call Girls Koregaon Park - 8250092165 Our call girls are sure to provide you ...
 

05.21.12 council agenda packet

  • 1. CITY COUNCIL MEETING CITY OF EVANSTON, ILLINOIS LORRAINE H. MORTON CIVIC CENTER 2100 RIDGE AVENUE, EVANSTON 60201 COUNCIL CHAMBERS Monday, May 21, 2012 7:00 p.m. ORDER OF BUSINESS (I) Roll Call – Begin with Alderman Fiske (II) Mayor Public Announcements and Proclamations Public Works Week – May 20-26, 2012 Recognition for Employees with 25 years or More of Service (III) City Manager Presentations and Announcements Presentation by Constellation Energy Regarding Electricity Aggregation Implementation (IV) Citizen Comment Members of the public are welcome to speak at City Council meetings. As part of the Council agenda, a period for citizen comments shall be offered at the commencement of each regular Council meeting. Those wishing to speak should sign their name, address and the agenda item or topic to be addressed on a designated participation sheet. If there are five or fewer speakers, fifteen minutes shall be provided for Citizen Comment. If there are more than five speakers, a period of forty-five minutes shall be provided for all comment, and no individual shall speak longer than three minutes. The Mayor will allocate time among the speakers to ensure that Citizen Comment does not exceed forty-five minutes. The business of the City Council shall commence forty-five minutes after the beginning of Citizen Comment. Aldermen do not respond during Citizen Comment. Citizen comment is intended to foster dialogue in a respectful and civil manner. Citizen comments are requested to be made with these guidelines in mind. (V) Special Orders of Business (VI) Adjournment 1 of 84
  • 2. City Council Agenda May 21, 2012 Page 2 of 3 5/18/2012 2:27 PM SPECIAL ORDERS OF BUSINESS (SP1) City Council Goal “Visual and Performing Arts” Staff recommends the City Council receive an oral status report on the implementation of the City Council’s goal “Visual and Performing Arts.” For Discussion (SP2) City Council Goal “Efficiency and Effectiveness of Services” Staff recommends City Council review proposed Citywide Performance Measures and receive report on City Council Goal “Efficiency and Effectiveness of Services.” For Discussion (SP3) Update Regarding FY2012 City Council Goals Staff recommends the City Council receive an oral status report on the implementation of the City Council’s FY 2012 goals. For Discussion (SP4) First Quarter Financial Report for FY2012 Staff recommends that City Council accept and place the First Quarter Financial Report for FY 2012 on file. For Action (SP5) FY 2011 Capital Improvement Plan Year End Report Staff recommends the City Council accept and place the Fiscal Year 2011 Capital Improvement Plan Year-End Report on file. For Action (SP6) Resolution 44-R-12 Amending the FY2012 City of Evanston Budget Staff recommends approval of Resolution 44-R-12 – Authorization to amend the FY 2012 Budget. The proposed amendment would increase the FY 2012 Budget Appropriation by $7,393,000, from $250,096,993 to $257,489,993. For Action (SP7) Resolution 45-R-12 Approving the Amended FY 2012 Capital Improvement Program Staff recommends approval of Resolution 45-R-12 amending the FY 2012 Capital Improvement Program (CIP). The proposed resolution would increase the FY 2012 CIP by $3,243,000 from $36,783,358 to $40,026,358. For Action 2 of 84
  • 3. City Council Agenda May 21, 2012 Page 3 of 3 5/18/2012 2:27 PM MEETINGS SCHEDULED THROUGH MAY 2012 Upcoming Aldermanic Committee Meetings Wednesday, May 23 6:00 PM Transportation/Parking Wednesday, May 23 7:00 PM Economic Development Thursday, May 24 5:30 PM Emergency Telephone Board Tuesday, May 29 5:45 PM A&PW, Township and City Council Information is available about Evanston City Council meetings at: www.cityofevanston.org/citycouncil. Questions can be directed to the City Manager’s Office at 847-866-2936. The City is committed to ensuring accessibility for all citizens. If an accommodation is needed to participate in this meeting, please contact the City Manager’s Office 48 hours in advance so that arrangements can be made for the accommodation if possible. 3 of 84
  • 4. For City Council meeting of May 21, 2012 Item SP1 Council Goal: “Visual and Performing Arts” For Discussion To: Honorable Mayor and Members of the City Council From: Wally Bobkiewicz, City Manager Subject: City Council Goal – “Visual and Performing Arts” Date: May 18, 2012 Recommended Action: Staff recommends the City Council receive an oral status report on the implementation of the City Council’s goal “Visual and Performing Arts.” Summary: Staff will make a presentation on efforts going on community-wide in the area of visual and performing arts. Staff will also discuss a proposed plan to develop a citywide arts plan. Memorandum 4 of 84
  • 5. Page 1 of 2 For City Council meeting of May 21, 2012 Item SP2 Council Goal: “Efficiency and Effectiveness of Services” For Discussion To: Honorable Mayor and Members of the City Council From: Godwin Chen, ICMA Fellow Subject: City Council Goal “Efficiency and Effectiveness of Services” Date: May 18, 2012 Recommended Action: Staff recommends City Council review proposed Citywide Performance Measures and receive report on City Council Goal “Efficiency and Effectiveness of Services.” Summary: In pursuing the City Council’s goal of improving the “Efficiency and Effectiveness of Services,” staff has compiled the attached list of Citywide Performance Measures (CPM). As part of this process, Departments were asked to identify performance measures for benchmarking City operations and service provision to the public. These performance measures aim to capture all major operational activities of the organization and yield meaningful and actionable information which can be utilized by the City Council, managerial staff, residents and other community stakeholders. Where possible, the Citywide Performance Measures were created utilizing the guidance of standardized measures established by the International City / County Managers Association (ICMA). However, the City of Evanston also provides services which are relatively unique in comparison with other communities. To address this issue, the performance measures developed by the Health and Utilities Departments utilized industry standards and federal and state reporting requirements. A staff team reviewed the proposed performance measures submitted by each Department and compiled the CPM list, which has been provided as an attachment to this report. As mentioned above, the overarching goal of the CPM process is to improve the “Efficiency and Effectiveness of Services” by consolidating all major Citywide performance measures into a single report. The implementation of the CPM Report will provide the City Council and public with a simplified tool for quickly and easily assessing the effectiveness of City service provision. With City Council approval, the CPM will be collected and compiled on a semi-annual basis, and reports will be provided during the mid-year and year-end City Council meetings. In addition, the CPM Report will be published on the City website to address the City’s ongoing transparency efforts. Memorandum 5 of 84
  • 6. Page 2 of 2 Attachments Citywide Performance Measures (CPM) 6 of 84
  • 7. CITY OF EVANSTON FY 2012 COMPREHENSIVE PERFORMANCE MEASURES # Department Objective Performance Measure Calculation Guidance 1 City Manager's Office Sustainability - Reduce Energy Usage Total energy savings Citywide during a specific period of time calculated in terms of kWh and Therms. 2 City Manager's Office Sustainability Annual grant funding secured. Total value of grants and support received for sustainability projects calculated in terms of annual dollar value. 3 City Manager's Office Citizen Engagement Percentage of 311 requests completed within established service level agreement. 4 City Manager's Office Citizen Engagement Number of administrative services assumed by 311. 5 City Manager's Office Citizen Engagement Change in number of subscribers to City communication channels annually. 6 City Manager's Office Intergovernmental Affairs Federal, State and Regional dollars given/savings to City of Evanston projects in a given year (grants included). 7 City Manager's Office Event and Activities Number of citizen engagement events and/or activities. 8 Law Ordinance Prosecution Ordinance cases prosecuted during a specified period of time (animal, aggressive panhandling, curfew, disorderly conduct). 9 Law Traffic Prosecution Traffic prosecution cases during a specific period of time. 10 Law Ordinances and resolutions Ordinances and resolutions written and/or reviewed during a specific period of time. 11 Law Loss minimization/Risk Management Cases tried to verdict. Result of same, won at summary judgment or dismissal stage, or litigation that resulted in no adverse impact to the City. 12 Law Administrative adjudication Number of administrative adjudication cases tried per year (including appeals). 13 Administrative Services Purchasing Calendar days from requisition to purchase order (formal and informal bids). Average number of days from requisition to purchase order during a specific period of time. 14 Administrative Services Human Resources Calendar days from requisition to hire/recruitment for internal and external hires. Average number of days from requisition to hire/recruitment during a specific period of time. 15 Administrative Services Telephone System and Network Problem Resolution/Repair Percentage of telephone system and network problems corrected within 48 hours during a specific period of time. 16 Administrative Services Finance / Accounting Total number of financial reporting documents published and/or certified during a specific period of time. 17 Administrative Services Parking Number of parking tickets issued and parking-related revenue generated during a specific period of time. Page 1 of 4 7 of 84
  • 8. CITY OF EVANSTON FY 2012 COMPREHENSIVE PERFORMANCE MEASURES # Department Objective Performance Measure Calculation Guidance 18 Community & Economic Dev. Property Maintenance Compliance Total inspections performed per 1,000 population. Total Property Maintenance Compliance Inspections per 1,000 of City population (Evanston population = 74,486 per 2010 Census) 19 Community & Economic Dev. Plan Reviews Average number of days to review Single Family & Accessory Structures and Commercial & Accessory Structures. 20 Community & Economic Dev. New Businesses No. of announced economic development projects with no. of new jobs and expected private investment. This measure requires three numbers: No. of announced projects per year, No. of jobs projected with each announcement and it private investment (capital). 21 Community & Economic Dev. Affordable Housing Production/Rehab Number of housing units (owner and rental) improved per $100,000 of grant funding. 22 Community & Economic Dev. Zoning Reviews Average number of days to review Zoning Analysis Application. 23 Police Crime Rates Benchmark of crime level against that of other communities. 24 Police Calls for Service Number of police calls per 1,000 residential population compared with the percentage of dispatched police calls. 25 Police Peacekeeping and Domestic Quarrels Number of domestic quarrels, referrals to Victim Services and follow-on services provided. 26 Police Crimes Solved Percentage of UCR (Uniform Crime Reports) Part I Crimes Cleared. Part I Crimes as defined by FBI's Uniform Crime Reports 27 Police Response Time Response time in minutes to Top Priority Calls. Locally defined "Top Priority Calls." 28 Police Seizure Data Benchmark of quantity of illicit drugs and firearms seized against that of other communities. 29 Police FTE to Population Sworn and civilian FTE's per 1,000. 30 Fire Response Time Percentage of emergency fire calls with a response time of five minutes and under from dispatch to arrival on scene, compared with square miles served per fire Suppression Station, and compared with population density. This measure requires four numbers: "Percent of calls with response time of five minutes or less," "Total square miles of the City," "Number of fire stations" and "Population served" 31 Fire Fire Incidents Fire Incidents confined to room of origin. 32 Fire Injuries Number of on the Job (OJI) related injuries per 100 members that resulted in time lost from duty in a 1 year period. 33 Fire Vehicle Accidents Job related vehicle crashes, deemed preventable, per 100 members in a 1 year period. Page 2 of 4 8 of 84
  • 9. CITY OF EVANSTON FY 2012 COMPREHENSIVE PERFORMANCE MEASURES # Department Objective Performance Measure Calculation Guidance 34 Fire FTE to Population Sworn and civilian FTE's per 1,000 population. 35 Fire EMS Response Time Emergency responses (in seconds). CAD Dispatch Time to Arrival on Scene 36 Fire Turnout Time for emergency and non-emergency alarms. Time from Dispatch to the time of Enroute to Scene. 37 Health Communicable Disease Epidemiological Investigations Number of investigations and complaints. This measure requires total number of investigations, total number of lab reports, and total number of investigations initiated following lab reports 38 Health Educational Outreach Number of individuals reached by educational activities per 1,000 population. 39 Health Health Inspections Number of restaurant, temporary food and farmer's market inspections (cont'd in comment). 40 Health Dental Care Number of visits to dental clinic for preventative and restorative care. 41 Health Vital Records Number of birth and death certificates issued. 42 Public Works Waste Diversion Total waste diversion rate. 43 Public Works Road Rehabilitation Road Rehabilitation Expenditures per paved lane mile. 44 Public Works Timely Capital Improvements Percentage of capital improvement projects on time and under budget. 45 Public Works Resident Satisfaction Survey of residents impacted by all Public Works projects. 46 Public Works Time to complete maintenance and minor repairs Percent of minor vehicle repairs completed within 2 days and percent of preventative maintenance completed within 30 days of due date. 47 Public Works Cost of maintenance and minor repairs Average maintenance and repair cost per vehicle. 48 Public Works Snow Removal Snow and ice control expenditures per capita compared with inches of snowfall. This measure requires two numbers: "Snow and ice control expenditures per capita" and "inches of snowfall" 49 Public Works Timely waste and recycling collection Percent of residential and commercial waste and recycling picked up on schedule. 50 Public Works Residential Street Sweeping Street-sweeping expenditures per linear mile swept. 51 Parks, Rec. and Comm. Serv. Youth Employment Percentage of applicants for youth employment and vocational training opportunities who received such opportunities. This measure requires two numbers: Percentage of applicants for youth employment and vocational training 52 Parks, Rec. and Comm. Serv. Facilities Management Total number and response time of completing in-house work orders. 53 Parks, Rec. and Comm. Serv. Forestry Response Total number and response time of completing Forestry Division requests. Page 3 of 4 9 of 84
  • 10. CITY OF EVANSTON FY 2012 COMPREHENSIVE PERFORMANCE MEASURES # Department Objective Performance Measure Calculation Guidance 54 Parks, Rec. and Comm. Serv. Recreation User Activity Evaluate total program participation and recreation services by age and Ward. 55 Parks, Rec. and Comm. Serv. Youth Engagement Evaluate employee and employer satisfaction with youth employment programs. 56 Parks, Rec. and Comm. Serv. Park Attendance Attendance at PR&CS special events and park permits 57 Parks, Rec. and Comm. Serv. Park User Experience User survey of facility conditions, safety and cleanliness. 58 Library Customer Satisfaction Percentage of citizens who rated library service as satisfactory. 59 Library Customer Service Percentage of library users who rated the helpfulness and the general attitude of library staff as satisfactory. 60 Library Collection Percentage of library users who rated the availability of library materials as satisfactory. 61 Library Circulation Number of items circulated per resident. 62 Library Purchasing Costs Number of dollars spent for materials acquisition per resident. 63 Utilities Reliable Distribution Number of customers experiencing disruption. 64 Utilities Water Complaints Number of customer complaints for water's technical quality. 65 Utilities Sewer Complaints Number of customer complaints for sewers' technical quality (seepage, backups, overflows, etc.). 66 Utilities Employee Health and Safety Benchmark days lost from work due to illness or injury again. 67 Utilities Regulatory Compliance Number of EPA regulatory violations. 68 Utilities Water Main Failure Rate Number of known breaks/leaks per mile of water main. 69 Utilities Water Sales Millions of gallons of water sold to outside communities. Page 4 of 4 10 of 84
  • 11. For City Council meeting of May 21, 2012 Item SP3 Presentation: FY2012 City Council Goals For Discussion To: Honorable Mayor and Members of the City Council From: Wally Bobkiewicz, City Manager Subject: Update – FY 2012 City Council Goals Date: May 18, 2012 Recommended Action: Staff recommends the City Council receive an oral status report on the implementation of the City Council’s FY 2012 goals. Summary: This evening’s City Council meeting will discuss in detail the City Council’s goals pertaining to the arts and efficiency and effectiveness of services. Staff will provide an update on the status of the other City Council goals. Memorandum 11 of 84
  • 12. 7For the City Council Meeting of September 20, 2010 2nd Quarter Financial Report For City Council meeting of May 21, 2012 Item SP4 First Quarter Financial Report for Fiscal Year 2012 For Acceptance and Placement on File To: Honorable Mayor and Members of the City Council From: Marty Lyons, Assistant City Manager/Chief Financial Officer Louis Gergits, Finance Division Manager CC: Wally Bobkiewicz, City Manager Subject: First Quarter Financial Report for Fiscal Year 2012 Date: May 15, 2012 Recommended Action: Staff recommends that City Council accept and place the First Quarter Financial Report for FY 2012 on file. Summary: The City ended the first quarter of the 2012 fiscal year in stable financial condition. The City’s financial performance is the result of revenues remaining relatively consistent with budget targets and expenditures being held below budgeted levels. March represents the third month of the City of Evanston’s 2012 fiscal year. As a result, it is too early to draw any meaningful conclusions or projections relative to the City’s financial performance in FY12. In addition, the City shifted to a calendar fiscal year in FY 2012. As a result, the First Quarter Financial Report for 2012 will not necessarily be comparable to first quarter reports from prior years. Staff will continue to monitor City revenues and expenditures/expenses throughout FY12 and will provide regular updates to the City Council. Attached are summaries of the City’s funds for the first quarter of FY 2012. In reviewing these reports, please note the following: • A majority of the revenues are recorded at the time they are actually received (permits, property taxes, fees, etc.), however, some revenues are recorded at the time of notification of the revenue being earned by the City (sales, income, telecommunications taxes, etc). • State revenue sources are delayed by one to three months based on the revenue Memorandum 12 of 84
  • 13. - 2 - source in question. • While some revenues are received on a monthly basis, other revenues are received less uniformly throughout the year. An example is property taxes, which are billed bi-annually and then distributed by the County as payments are received. This disbursal method contrasts with other revenue sources such as sales taxes, which are collected by the State and distributed on a monthly basis. • Operating expenses, including payroll, are reported at the time they are incurred during the year. At year-end, the City often receives invoices after the close of the year, for services used or items purchased during the year. These expenses are recorded into the previous year for which they were incurred. • Operating expenses are incurred on a uniform basis for items such as payroll, utilities, fuel, etc., and on an as needed basis for supplies, equipment and specific outsourced services. General Fund Revenues: General Fund revenues through the March 31, 2012 were $22,880,530 or 27.7% of budget, or slightly above the 25% budget target. The first quarter performance of major General Fund revenue sources is summarized below: • Through March 31, 2012 property tax revenue was $6,560,873 or 53.4% of budget. • State income tax was recorded in the amount of $1,508,416 through March 31, 2012, achieving 25.8% of the budget target for this revenue item. State income tax is typically received in arrears by one or two months. • Regular sales tax revenue in FY 2012 was $2,057,930 or 22.4% of budget. Home rule sales tax revenue in FY 2012 was $1,308,485 or 21.8% of budget. • Real estate transfer tax through March 31, 2012 totaled $404,201 achieving 23.4% of the budget target for this item. This includes large property sales. • Through March 31, 2012, licenses, permits, and fees were approximately 23.1% of budget. Permit revenue was $623,344 or 16.9% of budget. In comparison, license revenue is $742,908 or 20.4% of target budget. General Fund Expenditures: 13 of 84
  • 14. - 3 - Through March 31, 2012, General Fund expenditures were $18,283,456 or 22.1% of budget for FY 2012. It is important to note, for the General Fund, many expenditures / disbursements are not made evenly throughout the year. For example: • Seasonal employee wages in Parks, Recreation and Community Services are typically charged during the summer months. • Police Department assigns additional patrol details during the summer months. • While the previous winter was relatively mild, certain overtime wages in Public Works for services such as snow/ice removal may occur during the months of November and December. Due to the uneven disbursements of many General Fund expenditures, it will be difficult to project FY 2012 expenditure totals until additional monthly financial data is available. Staff will continue to monitor expenditures throughout the year and will provide regular reports to the City Council and public. Enterprise Funds: Revenues and expenses for the Parking, Water, Sewer and Solid Waste Funds were all below the 25% budget target. Similar to the General Fund, many enterprise fund revenues and expenses / disbursements do not occur evenly throughout the fiscal year. In addition, Water and Sewer Fund revenues are typically lowest during the winter months. As a result, it is difficult to project whether the enterprise funds will perform close to budgeted levels at this time. Staff will continue to monitor and report on the performance of City enterprise fund revenues and expenditures throughout FY 2012. Legislative History: N/A Attachments March 31, 2012 Monthly Financial Report 14 of 84
  • 15. Revenues Budget Actual % of Budget Budget Actual % of Budget Budget Actual % of Budget Budget Actual % of Budget Budget Actual % of Budget Property Tax 12,296,386$ 6,560,873$ 53.4% -$ -$ -$ -$ -$ -$ -$ -$ Sales Tax 15,206,475 3,366,415 22.1% - - - - - - - - State Income Tax 5,853,839 1,508,416 25.8% - - - - - - - - Utility Tax 8,672,006 2,150,567 24.8% - - - - - - - - Real Estate Transfer Tax 1,725,000 404,201 23.4% - - - - - - - - Liquor Tax 2,070,063 574,164 27.7% - - - - - - - - Other Taxes 5,860,547 1,219,739 20.8% - - - - - - - - Licenses, Permits, Fees 8,652,861 1,997,507 23.1% - - - - - - - - Charges for Services 7,853,023 1,770,977 22.6% 6,171,637 1,580,030 25.6% 12,905,000 3,088,341 23.9% 12,908,000 3,100,921 24.0% 3,624,033 718,490 19.8% Intergovernmental Revenues 669,897 163,935 24.5% - - 262,500 262,500 100.0% - - 140,000 3,067 2.2% Interfund Transfers 7,890,068 1,919,389 24.3% 3,876,726 969,182 25.0% - - - - 1,245,967 311,492 25.0% Other Non-Tax Revenue 5,950,622 1,244,347 20.9% 2,034,004 - 0.0% 5,600,557 106,302 1.9% 9,092,236 1,124 0.0% - - Total Revenues 82,700,787$ 22,880,530$ 27.7% 12,082,367$ 2,549,212$ 21.1% 18,768,057$ 3,457,143$ 18.4% 22,000,236$ 3,102,045$ 14.1% 5,010,000$ 1,033,049$ 20.6% Expenditures Legislative 616,033$ 140,473$ 22.8% -$ -$ -$ -$ -$ -$ -$ -$ City Administration 1,856,258 330,801 17.8% - - - - - - - - Law Department 999,107 218,092 21.8% - - - - - - - - Administrative Services Department 8,643,197 1,914,149 22.1% - - - - - - - - Community and Econ. Development 3,148,339 706,099 22.4% - - - - - - - - Police Department 24,752,938 5,811,436 23.5% - - - - - - - - Fire & Life Safety Services 13,314,621 3,144,785 23.6% - - - - - - - - Health Department 2,413,969 519,304 21.5% - - - - - - - - Public Works- Operating 9,559,460 2,205,774 23.1% 11,731,140 1,364,754 11.6% 12,664,258 2,983,280 23.6% 16,690,143 2,756,953 16.5% 5,187,861 725,232 14.0% Public Works- Capital Outlay - - 0.0% 3,520,000 - 0.0% 7,999,500 645,302 8.1% 4,771,000 3,995 0.1% - - Parks, Recreation & Comm. Services 17,392,621 3,292,543 18.9% - - - - - - - - Total Expenditures 82,696,543$ 18,283,456$ 22.1% 15,251,140$ 1,364,754$ 8.9% 20,663,758$ 3,628,582$ 17.6% 21,461,143$ 2,760,948$ 12.9% 5,187,861$ 725,232$ 14.0% As of March 31, 2012 City of Evanston Report of Budget-to-Actual Revenues and Expenditures Parking Fund Water Fund Solid Waste FundSewer FundGeneral Fund (Target is 25% of FY 2012 Budget) 15 of 84
  • 16. FY 2011 FY 2011 FY 2012 FY 2012 Budget Unaudited Budget YTD Adopted Actual Adopted Actual Tax - Property 16,516,200$ 16,009,204$ 12,296,386$ 6,560,873$ Tax - State Use 677,877 852,743 1,091,215 243,000 Tax - Sales Tax - Basic 7,300,000 7,403,517 9,209,455 2,057,930 Tax - Sales Tax - Home Rule 4,552,968 4,749,481 5,997,020 1,308,485 Tax - Auto Rental 29,155 34,004 36,445 9,761 Tax - Athletic Contest 550,000 154,227 700,000 - Tax - State Income 4,635,565 4,855,460 5,853,839 1,508,416 Tax - Fire Insurance 90,000 - - - Tax - Electric Utility 2,196,333 2,338,827 3,069,806 760,296 Tax - Natural Gas Utility 1,385,130 848,770 1,583,000 351,137 Tax - Natural Gas Use - Home Rule 709,044 528,650 869,000 244,134 Tax - Cigarette 295,284 304,827 485,000 90,000 Tax - Evanston Motor Fuel 550,378 481,751 761,587 154,682 Tax - Liquor 1,623,754 1,804,356 2,070,063 574,164 Tax - Parking 1,800,000 1,942,347 2,160,000 577,208 Tax - Personal Property Replacement 441,166 372,894 626,300 145,088 Tax - Real Estate Transfer 1,500,000 1,989,587 1,725,000 404,201 Tax - Telecommunications 2,691,834 2,628,397 3,150,200 795,000 License Fees - Vehicles 1,799,820 2,056,523 2,598,341 530,311 License Fees - Other 814,720 901,090 1,045,382 212,597 Permit Fees - Building 2,500,000 1,836,284 2,500,000 269,403 Permit Fees - Other 1,086,400 1,142,758 1,184,788 353,941 Other Fees 1,092,617 847,241 1,324,350 631,255 Fines and Forfeiture Revenue 3,806,864 3,230,763 4,721,639 880,283 Charges for Services Revenue 6,048,402 6,444,195 7,853,023 1,770,977 Intergovernmental Revenue 802,239 891,639 669,897 163,935 Other Revenue 1,575,183 1,966,283 1,216,983 362,762 Interfund Transfers In (Other Funds) 6,790,549 6,557,462 7,890,068 1,919,389 Interest Income 12,000 2,072 12,000 1,302 Total Revenue 73,873,482 73,175,352 82,700,787 22,880,530 Legislative 523,131 514,586 616,033 140,473 City Administration 1,675,952 1,329,524 1,856,258 330,801 Law Department 828,120 816,863 999,107 218,092 Administrative Services Department 8,206,488 6,684,499 8,643,197 1,914,149 Community and Economic Development 2,824,205 2,677,868 3,148,339 706,099 Police Department 20,263,642 20,631,944 24,752,938 5,811,436 Fire & Life Safety Services Department 11,192,783 11,120,092 13,314,621 3,144,785 Health Department 2,135,313 1,989,997 2,413,969 519,304 Public Works Department 6,862,268 6,576,242 9,559,460 2,205,774 Library (Note 1) 3,708,359 3,650,508 - - Parks, Recreation & Community Services 15,653,221 15,407,209 17,392,621 3,292,543 Total Expenditures 73,873,482 71,399,332 82,696,543 18,283,456 Net Surplus (Deficit) -$ 1,776,020$ 4,244$ 4,597,074$ Beginning Unrestricted Fund Balance (Note 2) 20,008,876 15,284,896 Change in Property Tax Receivables for Change in Fiscal Year (Note 3) (6,500,000) Ending Unreserved/Undesignated Fund Balance 15,284,896$ 19,881,970$ Note 1: The Library is budgeted as a separate fund in FY 2012. Note 2: Unrestricted fund balance includes amounts designated for compensated absences and IMRF. City of Evanston General Fund As of March 31, 2012 Note 3: March and April 2011 property tax payments are credited to the prior year as a result of the conversion to a calendar fiscal year. 16 of 84
  • 17. FY 2011 FY 2011 FY 2012 FY 2012 Budget Unaudited Budget YTD Adopted Actual Adopted Actual Revenue By Source Library Fines & Fees -$ -$ 150,000$ 38,024$ Library Material Replacement - - 12,500 2,890 Copy Machine Charges - - 20,000 4,892 Meeting Room Fees - - 10,000 1,110 Non-resident Cards - - 2,460 492 North Branch Rental Income - - 47,325 16,885 State Per Capita Grant - - 75,900 76,385 Personal Property Repl. Tax - - 50,200 - Video Rentals - - 28,000 9,606 Allocation - Property Taxes - - 4,253,214 2,652,949 Total Revenues - - 4,649,599 2,803,233 Expenditures Youth Services - - 800,390 176,785 Adult Services - - 1,579,231 332,061 Circulation - - 589,769 140,304 North Branch - - 203,336 44,562 Technical Services - - 473,306 100,969 Maintenance - - 491,375 93,602 Administration - - 512,192 98,869 Total Expenditures - - 4,649,599 987,152 Net Surplus (Deficit) - - - 1,816,081$ Beginning Fund Balance - - Ending Fund Balance -$ 1,816,081$ Note: The Library is budgeted as a separate fund in FY 2012. In prior fiscal years, the Library was a department in the General Fund. City of Evanston Library Fund (Note) As of March 31, 2012 17 of 84
  • 18. FY 2011 FY 2011 FY 2012 FY 2012 Budget Unaudited Budget YTD Adopted Actual Adopted Actual Grant Proceeds 288,460$ 195,943$ 80,000$ 42,840$ Total Revenue 288,460 195,943 80,000 42,840 HPRP Administration 27,000 10,841 - - Program Activities 261,460 185,102 80,000 42,840 Total Expenditures 288,460 195,943 80,000 42,840 Net Surplus (Deficit) -$ -$ -$ -$ Beginning Unreserved Fund Balance - - Ending Unreserved Fund Balance -$ -$ City of Evanston Homelessness Prevention & Rapid Re-Housing Program As of March 31, 2012 18 of 84
  • 19. FY 2011 FY 2011 FY 2012 FY 2012 Adopted Unaudited Budget YTD Budget Actual Adopted Actual Grant Proceeds 6,887,345$ 4,688,070$ 5,699,363$ 1,008,233$ Program Income 1,500,000 - 1,750,000 - Total Revenue 8,387,345 4,688,070 7,449,363 1,008,233 Development Activities 7,985,000 4,364,094 6,771,363 926,503 Administration 124,345 164,902 338,749 53,513 Transfer to Debt Service - - 3,616 904 Transfer to Insurance - - 15,635 4,179 Transfer to General Fund 278,000 156,813 320,000 30,825 Total Expenditures 8,387,345 4,685,809 7,449,363 1,015,924 Net Surplus (Deficit) -$ 2,261$ -$ (7,691)$ Beginning Unreserved Fund Balance - 2,261 Ending Unreserved Fund Balance 2,261$ (5,430)$ City of Evanston Neighborhood Stabilization Fund As of March 31, 2012 19 of 84
  • 20. FY 2011 FY 2011 FY 2012 FY 2012 Adopted Unaudited Adopted YTD Budget Actual Budget Actual State Allotment 1,900,000$ 1,876,906$ 1,900,000$ 464,191$ Investment Earnings 2,000 615 2,000 210 Miscellaneous Income - - - - Total Revenue 1,902,000 1,877,521 1,902,000 464,401 Sheridan Rd./ Isabella St. Project (JT with Wilmette) - - - Street Resurfacing (2009) - - - Street Resurfacing (2010) - - - Street Resurfacing (2011) 1,200,000 980,941 1,400,000 726 Transfer to General Fund - Staff Engineering 110,606 110,606 132,727 33,182 Transfer to General Fund - Street Maintenance 586,886 586,886 704,263 176,066 Total Expenditures 1,897,492 1,678,433 2,236,990 209,974 Net Surplus (Deficit) 4,508$ 199,088$ (334,990)$ 254,428$ Beginning Unreserved Fund Balance 682,090 881,178 Ending Unreserved Fund Balance 881,178$ 1,135,606$ City of Evanston Motor Fuel Fund As of March 31, 2012 20 of 84
  • 21. FY 2011 FY 2011 FY 2012 FY 2012 Adopted Unaudited Adopted YTD Budget Actual Budget Actual Landline Surcharge Revenue 525,000$ 479,969$ 617,400$ 160,678$ Wireless Surcharge Revenue 340,000 370,891 416,160 90,000 Interest Income 750 296 1,000 174 Miscellaneous Revenue - - - - Total Revenue 865,750 851,156 1,034,560 250,852 Operating Expense 778,737 688,503 847,415 139,230 Transfer to General Fund 125,868 125,868 125,950 31,487 Transfer to Insurance Fund 95,095 23,717 Transfer to Debt Service Fund 10,385 2,596 Capital Replacement 229,353 121,649 188,000 - Total Expenditures 1,133,958 936,020 1,266,845 197,030 Net Surplus (Deficit) (268,208)$ (84,864)$ (232,285)$ 53,822$ Beginning Unreserved Fund Balance 1,394,832 1,309,968 Ending Unreserved Fund Balance 1,309,968$ 1,363,790$ City of Evanston E911 Fund As of March 31, 2012 21 of 84
  • 22. FY 2011 FY 2011 FY 2012 FY 2012 Adopted Unaudited Adopted YTD Budget Actual Budget Actual Property Tax Revenue 378,000$ 377,392$ 398,000$ 207,234$ Investment Income - 31 - 4 Total Revenues 378,000 377,423 398,000 207,238 Professional Fees (Evmark) 378,000 388,000 398,000 99,500 Total Expenditures 378,000 388,000 398,000 99,500 Net Surplus (Deficit) -$ (10,577)$ -$ 107,738$ Beginning Unreserved Fund Balance 112,325 101,748 Ending Unreserved Fund Balance 101,748$ 209,486$ City of Evanston Special Service Area #4 Fund As of March 31, 2012 22 of 84
  • 23. FY 2011 FY 2011 FY 2012 FY 2012 Adopted Unaudited Adopted YTD Budget Actual Budget Actual Intergovernmental/Entitlement 2,095,180$ 1,478,686$ 1,490,500$ $ 408,484 Funds Reallocated from Prior Years 25,000 65,693 - Program Income 20,000 15,302 140,000 1,841 Miscellaneous - - - - Total Revenues 2,140,180 1,493,988 1,696,193 410,325 CDBG Administration/Planning 308,367 229,186 232,382 44,197 Development Activities 1,016,894 744,787 432,000 26,139 Capital Projects - - 255,000 - Transfers to General Fund 772,000 646,267 776,811 193,044 Total Expenditures 2,097,261 1,620,240 1,696,193 263,380 Net Surplus (Deficit) 42,919$ (126,252)$ -$ 146,945$ Beginning Unreserved Fund Balance 422,799 296,547 Ending Unreserved Fund Balance 296,547$ 443,492$ City of Evanston CDBG Fund As of March 31, 2012 23 of 84
  • 24. FY 2011 FY 2011 FY 2012 FY 2012 Adopted Unaudited Adopted YTD Budget Actual Budget Actual Intergovernmental Revenue -$ 158,988$ -$ 12,023$ Program Income 9,000 4,800 9,000 52,650 Interest Income - 268 - 35 Total Revenues 9,000 164,056 9,000 64,708 Program Expenses 20,000 194,225 20,000 22,617 Transfer to CDBG - - - - Development Activities - - - - Total Expenditures 20,000 194,225 20,000 22,617 Net Surplus (Deficit) (11,000)$ (30,169)$ (11,000)$ 42,091$ Beginning Unreserved Fund Balance 2,004,722 1,974,553 Ending Unreserved Fund Balance 1,974,553$ 2,016,644$ City of Evanston CDBG Loan Fund As of March 31, 2012 24 of 84
  • 25. FY 2011 FY 2011 FY 2012 FY 2012 Adopted Unaudited Adopted YTD Budget Actual Budget Actual Hotel Tax 1,350,000$ 1,201,088$ 1,600,000$ 210,000$ Amusement Tax 300,000 214,156 300,000 46,483 Howard-Ridge Loan Repayment - - 48,500 - Investment Income 8,000 179 8,000 105 Total Revenues 1,658,000 1,415,423 1,956,500 256,588 Economic Development Activities 1,640,247 1,479,759 1,802,825 247,066 Capital Projects - - 50,000 - Tax Rebate Agreement - - - - Transfer to Debt Service - - 12,752 3,188 Transfer to Insurance - - 75,334 18,833 Transfers to General Fund 377,256 377,256 452,707 113,177 Total Expenditures 2,017,503 1,857,015 2,393,618 382,264 Net Surplus (Deficit) (359,503)$ (441,592)$ (437,118)$ (125,676)$ Beginning Unreserved Fund Balance 2,423,201 1,981,609 Ending Unreserved Fund Balance 1,981,609$ 1,855,933$ City of Evanston Economic Development Fund As of March 31, 2012 25 of 84
  • 26. FY 2011 FY 2011 FY 2012 FY 2012 Adopted Unaudited Adopted YTD Budget Actual Budget Actual Taxes 20,000$ 20,000$ 20,000$ -$ Transfers From Other Funds - - - - Interest Income - - - - Total Revenues 20,000 20,000 20,000 - Program Expenses 50,000 - 50,000 - Transfers to Other Funds - - - - Total Expenditures 50,000 - 50,000 - Net Surplus (Deficit) (30,000)$ 20,000$ (30,000)$ -$ Beginning Unreserved Fund Balance 89,915 109,915 Ending Unreserved Fund Balance 109,915$ 109,915$ City of Evanston Neighborhood Improvement Fund As of March 31, 2012 26 of 84
  • 27. FY 2011 FY 2011 FY 2012 FY 2012 Adopted Unaudited Adopted YTD Budget Actual Budget Actual Intergovernmental /Entitlement 560,000$ 57,860$ 500,000$ 139,978$ Program Income 10,000 22,820 10,000 6,846 Total Revenues 570,000 80,680 510,000 146,824 Home Administration/Planning 56,000 4,789 - - CHDO Operating 28,000 - - - Development Activities 429,600 40,422 604,000 43,953 Transfers to General Fund 56,400 40,650 59,958 12,195 Total Expenditures 570,000 85,861 663,958 56,148 Net Surplus (Deficit) -$ (5,181)$ (153,958)$ 90,676$ Beginning Unreserved Fund Balance 2,636,531 2,631,350 Ending Unreserved Fund Balance 2,631,350$ 2,722,026$ City of Evanston Home Fund As of March 31, 2012 27 of 84
  • 28. FY 2011 FY 2011 FY 2012 FY 2012 Adopted Unaudited Adopted YTD Budget Actual Budget Actual Demolition Taxes 8,330 10,000 - - Developer Contributions - 2,000 125,000 - Rehab Repayments 20,000 7,500 - 2,083 Interest Income 1,000$ 166$ 125$ 138$ Miscellaneous - - - - Total Revenues 29,330 19,666 125,125 2,221 Housing - Land 41,650 - - - Housing - Buildings - - - - Down Payment Assistance 166,600 27,165 166,600 6,250 Transfers to General Fund 19,992 19,992 23,990 5,998 Miscellaneous 39,984 - 40,000 - Total Expenditures 268,226 47,157 230,590 12,248 Net Surplus (Deficit) (238,896)$ (27,491)$ (105,465)$ (10,027)$ Beginning Unreserved Fund Balance 2,299,153 2,271,662 Ending Unreserved Fund Balance 2,271,662$ 2,261,635$ City of Evanston Affordable Housing Fund As of March 31, 2012 28 of 84
  • 29. FY 2011 FY 2011 FY 2012 FY 2012 Adopted Unaudited Adopted YTD Budget Actual Budget Actual Net Property Tax Increment 4,800,000$ 5,168,428$ 5,073,000$ 2,697,573$ Interest Income 25,000 6,709 25,000 3,525 Total Revenue 4,825,000 5,175,137 5,098,000 2,701,098 Series 1997 Principal (refunded by 1999 & 2008D) 325,000 325,000 405,000 - Series 1997 Interest (refunded by 1999 and 2008D) 128,200 118,200 100,650 - Contributions to Other Agencies - - 800,000 - Economic Development Projects 500,000 30,000 Capital Improvements 773,715 113,213 1,936,000 - Contractual Services 125,000 - 35,000 - Transfer to Parking Fund (Sherman) 3,419,636 3,419,636 3,876,726 969,182 Transfer to General Fund 325,000 325,000 325,000 81,250 Total Expenditures 5,096,551 4,301,049 7,978,376 1,080,432 Net Surplus (Deficit) (271,551)$ 874,088$ (2,880,376)$ 1,620,666$ Beginning Unreserved Fund Balance 9,162,676 10,036,764 Ending Unreserved Fund Balance 10,036,764$ 11,657,430$ City of Evanston Washington National TIF Fund As of March 31, 2012 29 of 84
  • 30. FY 2011 FY 2011 FY 2012 FY 2012 Adopted Unaudited Adopted YTD Budget Actual Budget Actual Net Property Taxes 428,756$ 426,899$ 428,756$ 229,590$ Interest Income 100 37 - 5 Total Revenue 428,856 426,936 428,756 229,595 Series 2002C Bonds Principal 340,000 - 325,000 325,000 Series 2002C Bonds Interest 88,756 53,853 98,232 53,853 General Management Support - - - - Total Expenditures 428,756 53,853 423,232 378,853 Net Surplus (Deficit) 100$ 373,083$ 5,524$ (149,258)$ Beginning Unreserved Fund Balance 238,422 611,505 Ending Unreserved Fund Balance 611,505$ 462,247$ City of Evanston Special Service Area #5 As of March 31, 2012 30 of 84
  • 31. FY 2011 FY 2011 FY 2012 FY 2012 Adopted Unaudited Adopted YTD Budget Actual Budget Actual Net Property Tax Increment 1,300,000$ 1,212,637$ 1,073,000$ 644,221$ Interest Income 5,000 1,825 5,000 3,073 Total Revenue 1,305,000 1,214,462 1,078,000 647,294 1994 & 1996 Bonds Principal (refunded by 1999 and 2008D bonds) 570,000 570,000 605,000 - 1994 & 1996 Bonds Interest (refunded by 1999 and 2008D bonds) 141,804 141,057 109,603 - Other Expenses 460,000 1,200 - - Operating Transfer to General Fund 141,600 141,600 141,600 35,400 Total Expenditures 1,313,404 853,857 856,203 35,400 Net Surplus (Deficit) (8,404)$ 360,605$ 221,797$ 611,894$ Beginning Unreserved Fund Balance 5,211,765 5,572,370 Ending Unreserved Fund Balance 5,572,370$ 6,184,264$ City of Evanston SW II TIF (Howard Hartrey) As of March 31, 2012 31 of 84
  • 32. FY 2011 FY 2011 FY 2012 FY 2012 Adopted Unaudited Adopted YTD Budget Actual Budget Actual Net Property Tax Increment 656,000$ 451,421$ 470,000$ 255,091$ Interest Income 500 31 500 5 Total Revenue 656,500 451,452 470,500 255,096 Economic Development Activities 700,000 700,000 - - Capital Improvement Projects - - 580,000 - Operating Transfer to General Fund 24,100 24,100 28,920 7,230 Total Expenditures 724,100 724,100 608,920 7,230 Net Surplus (Deficit) (67,600)$ (272,648)$ (138,420)$ 247,866$ Beginning Unreserved Fund Balance 397,497 124,849 Ending Unreserved Fund Balance 124,849$ 372,715$ City of Evanston Southwest TIF As of March 31, 2012 32 of 84
  • 33. FY 2011 FY 2011 FY 2012 FY 2012 Adopted Unaudited Adopted YTD Budget Actual Budget Actual Net Property Tax- Current 10,806,574$ 10,405,238$ 11,863,898$ 5,645,520$ Bond Proceeds/Premium/ Discounts - 2,143,285 - - Transfer from Other Funds - IMRF 871,528 727,560 755,846 188,962 Interest Income 1,000 1,626 1,500 252 Transfer from Special Assessment Fund 317,660 285,894 317,660 79,415 Total Revenue 11,996,762 13,563,603 12,938,904 5,914,149 Series 2002 C- Principal - - 660,000 675,000 Series 2002 C- Interest 117,400 63,547 96,044 63,546 Series 2003 B- Principal - 2,780,000 - - Series 2003 B- Interest 46,623 59,832 - - Series 2004- Principal 735,000 815,000 760,000 - Series 2004- Interest 533,250 558,450 506,250 - Series 2004 B- Principal 1,210,000 1,535,000 1,630,000 - Series 2004 B- Interest 145,494 253,200 195,640 - Series 2005- Principal 525,000 545,000 730,000 - Series 2005- Interest 721,500 740,800 700,500 - Series 2006- Principal 75,000 125,000 80,000 - Series 2006- Interest 454,620 467,220 451,582 - Series 2006 B Bonds- Principal 302,063 302,063 35,000 - Series 2006 B Bonds- Interest - - 604,126 302,063 Series 2007 - Principal 1,115,000 1,150,000 1,150,000 - Series 2007 - Interest 626,520 663,239 598,958 - Series 2008A - Principal 195,000 195,000 195,000 - Series 2008A - Interest 138,162 138,162 132,313 - Series 2008C - Principal 343,800 361,800 351,440 - Series 2008C - Interest 398,044 418,884 387,730 - Series 2008D - Principal 520,000 520,000 425,000 - Series 2008D - Interest 47,874 47,874 93,554 - Series 2010 A - Principal DSF 240,000 240,000 300,000 - Series 2010 A - Interest DSF 190,138 190,137 185,337 - Series 2010 B - Principal DSF 695,000 580,533 613,946 - Series 2010 B - Interest DSF 176,528 147,453 141,648 - Series 2011 A - Principal DSF - - 1,081,678 - Series 2011 A - Interest DSF - - 630,961 - Series 2004- Principal SAF 80,000 - 85,000 - Series 2004- Interest SAF 25,200 - 19,600 - Series 2005- Principal SAF 20,000 - 20,000 - Series 2005- Interest SAF 19,300 - 18,500 - Series 2006- Principal SAF 50,000 - 50,000 - Series 2006- Interest SAF 12,600 - 10,576 - Series 2007 - Principal SAF 35,000 - 35,000 - Series 2007 - Interest SAF 36,720 - 35,320 - Series 2008C - Principal SAF 18,000 - 18,400 - Series 2008C - Interest SAF 20,840 - 20,300 - General Management and Support 5,000 - 5,000 - Bond Issuance Costs 75,000 86,535 60,000 - Fiscal Agent Fees 8,000 10,152 8,000 - Total Expenditures 9,957,676 12,994,881 13,122,403 1,040,609 Net Surplus (Deficit) 2,039,086$ 568,722$ (183,499)$ 4,873,540$ Beginning Unreserved Fund Balance (325,466) 243,256 Ending Unreserved Fund Balance 243,256$ 5,116,796$ City of Evanston Debt Service Fund As of March 31, 2012 33 of 84
  • 34. FY 2011 FY 2011 FY 2012 FY 2012 Adopted Unaudited Adopted YTD Budget Actual Budget Actual Net Property Taxes 689,000$ 659,271$ 862,000$ 328,654$ Interest Income 400 100 400 39 Miscellaneous - 17,618 - - Total Revenue 689,400 676,989 862,400 328,693 General Management Support - 25,412 - - Economic Dev. Projects 300,000 - Capital Improvements 430,000 3,502 Developer Agreement Payments 668,836 - Repayments to Econ. Dev. Fund 48,500 - Transfers to General Fund 120,400 120,400 120,400 30,100 Total Expenditures 120,400 145,812 1,567,736 33,602 Net Surplus (Deficit) 569,000$ 531,177$ (705,336)$ 295,091$ Beginning Unreserved Fund Balance 751,950 1,283,127 Ending Unreserved Fund Balance 1,283,127$ 1,578,218$ City of Evanston Howard Ridge TIF As of March 31, 2012 34 of 84
  • 35. FY 2011 FY 2011 FY 2012 FY 2012 Adopted Unaudited Adopted YTD Budget Actual Budget Actual Net Property Taxes 580,000$ 491,966$ 605,000$ 254,462$ Bond Proceeds - - 2,270,000 - Interest Income 1,000 2,285 1,000 200 Total Revenue 581,000 494,251 2,876,000 254,662 General Management Support - - - - Economic Development Projects - - 1,200,000 - Other Charges - - 490,000 9,125 Transfers to General Fund 50,000 50,000 60,000 15,000 Capital Projects 490,000 63,875 2,270,000 - Total Expenditures 540,000 113,875 4,020,000 24,125 Net Surplus (Deficit) 41,000$ 380,376$ (1,144,000)$ 230,537$ Beginning Unreserved Fund Balance 1,254,443 1,634,819 Ending Unreserved Fund Balance 1,634,819$ 1,865,356$ City of Evanston West Evanston TIF As of March 31, 2012 35 of 84
  • 36. FY 2011 FY 2011 FY 2012 FY 2012 Adopted Unaudited Adopted YTD Budget Actual Budget Actual Bond Proceeds 5,078,500$ 5,177,539$ 6,280,213$ -$ Grants 4,231,473 213,333 3,048,000 173,109 Private Contributions 575,000 - 1,301,200 - Miscellaneous 149,000 73,547 - - Interest Income - 17,546 - 3,598 Total Revenue 10,033,973 5,481,965 10,629,413 176,707 Administration 95,680 102,964 - 7,355 Capital Outlay (includes prior year rollovers) 13,014,138 7,559,955 12,242,358 382,542 Interfund Transfers Out 300,000 300,000 475,000 118,750 Total Expenditures 13,409,818 7,962,919 12,717,358 508,647 Net Surplus (Deficit) (3,375,845)$ (2,480,954)$ (2,087,945)$ (331,940)$ Beginning Unreserved Fund Balance 5,905,344 3,424,390 Ending Unreserved Fund Balance 3,424,390$ 3,092,450$ City of Evanston Capital Improvement Fund As of March 31, 2012 36 of 84
  • 37. FY 2011 FY 2011 FY 2012 FY 2012 Adopted Unaudited Adopted YTD Budget Actual Budget Actual Special Assessments Collected 550,000$ 231,589$ 300,000$ 77,451$ Bond Proceeds - - - Investment Income 25,000 7,687 10,000 1,440 Total Revenue 575,000 239,276 310,000 78,891 Transfer to Debt Service Fund 317,659 285,894 317,660 79,415 Capital Outlay 1,575,000 740,120 1,155,000 - Total Expenditures 1,892,659 1,026,014 1,472,660 79,415 Net Surplus (Deficit) (1,317,659)$ (786,738)$ (1,162,660)$ (524)$ Beginning Unreserved Fund Balance 3,759,955 2,973,217 Ending Unreserved Fund Balance 2,973,217$ 2,972,693$ City of Evanston Special Assessment Fund As of March 31, 2012 37 of 84
  • 38. FY 2011 FY 2011 FY 2012 FY 2012 Adopted Unaudited Adopted YTD Budget Actual Budget Actual Parking Lots & Meters Operations 2,349,060$ 2,405,392$ 2,870,000$ 724,354$ Church Street Garage Operations 583,333 540,431 767,092 136,527 Maple Avenue Garage Operations 1,138,711 899,397 1,151,800 320,012 Sherman Avenue Garage Operations 1,331,134 1,162,451 1,356,275 395,372 Washington National TIF Interfund Transfers-In 2,820,455 3,419,636 3,876,726 969,182 Interest Income 34,900 7,432 15,070 3,665 Miscellaneous Revenue - - 11,400 100 Reserve for Future Repairs (Contra Depreciation) 2,044,000 - 2,034,004 - Total Revenue 10,301,593 8,434,739 12,082,367 2,549,212 7005 - Parking System Administration 743,677 517,187 655,747 183,954 7015 - Parking Lots and Meters 799,498 737,568 1,584,510 186,710 7025 - Church Street Self Park 674,084 353,469 608,255 135,225 7030 - Church Street Debt Payments 133,030 169,336 173,126 - 7036 - Sherman Avenue Garage 5,324,706 4,254,606 5,772,432 318,254 7037 - Maple Avenue Garage 1,680,189 732,703 1,736,960 286,641 Transfer to Insurance Fund - - 503,877 79,912 Transfer to General Fund - - 644,242 161,060 Transfer to Fleet - - 21,991 5,498 Transfer to Equipment Replacement - - 30,000 7,500 7039 - Parking Debt - 22,950 - - 7050- Interfund Transfers Out 803,242 803,241 - - Capital Outlay - - 120,000 - Capital Improvements 3,242,598 - 3,400,000 - Total Expenditures 13,401,024 7,591,060 15,251,140 1,364,754 Net Surplus (Deficit) (3,099,431)$ 843,679$ (3,168,773)$ 1,184,458$ Further Operating Expense Breakdown: 7015 Parking Meter Activities 762,846 737,568 1,547,858 186,710 7015 Parking Meter Depreciation 36,652 - 36,652 - SUBTOTAL 799,498 737,568 1,584,510 186,710 7025- Church Garage Activities 494,156 353,469 428,327 135,225 7025- Church Garage Depreciation 179,928 - 179,928 - SUBTOTAL 674,084 353,469 608,255 135,225 7036 Sherman Garage Activities 1,199,756 1,004,606 1,194,182 318,254 7036 Debt Service Payments 3,250,300 3,250,000 3,703,600 - 7036 Reserve (Depreciation) 874,650 - 874,650 - SUBTOTAL 5,324,706 4,254,606 5,772,432 318,254 7037 Maple Garage Activities 1,013,991 732,703 1,070,762 286,641 7037 Debt Service Payments - - - - 7037 Reserve (Depreciation) 666,198 - 666,198 - SUBTOTAL 1,680,189 732,703 1,736,960 286,641 Beginning Unreserved Fund Balance 22,046,297 22,889,976 Ending Unreserved Fund Balance 22,889,976$ 24,074,434$ City of Evanston Parking Fund As of March 31, 2012 38 of 84
  • 39. FY 2011 FY 2011 FY 2012 FY 2012 Adopted Unaudited Adopted YTD Budget Actual Budget Actual Evanston 4,647,499$ 4,674,981$ 5,600,000$ 1,361,563$ Skokie 2,286,500 2,508,333 2,800,000 667,128 Northwest Commission 3,570,300 3,710,581 4,414,000 1,059,650 Cross Connection Control Fees 80,000 91,000 - Investment Earnings 9,996 6,569 2,500 2,630 Debt Proceeds 3,340,000 4,019,889 4,800,000 - Debt Proceeds (zero interest) - - - - Fees and Merchandise Sales 35,000 42,261 35,000 30,232 Fees and Outside Work 66,640 189,164 80,000 66,651 Grants 350,000 116,121 262,500 262,500 Insurance Reimbursements - - 420,000 - Phosphate Sales 49,980 43,655 60,000 6,789 Property Sales and Rentals 193,388 157,329 203,057 - Misc Revenue - 573,132 - - Total Revenue 14,629,303 16,042,015 18,768,057 3,457,143 General Support 681,872 571,077 832,838 169,386 Pumping 2,270,869 1,922,009 2,368,467 409,308 Filtration 2,138,628 1,965,689 2,563,022 465,773 Distribution 1,260,167 972,405 1,464,106 215,715 Meter Maintenance 320,115 262,028 313,840 85,438 Other Operating Expenses 219,791 133,341 285,530 81,790 Debt Service 82,542 166,386 944,157 599,672 Debt Service - IEPA Loan 3382 - - 67,506 - Capital Outlay 115,500 56,883 162,500 11,846 Capital Improvements 7,670,000 5,146,698 7,837,000 633,456 Depreciation - - - - Interfund Transfers Out - General Fund 2,737,748 2,737,748 3,356,300 839,075 Interfund Transfers Out - Insurance Fund 390,410 390,410 468,492 117,123 Total Expense 17,887,642 14,324,674 20,663,758 3,628,582 Net Surplus (Deficit) (3,258,339)$ 1,717,341$ (1,895,701)$ (171,439)$ Beginning Unreserved Fund Balance 6,133,887 7,851,228 Ending Unreserved Fund Balance 7,851,228$ 7,679,789$ City of Evanston Water Fund As of March 31, 2012 39 of 84
  • 40. FY 2011 FY 2011 FY 2012 FY 2012 Adopted Unaudited Adopted YTD Budget Actual Budget Actual Operations 10,931,000$ 11,217,554$ 12,908,000$ 3,100,921$ Debt Proceeds 8,687,475 8,797,105 5,000,000 - Debt Proceeds - 2012 IEPA Loan - - 4,000,000 - Investment Earnings 3,332 2,094 1,000 1,124 Miscellaneous 89,586 131,312 91,236 - Total Revenue 19,711,393 20,148,065 22,000,236 3,102,045 Sewer Operations 1,673,727 1,552,272 1,869,650 339,377 Other Operating Expenses 21,000 21,000 48,100 2,100 Interfund Transfers Out - General Fund 446,657 446,658 142,200 35,550 Interfund Transfers Out - Insurance Fund - - 269,988 67,497 Capital Outlay 12,000 10,830 18,000 3,995 Capital Improvement Account 687,475 523,619 4,753,000 - Depreciation - - - - Debt Service 14,215,356 13,737,377 14,242,990 2,312,429 Debt Service - ERI - - 117,215 - Total Expenses 17,056,215 16,291,756 21,461,143 2,760,948 Net Surplus (Deficit) 2,655,178$ 3,856,309$ 539,093$ 341,098$ Beginning Unreserved Fund Balance (889,063) 2,967,246 Ending Unreserved Fund Balance 2,967,246$ 3,308,344$ City of Evanston Sewer Fund As of March 31, 2012 40 of 84
  • 41. FY 2011 FY 2011 FY 2012 FY 2012 Adopted Unaudited Adopted YTD Budget Actual Budget Actual Property Tax Transfer from General Fund -$ -$ 1,245,967$ 311,492$ Solid Waste Franchise Fees 141,610 148,773 175,000 - SWANCC Recycling Incentive 124,950 283,870 140,000 3,067 Recycling Service Charge 1,826,269 1,875,044 2,954,033 689,864 Sanitation Service Charge Penalty 16,660 34,887 30,000 6,591 Special Pickup Fees 100,000 57,815 100,000 9,053 State Recycling Grant 45,000 139,774 - - Trash Cart Sales 15,000 39,058 15,000 4,324 Yard Waste Fees 680,000 241,790 350,000 8,658 Total Revenue 2,949,489 2,821,011 5,010,000 1,033,049 Refuse Collection & Disposal 1,975,110 2,839,845 3,077,218 467,860 Residential Recycling Collection 960,841 694,831 1,360,393 257,372 Yard Waste Collection 1,031,334 678,395 750,250 - Total Expense 3,967,285 4,213,071 5,187,861 725,232 Net Surplus (Deficit) (1,017,796)$ (1,392,060)$ (177,861)$ 307,817 Beginning Unreserved Fund Balance - (1,392,060) Ending Unreserved Fund Balance (1,392,060)$ (1,084,243) City of Evanston Solid Waste As of March 31, 2012 41 of 84
  • 42. FY 2011 FY 2011 FY 2012 FY 2012 Adopted Unaudited Adopted YTD Budget Actual Budget Actual General Fund 2,877,885$ 2,877,887$ 2,457,356$ 614,339$ Library Fund - - 2,381 595 Parking Fund 24,740 24,740 21,992 5,498 Water Fund 162,518 162,518 122,751 30,688 Sewer Fund 254,482 254,482 177,729 44,432 Solid Waste Fund 396,000 396,000 298,071 74,518 Sale of Surplus Property 350,000 85,109 75,000 43,533 Damage to City Property 24,798 - 24,789 - Miscellaneous Revenue - 302,718 20,000 11,540 Interest Income 4,165 272 4,165 160 Total Revenues 4,094,588 4,103,726 3,204,234 825,303 General Support 236,857 207,442 284,571 50,685 Major Maintenance 2,934,771 2,683,338 3,211,873 554,216 Transfer to Equipment Repl. Fund - - 2,222,069 555,517 Capital Outlay 1,933,320 1,030,272 - - Total Expenditures 5,104,948 3,921,052 5,718,513 1,160,418 Net Surplus (Deficit) (1,010,360)$ 182,674$ (2,514,279)$ (335,115)$ Beginning Unreserved Fund Balance 2,393,958 2,576,632 Ending Unreserved Fund Balance 2,576,632$ 2,241,517$ City of Evanston Fleet Fund As of March 31, 2012 42 of 84
  • 43. FY 2011 FY 2011 FY 2012 FY 2012 Adopted Unaudited Adopted YTD Budget Actual Budget Actual General Fund -$ -$ 1,242,590$ 310,648$ Library Fund - - 1,700 425 Parking Fund - - 30,000 7,500 Water Fund - - 72,275 - Sewer Fund - - 127,650 - Solid Waste Fund - - 177,131 44,283 Sale of Surplus Property - - 210,217 - Transfer from Fleet Fund - - 2,222,069 555,517 Total Revenues - - 4,083,632 918,373 Capital Outlay - - 2,400,000 - Capital Leases - - 50,000 - Total Expenditures - - 2,450,000 - Net Surplus (Deficit) -$ -$ 1,633,632$ 918,373$ Beginning Unreserved Fund Balance - - Ending Unreserved Fund Balance -$ 918,373$ City of Evanston Equipment Replacement Fund As of March 31, 2012 43 of 84
  • 44. FY 2011 FY 2011 FY 2012 FY 2012 Adopted Unaudited Adopted YTD Budget Actual Budget Actual General Admin Contribution- General 105,624 98,582$ 121,207$ 30,302$ General Admin Contribution- E911 775 775 930 233 General Admin Contribution- CDBG 775 775 930 233 General Admin Contribution- E.D. 775 775 930 233 General Admin Contribution- Parking 14,193 14,193 17,032 4,258 General Admin Contribution- Water Fund 20,793 20,793 24,962 6,241 General Admin Contribution- Sewer Fund 11,992 11,992 14,385 3,596 Liability/Property Contribution- General 792,266 739,448 909,150 227,288 Liability/Property Contribution- E911 5,810 5,810 6,972 1,743 Liability/Property Contribution- CDBG 5,810 5,810 6,972 1,743 Liability/Property Contribution- E.D. 5,810 5,810 6,972 1,743 Liability/Property Contribution- Parking 106,442 106,442 127,731 31,933 Liability/Property Contribution- Water Fund 155,945 155,945 187,209 46,802 Liability/Property Contribution- Sewer Fund 89,942 89,942 107,887 26,972 Workers' Comp Contribution- General 1,084,816 1,013,938 1,244,860 311,215 Workers' Comp Contribution- Library Fund - - 5,898 1,475 Workers' Comp Contribution- E911 7,955 7,955 9,546 2,387 Workers' Comp Contribution- CDBG 7,955 7,955 9,546 2,387 Workers' Comp Contribution- E.D. 7,955 7,955 9,546 2,387 Workers' Comp Contribution- Parking 145,738 145,738 174,886 43,721 Workers' Comp Contribution- Water Fund 213,516 213,516 256,322 64,081 Workers' Comp Contribution- Sewer Fund 123,146 123,146 147,716 36,929 Subrogation Proceeds 83,300 77,876 83,300 21,119 Investment Income 41,650 313 41,650 180 Workers Comp & Liability - Subtotal 3,032,983 2,855,484 3,516,536 869,201 Health Insurance Chargebacks- General 8,124,110 7,961,902 7,602,935 1,900,734 Health Insurance Chargebacks - Library - - 308,920 77,230 Health Insurance Chargebacks - NSP2 5,463 5,463 15,635 3,909 Health Insurance Chargebacks- E911 74,836 74,836 77,647 19,412 Health Insurance Chargebacks- CDBG 19,137 19,137 10,780 2,695 Health Insurance Chargebacks- E.D. Fund 36,576 36,575 57,886 14,471 Health Insurance Chargebacks- Parking 89,573 89,573 184,229 46,057 Health Insurance Chargebacks- Water 523,267 537,497 561,211 140,303 Health Insurance Chargebacks- Sewer 142,501 142,501 140,199 35,050 Health Insurance Chargebacks - Solid Waste 145,937 145,944 158,577 39,644 Health Insurance Chargebacks- Fleet 184,760 184,761 196,271 49,068 Retiree Health Insurance Contributions 1,695,988 1,415,378 1,903,503 399,697 Employee Health Insurance Contributions 1,200,000 1,145,551 1,209,056 48,665 One Time IPBC Distribution - - 200,000 - Health & Life insurance - Subtotal 12,242,148 11,759,118 12,626,849 2,776,935 Total Revenues 15,275,131 14,614,602 16,143,385 3,646,136 City of Evanston Insurance Fund As of March 31, 2012 44 of 84
  • 45. FY 2011 FY 2011 FY 2012 FY 2012 Adopted Unaudited Adopted YTD Budget Actual Budget Actual City of Evanston Insurance Fund As of March 31, 2012 General Administration & Support 251,843 250,248 354,104 78,783 Liability/Property Insurance Premiums 391,510 372,834 470,000 412,433 Liability Legal Fees 175,000 494,715 350,000 45,332 Liability Settlement Payments 300,000 250,290 400,000 4,840 Workers' Comp Insurance Premiums 120,000 81,437 114,400 101,700 Workers' Comp Legal Fees 71,000 56,692 60,000 20,820 Workers' Comp Medical Payments 900,000 781,652 850,000 165,626 Workers' Comp Settlement Payments 833,000 652,848 700,000 248,596 Workers' Comp TPA Pymts (non specific) 108,750 113,375 145,000 24,167 Workers' Comp TTD Pymts (non sworn) 249,000 85,822 140,000 6,209 Workers' Comp & Liability - Subtotal 3,400,103 3,139,913 3,583,504 1,108,506 General Administration & Support - - 98,878 6,598 Health Insurance Premiums 11,138,960 10,673,050 13,005,609 3,235,401 Health Insurance Opt Out Payments 64,974 58,080 78,000 11,375 Health & Life Insurance - Subtotal 11,203,934 10,731,130 13,182,487 3,253,374 Total Expenditures 14,604,037 13,871,043 16,765,991 4,361,880 Net Surplus (Deficit) 671,094$ 743,559$ (622,605)$ (715,744)$ Beginning Unreserved Fund Balance (4,937,497) (4,193,938) Ending Unreserved Fund Balance (4,193,938)$ (4,909,682)$ 45 of 84
  • 46. FY 2011 FY 2011 FY 2012 FY 2012 Adopted Unaudited Adopted YTD Budget Actual Budget Actual Property Taxes 6,913,759$ 5,932,983$ 6,119,393$ 3,218,932$ Personal Property Repl Tax 235,000 158,694 282,000 53,444 Interest on Investment 625,000 672,222 600,000 1,042 Participant Contributions 750,000 742,223 900,000 212,154 Unrealized Gain - (111,673) - 134 Total Revenue 8,523,759 7,394,449 7,901,393 3,485,706 Administrative Expenses 170,000 223,144 154,000 24,023 Legal Fees - - 50,000 - Retiree Pensions 3,500,000 3,794,696 4,700,000 1,178,749 Widows' Pensions 750,000 866,915 1,070,000 275,307 Disability Pensions 720,000 885,842 1,060,000 312,736 QUILDRO 18,000 61,399 75,000 19,659 Reserve for Future Payments - - - - Total Expenditures 5,158,000 5,831,996 7,109,000 1,810,474 Net Surplus (Deficit) 3,365,759$ 1,562,453$ 792,393$ 1,675,232$ Beg Net Assets held in Trust 54,358,822 55,921,275 55,921,275 End Net Assets held in Trust 55,921,275$ 56,713,668$ 57,596,507$ City of Evanston Fire Pension Fund As of March 31, 2012 46 of 84
  • 47. FY 2011 FY 2011 FY 2012 FY 2012 Adopted Unaudited Adopted YTD Budget Actual Budget Actual Property Taxes 8,561,091$ 7,279,970$ 8,196,751$ 3,945,788$ Personal Property Repl Tax 270,833 185,055 325,000 61,747 Interest Income 1,420,000 1,611,444 1,600,000 176 Participant Contributions 1,153,600 1,149,735 1,385,000 311,482 Miscellaneous 8,088 - 50 Unrealized Gain / (Loss) - 10,947 - (31,172) Total Revenue 11,405,524 10,245,239 11,506,751 4,288,071 Administrative Expenses 155,000 193,035 186,000 27,266 Retiree Pensions 5,750,000 5,802,426 7,250,000 1,785,905 Widow Pensions 512,500 675,909 818,000 214,941 Disability Pensions 437,500 571,045 625,000 162,414 Separation Refunds - 128,188 - - QUILDRO 12,000 11,889 12,000 3,567 Reserve for Future Payments - - - - Total Expenditures 6,867,000 7,382,492 8,891,000 2,194,093 Net Surplus (Deficit) 4,538,524$ 2,862,747$ 2,615,751$ 2,093,978$ Beg Net Assets held in Trust 72,465,514 75,328,261 75,328,261 End Net Assets held in Trust 75,328,261$ 77,944,012$ 77,422,239$ City of Evanston Police Pension Fund As of March 31, 2012 47 of 84
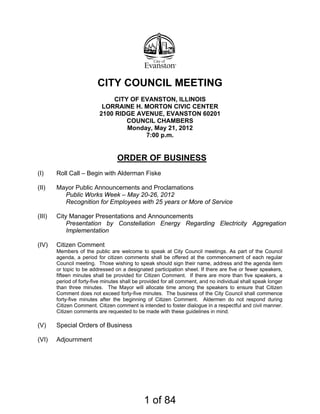
  • 48. January February March April May June July August September October November December FY 2012 Unreserved Fund Balance 14,685,117$ 16,337,797$ 19,881,970$ FY 2011 Unreserved Fund Balance 15,876,431$ 13,696,626$ 15,222,768$ FY 2012 Cash Balance 8,894,526$ 8,902,327$ 13,603,167$ FY 2011 Cash Balance 10,098,061$ 10,059,185$ 8,500,193$ $- $5,000,000 $10,000,000 $15,000,000 $20,000,000 $25,000,000 City of Evanston General Fund Comparison of Fund and Cash Balances Fiscal Year 2012 vs Fiscal Year 2011 FY 2012 Unreserved Fund Balance FY 2011 Unreserved Fund Balance FY 2012 Cash Balance FY 2011 Cash Balance 48 of 84
  • 49. Page 1 of 2 For City Council meeting of May 21, 2012 Item SP5 Fiscal Year 2011 Capital Improvement Plan – Year-End Report For Acceptance and Placement on File To: Honorable Mayor and Members of the City Council From: Martin Lyons, Assistant City Manager/Chief Financial Officer Louis Gergits, Finance Division Manager Brandon Dieter, Senior Management Analyst Subject: FY 2011 Capital Improvement Plan – Year-End Report Date: May 15, 2012 Recommended Action: Staff recommends the City Council accept and place the Fiscal Year 2011 Capital Improvement Plan Year-End Report on file. Funding Source: N/A Summary: The approved FY 2011 budget for capital projects was $32,437,959. Through December 31, 2011, a total of $18,492,522 or 57% of budget was expended on capital projects. A summary of FY 2011 capital expenditures by fund is provided in the table below: Fund 2011 CIP Budget 2011 Year-End CIP Expenses Percent Spent MFT Fund Funding 1,200,000$ 680,941$ 56.7% E911 Fund Funding 229,353$ 242,206$ 105.6% CDBG Fund Funding 480,000$ 377,382$ 78.6% Economic Development Funding 80,000$ -$ 0.0% Washington National TIF Fund Funding 773,715$ -$ 0.0% Southwest TIF Fund Funding 700,000$ 700,000$ 100.0% West Evanston TIF Fund Funding 490,000$ 63,875$ 13.0% CIP Fund Funding 13,409,818$ 5,667,688$ 42.3% SA Fund Funding 1,575,000$ 1,057,780$ 67.2% Parking Fund Funding 3,242,598$ 2,297,720$ 70.9% Water Fund Funding 7,670,000$ 5,373,943$ 70.1% Sewer Fund Funding 687,475$ 523,619$ 76.2% Fleet Fund Funding 1,900,000$ 1,507,398$ 79.3% TOTAL 32,437,959$ 18,492,552$ 57.0% Memorandum 49 of 84
  • 50. Page 2 of 2 As part of the FY 2012 Budget process, staff recommended the carryover of funds for 2011 capital projects into Fiscal Year 2012. As a result, approximately $6.8M of funding for capital projects was carried over and has been re-budgeted as part of the FY 2012 Capital Improvement Program. As the table above indicates, the FY 2011 budget for capital projects in the CIP Fund was $13.4M. As of December 31, 2011, approximately $5.7M was spent on capital projects in the CIP Fund. Capital expenses in the CIP Fund were significantly below budget due to approximately $4M of anticipated grants for CIP Fund capital projects which were not awarded to the City. As a result, associated expenditures for grant- funded projects in the CIP Fund were not incurred in FY 2011. The complete FY 2011 Capital Improvement Plan Year-End Report has been provided as an attachment to this memorandum. Included in the attached report are the expenses for individual 2011 capital projects through December 31, 2011. The status of individual capital projects as of December 31, 2011 has also been included in the attached report. Legislative History: The City Council approved the amended FY 2011 Capital Improvement Plan in the amount of $32,437,959 on July 25, 2011. ------------------------------------------------------------------------------------- Attachments: FY 2011 Capital Improvement Plan Year End Report 50 of 84
  • 51. 1 2 3 4 5 6 7 8 9 10 11 12 13 14 15 16 17 18 19 20 21 22 23 24 25 26 27 28 29 30 31 32 33 34 35 36 37 38 39 40 41 42 43 44 45 46 A C D F G K L N O U City of Evanston Capital Improvement Plan - Year-End Report Sorted by Fund & Funding Source Fiscal Year 2011 Unspent Funding Carry Fund Approved 12/31/2011 Project FY12 Carryover Description Department Source Over Responsible FY11 YTD Expenses Budget Request Project Status FUND SUMMARY MFT Fund Funding N/A N/A 1,200,000 680,941 519,059 - E911 Fund Funding N/A N/A 229,353 242,206 (12,853) - CDBG Fund Funding N/A N/A 480,000 377,382 102,618 - Economic Development Funding N/A N/A 80,000 - 80,000 50,000 TIF Funds Funding N/A N/A 1,963,715 763,875 1,199,840 81,000 CIP Fund - General Obligation (GO) Debt N/A N/A 5,078,500 2,504,366 2,574,134 1,396,787 CIP Fund - Fund Reserves N/A N/A 3,375,845 2,244,746 1,497,389 1,316,158 CIP Fund - Grants N/A N/A 4,196,473 875,103 3,321,370 1,474,000 CIP Fund - Loan N/A N/A 149,000 42,023 106,977 - CIP Fund - IDNR Grant Funding N/A N/A 35,000 1,450 33,550 - CIP Fund - Private Donations N/A N/A 575,000 - 575,000 575,000 SA Fund Funding N/A N/A 1,575,000 1,057,780 517,220 - Parking Fund Funding N/A N/A 3,242,598 2,297,720 944,878 740,000 Water Fund Funding N/A N/A 7,320,000 4,893,289 2,426,711 852,000 Water Fund - Grants N/A N/A 350,000 330,844 19,156 350,000 Water Fund - Insurance N/A N/A - 149,810 - - Sewer Fund Funding N/A N/A 687,475 523,619 163,856 - Fleet Fund Funding N/A N/A 1,900,000 1,507,398 392,602 - TOTAL 32,437,959 18,492,552 14,461,507 6,834,945 EXPENDITURE DETAIL Street Resurfacing - MFT Public Works MFT Revenues MFT 1,200,000 680,941 519,059 - Completed SUBTOTAL 1,200,000 680,941 519,059 - AS400 Redundancy Police E911 Revenue E911 45,000 69,145 (24,145) - Completed UPS (Uninterruptible Power Supply) Replacement Police E911 Revenue E911 35,000 35,000 - - Completed Radio System Narrowbanding Police E911 Revenue E911 20,000 20,000 - - Completed Computer / Radio Replacement Police E911 Revenue E911 40,000 40,000 - - Completed 911 Center Flooring (New Funding - FY11) PRCS E911 Revenue E911 3,968 3,968 - - Completed 911 Center flooring (Carryover) PRCS E911 Revenue Yes E911 8,570 7,140 1,430 - Completed Phone room A/C unit replacement PRCS E911 Revenue Yes E911 1,882 1,400 482 - Completed Police 911 Center HVAC Replacement PRCS E911 Revenue Yes E911 74,933 65,553 9,380 - Completed SUBTOTAL 229,353 242,206 (12,853) - Page 1 of 851 of 84
  • 52. 1 2 3 4 5 6 7 8 9 A C D F G K L N O U City of Evanston Capital Improvement Plan - Year-End Report Sorted by Fund & Funding Source Fiscal Year 2011 Unspent Funding Carry Fund Approved 12/31/2011 Project FY12 Carryover Description Department Source Over Responsible FY11 YTD Expenses Budget Request Project Status 47 48 49 50 51 52 53 54 55 56 57 58 59 60 61 62 63 64 65 66 67 68 69 70 71 72 73 74 ADA Ramps Public Works Grant CDBG CDBG 50,000 45,000 5,000 - Completed Alley Paving Public Works Grant CDBG CDBG 150,000 8,501 141,499 - Completed Block Curb & Sidewalk Replacement Public Works Grant CDBG CDBG 100,000 159,048 (59,048) - Completed Brummel Richmond Park Renovations PRCS Grant CDBG Yes CDBG 50,000 50,000 - - Completed Fleetwood-Jourdain Center Arts & Crafts Room Renovations PRCS Grant CDBG CDBG 30,000 - 30,000 - Completed SNAP Lighting Public Works Grant CDBG CDBG 50,000 39,941 10,059 - Completed Twiggs Park Renovations PRCS Grant CDBG CDBG 50,000 74,892 (24,892) - Completed SUBTOTAL 480,000 377,382 102,618 - 1817 Church Rehabilitation CED Econ. Develop. ED 30,000 - 30,000 - Property sale contemplated so project was not performed. Grandmother Park PRCS Econ. Develop. ED 50,000 - 50,000 50,000 Project on hold pending receipt of private donations. SUBTOTAL 80,000 - 80,000 50,000 Sherman Avenue Public Art PRCS TIF Increment Yes Wash TIF 85,000 - 85,000 81,000 Public Art Selection Committee has selected a project and will be making a recommendation to the Human Services Committee in April. 2011 Comprehensive Parking Garage Repair Project PRCS TIF Increment Wash TIF 473,715 - 473,715 - All work is complete but final payments to consultant and contractor pending. Neighborhood Traffic Calming and Ped/Bike Accom Public Works TIF Increment Wash TIF 10,000 - 10,000 - Downtown Brick Replacement Program Public Works TIF Increment Wash TIF 205,000 - 205,000 - Completed SUBTOTAL 773,715 - 773,715 81,000 TIF Assistance for Ward Manufacturing Community Dev. TIF Increment Southwest TIF 700,000 700,000 - - Completed SUBTOTAL 700,000 700,000 - - Page 2 of 852 of 84
  • 53. 1 2 3 4 5 6 7 8 9 A C D F G K L N O U City of Evanston Capital Improvement Plan - Year-End Report Sorted by Fund & Funding Source Fiscal Year 2011 Unspent Funding Carry Fund Approved 12/31/2011 Project FY12 Carryover Description Department Source Over Responsible FY11 YTD Expenses Budget Request Project Status 75 76 77 78 79 80 81 82 83 84 85 86 87 88 89 90 91 92 93 94 95 96 97 98 West Evanston Planning Community Dev. TIF Increment Yes West Evanston TIF 200,000 - 200,000 - Deferred Demo costs Community Dev. TIF Increment Yes West Evanston TIF 60,000 - 60,000 - Deferred Misc capital project costs Community Dev. TIF Increment Yes West Evanston TIF 230,000 63,875 166,125 - In process SUBTOTAL 490,000 63,875 426,125 - Contingency Admin Serv 2011 GO Debt CIP 350,000 - 350,000 - N/A Accela Software Purchase IT 2011 GO Debt CIP 245,000 243,764 1,236 - Completed Library Entrance Door Renovation PRCS 2011 GO Debt CIP 10,000 10,000 - - Completed Ecology Center HVAC Improvements PRCS 2011 GO Debt CIP 15,000 10,294 4,706 - Completed Brummel Richmond Park Renovations PRCS 2011 GO Debt CIP 20,000 - 20,000 - Completed Crown Center Improvements - Minor Projects PRCS 2011 GO Debt CIP 20,000 4,500 15,500 6,000 Studio rink painting complete. Reflective ceiling materials ordered with install expected in mid-February. Rink refrigeration equipment received with installation expected in February. James Park Pavement Repairs PRCS 2011 GO Debt CIP 20,000 57,211 (37,211) - Completed Crown Center Electrical Panel Replacements PRCS 2011 GO Debt CIP 30,000 7,890 22,110 - Completed James Park Irrigation System Improvements PRCS 2011 GO Debt CIP 80,000 80,000 - - Completed Service Center Fleet Service Make-Up Air Unit PRCS 2011 GO Debt CIP 85,000 86,458 (1,458) - All work is complete but final payment to contractor is pending. Service Center BAS Replacement PRCS 2011 GO Debt CIP 100,000 97,000 3,000 - Completed Ecology Center Greenhouse PRCS 2011 GO Debt CIP 125,000 - 125,000 125,000 Project is on hold pending direction from the CMO. Library Chiller Replacement PRCS 2011 GO Debt CIP 275,000 256,092 18,908 - Completed Emerson/Green Bay Pedestrian Safety Improvement Public Works 2011 GO Debt CIP 100,000 10,289 89,711 - Completed Chicago Ave. Signals CMAQ Construction/CBBEL (CE & Const.) Public Works 2011 GO Debt CIP 260,000 - 260,000 75,000 Complete - IDOT final reimbursement invoice yet to be received Sheridan/Isabella (JTW/ Wilmette) Public Works 2011 GO Debt CIP 270,000 - 270,000 270,000 Completed - Awaiting Bill from IDOT Sheridan Rd Resurface-Burnham to Chicago (CE, Const.)- IDOT Public Works 2011 GO Debt CIP 400,000 274,516 125,484 150,000 Completed Traffic Signal Upgrades - Sheridan Road - (DE, CE & Const.) Public Works 2011 GO Debt CIP 476,000 - 476,000 411,000 Deferred to 2012 Page 3 of 853 of 84
  • 54. 1 2 3 4 5 6 7 8 9 A C D F G K L N O U City of Evanston Capital Improvement Plan - Year-End Report Sorted by Fund & Funding Source Fiscal Year 2011 Unspent Funding Carry Fund Approved 12/31/2011 Project FY12 Carryover Description Department Source Over Responsible FY11 YTD Expenses Budget Request Project Status 99 100 101 102 103 104 105 106 107 108 109 110 111 112 113 114 115 116 City Works - Sign Inventory Public Works 2011 GO Debt CIP 100,000 46,594 53,406 55,000 Project expected to be completed by end of Spring 2012 Chicago Avenue Streetscape - Reimbursement to IDOT Public Works 2011 GO Debt CIP 250,000 - 250,000 250,000 Deferred to 2012 Fire Station 1 Mechanical Upgrade PRCS 2011 GO Debt CIP 20,000 627 19,373 5,000 Project is currently being designed. Construction funding has been provided in 2012 CIP. Fire #2 Boiler/Chimney & Apparatus Floor Heating Replacement PRCS 2011 GO Debt CIP 20,000 - 20,000 - Project is currently being designed. Construction funding has been provided in 2012 CIP. Service Center Renovations - Locker Room Renovation Public Works 2011 GO Debt CIP 37,500 29,436 8,064 7,500 Project is under construction. Construction funding provided in 2012 CIP. Civic Center Renovation PRCS 2011 GO Debt CIP 450,000 264,768 185,232 42,287 All work is complete except Fire Pump replacement which is currently under construction and scheduled for completion in April. Service Center Parking Deck Repairs Public Works 2011 GO Debt CIP 50,000 27,160 22,840 - In process CIP Street Resurfacing - Watermain Projects I Public Works 2011 GO Debt CIP 1,270,000 997,767 272,233 - Completed SUBTOTAL 5,078,500 2,504,366 2,574,134 1,396,787 Services to General Fund Admin Serv 2010 GO Debt CIP 300,000 300,000 - - Completed West Evanston Planning Community Dev. 2010 GO Debt Yes CIP 50,000 - 50,000 - In process Police Investigations Furniture Replacement Police 2010 GO Debt Yes CIP - 201 - - Evanston Digital Camera System Police 2010 GO Debt Yes CIP - 136,625 - - 311 Center - CIP Expenses PRCS 2011 GO Debt Yes CIP 28,000 6,730 21,270 - Completed Animal Shelter Renovation PRCS 2010 GO Debt Yes CIP 98,102 - 98,102 98,102 Project was delayed due to City's consideration to develop property. Project now delayed due to scope coordination issues with new sports complex group who plan to develop the Recycling Center. Brummel Richmond Park Renovations PRCS 2010 GO Debt Yes CIP 278,259 213,767 64,492 - Completed Page 4 of 854 of 84
  • 55. 1 2 3 4 5 6 7 8 9 A C D F G K L N O U City of Evanston Capital Improvement Plan - Year-End Report Sorted by Fund & Funding Source Fiscal Year 2011 Unspent Funding Carry Fund Approved 12/31/2011 Project FY12 Carryover Description Department Source Over Responsible FY11 YTD Expenses Budget Request Project Status 117 118 119 120 121 122 123 124 125 126 127 128 129 130 131 132 133 134 135 136 137 138 139 140 141 142 143 144 145 146 147 Civic Center Roof PRCS 2010 GO Debt Yes CIP 105,392 108,412 (3,020) - Completed Crown Center Improvements PRCS 2010 GO Debt Yes CIP 19,467 19,995 (528) - Completed Crown Center Partnership Study PRCS 2010 GO Debt Yes CIP 141,445 67,329 74,116 73,070 Proposals were received on 2/23/12 Crown Tennis Courts & Lighting PRCS 20?? GO Debt Yes CIP 53,346 - 53,346 - Completed Lakefront Master Plan Implementation PRCS 2010 GO Debt Yes CIP 700,000 2,909 697,091 621,238 All work is complete but IDOT invoicing and final payments to consultant are pending. Library Chiller Replacement PRCS 2010 GO Debt Yes CIP 6,600 6,600 - - Completed Police Firing Range PRCS 2010 GO Debt Yes CIP 422,220 249,976 172,244 - All work is complete but final payments to consultant and contractor are pending. Twiggs Park Renovations PRCS 2010 GO Debt Yes CIP 218,748 - 218,748 218,748 All work is complete but final payments to IDOT pending Evanston Art Center Flat Roof Repair PRCS 2010 GO Debt Yes CIP - 19,960 - - EECBG - Interior Lights PRCS 2010 GO Debt Yes CIP - 6,310 - - Fleetwood Jourdain Auto Door Operation Repair PRCS 2010 GO Debt Yes CIP - 4,734 - - Uninterruptable Power Supply Replacement PRCS 2010 GO Debt Yes CIP - 316 - - Roof Repair - Fire Stations 1 & 2 PRCS 2010 GO Debt Yes CIP - 6,691 - - Foster Park PRCS 2010 GO Debt Yes CIP - 400 - - 1817 Church Street PRCS 2010 GO Debt Yes CIP - 2,450 - - Bridge Rehab Program Public Works 2010 GO Debt Yes CIP 90,000 133,771 (43,771) - Phase II Engineering has not started Chicago Ave Signals CMAQ Constrct/CBBEL (CE & Const) Public Works 2010 GO Debt Yes CIP 40,000 - 40,000 - Completed City Works Upgrade for PW Field Personnel Public Works 2010 GO Debt Yes CIP 37,746 36,441 1,305 - Completed CTA Yellow Line Infill Station Study Public Works 2010 GO Debt Yes CIP 55,000 240,631 (185,631) 55,000 Final report being prepared Downtown Brick Repair Public Works 2010 GO Debt Yes CIP 50,000 284,718 (234,718) - Completed Lake Street LAPP - IDOT Payment Public Works 2010 GO Debt Yes CIP 471,520 55,285 416,235 250,000 Completed Traffic Signal Upgrades Sheridan Road Public Works 2010 GO Debt Yes CIP 210,000 151,892 58,108 - Awaiting final invoice EECBG - Street Light Upgrade Public Works 2010 GO Debt Yes CIP - 188,603 - - SUBTOTAL 3,375,845 2,244,746 1,497,389 1,316,158 Lakefront Master Plan Implementation PRCS Grant Yes CIP 877,473 - 877,473 - Completed Bridge Rehab Program (IDOT Reimbursement) Public Works Grant CIP 200,000 - 200,000 - Deferred Chicago Ave. Streetscape Public Works Grant CIP 800,000 - 800,000 800,000 Deferred to 2012 CTA Yellow Line Infill Station Study Public Works Grant Yes CIP 220,000 - 220,000 - Deferred Emergency Repair Program - Emerson & Isabella Public Works Grant CIP 1,025,000 875,103 149,897 - Completed Page 5 of 855 of 84
  • 56. 1 2 3 4 5 6 7 8 9 A C D F G K L N O U City of Evanston Capital Improvement Plan - Year-End Report Sorted by Fund & Funding Source Fiscal Year 2011 Unspent Funding Carry Fund Approved 12/31/2011 Project FY12 Carryover Description Department Source Over Responsible FY11 YTD Expenses Budget Request Project Status 148 149 150 151 152 153 154 155 156 157 158 159 160 161 162 163 164 165 166 167 168 169 170 171 172 173 174 175 176 177 Sheridan Road - Burnham Place to Chicago Avenue (IDOT Reimb) Public Works Grant CIP 400,000 - 400,000 - In process Traffic Signal Upgrades - Sheridan / Chicago Public Works Grant Yes CIP 674,000 - 674,000 674,000 Deferred to 2012 SUBTOTAL 4,196,473 875,103 3,321,370 1,474,000 Infrastructure- servers network and systems IT Loan Yes CIP 149,000 42,023 106,977 - Completed SUBTOTAL 149,000 42,023 106,977 - Grandmother Park PRCS IDNR Grant CIP 35,000 1,450 33,550 - Grant not awarded SUBTOTAL 35,000 1,450 33,550 - Animal Shelter Renovation PRCS Private Donation Yes CIP 450,000 - 450,000 450,000 Project was delayed due to City's consideration to develop property. Project now delayed due to scope coordination issues with new sports complex group who plan to develop the Recycling Center. Grandmother Park PRCS Private Donation CIP 125,000 - 125,000 125,000 Donations not received yet. SUBTOTAL 575,000 - 575,000 575,000 50/50 Sidewalk Public Works SA Reserves Special Assessment 200,000 72,406 127,594 - Completed Alley Maintenance Public Works SA Reserves Special Assessment 125,000 - 125,000 - Completed Alley Paving City Share Public Works SA Reserves Special Assessment 350,000 351,290 (1,290) - Completed Alley Paving City Share - CDBG Match Public Works SA Reserves Special Assessment 150,000 111,149 38,851 - Completed Alley Paving Private Share Public Works SA Reserves Special Assessment 250,000 200,000 50,000 - Completed Block Curb & Sidewalk Replacement Public Works SA Reserves Special Assessment 200,000 - 200,000 - Completed Streetlight Upgrade Program-luminaire Replacement Public Works SA Reserves Special Assessment 100,000 100,000 - - In process Streetlight Upgrade Program-Power Center Replacement Public Works SA Reserves Special Assessment 100,000 148,631 (48,631) - In process Striping, Lighting and Signal Maintenance Public Works SA Reserves Special Assessment 100,000 74,304 25,696 - In process SUBTOTAL 1,575,000 1,057,780 517,220 - Page 6 of 856 of 84
  • 57. 1 2 3 4 5 6 7 8 9 A C D F G K L N O U City of Evanston Capital Improvement Plan - Year-End Report Sorted by Fund & Funding Source Fiscal Year 2011 Unspent Funding Carry Fund Approved 12/31/2011 Project FY12 Carryover Description Department Source Over Responsible FY11 YTD Expenses Budget Request Project Status 178 179 180 181 182 183 184 185 186 187 188 189 190 191 192 193 194 195 196 197 198 199 200 201 202 203 204 205 206 2011 Comprehensive Parking Garage Repair Project PRCS Parking Parking 2,406,598 2,206,340 200,258 - All work is complete but final payments to consultant and contractor pending. Parking Lot 60 Membrane Installation PRCS Parking Parking 96,000 91,380 4,620 - Completed Service Center Parking Deck Repairs Public Works Parking Parking 50,000 - 50,000 50,000 In process Parking Lot 4 Improvements Public Works Parking Parking 540,000 - 540,000 540,000 Deferred to 2012 Maple Garage Store Front Improvement Public Works Parking Parking 150,000 - 150,000 150,000 Deferred to 2012 SUBTOTAL 3,242,598 2,297,720 944,878 740,000 Tuckpointing Utilities 2011 Water Bonds Yes Water 220,000 - 220,000 - Project was deferred to pay for switchgear replacement costs not covered by insurance Security Improvements Utilities 2011 Water Bonds Water 50,000 17,054 32,946 - Completed Zebra Mussel System Repair Utilities 2011 Water Bonds Water 150,000 - 150,000 90,000 Completed Water Main Installation Utilities 2011 Water Bonds Water 2,890,000 2,162,633 727,367 - Completed Asbestos Removal Utilities 2011 Water Bonds Water 50,000 37,949 12,051 - Completed Filter and Filter Roof Rehab Utilities Water Yes Water 2,900,000 2,243,879 656,121 - Anticipated completion date is 6/30/12 Scada System Improvements Utilities Water Yes Water 950,000 341,774 608,226 640,000 Anticipated completion date is 12/31/12 Switchgear Repair Utilities Water Water - 90,000 (90,000) 12,000 6/30/12 anticipated completion date High Lift Window Replacement Utilities Water Water 110,000 - 110,000 110,000 Deferred to 2012 SUBTOTAL 7,320,000 4,893,289 2,426,711 852,000 Scada System Improvements Utilities Water Grant Yes Water 350,000 330,844 19,156 350,000 Anticipated completion date is 12/31/12 SUBTOTAL 350,000 330,844 19,156 350,000 Switchgear Repair Utilities Water - Insurance No Water - 149,810 - - 6/30/12 anticipated completion date SUBTOTAL - 149,810 - - Emergency Sewer Work Utilities 2011 Sewer Bonds Sewer 62,475 - 62,475 - There were no emergency sewer repairs in FY2011 Page 7 of 857 of 84
  • 58. 1 2 3 4 5 6 7 8 9 A C D F G K L N O U City of Evanston Capital Improvement Plan - Year-End Report Sorted by Fund & Funding Source Fiscal Year 2011 Unspent Funding Carry Fund Approved 12/31/2011 Project FY12 Carryover Description Department Source Over Responsible FY11 YTD Expenses Budget Request Project Status 207 208 209 210 211 212 213 214 215 216 217 Sewer Lining Utilities 2012 Sewer Bonds Sewer 250,000 250,000 - - Completed Sewer Repairs on Street Improvements Utilities 2011 Sewer Bonds Sewer 375,000 273,619 101,381 - Completed SUBTOTAL 687,475 523,619 163,856 - Fleet Capital Replacements Public Works / Fleet Fleet Revenues Fleet 1,900,000 1,507,398 392,602 - Completed SUBTOTAL 1,900,000 1,507,398 392,602 - TOTAL EXPENDITURES 32,437,959 18,492,552 14,461,507 6,834,945 Page 8 of 858 of 84
  • 59. Page 1 of 3 For City Council meeting of May 21, 2012 Item SP6 Resolution 44-R-12: Amending the FY 2012 Budget For Action To: Honorable Mayor and Members of the City Council From: Martin Lyons, Assistant City Manager/Chief Financial Officer Subject: Resolution 44-R-12 Amending the FY 2012 Budget Date: May 10, 2012 Recommended Action: Staff recommends approval of Resolution 44-R-12 – Authorization to amend the FY 2012 Budget. The proposed amendment would increase the FY 2012 Budget Appropriation by $7,393,000, from $250,096,993 to $257,489,993. Funding Source: The funding adjustments associated with the proposed FY 2012 Budget Amendment are summarized in the table below: Fund Amount General Fund (Reserves) $ 1,750,000 Southwest II (Howard-Hartrey) TIF Fund (Reserves) 2,800,000 Howard-Ridge TIF Fund (G.O. Bonds) 470,000 Capital Improvement Fund (Transfer from General Fund) 1,273,000 Equipment Replacement Fund (Reserves & Transfers) 1,100,000 Total Appropriation Amendment Requested: $ 7,393,000 Summary: Staff recommends approval of Resolution 44-R-12 – Authorization to amend the FY 2012 Budget. The proposed amendment would increase the FY 2012 Budget Appropriation by $7,393,000, from $250,096,993 to $257,489,993. An explanation of the proposed FY 2012 Budget Amendment is provided below: • General Fund – The proposed FY 2012 Budget Amendment would increase General Fund expenditures by $1,750,000. The General Fund transfer is proposed for $1,250,000 to the Capital Improvement Fund (CIF) and the remaining $500,000 to the Equipment Replacement Fund. Memorandum 59 of 84
  • 60. Page 2 of 3 • Southwest II (Howard-Hartrey) TIF Fund – The proposed FY 2012 Budget Amendment would increase the Southwest II (Howard-Hartrey) TIF Fund expenditures by $2,800,000. $1.3M of this amendment provides for the surplus distribution from Howard-Hartrey to all taxing bodies. The surplus distribution resolution will be provided to the City Council at the May 29, 2012 meeting. In addition, as part of public infrastructure improvements for the Howard-Hartrey TIF Fund (Southwest II TIF), the following projects, totaling $1.5M are proposed: o Installation of sidewalk and pedestrian lighting along access drive parallel to Hartrey from Howard Street North to Target - $350,000 o Installation of a new bus shelter at Howard Street and Access Drive (Hartrey) including bump out - $250,000 o Streetscape improvement along Hartrey from Howard Street to the Dead end on east side of wall including the gateway into James park - $550,000 o Howard Street and Jewel Osco Driveway reconfiguration, bump out and bus shelter - $350,000 • Howard-Ridge TIF Fund – The proposed FY 2012 Budget Amendment would increase the Howard-Ridge TIF Fund expenditures by $470,000 for capital projects. The adopted FY 2012 CIP included $430,000 for economic development projects in the Howard-Ridge TIF. The proposed amendment would replace this item with the project “CIP Improvements on City Owned Buildings” in the amount of $900,000. • Capital Improvement Fund – On March 19, 2012, the City Council approved additional modifications to the 2012 Street Resurfacing and Street Light Power Center projects. These modifications totaled $1.25M and will be funded through a transfer from the General Fund to the Capital Improvements Fund. A summary of the projects included in this modification is provided below: Funding Description Source Fund Amount Asbury Avenue (Central to Chancellor) General Fund Transfer CIP 60,000$ Bennett Avenue (Simpson to Payne) General Fund Transfer CIP 71,000$ Brummel Street (Ridge to Elmwood) General Fund Transfer CIP 70,000$ Dewey Avenue (Kirk to Oakton) General Fund Transfer CIP 82,000$ Elmwood Avenue (Lee to Crain) General Fund Transfer CIP 193,000$ Hartrey Avenue (Lincoln to Central) General Fund Transfer CIP 120,000$ Isabella Street (Highland to Central) General Fund Transfer CIP 70,000$ Jenks Street (Eastwood - Dead End East) General Fund Transfer CIP 30,000$ Milburn Street (Ridge to Orrington, Dead End) General Fund Transfer CIP 180,000$ Pitner Avenue (Lee to Greenleaf) General Fund Transfer CIP 124,000$ Street Light Power Center Reserves General Fund Transfer CIP 250,000$ TOTAL 1,250,000$ In addition to the modifications listed above, staff proposes two new projects for inclusion in the amended FY 2012 CIP. The first item is the Noyes Roof project 60 of 84
  • 61. Page 3 of 3 totaling $120,000 to be funded by Capital Improvement Fund grants. The second item is the installation of seven public streetlights in the right-of-way parallel to the new AMLI development. The total proposed budget for this item is $40,000, which will be added to the Chicago Avenue Streetscape Project. Finally, several Capital Improvement Fund project budget adjustments are proposed to reflect favorable bid pricing, project revisions and additional funding sources. A complete list of the proposed Capital Improvement Fund modifications has been provided as an attachment to this report. • Equipment Replacement Fund – The proposed FY 2012 Budget Amendment would increase expenditures for the Equipment Replacement Fund by $1,100,000 for additional vehicle purchases. This item will be partially funded by the surplus transfer of $500,000 from the General Fund and from Equipment Replacement Fund reserves. No new revenues are proposed or needed to fund this amendment. Legislative History: N/A ------------------------------------------------------------------------------------- Attachments: Resolution 44-R-12 – Budget Amendment General Fund Budget Summary Howard-Hartrey (Southwest II) TIF Fund Summary Howard-Ridge TIF Fund Summary Capital Improvement Fund Summary Equipment Replacement Fund Summary Proposed FY 2012 Capital Improvement Plan Amendment 61 of 84
  • 62. 05/14/2012 44-R-12 A RESOLUTION Authorizing the City of Evanston City Manager to Increase the Total Fiscal Year 2012 Appropriation $7,393,000.00, to a New Total of $257,489,993.00 WHEREAS, a total appropriation amendment for seven million, three hundred ninety-three thousand dollars ($7,393,000.00) is required due to the following items: a) General Fund $ 1,750,000.00 b) Southwest II (Howard-Hartrey) TIF Fund 2,800,000.00 c) d) e) Howard-Ridge TIF Fund Capital Improvement Fund Equipment Replacement Fund 470,000.00 1,273,000.00 1,100,000.00 Total Appropriation Amendment Requested: $ 7,393,000.00 NOW, THEREFORE, BE IT RESOLVED BY THE CITY COUNCIL OF THE CITY OF EVANSTON, COOK COUNTY, ILLINOIS: SECTION 1: That the foregoing recitals are hereby found as fact and made a part hereof. SECTION 2: That the Council authorize the Fiscal Year 2012 appropriation be increased from two hundred and fifty million, ninety-six thousand, nine-hundred and ninety-three dollars ($250,096,993.00) to two hundred fifty-seven million, four hundred and eighty-nine thousand, nine-hundred 62 of 84
  • 63. 44-R-12 ~2~ and ninety-three dollars ($257,489,993.00), as summarized in the document attached hereto and incorporated herein as Exhibit A. SECTION 3: That approval of this resolution shall authorize the City Manager to expend and/or encumber up to two hundred fifty-seven million, four hundred and eighty-nine thousand, nine-hundred and ninety-three dollars ($257,489,993.00) for Fiscal Year 2012 for all Funds. SECTION 4: That this Resolution shall be in full force and effect from and after the date of its passage and approval in the manner provided by law. _______________________________ Elizabeth B. Tisdahl, Mayor Attest: _______________________________ Rodney Greene, City Clerk Adopted: __________________, 2012 63 of 84
  • 64. 44-R-12 ~3~ City of Evanston- Fiscal Year 2012 - Amended Budget Summary Fund Name Fund # 2012 Amended Budget General 100 84,446,543$ Homelessness Prev. & Rapid Re-Housing Program 190 80,000 Neighborhood Stabilization Program 195 7,449,363 Motor Fuel 200 2,236,990 Emergency Telephone 205 1,266,845 Special Service Area # 4 210 398,000 CDBG 215 1,696,193 CDBG Loan 220 20,000 Economic Development 225 2,393,618 Neighborhood Improvement 235 50,000 HOME 240 663,958 Affordable Housing Fund 250 230,590 Library Fund 260 4,649,599 Washington National TIF 300 7,978,376 Special Service Area # 5 305 423,232 Southwest II TIF (Howard-Hartrey) 310 3,656,203 Southwest TIF 315 608,920 Debt Service (G.O. Bonds) 320 13,122,403 Howard-Ridge TIF 330 2,037,736 West Evanston TIF 335 4,020,000 Capital Improvement 415 13,990,358 Special Assessment 420 1,472,660 Parking 505 15,251,140 Water 510 20,663,758 Sewer 515 21,461,143 Solid Waste 520 5,187,861 Fleet 600 5,718,513 Equipment Replacement 601 3,550,000 Insurance 605 16,765,991 Fire Pension 700 7,109,000 Police Pension 705 8,891,000 Total All Funds 257,489,993$ City of Evanston Budget Summary of All Funds Fiscal Year 2012 64 of 84
  • 65. Proposed 2010-2011 2011 2011 Budget-to-Budget 2012 Budget 2012 Budget 2012 Budget Actual Budget* Estimate* Increase (Decrease) Proposed Adjustments Amendment Operating Revenue Property Tax 16,159,345$ 16,516,200$ 16,546,460$ $ 33,400 16,549,600$ (4,253,214)$ 12,296,386$ Other Taxes 37,870,903 31,028,488 30,938,488 8,255,979 39,284,467 103,463$ 39,387,930 Licenses/Permits/Fees 8,667,275 7,293,557 7,465,902 1,304,454 8,598,011 54,850$ 8,652,861 Fines and Forfeitures 4,002,700 3,806,864 3,340,670 372,280 4,179,144 542,495$ 4,721,639 Charges for Services 9,702,647 6,048,402 6,348,672 934,449 6,982,851 870,172$ 7,853,023 Intergovernmental Revenue 1,152,632 802,239 748,239 (106,442) 695,797 (25,900)$ 669,897 Other Revenue 3,236,875 1,478,601 1,620,434 (777,618) 700,983 516,000$ 1,216,983 Interest Income 11,454 12,000 12,000 - 12,000 -$ 12,000 Transfers In (Other Funds) 7,608,746 6,790,549 6,774,060 1,099,519 7,890,068 -$ 7,890,068 Library Revenues 113,102 96,582 112,850 23,703 120,285 (120,285)$ - Total Revenue 88,525,679 73,873,482 73,907,775 11,139,724 85,013,206 (2,312,419) 82,700,787 Operating Expense Legislative 589,865 523,131 563,323 104,033 627,164 (11,131) 616,033 City Administration 1,921,782 1,675,952 1,321,106 145,930 1,821,882 34,376 1,856,258 Law Department 960,007 828,120 760,793 177,152 1,005,272 (6,165) 999,107 Administrative Services 9,266,548 8,206,488 7,994,305 593,419 8,799,907 (156,710) 8,643,197 Community & Economic Development 3,904,597 2,824,205 2,696,632 580,759 3,404,964 (256,625) 3,148,339 Police Department 22,439,417 20,263,642 20,151,111 4,930,931 25,194,573 (441,635) 24,752,938 Fire & Life Safety Services 12,819,555 11,192,783 11,226,020 2,329,904 13,522,687 (208,066) 13,314,621 Health Department 2,079,737 2,135,313 2,040,321 213,191 2,348,504 65,465 2,413,969 Public Works Department 12,618,306 6,862,268 6,726,621 1,689,616 8,551,884 1,007,576 9,559,460 Public Library 4,214,554 3,708,359 3,662,448 801,240 4,509,599 (4,509,599) - Parks/Recreation and Comm. Services 16,157,573 15,653,221 15,822,574 1,996,343 17,649,564 (256,943) 17,392,621 Total Expenditures 86,971,941 73,873,482 72,965,254 13,562,518 87,436,000 (4,739,457) 82,696,543 - Net Surplus (Deficit) 1,553,738$ -$ 942,521$ (2,422,794)$ (2,422,794)$ 2,427,038$ 4,244$ Beginning Fund Balance 14,581,963 15,524,484 15,524,484 Transfer to Capital Improvement Fund (Proposed) (1,250,000) Transfer to Equipment Replacement Fund (Proposed) (500,000) Ending Fund Balance 15,524,484 13,101,690 13,778,728 City of Evanston General Fund Summary (Fund #100) 65 of 84
  • 66. Howard-Hartrey TIF (Southwest II) Debt Service Fund Summary (Fund #310) Financial Summary 2011 2011 2012 2010-11 Adopted Estimated Adopted Actual Budget Actual Budget Revenue By Source Net Property Tax Increment 883,463 1,300,000 1,073,000 1,073,000 Interest Income 1,549 5,000 5,000 5,000 Total Revenue 885,012 1,305,000 1,078,000 1,078,000 Expenditures 1994 & 1996 Bonds (refunded by 1999 and then 2008D bonds) Principal 535,000 570,000 570,000 605,000 1994 & 1996 Bonds (refunded by 1999 and then 2008 D bonds) Interest 170,483 141,804 141,804 109,603 Other Expenses 785 460,000 - - Capital Projects - - - 1,500,000 Surplus Distribution to General Fund - - - 1,300,000 Operating Transfer to General Fund 141,600 141,600 141,600 141,600 Total Expenditures 847,868 1,313,404 853,404 3,656,203 Net Surplus (Deficit) 37,144 (8,404) 224,596 (2,578,203) Beginning Fund Balance 5,174,621 5,211,765 5,436,361 Ending Fund Balance 5,211,765 5,436,361 2,858,158 Description of Major Activities City of Evanston The City Council adopted the Southwest II Tax Increment Finance (TIF) District – also called the Howard- Hartrey TIF – on April 27, 1992. The TIF District consists of a 23-acre site located at 2201 West Howard Street in the southwest corner of the City. The development consists of a shopping center with several large stores. The total project cost is estimated to be $39,266,932, of which the City provided $7,390,000 in land acquisition and public improvement costs. This Fund is responsible for the payment of principal and interest on any outstanding debt service associated with this TIF. The debt service payment schedule extends through FY2014. 66 of 84
  • 67. Financial Summary 2011 2011 2012 2010-11 Adopted Estimated Adopted Actual Budget Actual Budget Revenue By Source Net Property Taxes 248,025 689,000 666,700 862,000 Interest Income 239 400 400 400 Miscellaneous 1,126 - - - Total Revenue 249,390 689,400 667,100 862,400 Expenditures General Management Support 495,246 - - - Economic Development Projects - - - 300,000 Capital Improvements - - - 900,000 Developer Agreement Payments - - - 668,836 Repayment to Ec Dev Fund - - - 48,500 Property Acquisitions - - - Transfer Out- General Fund 120,396 120,400 120,400 120,400 Total Expenditures 615,642 120,400 120,400 2,037,736 Net Surplus (Deficit) (366,252) 569,000 546,700 (1,175,336) Beginning Fund Balance 1,118,202 751,950 1,298,650 Ending Fund Balance 751,950 1,298,650 123,314 Description of Major Activities Projects anticipated for 2012 include: 1. Improvements to City-owned commercial building(s) to allow for active re-use of street-level spaces. 2. The possibility of initial reimbursement of TIF increment to the owners of 415 Howard Street, per the Redevelopment Agreement. City of Evanston Howard-Ridge TIF (Fund #330) The City Council adopted the Howard-Ridge Tax Increment Financing (TIF) District on January 26, 2004. The TIF District is generally bounded on the north by various parcels that front Howard Street and Chicago Avenue, on the east by the City of Evanston's boundaries and the Chicago Transit Authority (CTA) Red Line, on the south by City boundaries and on the west by Ridge Avenue. The TIF District contains mixed residential uses, retail/commercial properties and institutional uses. 67 of 84
  • 68. Financial Summary 2011 2011 2012 2010-11 Adopted Estimated Adopted Actual Budget Actual Budget Revenue By Source Bond Proceeds 6,572,922 5,078,500 5,177,539 3,900,000 Grants 1,957,587 4,231,473 3,800,000 3,168,000 Private Contributions - 575,000 - 1,301,200 General Fund Allocation - - - 1,250,000 Miscellaneous - 149,000 149,000 - Interest Income 49,068 - - - Total Revenue 8,579,577$ 10,033,973$ 9,126,539$ 9,619,200$ Expenditures Administration - 95,680 102,964 - Capital Outlay 7,816,007 13,014,138 7,788,631 13,515,358 Interfund Transfers Out 300,000 300,000 300,000 475,000 Total Expenditures 8,116,007$ 13,409,818$ 8,088,631$ 13,990,358$ Net Surplus (Deficit) 463,570$ (3,375,845)$ 1,037,908$ (4,371,158)$ Beginning Fund Balance 5,441,774 5,905,344 6,943,252 Ending Fund Balance 5,905,344 6,943,252 2,572,094 Description of Major Activities City of Evanston Capital Improvement Fund (Fund #415) This Fund accounts for all capital outlay expenditures not included in another Fund as outlined in the detailed Capital Improvement Plan. 68 of 84