Turbhe Fantastic Escorts📞📞9833754194 Kopar Khairane Marathi Call Girls-Kopar ...
alltel 3Q05_Highlights
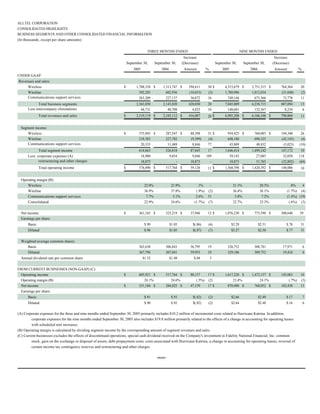
1. ALLTEL CORPORATION
CONSOLIDATED HIGHLIGHTS
BUSINESS SEGMENTS AND OTHER CONSOLIDATED FINANCIAL INFORMATION
(In thousands, except per share amounts)
THREE MONTHS ENDED NINE MONTHS ENDED
Increase Increase
September 30, September 30, (Decrease) September 30, September 30, (Decrease)
2005 2004 Amount % 2005 2004 Amount %
UNDER GAAP:
Revenues and sales:
Wireless $ 1,708,358 $ 1,313,747 $ 394,611 30 $ 4,515,679 $ 3,751,315 $ 764,364 20
Wireline 592,283 602,936 (10,653) (2) 1,780,986 1,812,034 (31,048) (2)
Communications support services 263,209 227,137 36,072 16 749,144 675,366 73,778 11
Total business segments 2,563,850 2,143,820 420,030 20 7,045,809 6,238,715 807,094 13
Less intercompany eliminations 44,731 40,708 4,023 10 140,601 132,367 8,234 6
Total revenues and sales $ 2,519,119 $ 2,103,112 $ 416,007 20 $ 6,905,208 $ 6,106,348 $ 798,860 13
Segment income:
Wireless $ 375,945 $ 287,547 $ 88,398 31 $ 954,425 $ 760,085 $ 194,340 26
Wireline 218,383 227,782 (9,399) (4) 648,180 690,325 (42,145) (6)
Communications support services 20,335 11,489 8,846 77 43,809 48,832 (5,023) (10)
Total segment income 614,663 526,818 87,845 17 1,646,414 1,499,242 147,172 10
Less: corporate expenses (A) 18,900 9,054 9,846 109 59,143 27,085 32,058 118
restructuring and other charges 18,873 - 18,873 - 18,873 51,765 (32,892) (64)
Total operating income $ 576,890 $ 517,764 $ 59,126 11 $ 1,568,398 $ 1,420,392 $ 148,006 10
Operating margin (B):
Wireless 22.0% 21.9% .1% - 21.1% 20.3% .8% 4
Wireline 36.9% 37.8% (.9%) (2) 36.4% 38.1% (1.7%) (4)
Communications support services 7.7% 5.1% 2.6% 51 5.8% 7.2% (1.4%) (19)
Consolidated 22.9% 24.6% (1.7%) (7) 22.7% 23.3% (.6%) (3)
Net income $ 361,165 $ 323,219 $ 37,946 12 $ 1,076,230 $ 775,590 $ 300,640 39
Earnings per share:
Basic $.99 $1.05 $(.06) (6) $3.29 $2.51 $.78 31
Diluted $.98 $1.05 $(.07) (7) $3.27 $2.50 $.77 31
Weighted average common shares:
Basic 363,638 306,843 56,795 19 326,752 308,781 17,971 6
Diluted 367,794 307,841 59,953 19 329,186 309,752 19,434 6
Annual dividend rate per common share $1.52 $1.48 $.04 3
FROM CURRENT BUSINESSES (NON-GAAP) (C):
Operating income $ 605,921 $ 517,764 $ 88,157 17 $ 1,617,220 $ 1,472,157 $ 145,063 10
Operating margin (B) 24.1% 24.6% (.5%) (2) 23.4% 24.1% (.7%) (3)
Net income $ 331,184 $ 284,025 $ 47,159 17 $ 870,490 $ 768,052 $ 102,438 13
Earnings per share:
Basic $.91 $.93 $(.02) (2) $2.66 $2.49 $.17 7
Diluted $.90 $.92 $(.02) (2) $2.64 $2.48 $.16 6
(A) Corporate expenses for the three and nine months ended September 30, 2005 primarily includes $10.2 million of incremental costs related to Hurricane Katrina. In addition,
corporate expenses for the nine months ended September 30, 2005 also includes $19.8 million primarily related to the effects of a change in accounting for operating leases
with scheduled rent increases.
(B) Operating margin is calculated by dividing segment income by the corresponding amount of segment revenues and sales.
(C) Current businesses excludes the effects of discontinued operations, special cash dividend received on the Company's investment in Fidelity National Financial, Inc. common
stock, gain on the exchange or disposal of assets, debt prepayment costs, costs associated with Hurricane Katrina, a change in accounting for operating leases, reversal of
certain income tax contingency reserves and restructuring and other charges.
-more-
2. ALLTEL CORPORATION
CONSOLIDATED STATEMENTS OF INCOME UNDER GAAP-Page 2
(In thousands, except per share amounts)
THREE MONTHS ENDED NINE MONTHS ENDED
September 30, September 30, September 30, September 30,
2005 2004 2005 2004
Revenues and sales:
Service revenues $ 2,229,370 $ 1,885,405 $ 6,116,896 $ 5,476,877
Product sales 289,749 217,707 788,312 629,471
Total revenues and sales 2,519,119 2,103,112 6,905,208 6,106,348
Costs and expenses:
Cost of services 719,683 624,442 2,006,888 1,769,402
Cost of products sold 343,718 262,604 933,556 775,942
Selling, general, administrative and other 470,966 373,624 1,298,967 1,121,676
Depreciation and amortization 388,989 324,678 1,078,526 967,171
Restructuring and other charges 18,873 - 18,873 51,765
Total costs and expenses 1,942,229 1,585,348 5,336,810 4,685,956
Operating income 576,890 517,764 1,568,398 1,420,392
Equity earnings in unconsolidated partnerships 10,434 24,338 36,391 53,516
Minority interest in consolidated partnerships (20,573) (23,647) (57,838) (60,869)
Other income, net 27,325 15,652 156,036 23,140
Interest expense (83,422) (86,699) (246,454) (264,978)
Gain on exchange or disposal of assets and other 30,557 - 218,830 -
Income from continuing operations before income taxes 541,211 447,408 1,675,363 1,171,201
Income taxes 206,068 143,727 625,155 415,149
Income from continuing operations 335,143 303,681 1,050,208 756,052
Discontinued operations:
Income from discontinued operations (net of income taxes) 26,022 19,538 26,022 19,538
Gain on sale of discontinued operations (net of income taxes) - - - -
Net income 361,165 323,219 1,076,230 775,590
Preferred dividends 24 25 72 78
Net income applicable to common shares $ 361,141 $ 323,194 $ 1,076,158 $ 775,512
Basic earnings per share:
Income from continuing operations $.92 $ .99 $3.21 $2.45
Income from discontinued operations .07 .06 .08 .06
Net income $.99 $1.05 $3.29 $2.51
Diluted earnings per share:
Income from continuing operations $.91 $ .99 $3.19 $2.44
Income from discontinued operations .07 .06 .08 .06
Net income $.98 $1.05 $3.27 $2.50
-more-
3. ALLTEL CORPORATION
RECONCILIATION OF RESULTS OF OPERATIONS UNDER GAAP TO RESULTS OF OPERATIONS FROM CURRENT BUSINESSES (NON-GAAP)-Page 3
for the three months ended September 30, 2005
(In thousands, except per share amounts)
Corporate
Results of Items Results of Segment Information Operations
Operations Excluded from Operations Communications and
Under Current from Current Support Intercompany
GAAP Businesses Businesses Wireless Wireline Services Eliminations
Revenues and sales:
Service revenues $ 2,229,370 $ - $ 2,229,370 $ 1,606,482 $ 580,561 $ 84,728 $ (42,401)
Product sales 289,749 - 289,749 101,876 11,722 178,481 (2,330)
Total revenues and sales 2,519,119 - 2,519,119 1,708,358 592,283 263,209 (44,731)
Costs and expenses:
Cost of services 719,683 (8,260) (A) 711,423 514,923 176,699 58,964 (39,163)
Cost of products sold 343,718 - 343,718 179,831 10,021 158,860 (4,994)
Selling, general, administrative and other 470,966 (1,898) (A) 469,068 379,806 66,154 16,710 6,398
Depreciation and amortization 388,989 - 388,989 257,853 121,026 8,340 1,770
Restructuring and other charges 18,873 (18,873) (B) - - - - -
Total costs and expenses 1,942,229 (29,031) 1,913,198 1,332,413 373,900 242,874 (35,989)
Operating income 605,921 $ 375,945 $ 218,383 $ 20,335 $ (8,742)
576,890 29,031
Equity earnings in unconsolidated partnerships 10,434 - 10,434
Minority interest in consolidated partnerships (20,573) - (20,573)
Other income, net 27,325 (5,000) (A) 22,325
Interest expense (83,422) - (83,422)
Gain on exchange or disposal of assets and other 30,557 (30,557) (C) -
Income from continuing operations before income taxes 541,211 (6,526) 534,685
Income taxes 206,068 (2,567) (H) 203,501
Income from continuing operations 335,143 (3,959) 331,184
Discontinued operations:
Income from discontinued operations (net of income taxes) 26,022 (26,022) (J) -
Gain on sale of discontinued operations (net of income taxes) - - -
Net income 361,165 (29,981) 331,184
Preferred dividends 24 - 24
Net income applicable to common shares $ 361,141 $ (29,981) $ 331,160
Basic earnings per share:
Income from continuing operations $.92 $(.01) $.91
Income from discontinued operations (.07)
.07 -
Net income $.99 $(.08) $.91
Diluted earnings per share:
Income from continuing operations $.91 $(.01) $.90
Income from discontinued operations .07 (.07) -
Net income $.98 $(.08) $.90
See notes on pages 7 and 8 for a description of the line items marked (A) - (J).
-more-
4. ALLTEL CORPORATION
RECONCILIATION OF RESULTS OF OPERATIONS UNDER GAAP TO RESULTS OF OPERATIONS FROM CURRENT BUSINESSES (NON-GAAP)-Page 4
for the three months ended September 30, 2004
(In thousands, except per share amounts)
Corporate
Results of Items Results of Segment Information Operations
Operations Excluded from Operations Communications and
Under Current from Current Support Intercompany
GAAP Businesses Businesses Wireless Wireline Services Eliminations
Revenues and sales:
Service revenues $ 1,885,405 $ - $ 1,885,405 $ 1,239,409 $ 592,373 $ 86,862 $ (33,239)
Product sales 217,707 - 217,707 74,338 10,563 140,275 (7,469)
Total revenues and sales 2,103,112 - 2,103,112 1,313,747 602,936 227,137 (40,708)
Costs and expenses:
Cost of services 624,442 - 624,442 406,660 179,719 68,910 (30,847)
Cost of products sold 262,604 - 262,604 139,301 7,822 124,575 (9,094)
Selling, general, administrative and other 373,624 - 373,624 294,070 60,033 13,593 5,928
Depreciation and amortization 324,678 - 324,678 186,169 127,580 8,570 2,359
Restructuring and other charges - - - - - - -
Total costs and expenses 1,585,348 - 1,585,348 1,026,200 375,154 215,648 (31,654)
Operating income 517,764 $ 287,547 $ 227,782 $ 11,489 $ (9,054)
517,764 -
Equity earnings in unconsolidated partnerships 24,338 - 24,338
Minority interest in consolidated partnerships (23,647) - (23,647)
Other income, net 15,652 - 15,652
Interest expense (86,699) - (86,699)
Gain on exchange or disposal of assets and other - - -
Income from continuing operations before income taxes 447,408 - 447,408
Income taxes 143,727 19,656 (I) 163,383
Income from continuing operations 303,681 (19,656) 284,025
Discontinued operations:
Income from discontinued operations (net of income taxes) 19,538 (19,538) (I) -
Gain on sale of discontinued operations (net of income taxes) - - -
Net income 323,219 (39,194) 284,025
Preferred dividends 25 - 25
Net income applicable to common shares $ 323,194 $ (39,194) $ 284,000
Basic earnings per share:
Income from continuing operations $ .99 $(.06) $.93
Income from discontinued operations (.06)
.06 -
Net income $1.05 $(.12) $.93
Diluted earnings per share:
Income from continuing operations $ .99 $(.07) $.92
Income from discontinued operations (.06)
.06 -
Net income $1.05 $(.13) $.92
See notes on pages 7 and 8 for a description of the line items marked (A) - (J).
-more-
5. ALLTEL CORPORATION
RECONCILIATION OF RESULTS OF OPERATIONS UNDER GAAP TO RESULTS OF OPERATIONS FROM CURRENT BUSINESSES (NON-GAAP)-Page 5
for the nine months ended September 30, 2005
(In thousands, except per share amounts)
Corporate
Results of Items Results of Segment Information Operations
Operations Excluded from Operations Communications and
Under Current from Current Support Intercompany
GAAP Businesses Businesses Wireless Wireline Services Eliminations
Revenues and sales:
Service revenues $ 6,116,896 $ - $ 6,116,896 $ 4,251,948 $ 1,748,392 $ 240,342 $ (123,786)
Product sales 788,312 - 788,312 263,731 32,594 508,802 (16,815)
Total revenues and sales 6,905,208 - 6,905,208 4,515,679 1,780,986 749,144 (140,601)
Costs and expenses:
Cost of services 2,006,888 (28,051) (A) (E) 1,978,837 1,374,402 540,390 178,083 (114,038)
Cost of products sold 933,556 - 933,556 478,915 26,020 453,319 (24,698)
Selling, general, administrative and other 1,298,967 (1,898) (A) 1,297,069 1,034,026 192,622 48,620 21,801
Depreciation and amortization 1,078,526 - 1,078,526 673,911 373,774 25,313 5,528
Restructuring and other charges 18,873 (18,873) (B) - - - - -
Total costs and expenses 5,336,810 (48,822) 5,287,988 3,561,254 1,132,806 705,335 (111,407)
Operating income 1,617,220 $ 954,425 $ 648,180 $ 43,809 $ (29,194)
1,568,398 48,822
Equity earnings in unconsolidated partnerships 36,391 - 36,391
Minority interest in consolidated partnerships (57,838) - (57,838)
Other income, net 156,036 (116,036) (A) (F) 40,000
Interest expense (246,454) - (246,454)
Gain on exchange or disposal of assets and other 218,830 (218,830) (C) (D) -
Income from continuing operations before income taxes 1,675,363 (286,044) 1,389,319
Income taxes 625,155 (106,326) (H) 518,829
Income from continuing operations 1,050,208 (179,718) 870,490
Discontinued operations:
Income from discontinued operations (net of income taxes) 26,022 (26,022) (J) -
Gain on sale of discontinued operations (net of income taxes) - - -
Net income 1,076,230 (205,740) 870,490
Preferred dividends 72 - 72
Net income applicable to common shares $ 1,076,158 $ (205,740) $ 870,418
Basic earnings per share:
Income from continuing operations $3.21 $(.55) $2.66
Income from discontinued operations (.08)
.08 -
Net income $3.29 $(.63) $2.66
Diluted earnings per share:
Income from continuing operations $3.19 $(.55) $2.64
Income from discontinued operations (.08)
.08 -
Net income $3.27 $(.63) $2.64
See notes on pages 7 and 8 for a description of the line items marked (A) - (J).
-more-
6. ALLTEL CORPORATION
RECONCILIATION OF RESULTS OF OPERATIONS UNDER GAAP TO RESULTS OF OPERATIONS FROM CURRENT BUSINESSES (NON-GAAP)-Page 6
for the nine months ended September 30, 2004
(In thousands, except per share amounts)
Corporate
Results of Items Results of Segment Information Operations
Operations Excluded from Operations Communications and
Under Current from Current Support Intercompany
GAAP Businesses Businesses Wireless Wireline Services Eliminations
Revenues and sales:
Service revenues $ 5,476,877 $ - $ 5,476,877 $ 3,538,462 $ 1,783,473 $ 265,200 $ (110,258)
Product sales 629,471 - 629,471 212,853 28,561 410,166 (22,109)
Total revenues and sales 6,106,348 - 6,106,348 3,751,315 1,812,034 675,366 (132,367)
Costs and expenses:
Cost of services 1,769,402 - 1,769,402 1,144,462 531,189 193,548 (99,797)
Cost of products sold 775,942 - 775,942 418,899 20,135 367,242 (30,334)
Selling, general, administrative and other 1,121,676 - 1,121,676 882,821 181,861 39,873 17,121
Depreciation and amortization 967,171 - 967,171 545,048 388,524 25,871 7,728
Restructuring and other charges 51,765 (51,765) (G) - - - - -
Total costs and expenses 4,685,956 (51,765) 4,634,191 2,991,230 1,121,709 626,534 (105,282)
Operating income 1,472,157 $ 760,085 $ 690,325 $ 48,832 $ (27,085)
1,420,392 51,765
Equity earnings in unconsolidated partnerships 53,516 - 53,516
Minority interest in consolidated partnerships (60,869) - (60,869)
Other income, net 23,140 - 23,140
Interest expense (264,978) - (264,978)
Gain on exchange or disposal of assets and other - - -
Income from continuing operations before income taxes 1,171,201 51,765 1,222,966
Income taxes 415,149 39,765 (H) (I) 454,914
Income from continuing operations 756,052 12,000 768,052
Discontinued operations:
Income from discontinued operations (net of income taxes) 19,538 (19,538) (I) -
Gain on sale of discontinued operations (net of income taxes) - - -
Net income 775,590 (7,538) 768,052
Preferred dividends 78 - 78
Net income applicable to common shares $ 775,512 $ (7,538) $ 767,974
Basic earnings per share:
Income from continuing operations $2.45 $ .04 $2.49
Income from discontinued operations (.06)
.06 -
Net income $2.51 $(.02) $2.49
Diluted earnings per share:
Income from continuing operations $2.44 $ .04 $2.48
Income from discontinued operations (.06)
.06 -
Net income $2.50 $(.02) $2.48
See notes on pages 7 and 8 for a description of the line items marked (A) - (J).
-more-
7. ALLTEL CORPORATION
NOTES TO RECONCILIATIONS OF RESULTS OF OPERATIONS UNDER GAAP TO RESULTS OF OPERATIONS FROM CURRENT BUSINESSES (NON-GAAP)-Page 7
As disclosed in the ALLTEL Corporation (quot;Alltelquot; or the quot;Companyquot;) Form 8-K filed on October 21, 2005, Alltel has presented in this earnings release results of operations from
current businesses which exclude the effects of discontinued operations, a special cash dividend received on the Company's investment in Fidelity National Financial, Inc.
(quot;Fidelity Nationalquot;) common stock, gain on exchange or disposal of assets, termination fees associated with the early retirement of long-term debt, costs associated with
Hurricane Katrina, a change in accounting for certain operating leases, reversal of certain income tax contingency reserves and restructuring and other charges. Alltel’s purpose
for excluding items from the current business measures is to focus on Alltel’s true earnings capacity associated with providing telecommunication services. Management
believes the items excluded from the current business measures are related to strategic activities or other events, specific to the time and opportunity available, and, accordingly,
should be excluded when evaluating the trends of the Company’s operations.
Alltel believes that presenting the current business measures assists investors in assessing the true business performance of the Company by clarifying for investors the effects
that certain items such as asset sales, restructuring expenses and other business consolidation costs arising from past acquisition and restructuring activities had on the
Company’s GAAP consolidated results of operations. The Company uses results from current businesses as management’s primary measure of the performance of its business
segments. Alltel management, including the chief operating decision-maker, uses the current business measures consistently for all purposes, including internal reporting
purposes, the evaluation of business objectives, opportunities and performance and the determination of management compensation.
As the Company evaluates segment performance based on segment income, which is computed as revenues and sales less operating expenses, the special cash dividend, gain
on the exchange or disposal of assets, early termination of debt, costs associated with Hurricane Katrina, the effects of the change in accounting for operating leases and
restructuring and other charges have not been allocated to the business segments. In addition, none of the non-operating items such as equity earnings in unconsolidated
partnerships, minority interest expense, other income, net, interest expense and income taxes have been allocated to the segments.
(A) Alltel incurred $10.2 million of incremental costs related to Hurricane Katrina consisting of increased long distance and roaming expenses due to providing these services to
affected customers at no charge, system maintenance costs to restore network facilities and additional losses from bad debts. These incremental costs also included Company
donations to support the hurricane relief efforts. These incremental expenses were partially offset by $5.0 million of insurance proceeds received to date by Alltel.
(B) The Company incurred $2.4 million of integration expenses related to its acquisition completed on August 1, 2005 of Western Wireless Corporation (quot;Western Wirelessquot;). These
expenses primarily consisted of system conversion and relocation costs. In addition, the Company incurred $11.9 million of integration expenses related to the exchange of
certain wireless assets with Cingular Wireless LLC (quot;Cingularquot;) completed during the second and third quarters of 2005. These expenses consisted of handset subsidies incurred
to migrate the acquired customer base to CDMA handsets. The Company also incurred $4.6 million in restructuring charges associated with its wireline operations. These
charges consisted of severance and employee benefit costs related to a planned workforce reduction.
(C) Primarily due to certain minority partners' right-of-first-refusal, three of the wireless partnership interests to be exchanged between Alltel and Cingular, as discussed in Note D
below, were not completed until July 29, 2005. As a result of completing the exchange transaction, Alltel recorded an additional pretax gain of $30.5 million.
(D) On April 15, 2005, Alltel and Cingular completed the exchange of certain wireless assets. In connection with this transaction, Alltel recorded a pretax gain of $127.5 million. On
April 6, 2005, Alltel recorded a pretax gain of $75.8 million from the sale of all of its shares of Fidelity National common stock. In addition, on April 8, 2005, Alltel retired all of its
issued and outstanding 7.50 percent senior notes due March 1, 2006, representing an aggregate principal amount of $450.0 million. Concurrent with the debt redemption, Alltel
also terminated the related pay variable/receive fixed, interest rate swap agreement that had been designated as a fair value hedge against the $450.0 million senior notes. In
connection with the early termination of the debt and interest rate swap agreement, Alltel incurred net pretax termination fees of approximately $15.0 million.
(E) Effective January 1, 2005, Alltel changed its accounting for operating leases with scheduled rent increases. Certain of the Company's operating lease agreements for cell sites and
for office and retail locations include scheduled rent escalations during the initial lease term and/or during succeeding optional renewal periods. Previously, the Company had
not recognized the scheduled increases in rent expense on a straight-line basis in accordance with the provisions of Statement of Financial Accounting Standards No. 13,
quot;Accounting for Leasesquot; and Financial Accounting Standards Board Technical Bulletin No. 85-3, quot;Accounting for Operating Leases with Scheduled Rent Increasesquot;. The
effects of this change, which are included in corporate expenses, were not material to the Company's previously reported consolidated results of operations, financial position or
cash flows.
-more-
8. ALLTEL CORPORATION
NOTES TO RECONCILIATIONS OF RESULTS OF OPERATIONS UNDER GAAP TO RESULTS OF OPERATIONS FROM CURRENT BUSINESSES (NON-GAAP)-Page 8
(F) On March 9, 2005, Fidelity National declared a special $10 per share cash dividend to Fidelity National stockholders. The special cash dividend was received by Alltel on March
28, 2005.
(G) The Company announced its plans to reorganize its operating structure and exit its competitive local exchange carrier operations in the Jacksonville, Florida market. In connection
with these activities, the Company recorded a restructuring charge of $29.3 million consisting of severance and employee benefit costs related to a planned workforce reduction,
employee relocation costs, lease termination and other restructuring-related costs. The Company also recorded a $2.3 million reduction in the liabilities associated with various
restructuring activities initiated prior to 2003. In addition, the Company recorded a write-down of $24.8 million in the carrying value of certain corporate and regional facilities to fair
value in conjunction with the proposed leasing or sale of those facilities.
(H) Tax-related effect of the items discussed in Notes A - G above.
(I) During the third quarter of 2004, the Internal Revenue Service (“IRS”) completed its fieldwork related to the audits of the Company’s consolidated federal income tax returns for the
fiscal years 1997 through 2001. As a result of the IRS completing this phase of their audits, Alltel reassessed its income tax contingency reserves related to the periods under
examination. Based upon this reassessment, Alltel recorded a $129.3 million reduction in its income tax contingency reserves in the third quarter of 2004. The corresponding effects
of the reversal of these tax contingencies resulted in a reduction in goodwill of $94.5 million and a reduction in income tax expense associated with continuing operations of $19.7
million. In addition, $15.1 million of the income tax contingency reserves reversed related to the financial services division of Alltel’s information services subsidiary, ALLTEL
Information Services, Inc., that was sold to Fidelity National on April 1, 2003. Pursuant to the terms of the sale agreement, Alltel retained, as of the date of sale,
all income tax liabilities related to the sold operations and agreed to indemnify Fidelity National from any future tax liability imposed on the financial services division for periods
prior to the date of sale. The adjustment of the tax contingency reserves related to the disposed financial services division has been reported as “discontinued operations” in the
Company’s interim consolidated financial statements for the three and nine months ended September 30, 2004. Discontinued operations for the three and nine months ended
September 30, 2004 also included a tax benefit of $4.4 million attributable to a foreign tax credit carryback recognized as a result of the IRS audits.
(J) Eliminates the effects of discontinued operations. On August 1, 2005, Alltel completed its acquisition of Western Wireless. As a condition of receiving approval for the acquisition
from the Department of Justice and the Federal Communications Commission, Alltel agreed to divest certain wireless operations of Western Wireless in 16 markets in Arkansas,
Kansas and Nebraska. In September 2005, Alltel completed the sale of international operations in Georgia and Ghana acquired from Western Wireless. Alltel also has entered into
definitive agreements to sell the Austria and Irish operations acquired from Western Wireless and Alltel is actively pursuing the disposition of all remaining international
operations and interests acquired from Western Wireless. As a result, the acquired international operations and interests of Western Wireless and the 16 markets to be divested in
Arkansas, Kansas and Nebraska have been classified as discontinued operations and assets held for sale in the accompanying consolidated financial statements.
-more-
9. ALLTEL CORPORATION
SUPPLEMENTAL OPERATING INFORMATION-Page 9
(Dollars in thousands, except per customer amounts)
THREE MONTHS ENDED NINE MONTHS ENDED
Increase Increase
September 30, September 30, (Decrease) September 30, September 30, (Decrease)
% %
2005 2004 Amount 2005 2004 Amount
Wireless:
Controlled POPs 75,410,320 61,313,088 14,097,232 23
Customers 10,424,710 8,394,727 2,029,983 24
Penetration rate 13.8% 13.7% .1 % 1
Average customers 9,956,726 8,369,785 1,586,941 19 9,229,636 8,234,494 995,142 12
Gross customer additions:
Internal 729,618 641,994 87,624 14 1,992,367 2,029,528 (37,161) (2)
Acquired 1,336,315 - 1,336,315 - 1,602,806 - 1,602,806 -
Total 2,065,933 641,994 1,423,939 222 3,595,173 2,029,528 1,565,645 77
Net customer additions:
Internal 20,887 58,254 (37,367) (64) 195,417 371,302 (175,885) (47)
Acquired 1,336,315 - 1,336,315 - 1,602,806 - 1,602,806 -
Total 1,357,202 58,254 1,298,948 2,230 1,798,223 371,302 1,426,921 384
Customer acquisition costs:
Cost of products sold $ 83,821 $ 78,043 $ 5,778 7 $ 216,034 $ 242,180 $ (26,146) (11)
Selling and marketing expenses 231,886 181,505 50,381 28 615,816 545,317 70,499 13
Less product sales 61,611 55,235 6,376 12 162,516 159,344 3,172 2
Total $ 254,096 $ 204,313 $ 49,783 24 $ 669,334 $ 628,153 $ 41,181 7
Cost to acquire a new customer (A) $348 $318 $30 9 $336 $310 $26 8
Cash costs:
Cost of services $ 514,923 $ 406,660 $ 108,263 27 $ 1,374,402 $ 1,144,462 $ 229,940 20
Cost of products sold 179,831 139,301 40,530 29 478,915 418,899 60,016 14
Selling, general, administrative and other 379,806 294,070 85,736 29 1,034,026 882,821 151,205 17
Less product sales 101,876 74,338 27,538 37 263,731 212,853 50,878 24
Total 972,684 765,693 206,991 27 2,623,612 2,233,329 390,283 17
Less customer acquisition costs 254,096 204,313 49,783 24 669,334 628,153 41,181 7
Total $ 718,588 $ 561,380 $ 157,208 28 $ 1,954,278 $ 1,605,176 $ 349,102 22
Cash cost per unit per month, excluding
customer acquisition costs (B) $24.06 $22.36 $1.70 8 $23.53 $21.66 $1.87 9
Revenues:
Service revenues $ 1,606,482 $ 1,239,409 $ 367,073 30 $ 4,251,948 $ 3,538,462 $ 713,486 20
Less wholesale revenues 170,221 103,356 66,865 65 373,514 277,698 95,816 35
Retail revenues $ 1,436,261 $ 1,136,053 $ 300,208 26 $ 3,878,434 $ 3,260,764 $ 617,670 19
Average revenue per customer per month (C) $53.78 $49.36 $4.42 9 $51.19 $47.75 $3.44 7
Retail revenue per customer per month (D) $48.08 $45.24 $2.84 6 $46.69 $44.00 $2.69 6
Retail minutes of use per customer per month (E) 614 516 98 19 586 480 106 22
Postpay churn 1.92% 1.80% .12% 7 1.75% 1.77% (.02%) (1)
Total churn 2.37% 2.33% .04% 2 2.17% 2.24% (.07%) (3)
Service revenue operating margin (F) 23.4% 23.2% .2% 1 22.4% 21.5% .9% 4
Capital expenditures (G) $233,788 $200,337 $33,451 17 $707,530 $526,870 $180,660 34
(A) Cost to acquire a new customer is calculated by dividing the sum of the GAAP reported cost of products sold and sales and marketing expenses (included within quot;Selling,
general, administrative and otherquot;) less product sales, as reported in the Consolidated Statements of Income, by the number of internal gross customer additions in the
period. Customer acquisition costs exclude amounts related to the Company's customer retention efforts.
(B) Cash cost per unit per month, excluding customer acquisition costs, is calculated by dividing the sum of the GAAP reported cost of services, cost of products sold, selling,
general, administrative and other expenses less product sales, as reported in the Consolidated Statements of Income, less customer acquisition costs, by the number
of average customers for the period.
(C) Average revenue per customer per month is calculated by dividing wireless service revenues by average customers for the period.
(D) Retail revenue per customer per month is calculated by dividing wireless retail revenues (service revenues less wholesale revenues) by average customers for the period.
(E) Retail minutes of use per customer per month represents the average monthly minutes that Alltel's customers use on both the Company's network and while roaming on other
carriers' networks.
(F) Service revenue operating margin is calculated by dividing wireless segment income by wireless service revenues.
(G) Includes capitalized software development costs.
-more-
10. ALLTEL CORPORATION
SUPPLEMENTAL OPERATING INFORMATION-Page 10
(Dollars in thousands, except per customer amounts)
THREE MONTHS ENDED NINE MONTHS ENDED
Increase Increase
September 30, September 30, (Decrease) September 30, September 30, (Decrease)
% %
2005 2004 Amount 2005 2004 Amount
Wireline:
Customers 2,919,862 3,040,512 (120,650) (4)
Average customers 2,937,588 3,052,548 (114,960) (4) 2,966,491 3,074,185 (107,694) (4)
Broadband customers 359,975 216,885 143,090 66
Net broadband additions 40,660 22,351 18,309 82 116,650 63,857 52,793 83
Average revenue per customer per month (H) $67.21 $65.84 $1.37 2 $66.71 $65.49 $1.22 2
Capital expenditures (G) $78,172 $80,659 $(2,487) (3) $236,596 $235,768 $828 -
Communications support services:
Long-distance customers 1,757,069 1,739,974 17,095 1
Capital expenditures (G) $4,208 $4,500 $(292) (6) $9,827 $9,412 $415 4
Consolidated:
Equity free cash flow (I) $403,738 $323,183 $80,555 25 $994,554 $954,379 $40,175 4
Capital expenditures (G) $316,435 $285,520 $30,915 11 $954,462 $780,844 $173,618 22
Total assets $23,796,703 $16,368,782 $7,427,921 45
(G) Includes capitalized software development costs.
(H) Average revenue per customer per month is calculated by dividing total wireline revenues by average customers for the period.
(I) Equity free cash flow is calculated as the sum of net income from current businesses plus depreciation and amortization less capital expenditures which includes capitalized
software development costs as indicated in Note G.
-more-
11. ALLTEL CORPORATION
CONSOLIDATED BALANCE SHEETS UNDER GAAP-Page 11
(In thousands)
ASSETS LIABILITIES AND SHAREHOLDERS' EQUITY
September 30, December 31, September 30, December 31,
2005 2004 2005 2004
CURRENT ASSETS: CURRENT LIABILITIES:
Cash and short-term investments $ 69,428 $ 484,934 Current maturities of long-term debt $ 137,920 $ 224,958
Accounts receivable (less allowance for Accounts payable 496,027 448,161
doubtful accounts of $76,414 and Advance payments and customer deposits 224,152 219,338
$53,606, respectively) 1,116,991 912,665 Accrued taxes 224,125 158,197
Inventories 177,026 156,785 Accrued dividends 145,481 105,922
Prepaid expenses and other 131,159 62,383 Accrued interest 81,300 120,259
2,739,566 -
Assets held for sale Current deferred income taxes 490,491 -
244,090 183,523
Other current liabilities
Total current assets Liabilities related to assets held for sale
4,234,170 1,616,767 397,965 -
Investments 359,295 804,861 Total current liabilities 2,441,551 1,460,358
Goodwill 8,827,913 4,875,718
Other intangibles 1,977,344 1,306,140
Long-term debt 5,805,200 5,352,422
Deferred income taxes 1,681,917 1,715,119
PROPERTY, PLANT AND EQUIPMENT: Other liabilities 955,756 947,172
Land 287,618 278,084
Buildings and improvements 1,189,690 1,134,824
Wireline 6,886,844 6,735,748
Wireless 6,664,603 5,763,965
Information processing 1,150,249 1,048,446 SHAREHOLDERS' EQUITY:
Other 494,307 489,936 Preferred stock 287 307
494,266 385,283
Under construction Common stock 382,917 302,268
Additional paid-in capital 5,313,384 197,902
Total property, plant and equipment 17,167,577 15,836,286 Unrealized holding gain on investments 23,512 153,926
9,158,549 8,288,195
Less accumulated depreciation Foreign currency translation adjustment 26,895 482
7,165,284 6,473,780
Retained earnings
8,009,028 7,548,091
Net property, plant and equipment
12,912,279 7,128,665
Total shareholders' equity
388,953 452,159
Other assets
TOTAL LIABILITIES AND
$ 23,796,703 $ 16,603,736 $ 23,796,703 $ 16,603,736
TOTAL ASSETS SHAREHOLDERS' EQUITY
-more-
12. ALLTEL CORPORATION
CONSOLIDATED STATEMENTS OF CASH FLOWS UNDER GAAP-Page 12
(In thousands)
THREE MONTHS ENDED NINE MONTHS ENDED
September 30, September 30, September 30, September 30,
2005 2004 2005 2004
Net Cash Provided from Operations:
Net income $ 361,165 $ 323,219 $ 1,076,230 $ 775,590
Adjustments to reconcile net income to net cash provided from
operations:
Income from discontinued operations (26,022) (19,538) (26,022) (19,538)
Depreciation and amortization 388,989 324,678 1,078,526 967,171
Provision for doubtful accounts 61,360 48,504 152,019 137,270
Non-cash portion of gain on exchange or disposal of assets and other (30,557) - (232,742) -
Non-cash portion of restructuring and other charges 10,000 - 10,000 25,569
Increase in deferred income taxes 11,786 42,672 18,067 188,596
Reversal of income tax contingency reserves - (19,656) - (19,656)
Other, net 941 (8,305) 12,057 (8,475)
Changes in operating assets and liabilities, net of the effects of
acquisitions and dispositions:
Accounts receivable (99,575) (98,737) (205,408) (164,276)
Inventories 18,520 (14,894) 16,225 10,908
Accounts payable 27,815 (17,718) (3,480) (93,028)
Other current liabilities (94,407) 24,239 6,210 64,112
Other, net 28,495 11,427 428 (20,185)
Net cash provided from operations 658,510 595,891 1,902,110 1,844,058
Cash Flows from Investing Activities:
Additions to property, plant and equipment (304,406) (276,742) (915,545) (757,280)
Additions to capitalized software development costs (12,029) (8,778) (38,917) (23,564)
Additions to investments (75) (279) (957) (2,805)
Purchases of property, net of cash acquired (912,317) - (1,136,049) -
Proceeds from the sale of assets - - 36,162 -
Proceeds from the sale of investments 436 - 353,881 -
Proceeds from the return on investments 10,569 30,169 30,957 67,115
Other, net 4,848 3,637 7,951 (594)
Net cash used in investing activities (1,212,974) (251,993) (1,662,517) (717,128)
Cash Flows from Financing Activities:
Dividends on preferred and common stock (124,449) (114,047) (345,169) (345,347)
Reductions in long-term debt (2,203,727) (2,044) (2,656,640) (254,994)
Distributions to minority investors (17,799) (16,994) (44,808) (49,677)
Long-term debt issued 877,700 - 927,700 -
Repurchases of common stock - (263,898) - (506,931)
Common stock issued 43,477 14,074 1,442,790 20,727
Net cash used in financing activities (1,424,798) (382,909) (676,127) (1,136,222)
Net cash provided from discontinued operations 36,189 - 36,189 -
Effect of exchange rate changes on cash and short-term investments (15,161) (22) (15,161) (87)
Decrease in cash and short-term investments (1,958,234) (39,033) (415,506) (9,379)
Cash and Short-term Investments:
Beginning of the period 2,027,662 687,418 484,934 657,764
End of the period $ 69,428 $ 648,385 $ 69,428 $ 648,385
-more-
13. ALLTEL CORPORATION
RECONCILIATIONS OF RESULTS OF OPERATIONS UNDER GAAP TO RESULTS OF OPERATIONS FROM CURRENT BUSINESSES (NON-GAAP)-Page 13
(In thousands)
THREE MONTHS ENDED NINE MONTHS ENDED
September 30, September 30, September 30, September 30,
2005 2004 2005 2004
Net cash provided from operations $ 658,510 $ 595,891 $ 1,902,110 $ 1,844,058
Adjustments to reconcile to net income under GAAP:
Income from discontinued operations 26,022 19,538 26,022 19,538
Depreciation and amortization expense (388,989) (324,678) (1,078,526) (967,171)
Provision for doubtful accounts (61,360) (48,504) (152,019) (137,270)
Non-cash portion of gain on exchange or disposal of assets and other 30,557 - 232,742 -
Non-cash portion of restructuring and other charges (10,000) - (10,000) (25,569)
Change in deferred income taxes (11,786) (42,672) (18,067) (188,596)
Reversal of income tax contingency reserves - 19,656 - 19,656
Other non-cash changes, net (941) 8,305 (12,057) 8,475
Changes in operating assets and liabilities, net of the
effects of acquisitions and dispositions 119,152 95,683 186,025 202,469
Net income under GAAP 361,165 323,219 1,076,230 775,590
Adjustments to reconcile to net income from current businesses:
Restructuring and other charges, net of tax 11,569 - 11,569 31,656
Gain on exchange or disposal of assets and other, net of tax (18,681) - (136,720) -
Special dividend received on Fidelity National common stock,
net of tax - - (69,812) -
Change in accounting for operating leases, net of tax - - 12,092 -
Hurricane-related costs, net of insurance recoveries and tax 3,153 - 3,153 -
Reversal of income tax contingency reserves - (19,656) - (19,656)
Income from discontinued operations (26,022) (19,538) (26,022) (19,538)
Net income from current businesses 331,184 284,025 870,490 768,052
Adjustments to reconcile to equity free cash flow from current businesses:
Depreciation and amortization expense 388,989 324,678 1,078,526 967,171
Capital expenditures (316,435) (285,520) (954,462) (780,844)
Equity free cash flow from current businesses $ 403,738 $ 323,183 $ 994,554 $ 954,379
-end-