
Download as PDF, PPTX
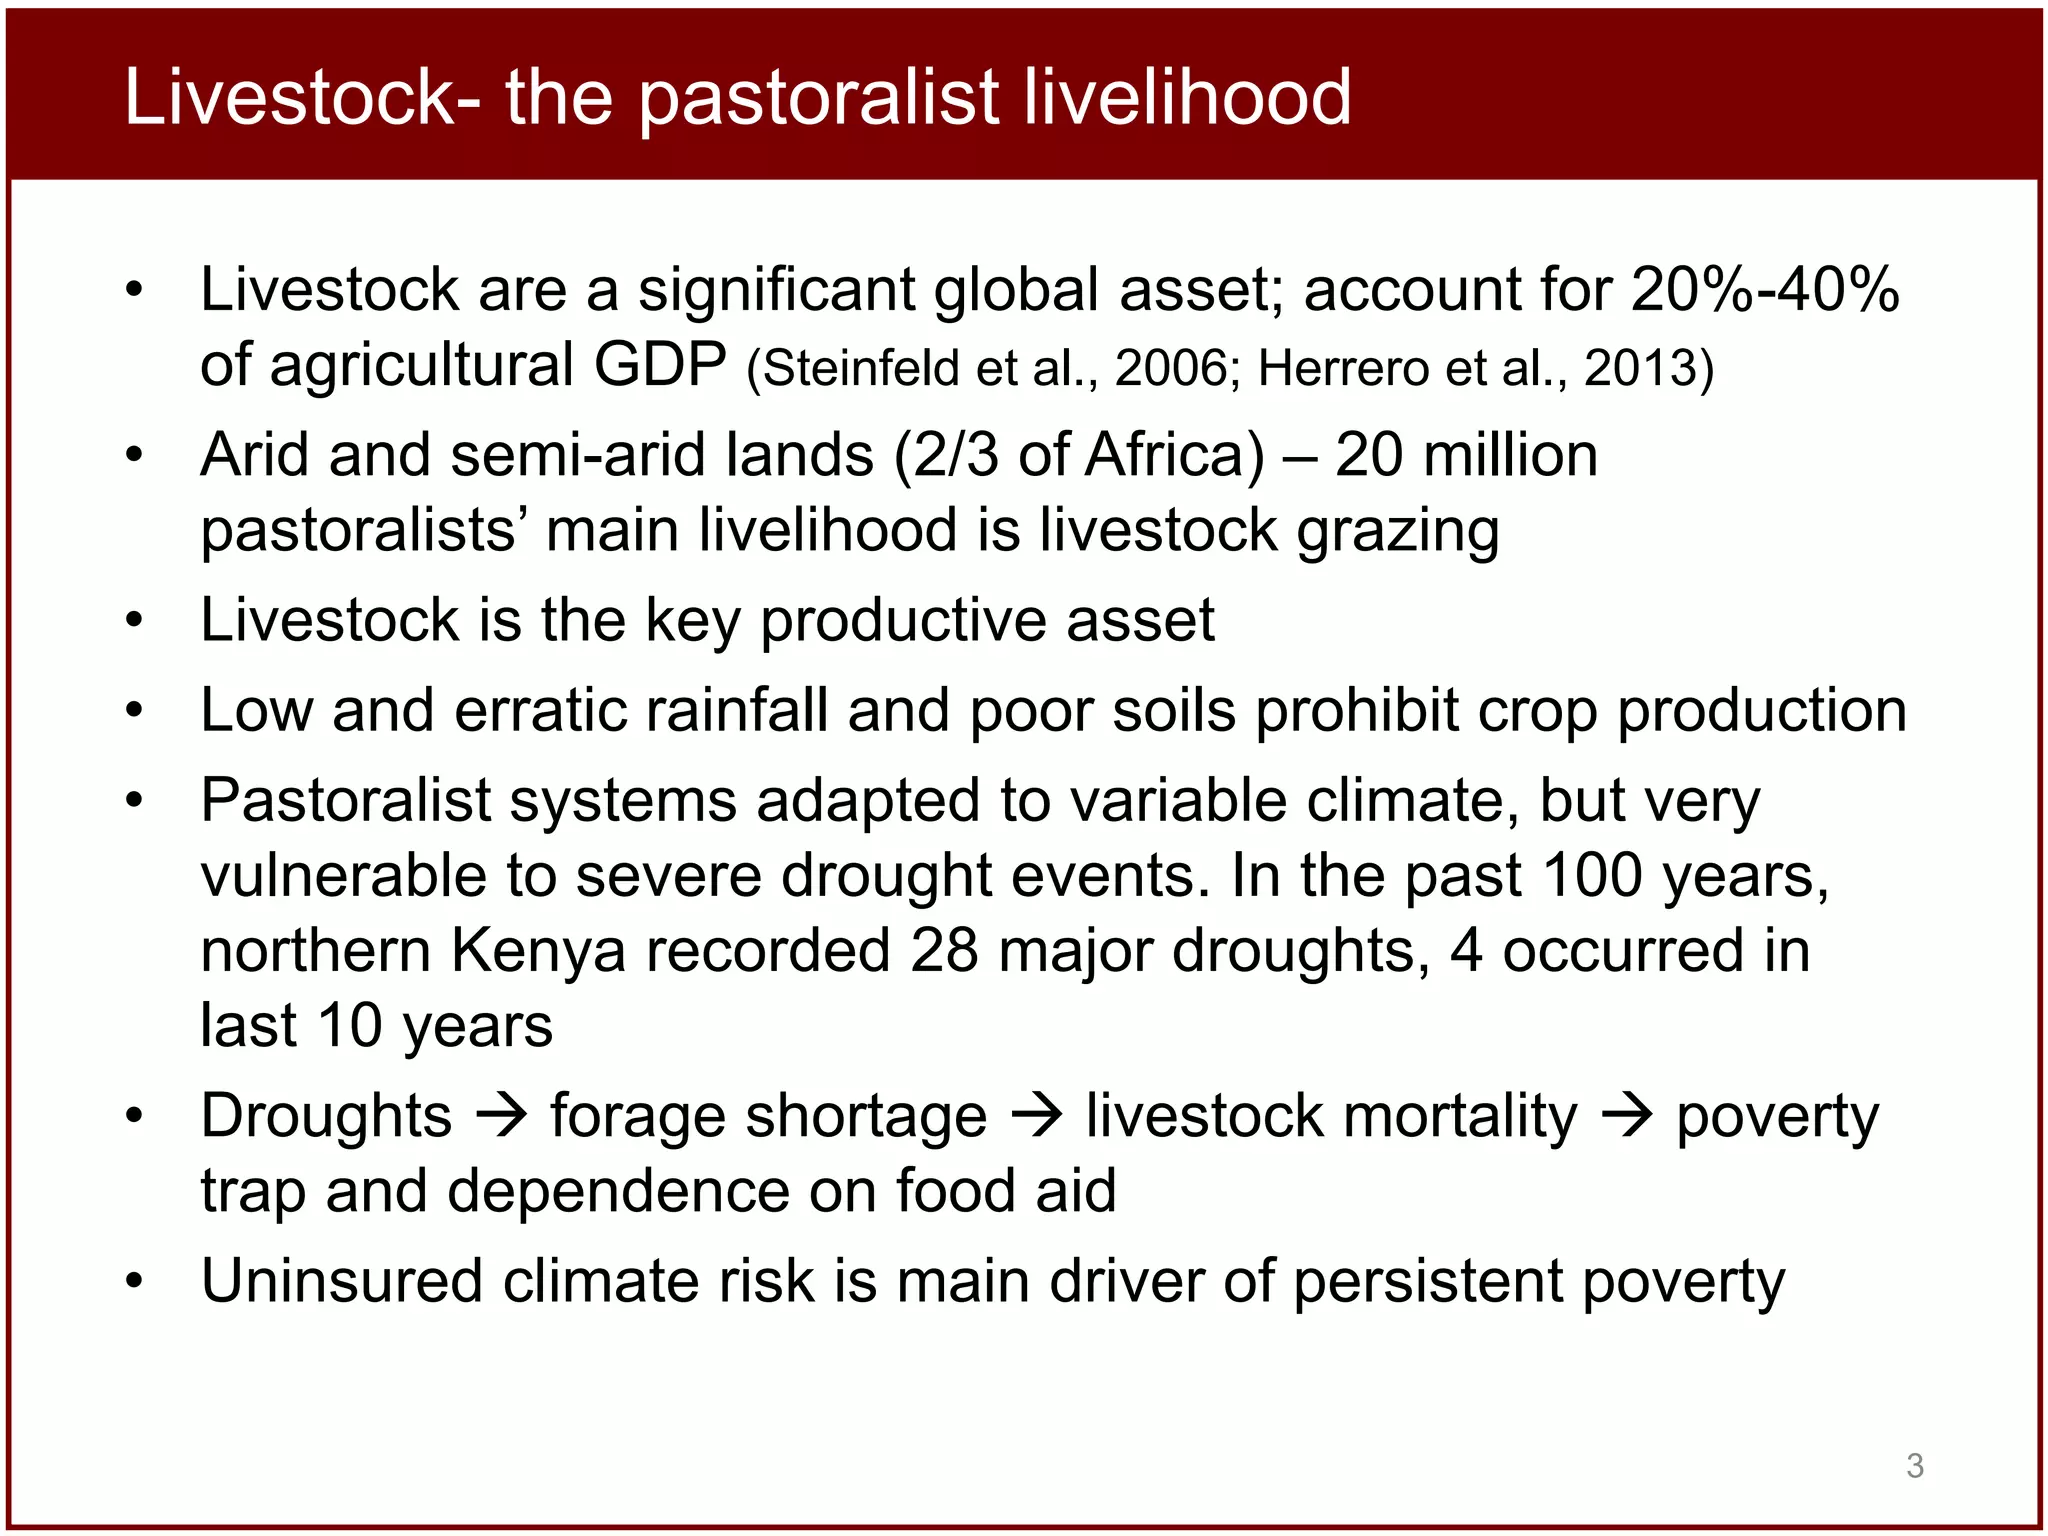
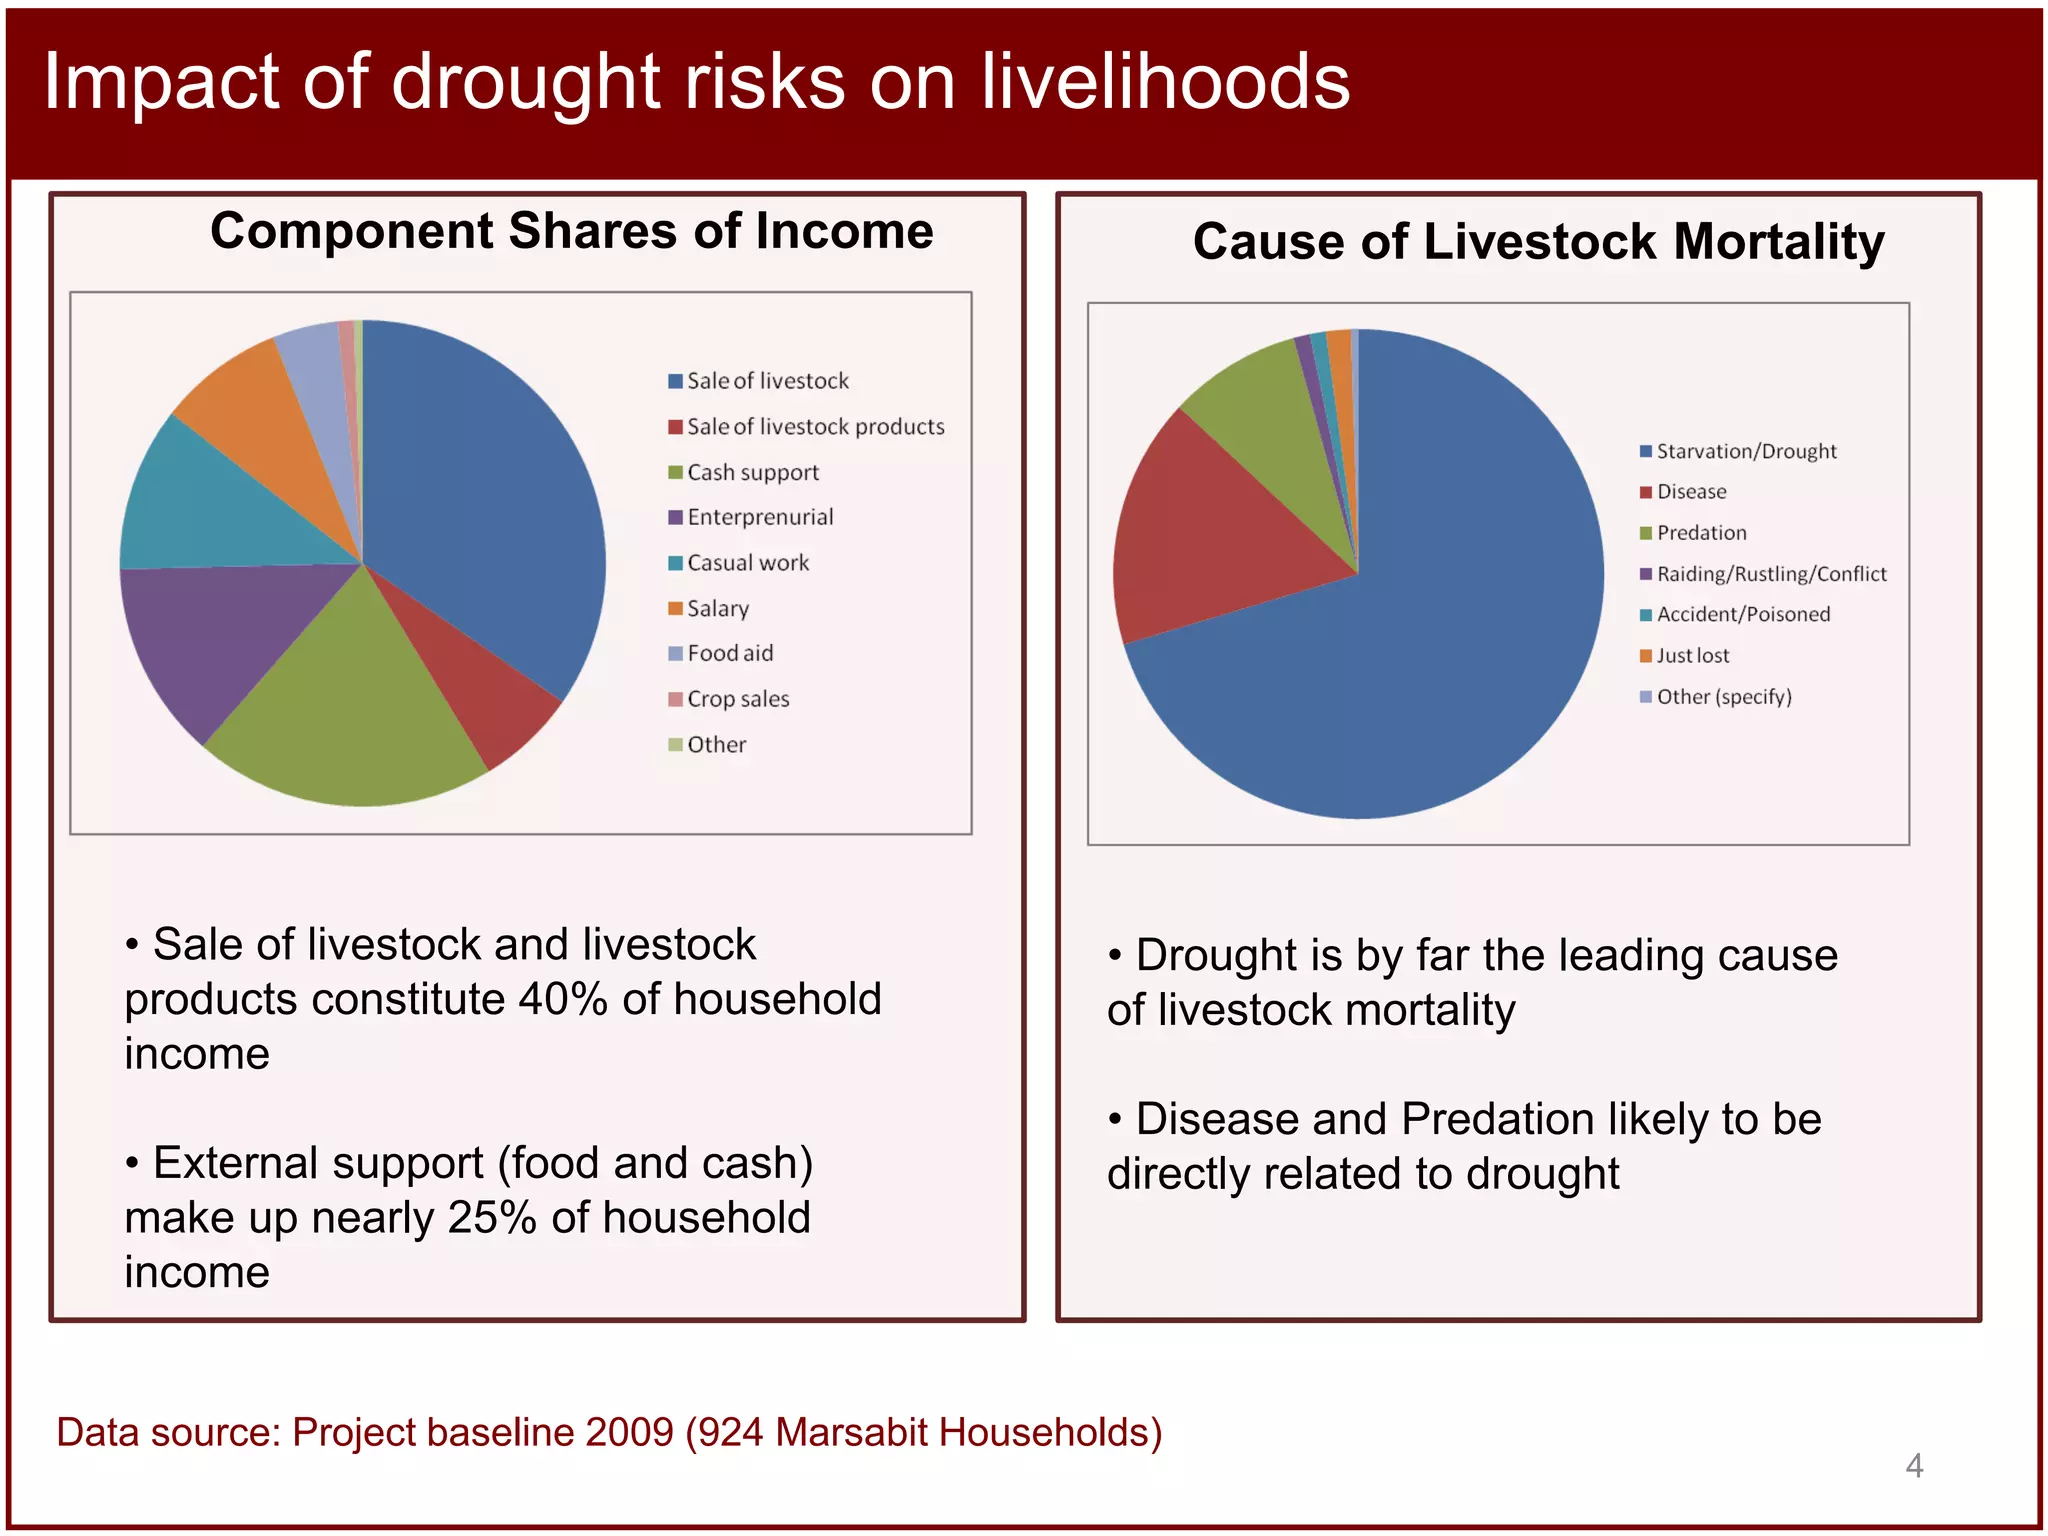
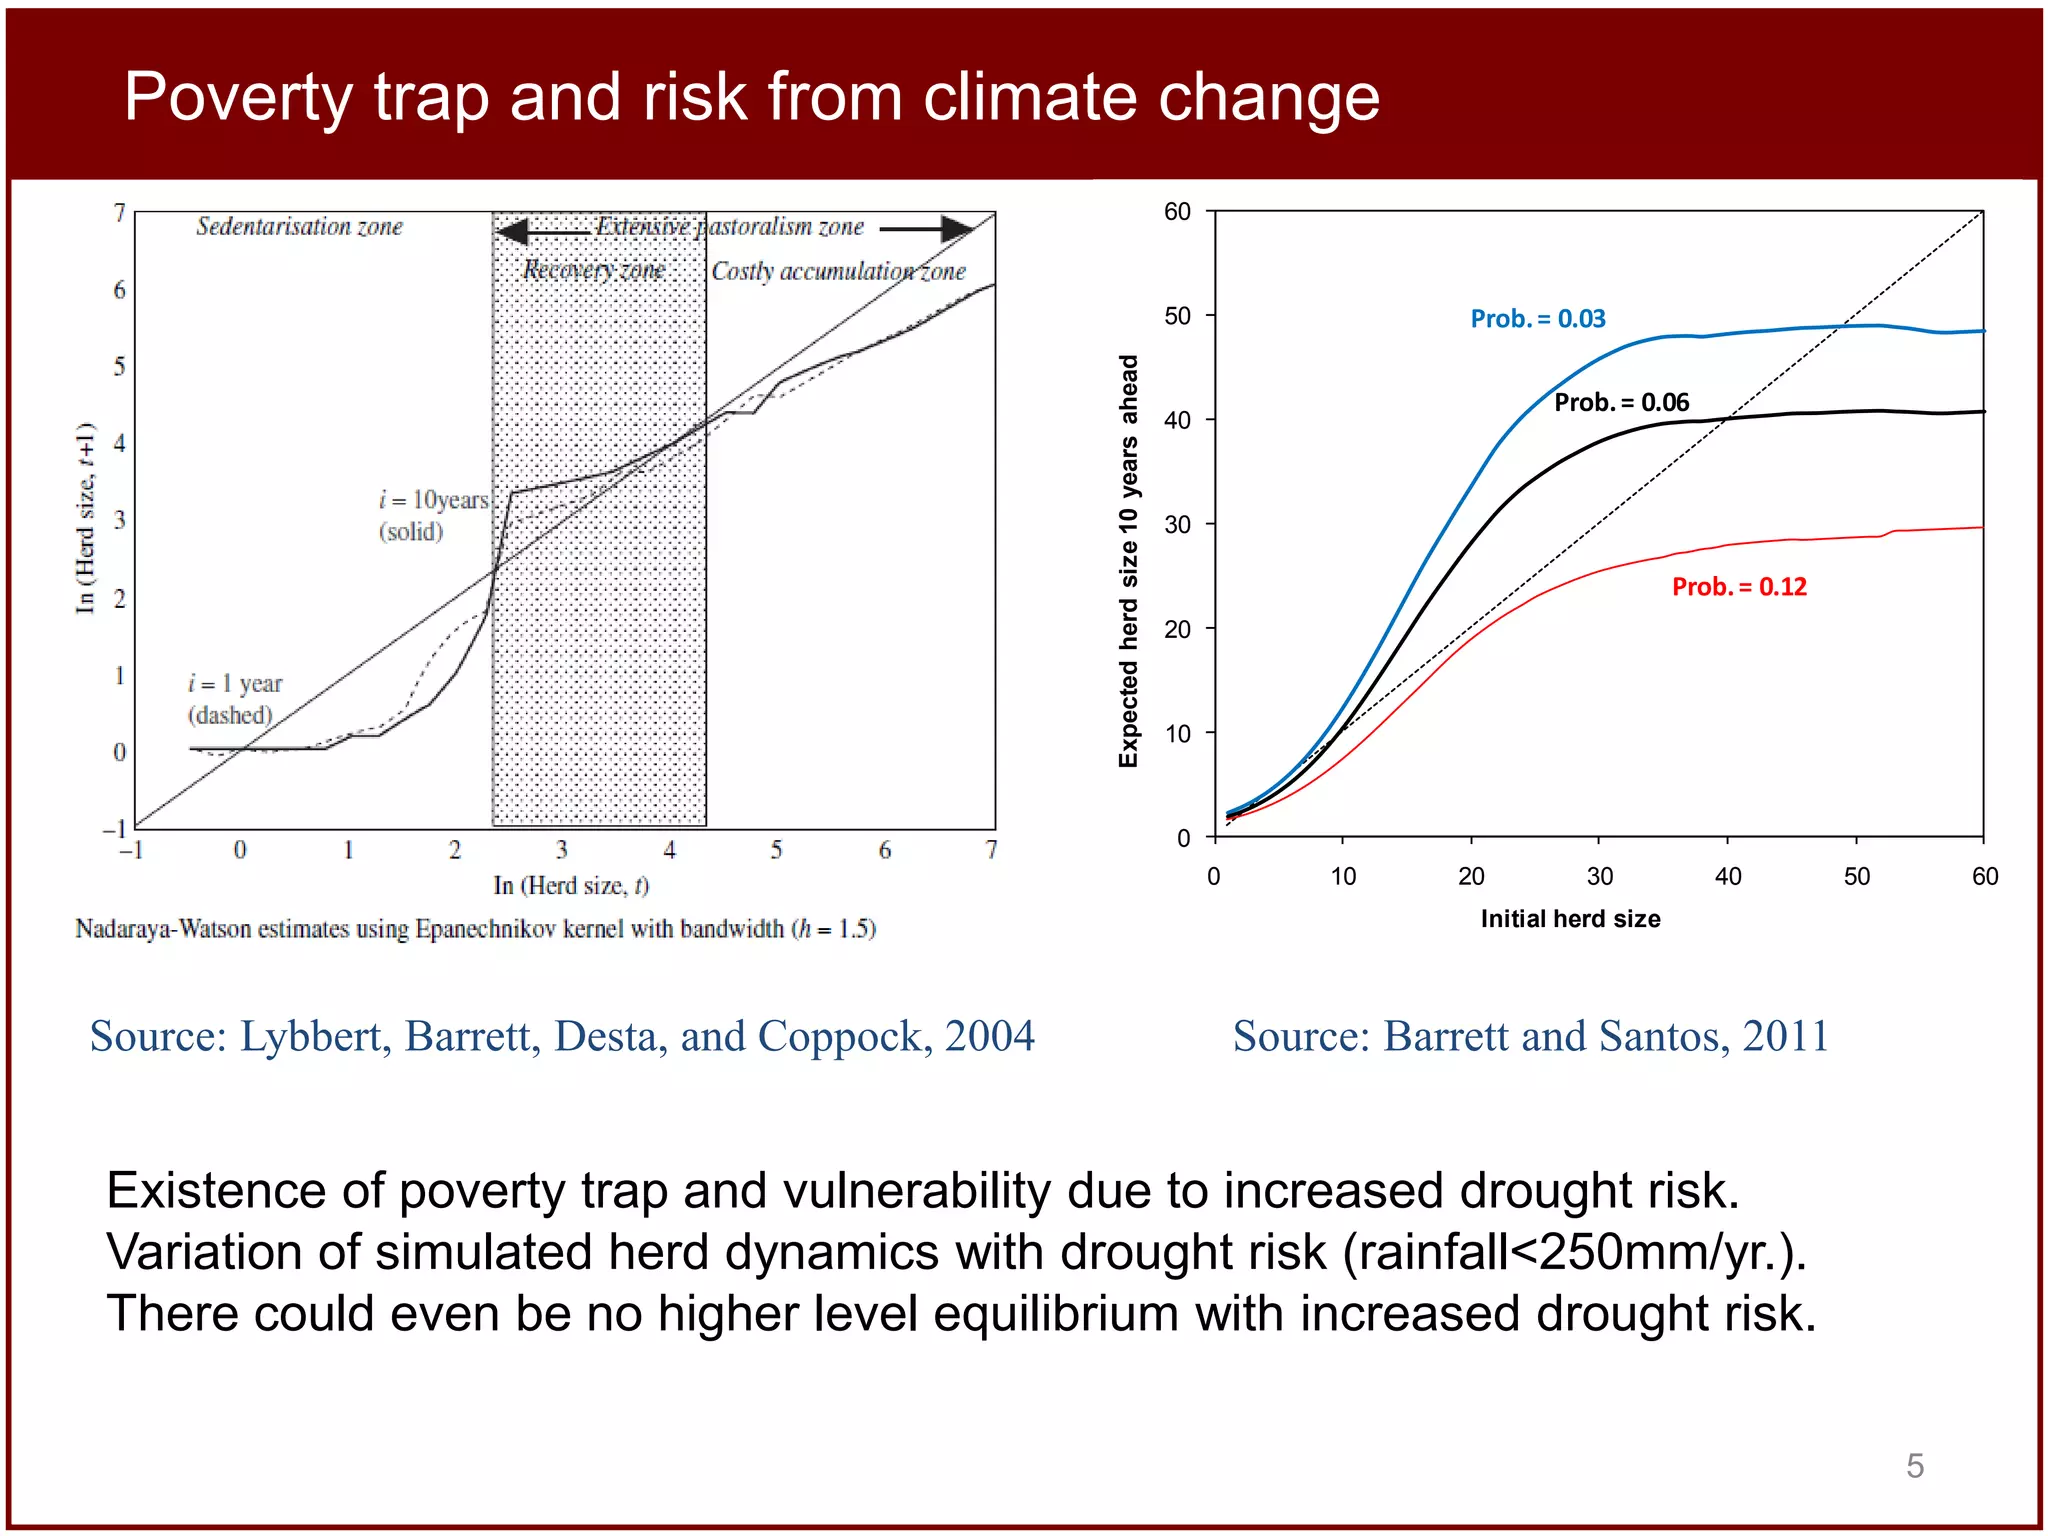
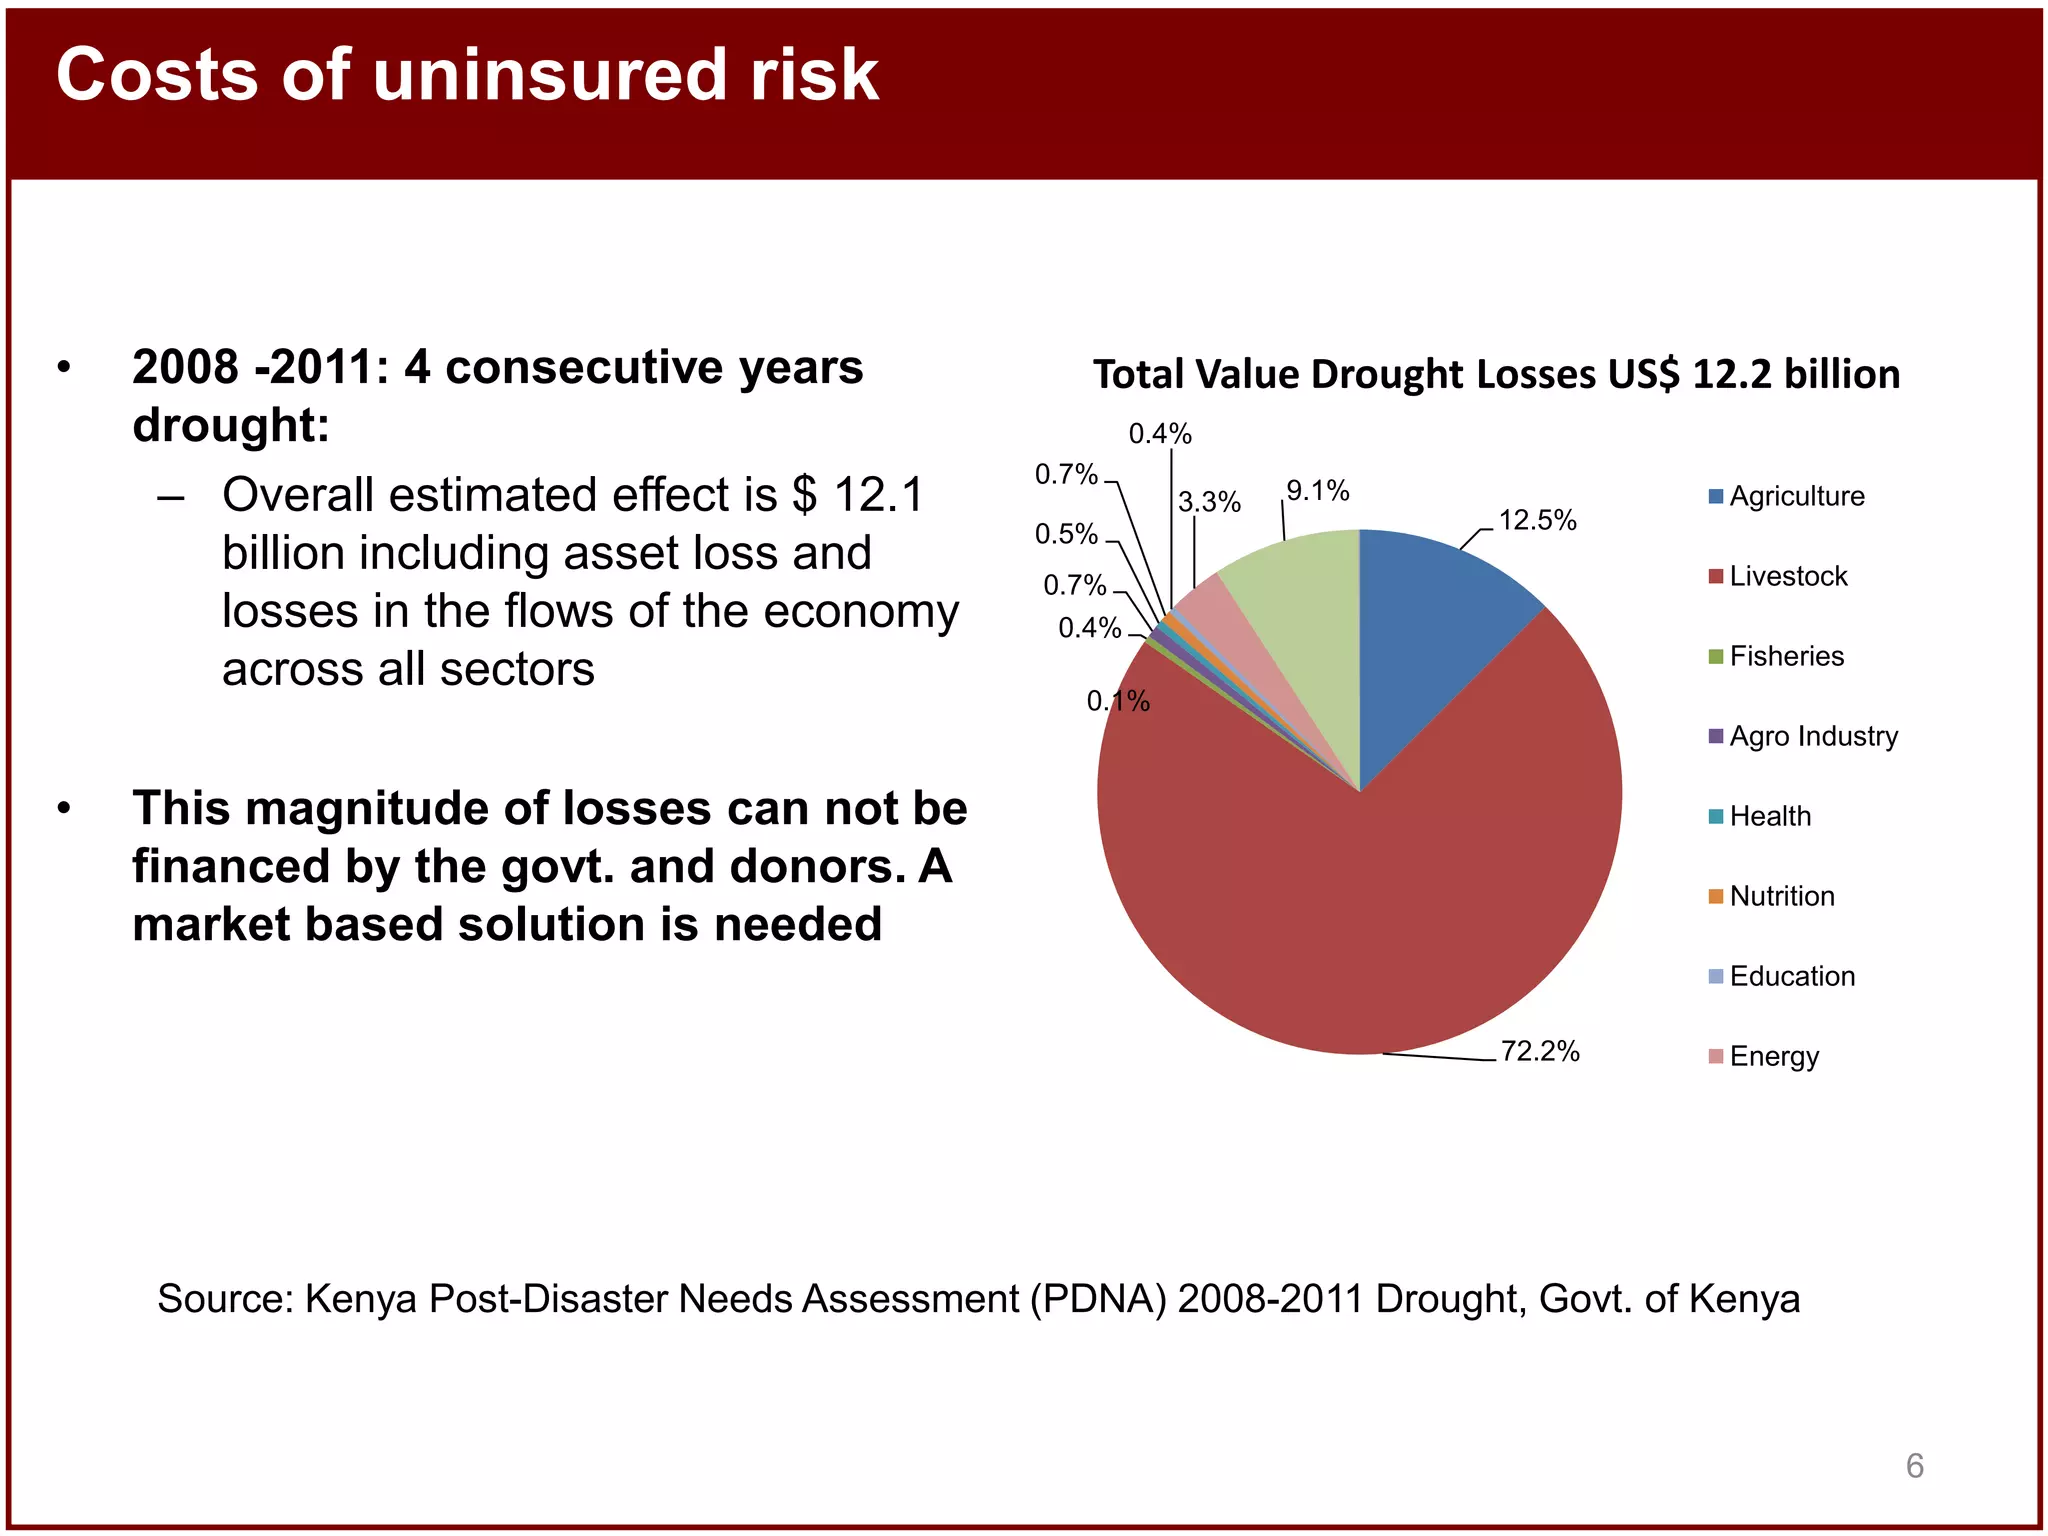
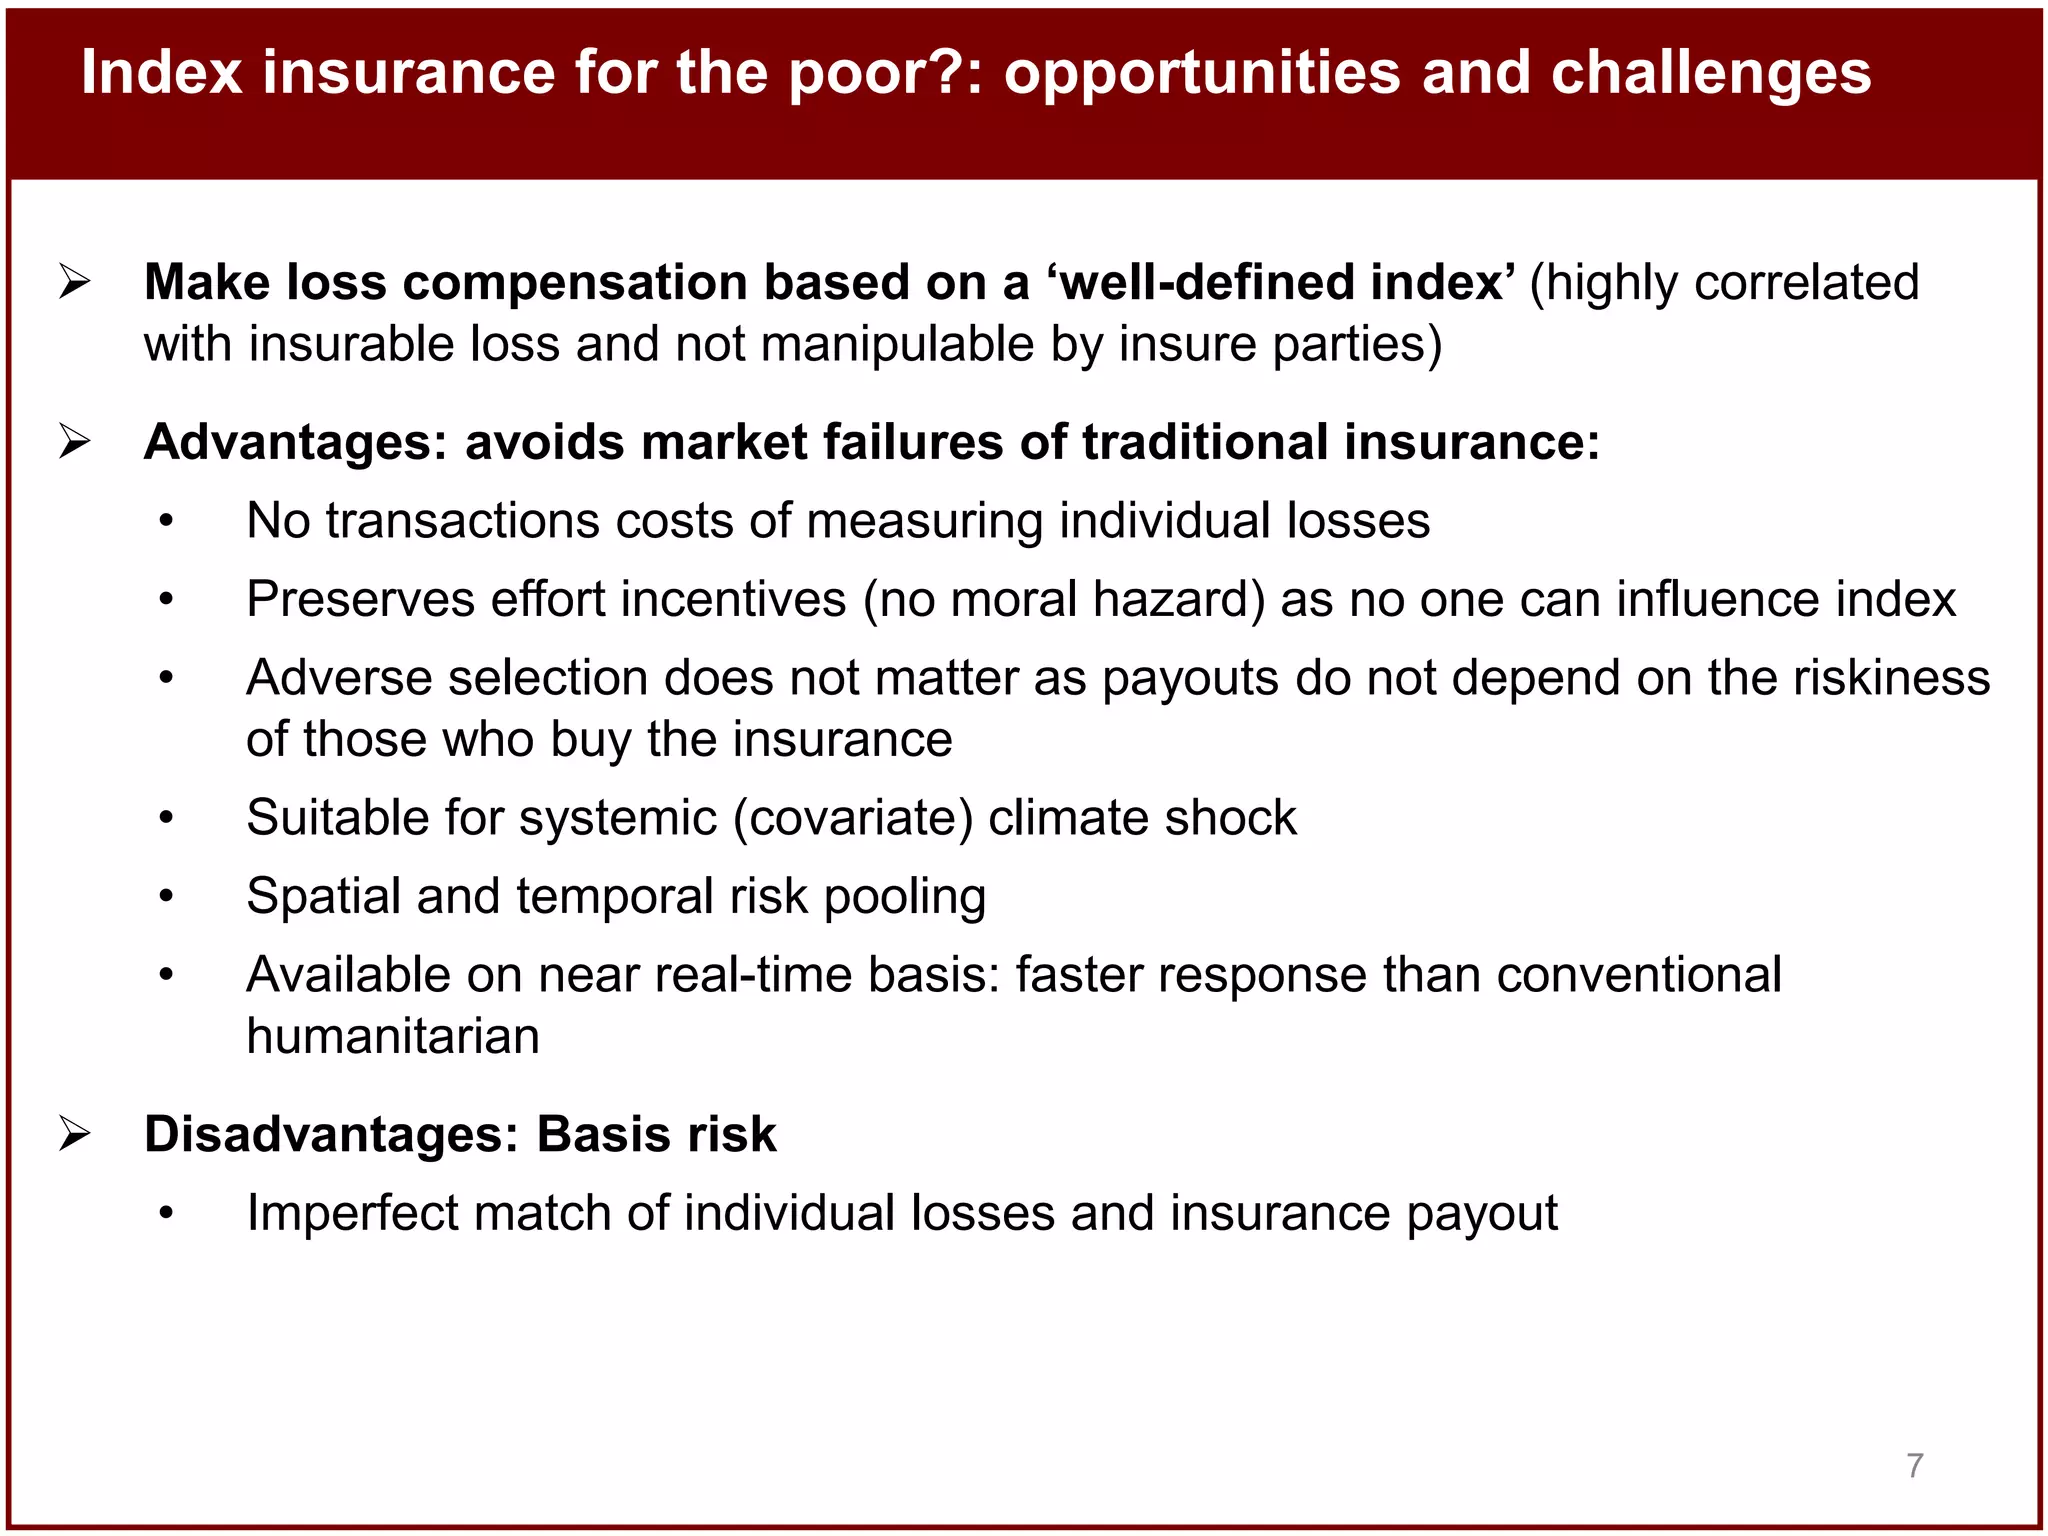
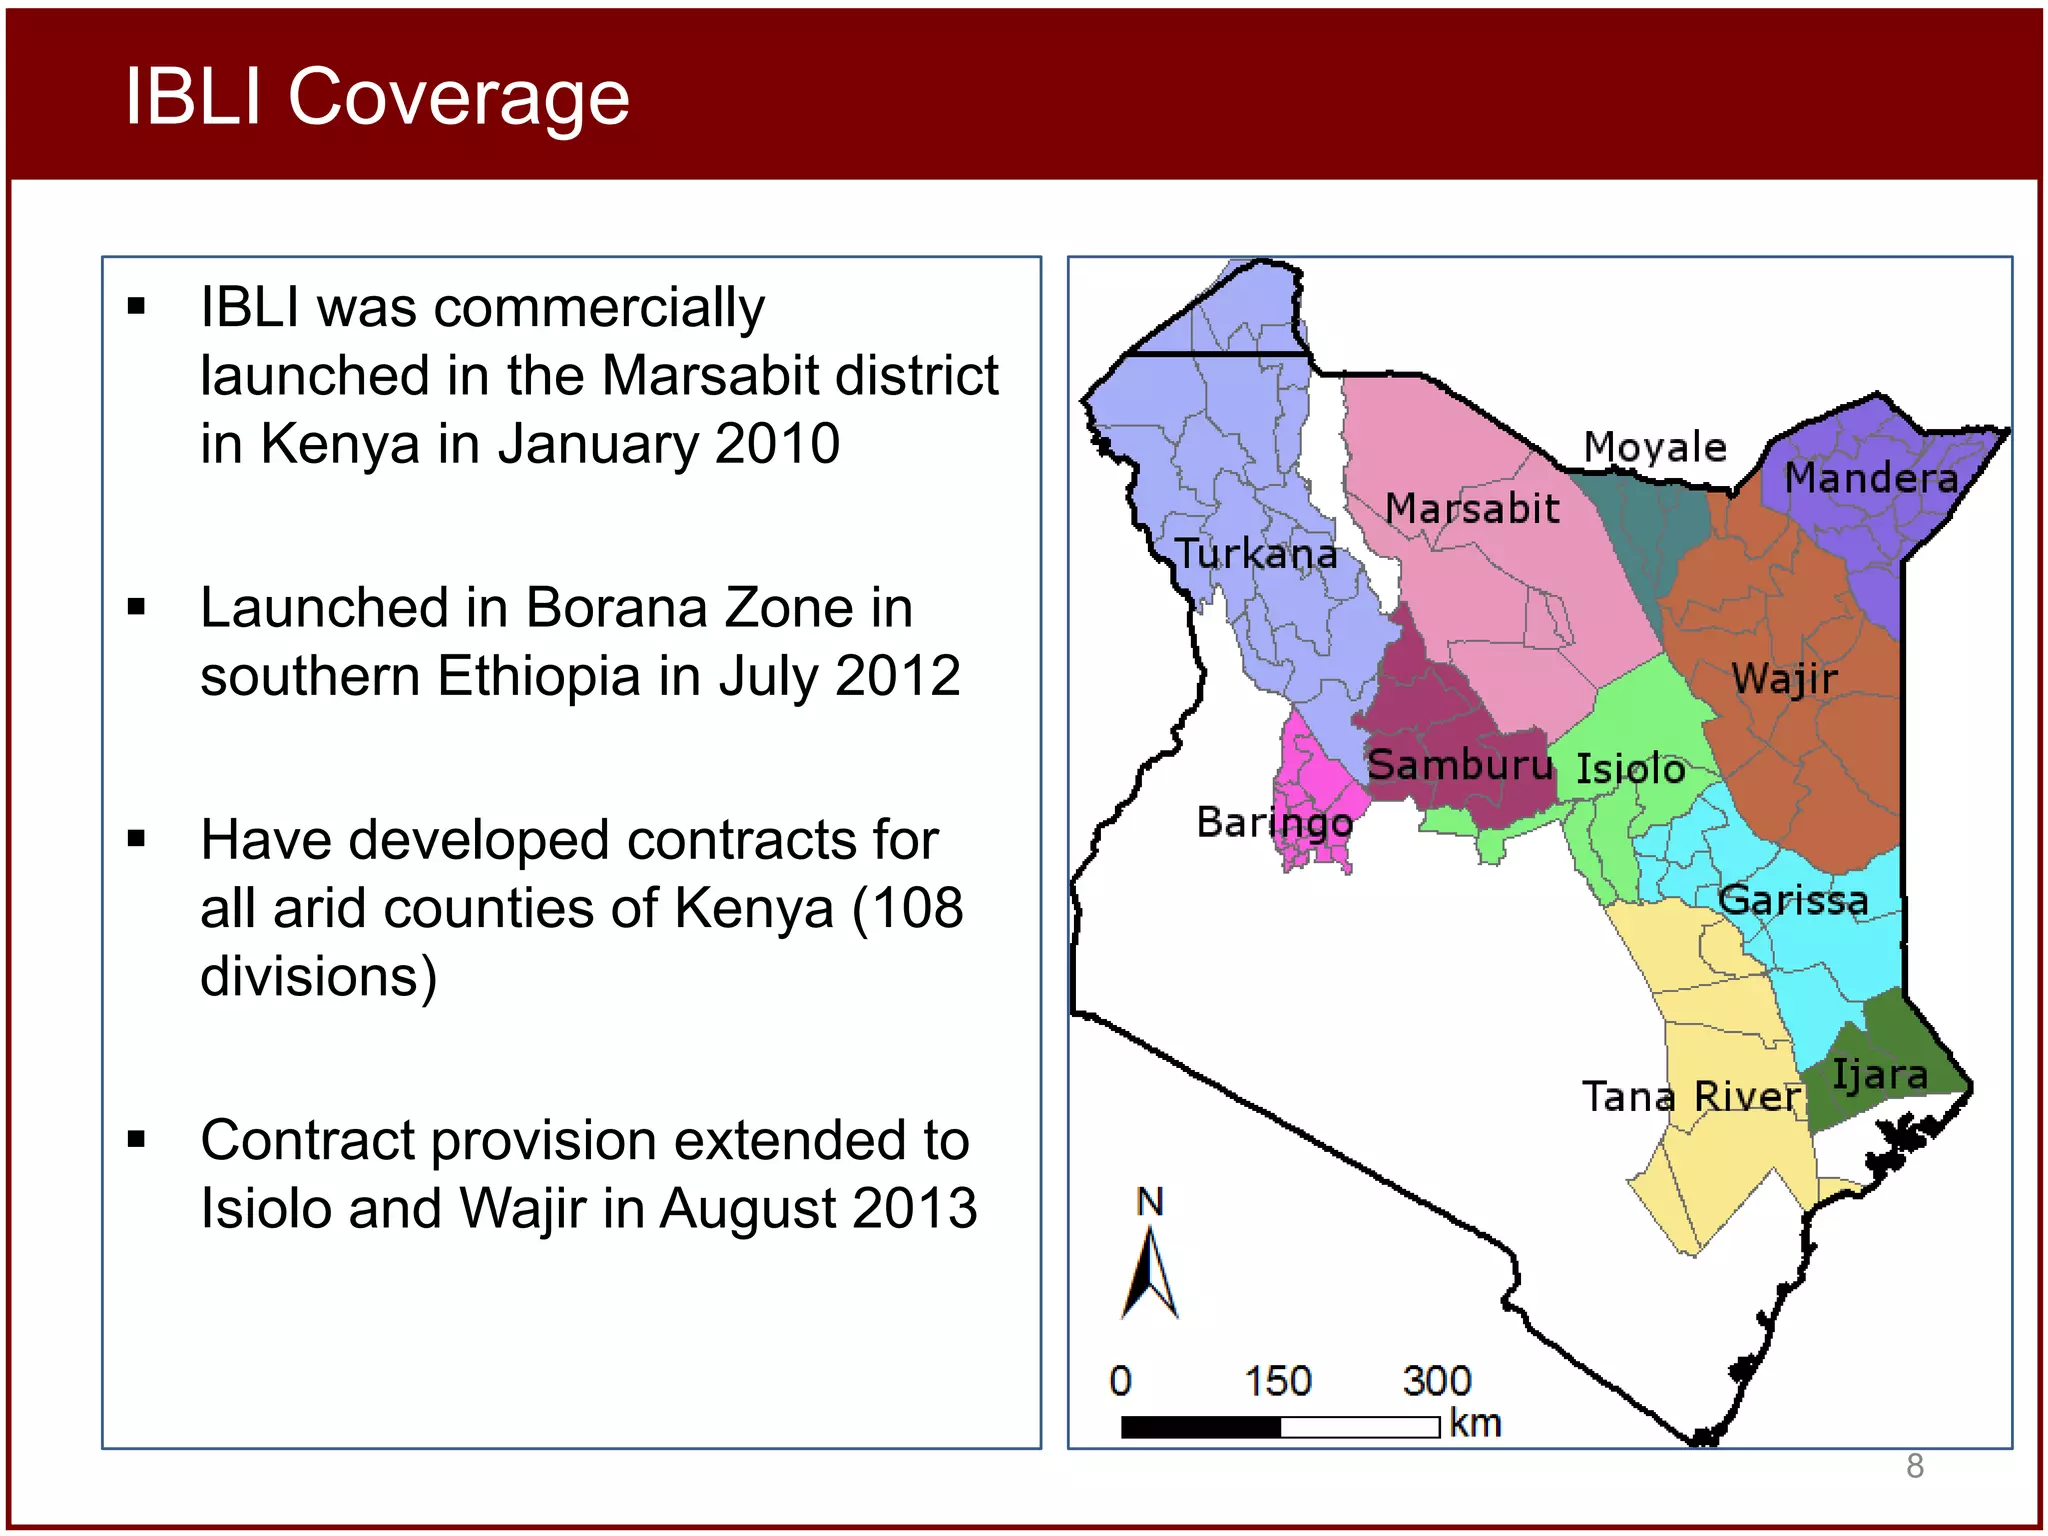
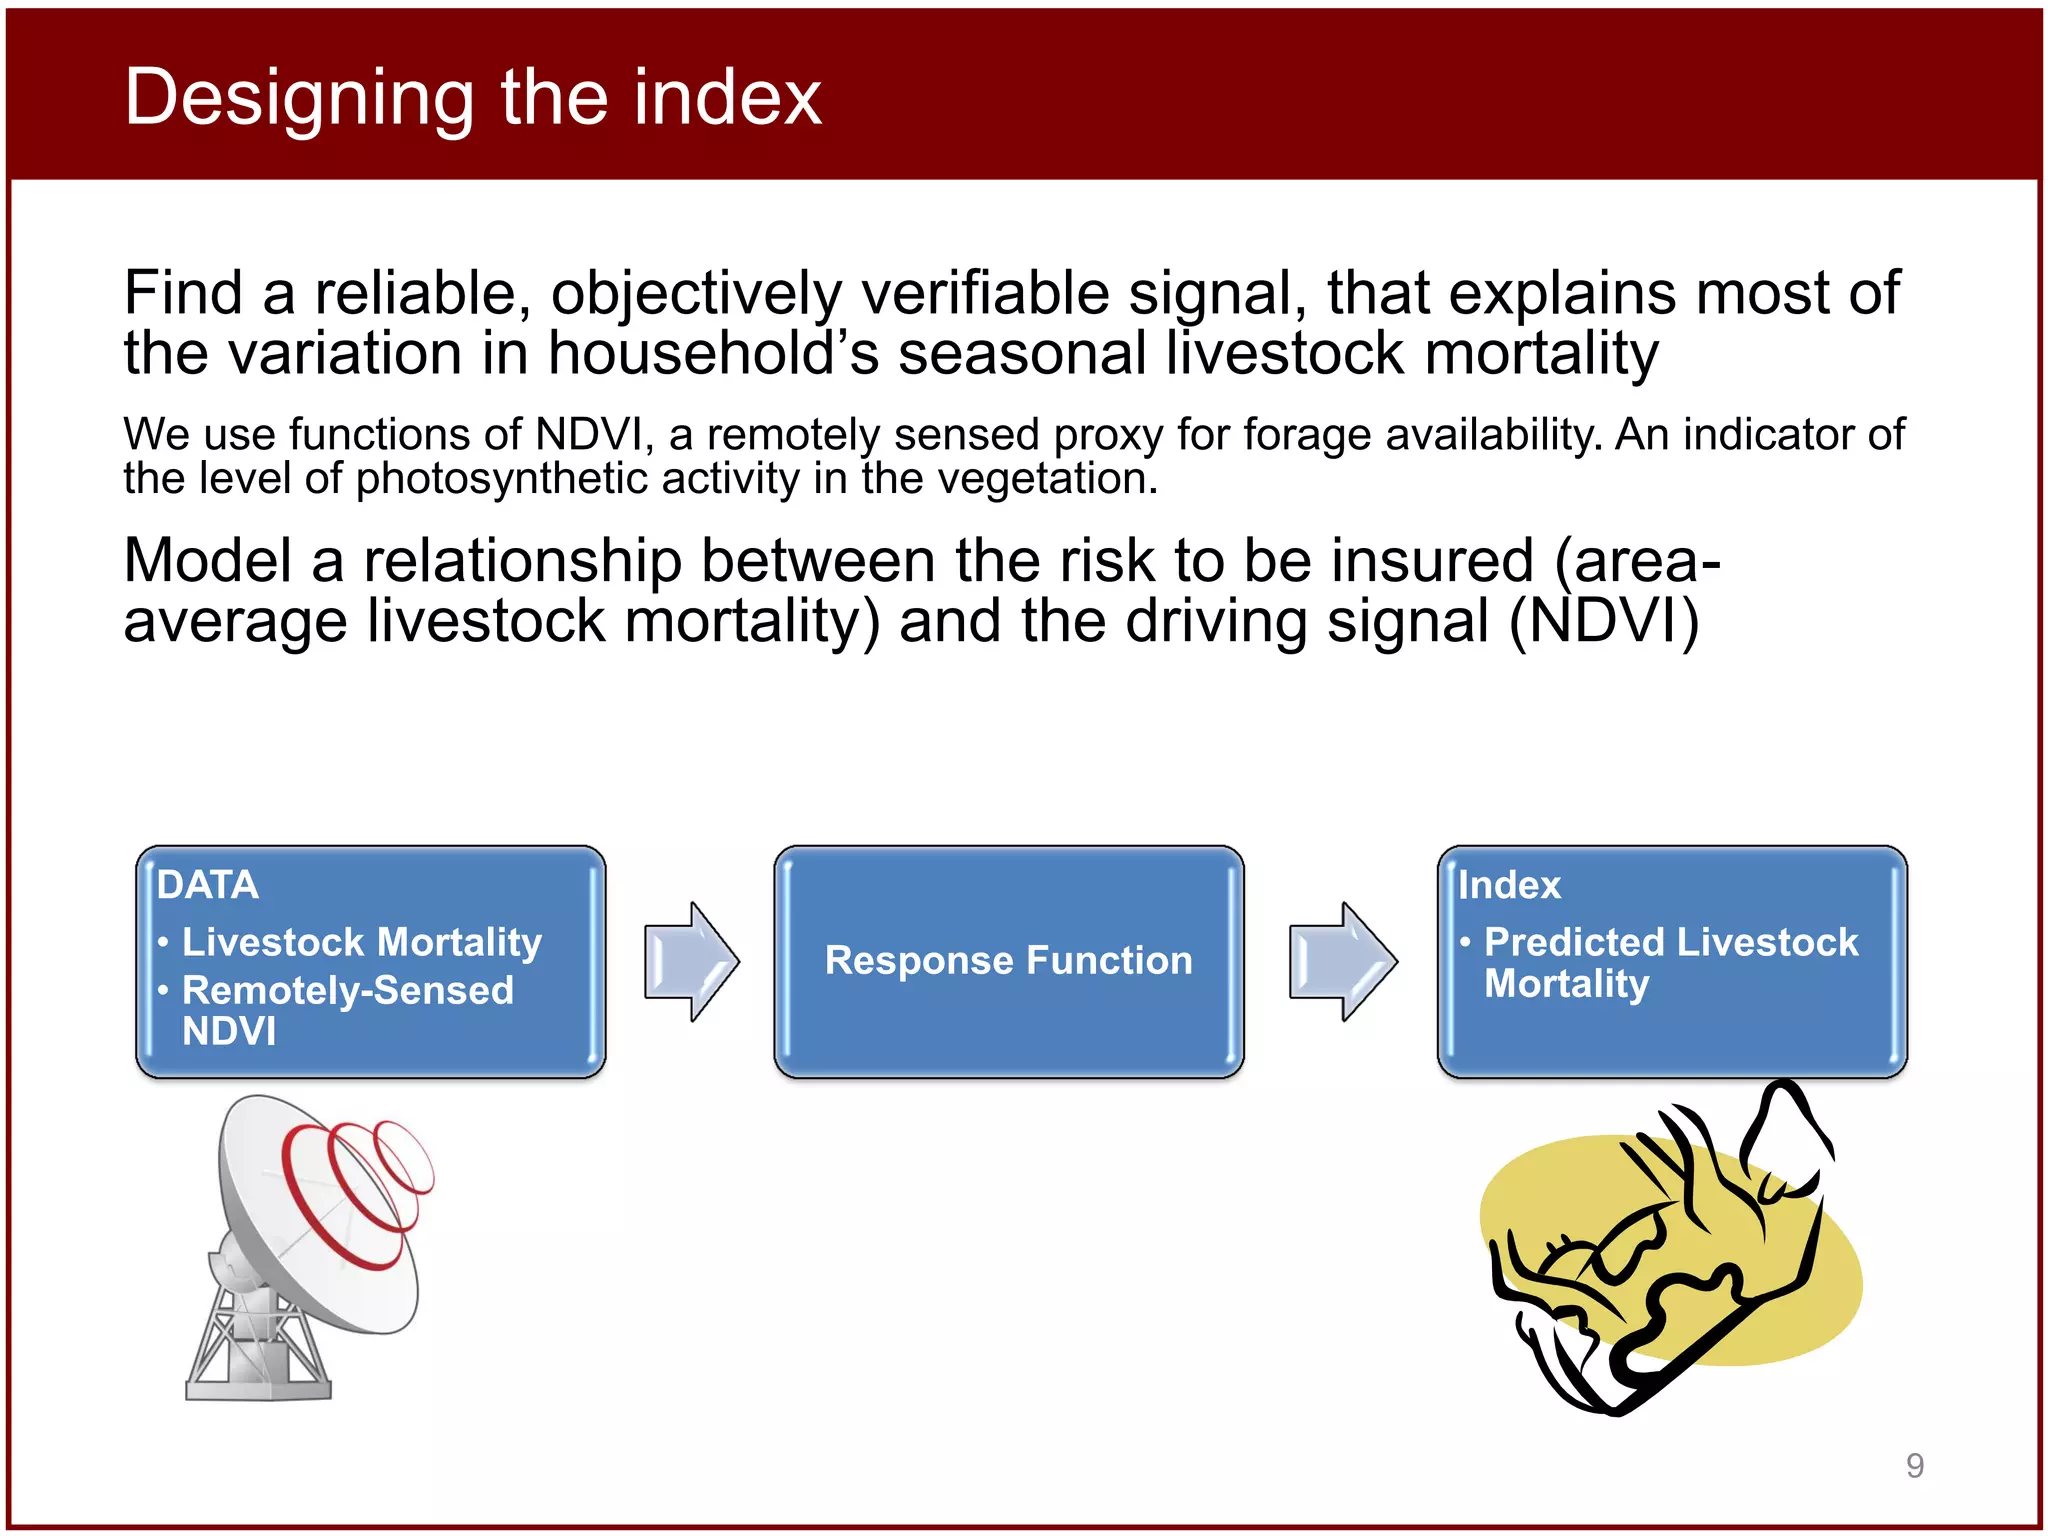
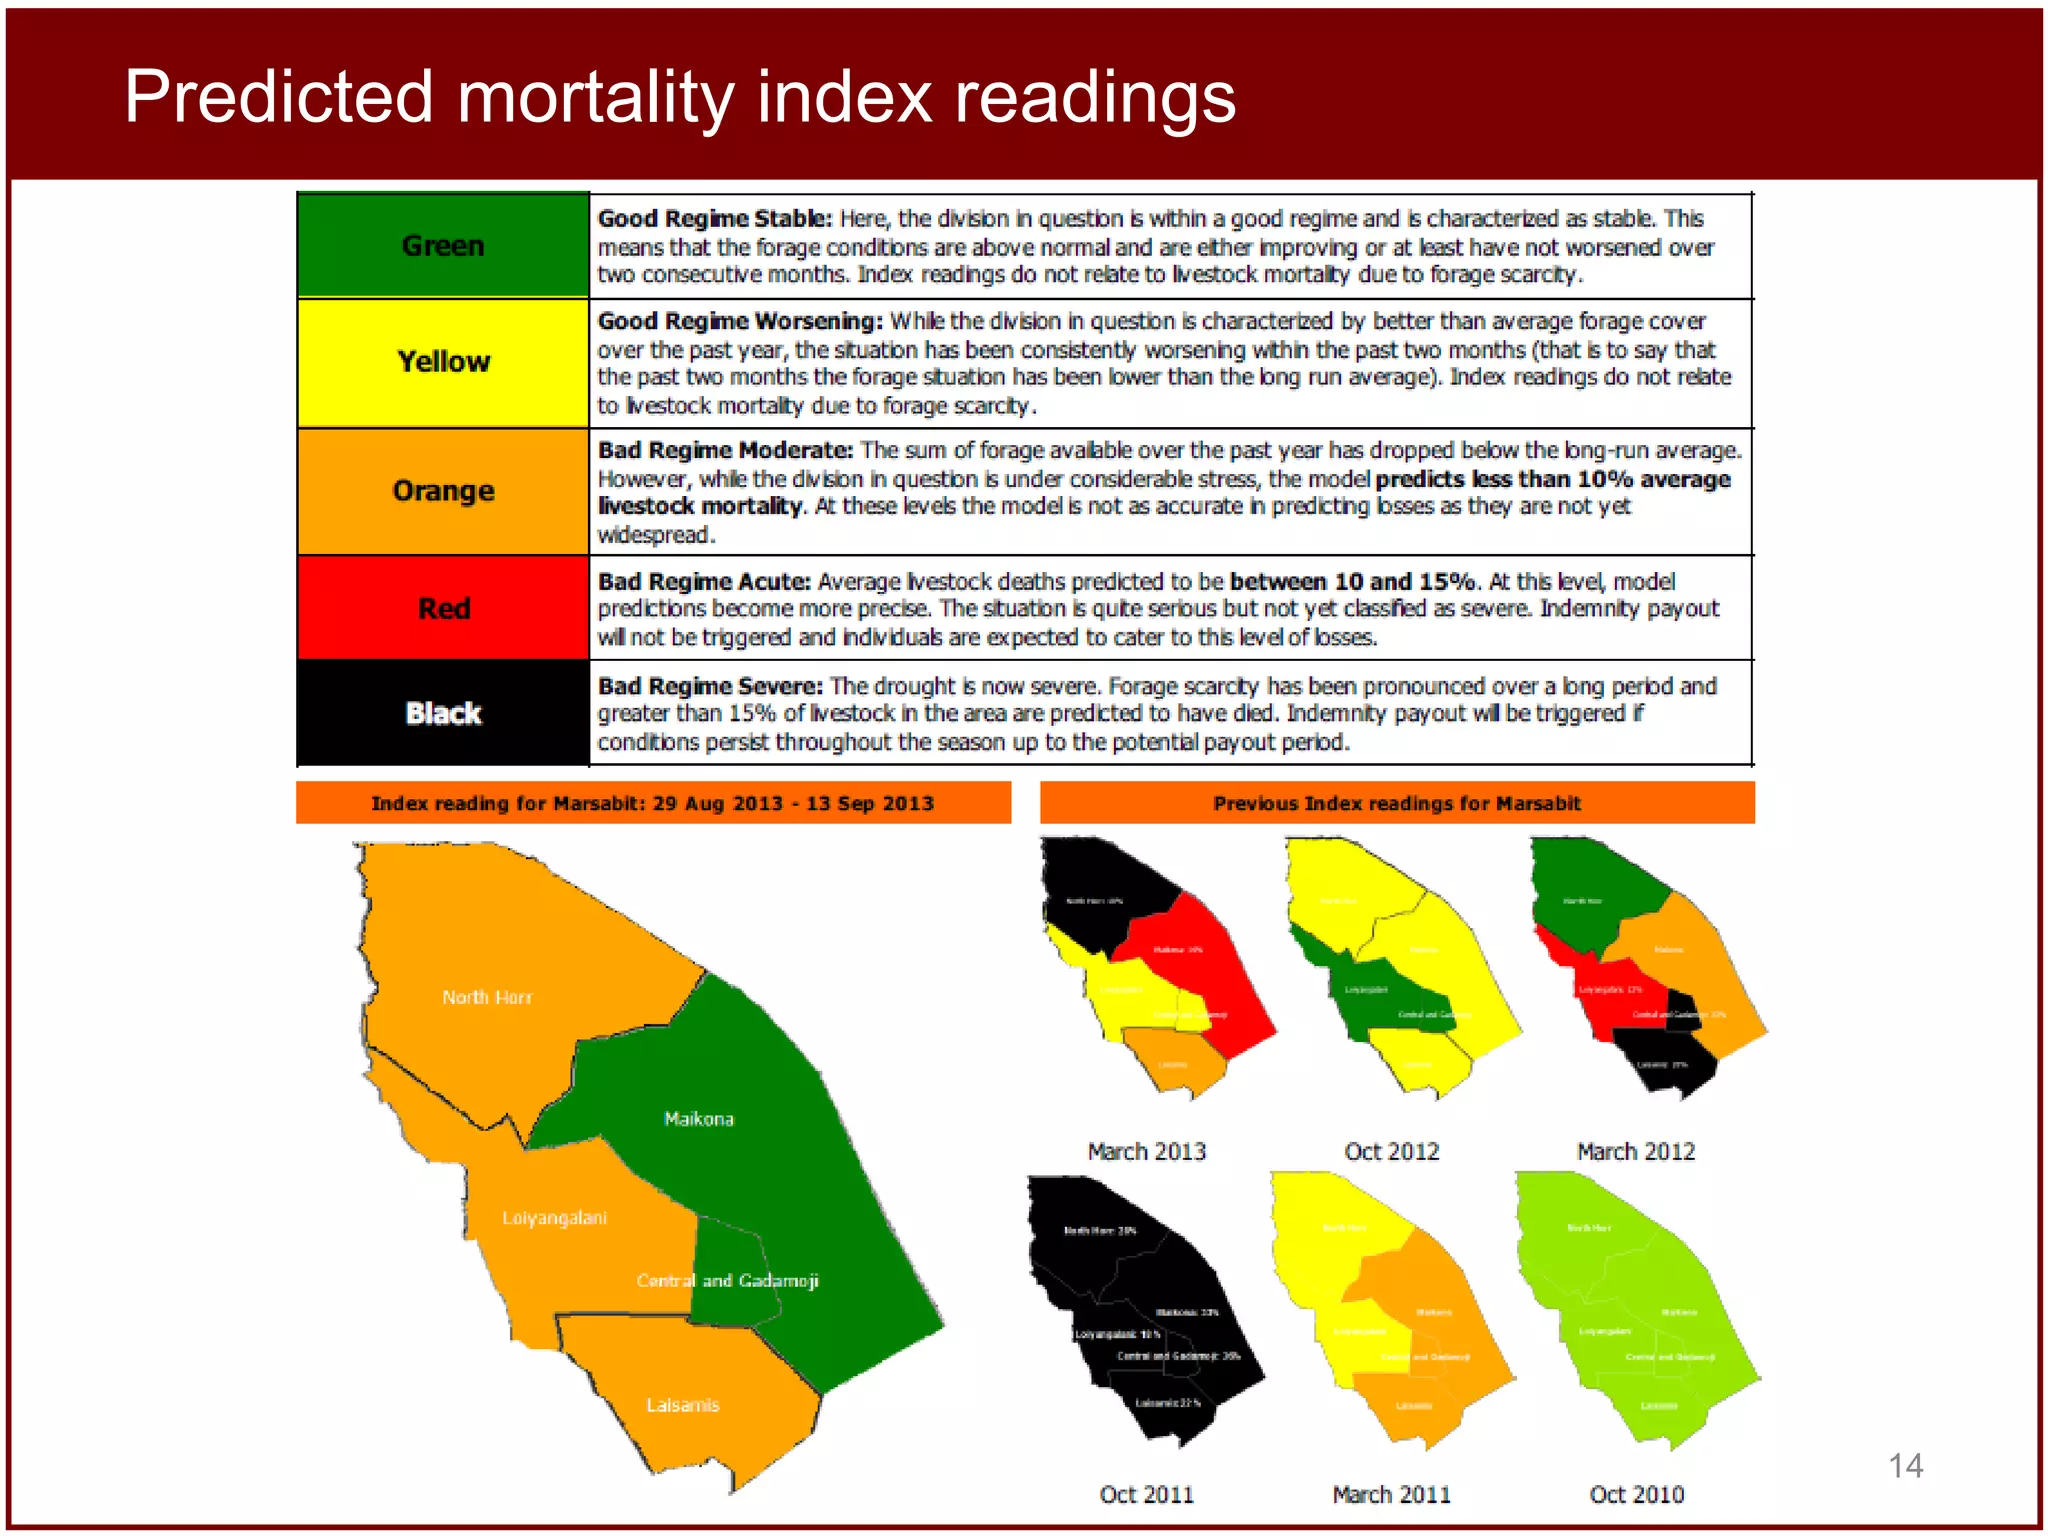
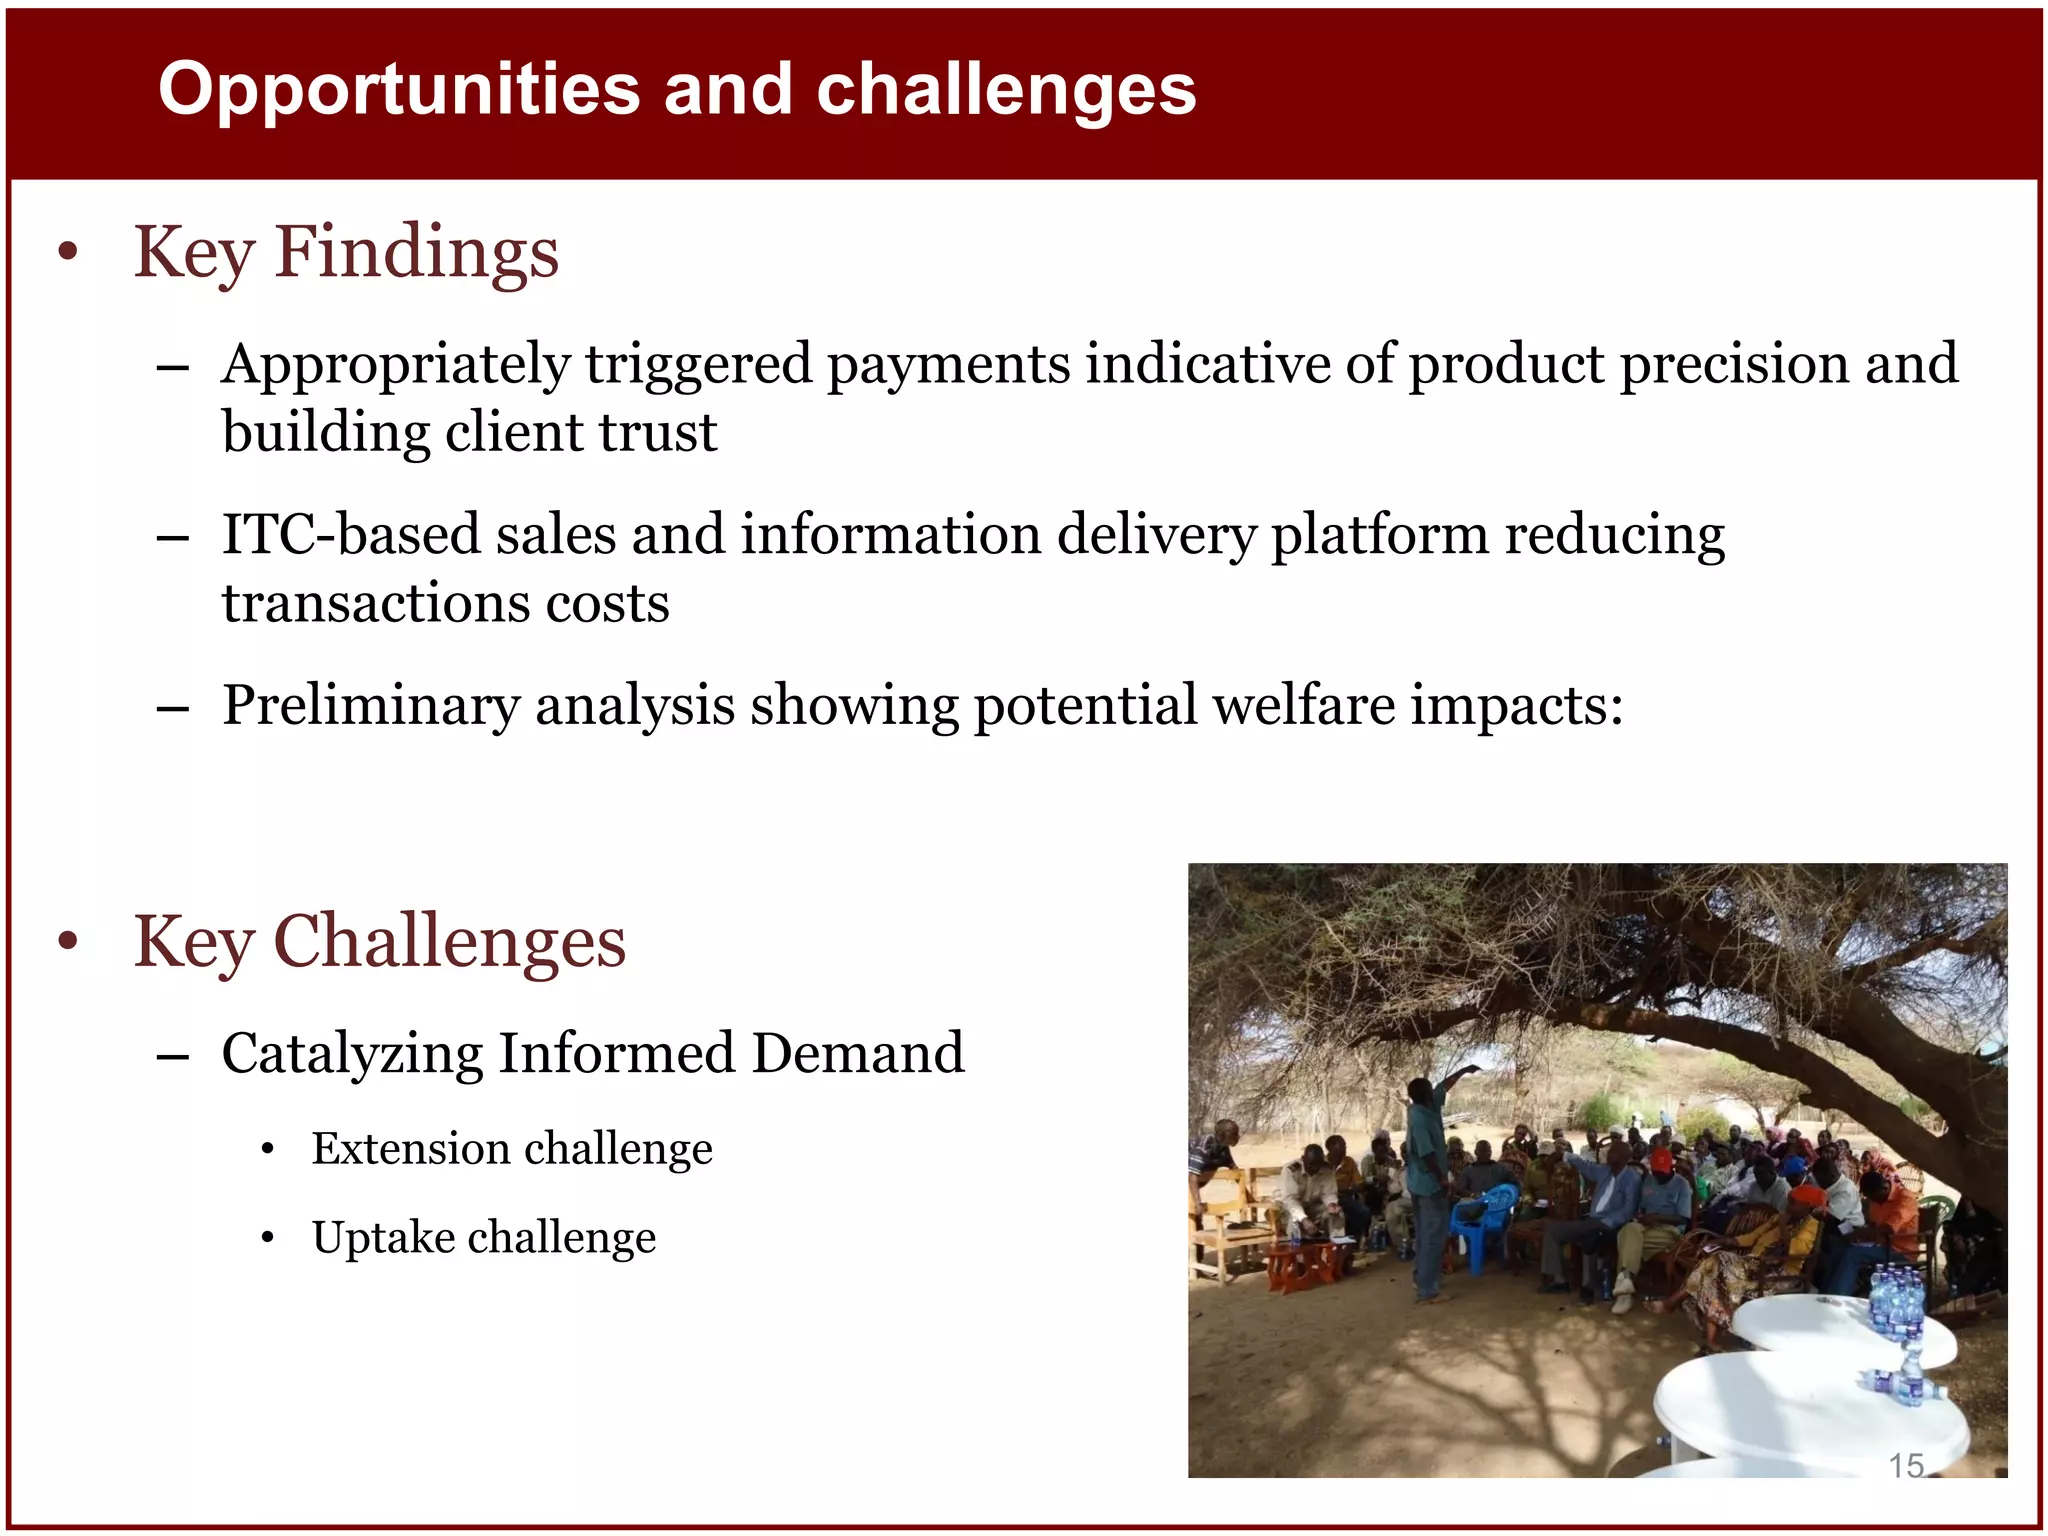
The document discusses livestock insurance in Kenya as a market-based solution for managing climate risks, specifically droughts that severely affect pastoralists' livelihoods. It highlights the impact of droughts on livestock mortality, which contributes to persistent poverty, and introduces index-based insurance (IBLI) that compensates losses based on a risk index rather than individual assessments. The document outlines the benefits and challenges of IBLI, emphasizing its potential for improving food security and reducing poverty traps through innovative financial mechanisms.


