Downloaded 509 times


The document discusses data commentary and provides guidance on its purpose, structure, and key elements. It explains that a data commentary presents results, interprets results, and discusses the significance and implications of results. It also provides tips on highlighting data, writing paragraphs, linking clauses, and qualifying claims.
Introduction to the topic of data commentary in academic writing by Betül GÜLERYÜZ and Osman AYDOĞAR.
Data commentaries present and interpret research results, significant in academic reports.
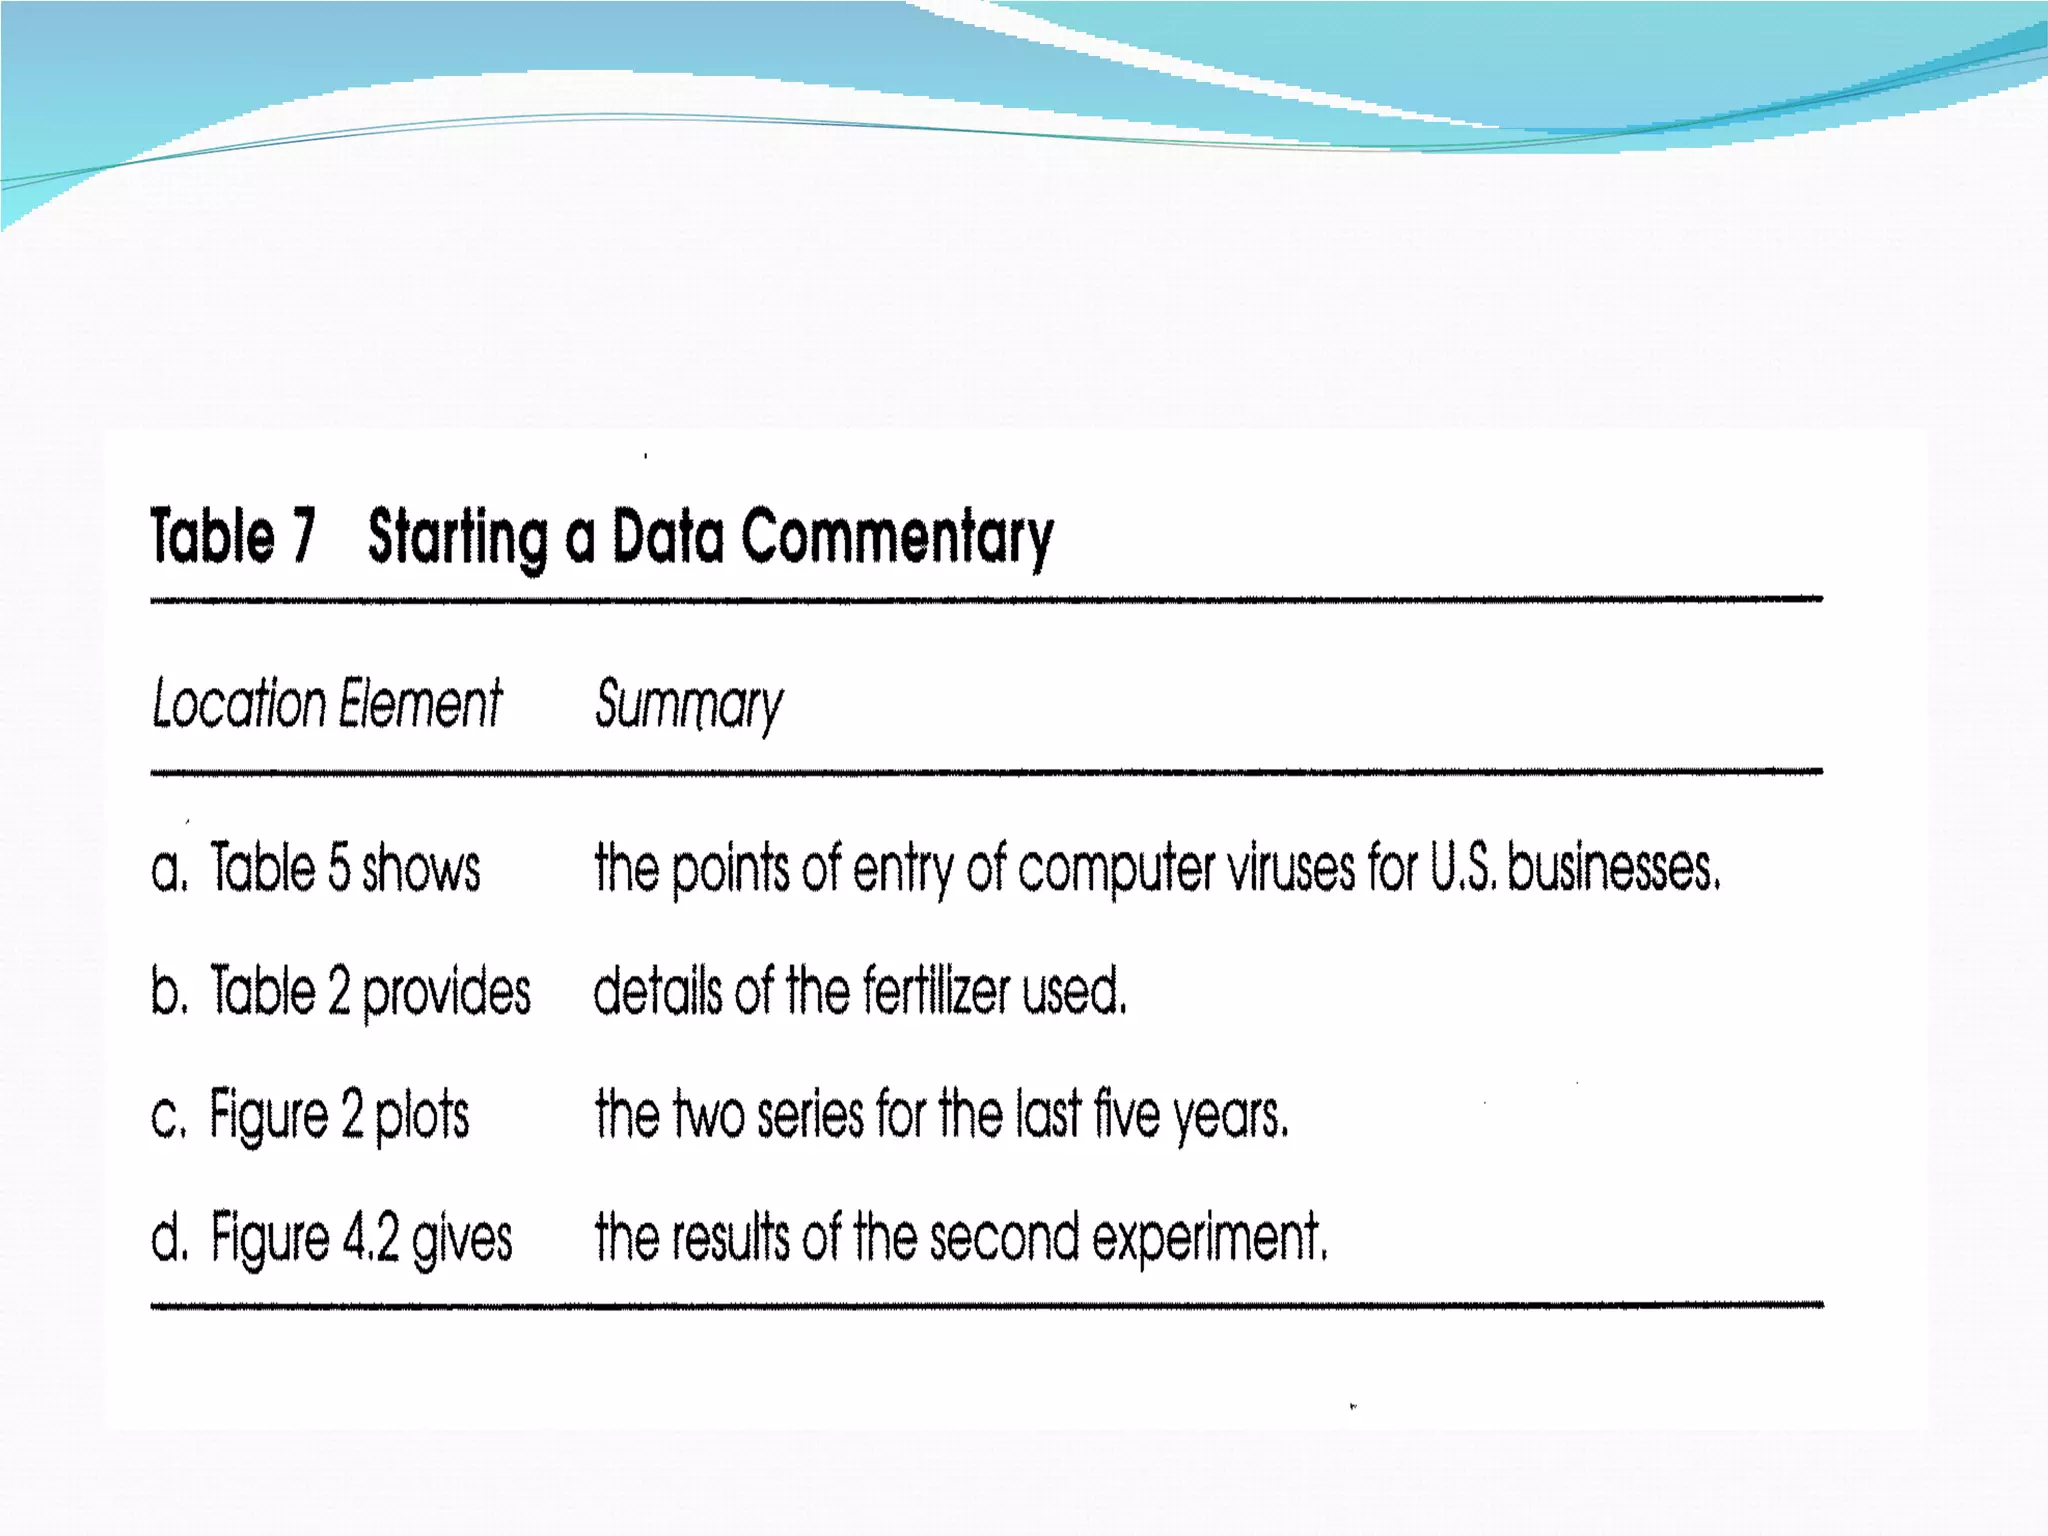
Data is best shown via visuals; commentary accompanies such displays to explain results.
Data must be logically analyzed and evaluated, going beyond mere description.
Data commentary highlights results, compares datasets, and assesses data reliability.
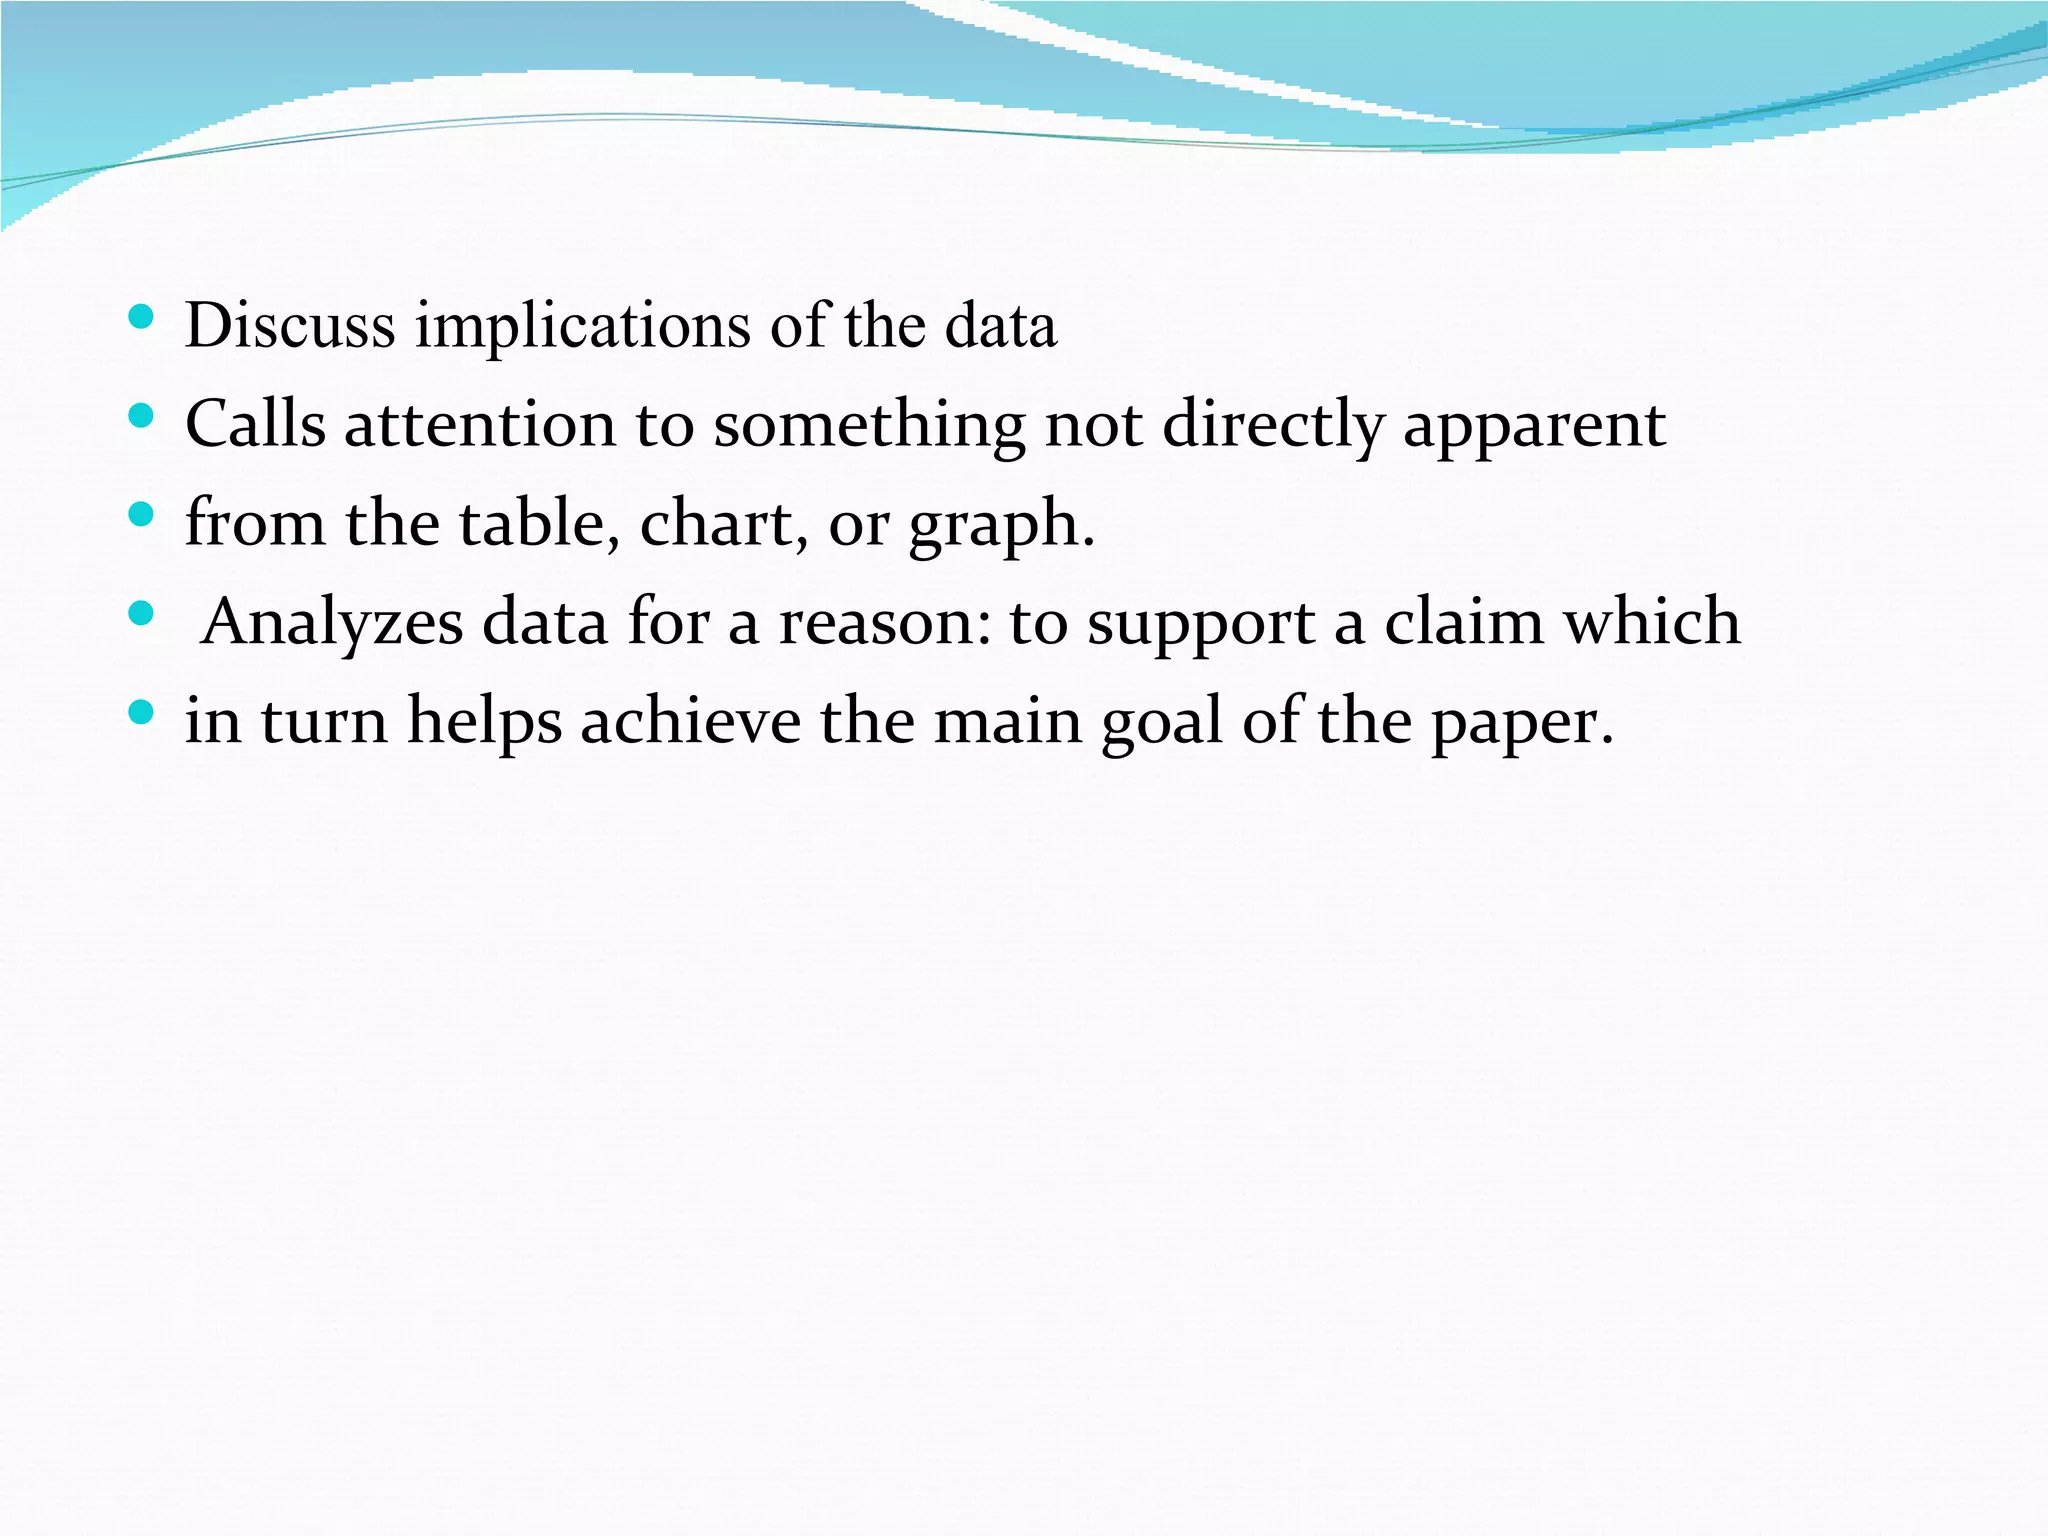
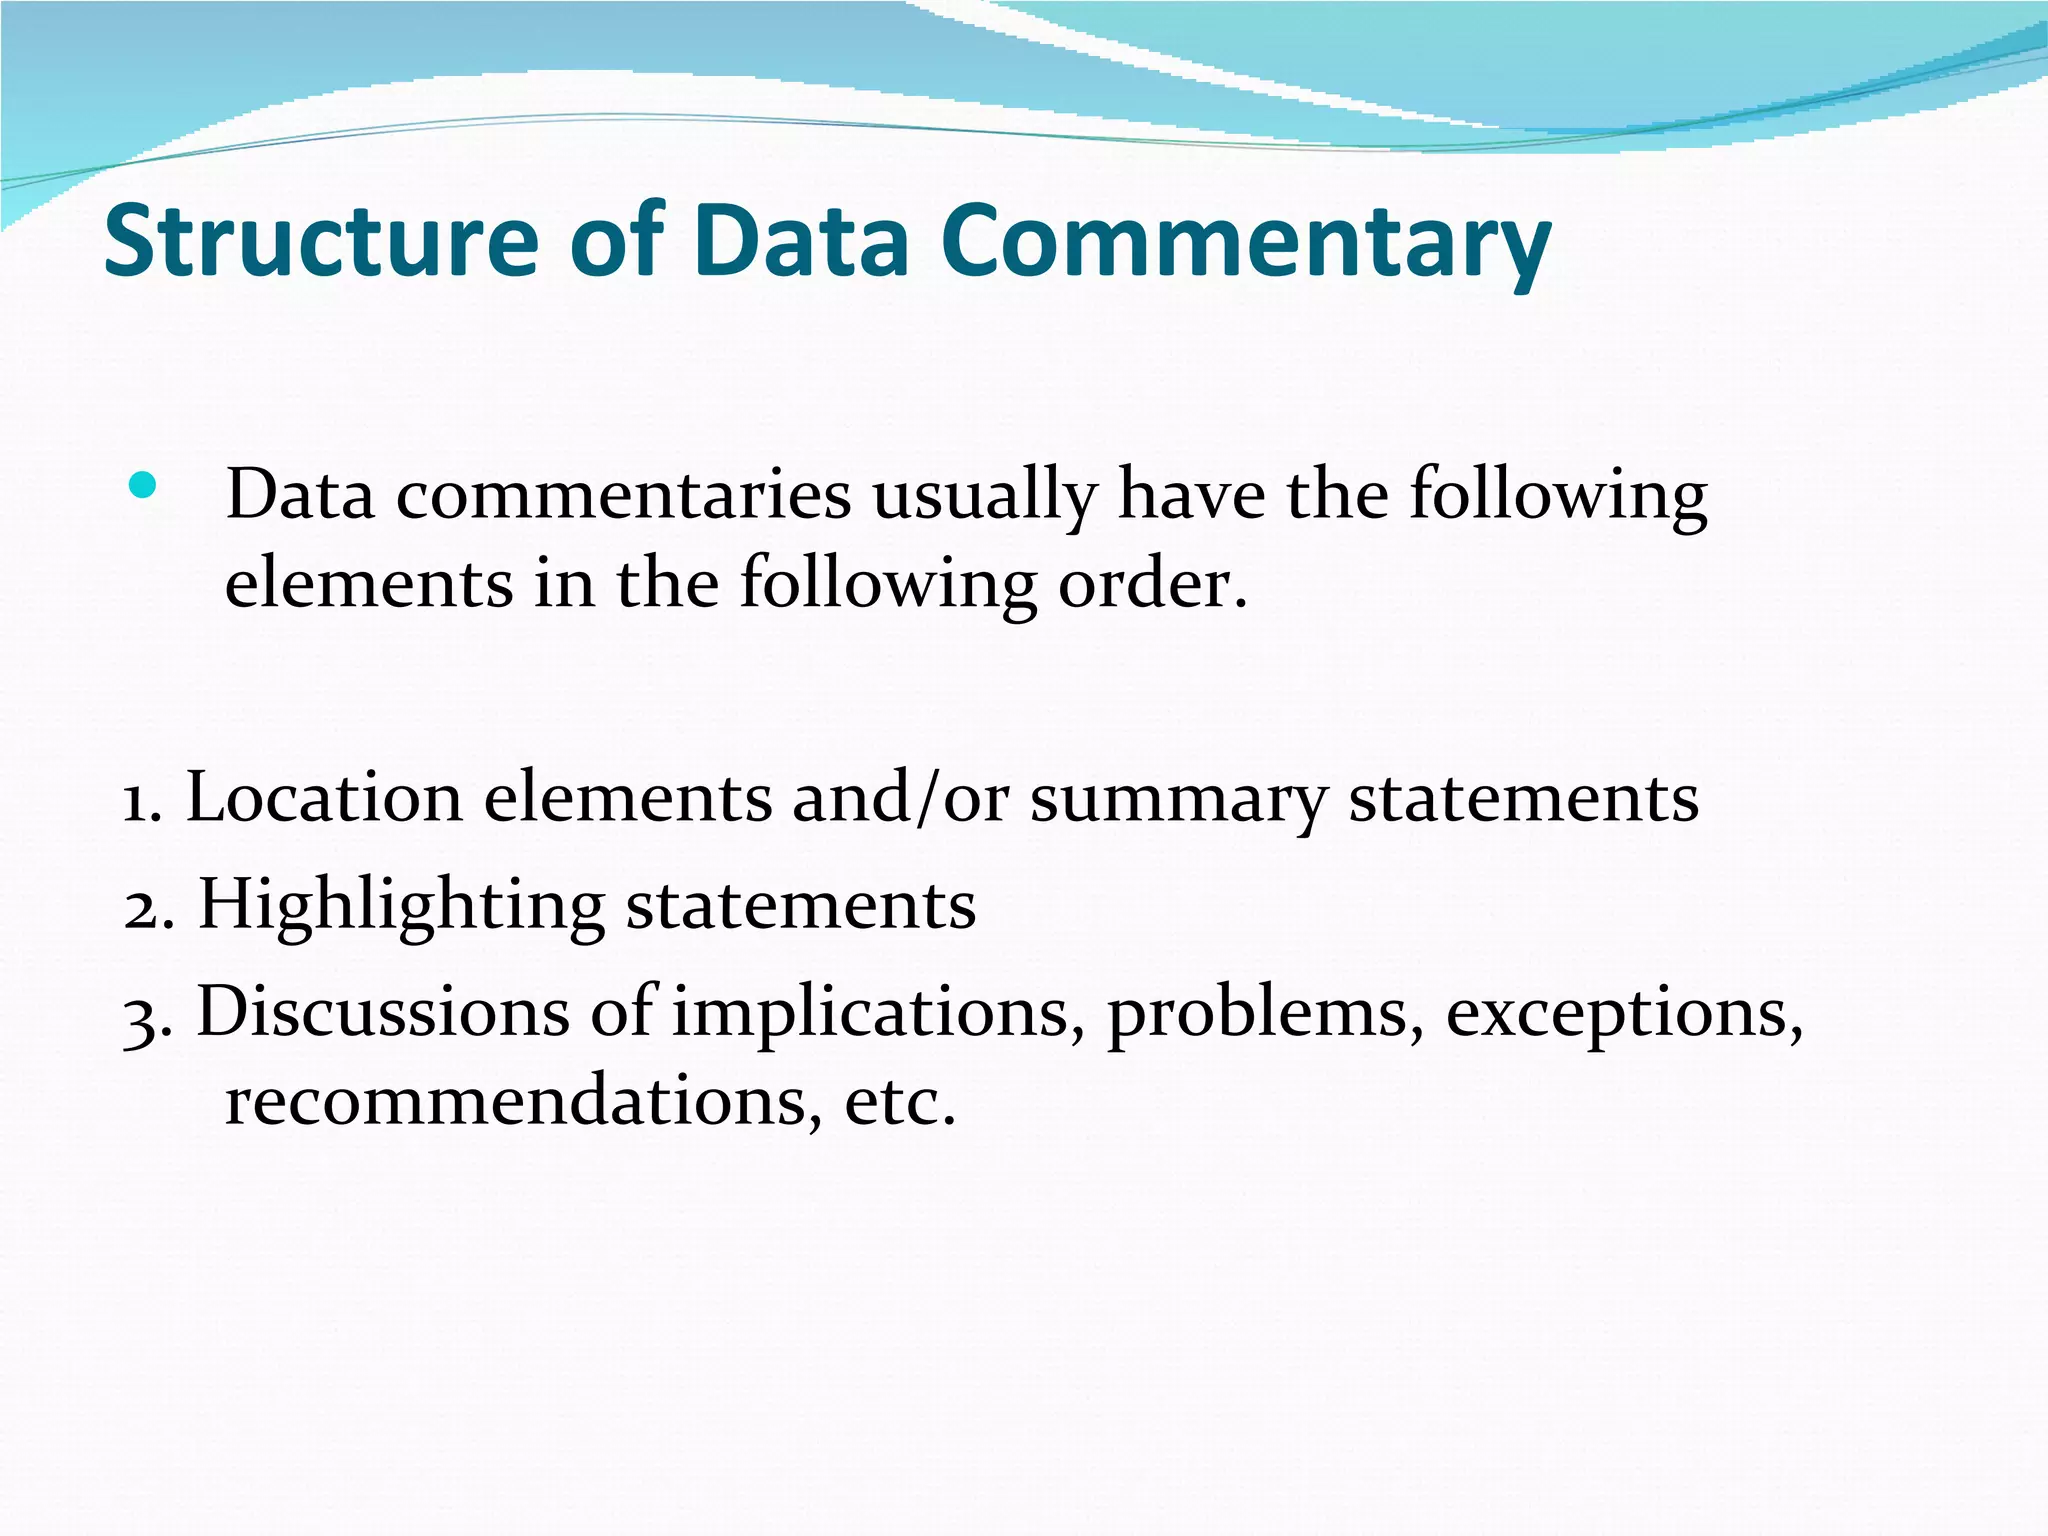
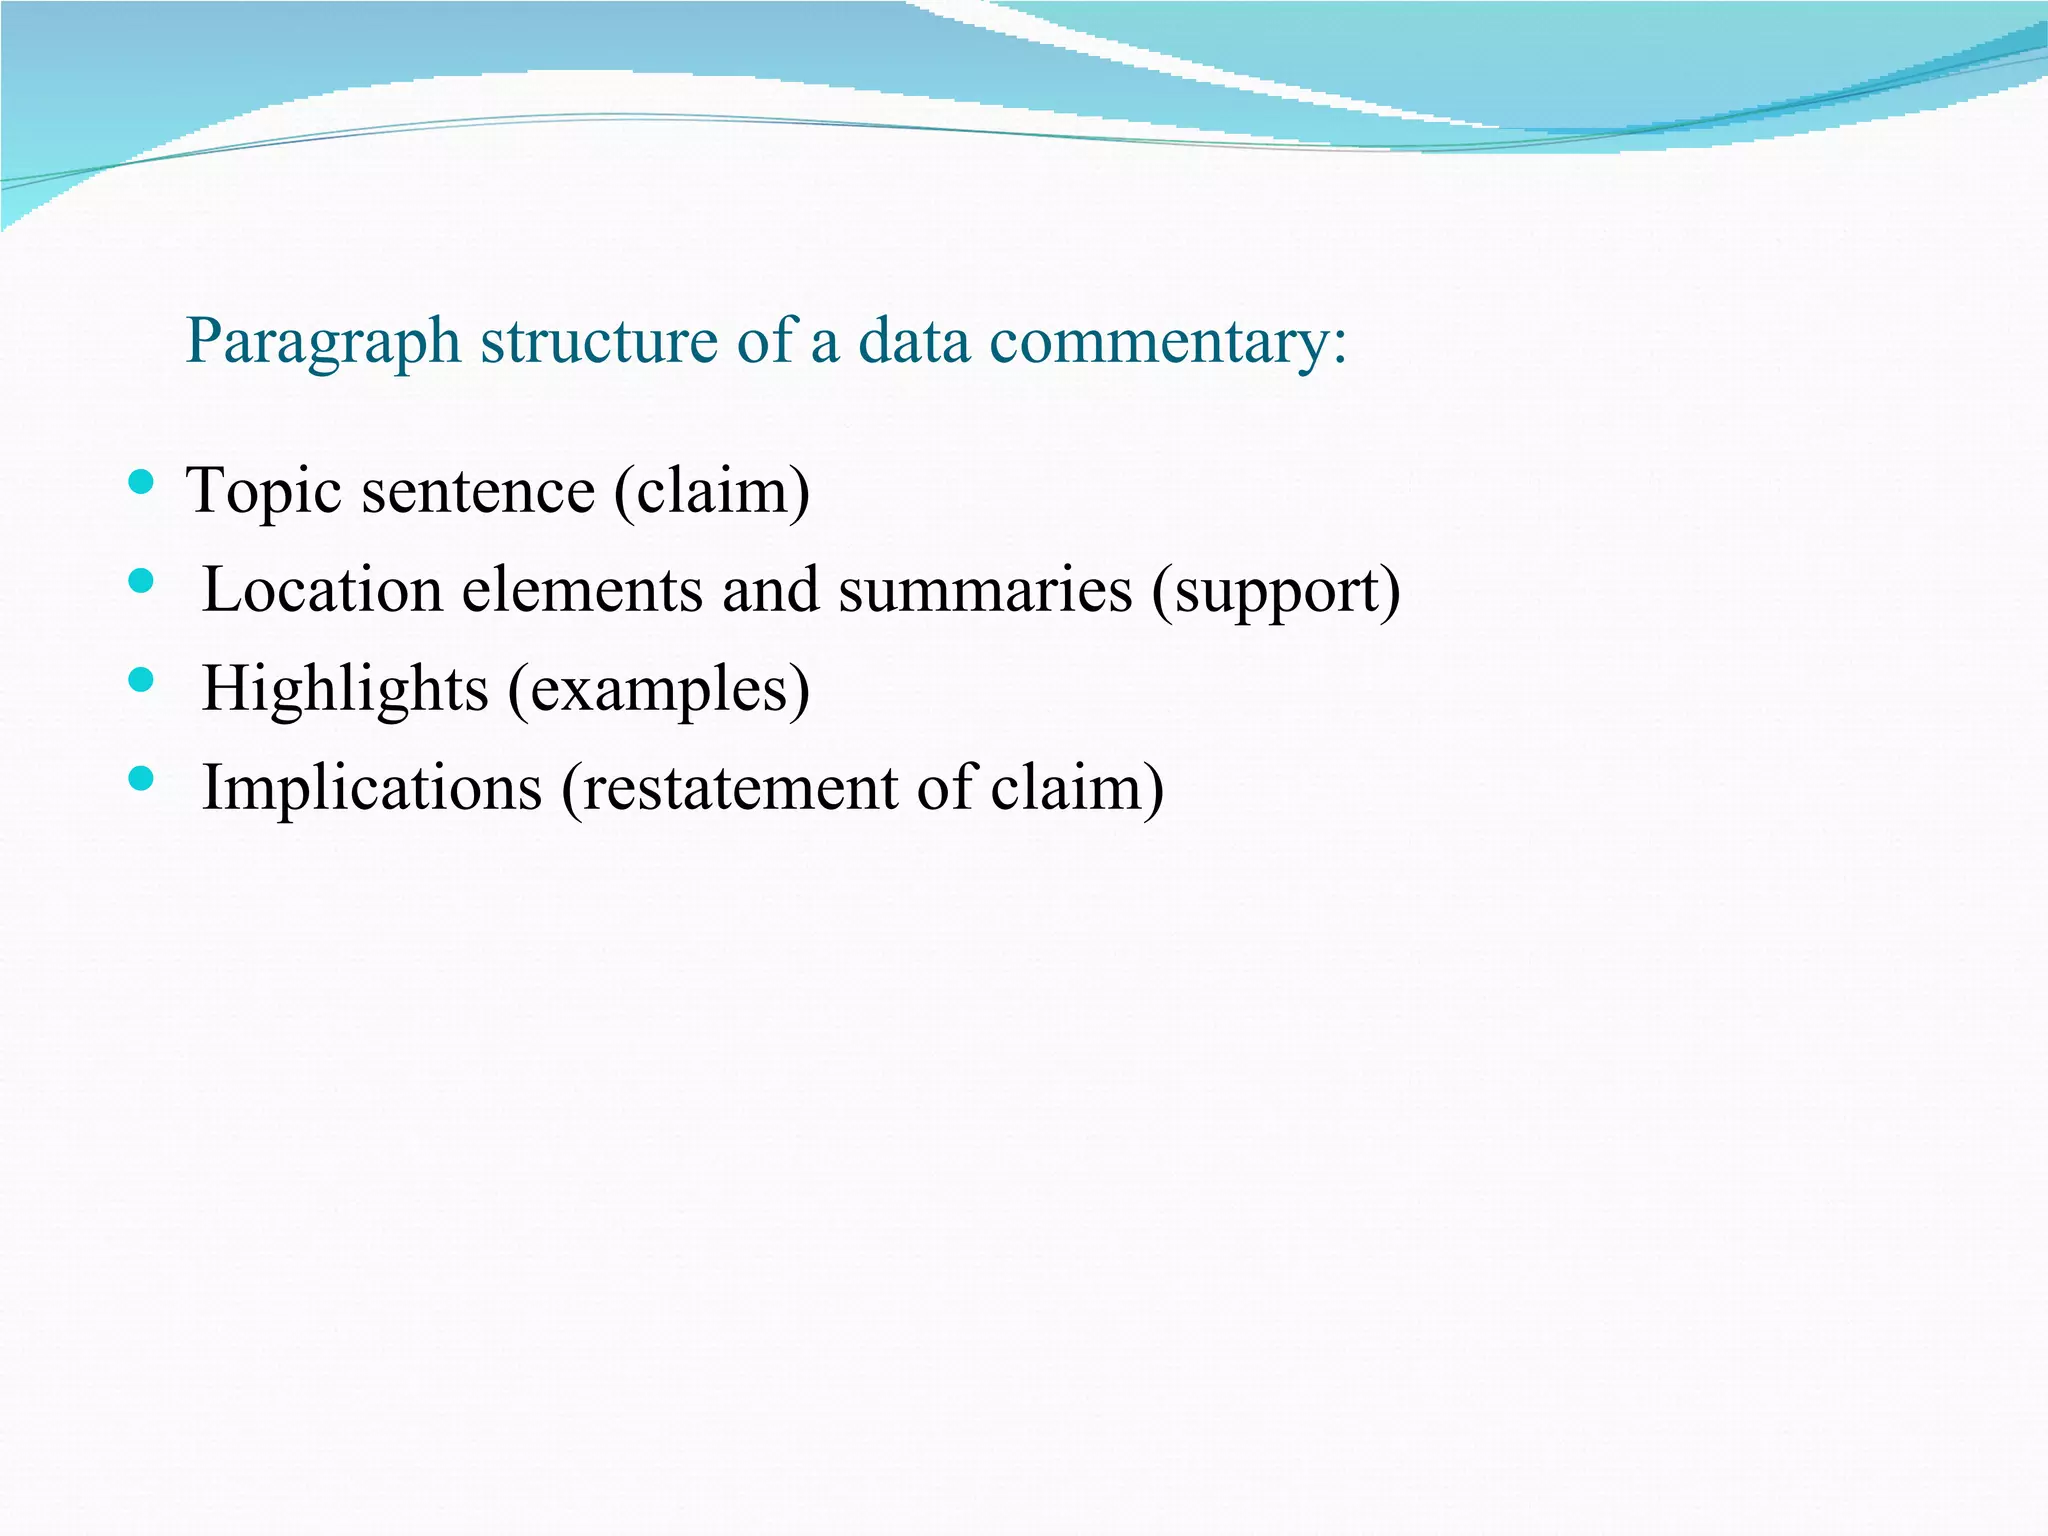
Data commentary structure includes summary elements, highlighting statements, and discussions.
Highlighting statements should draw significant conclusions from data, showing analytical skills.
Avoid repetition of details and overclaiming in data commentary writing.
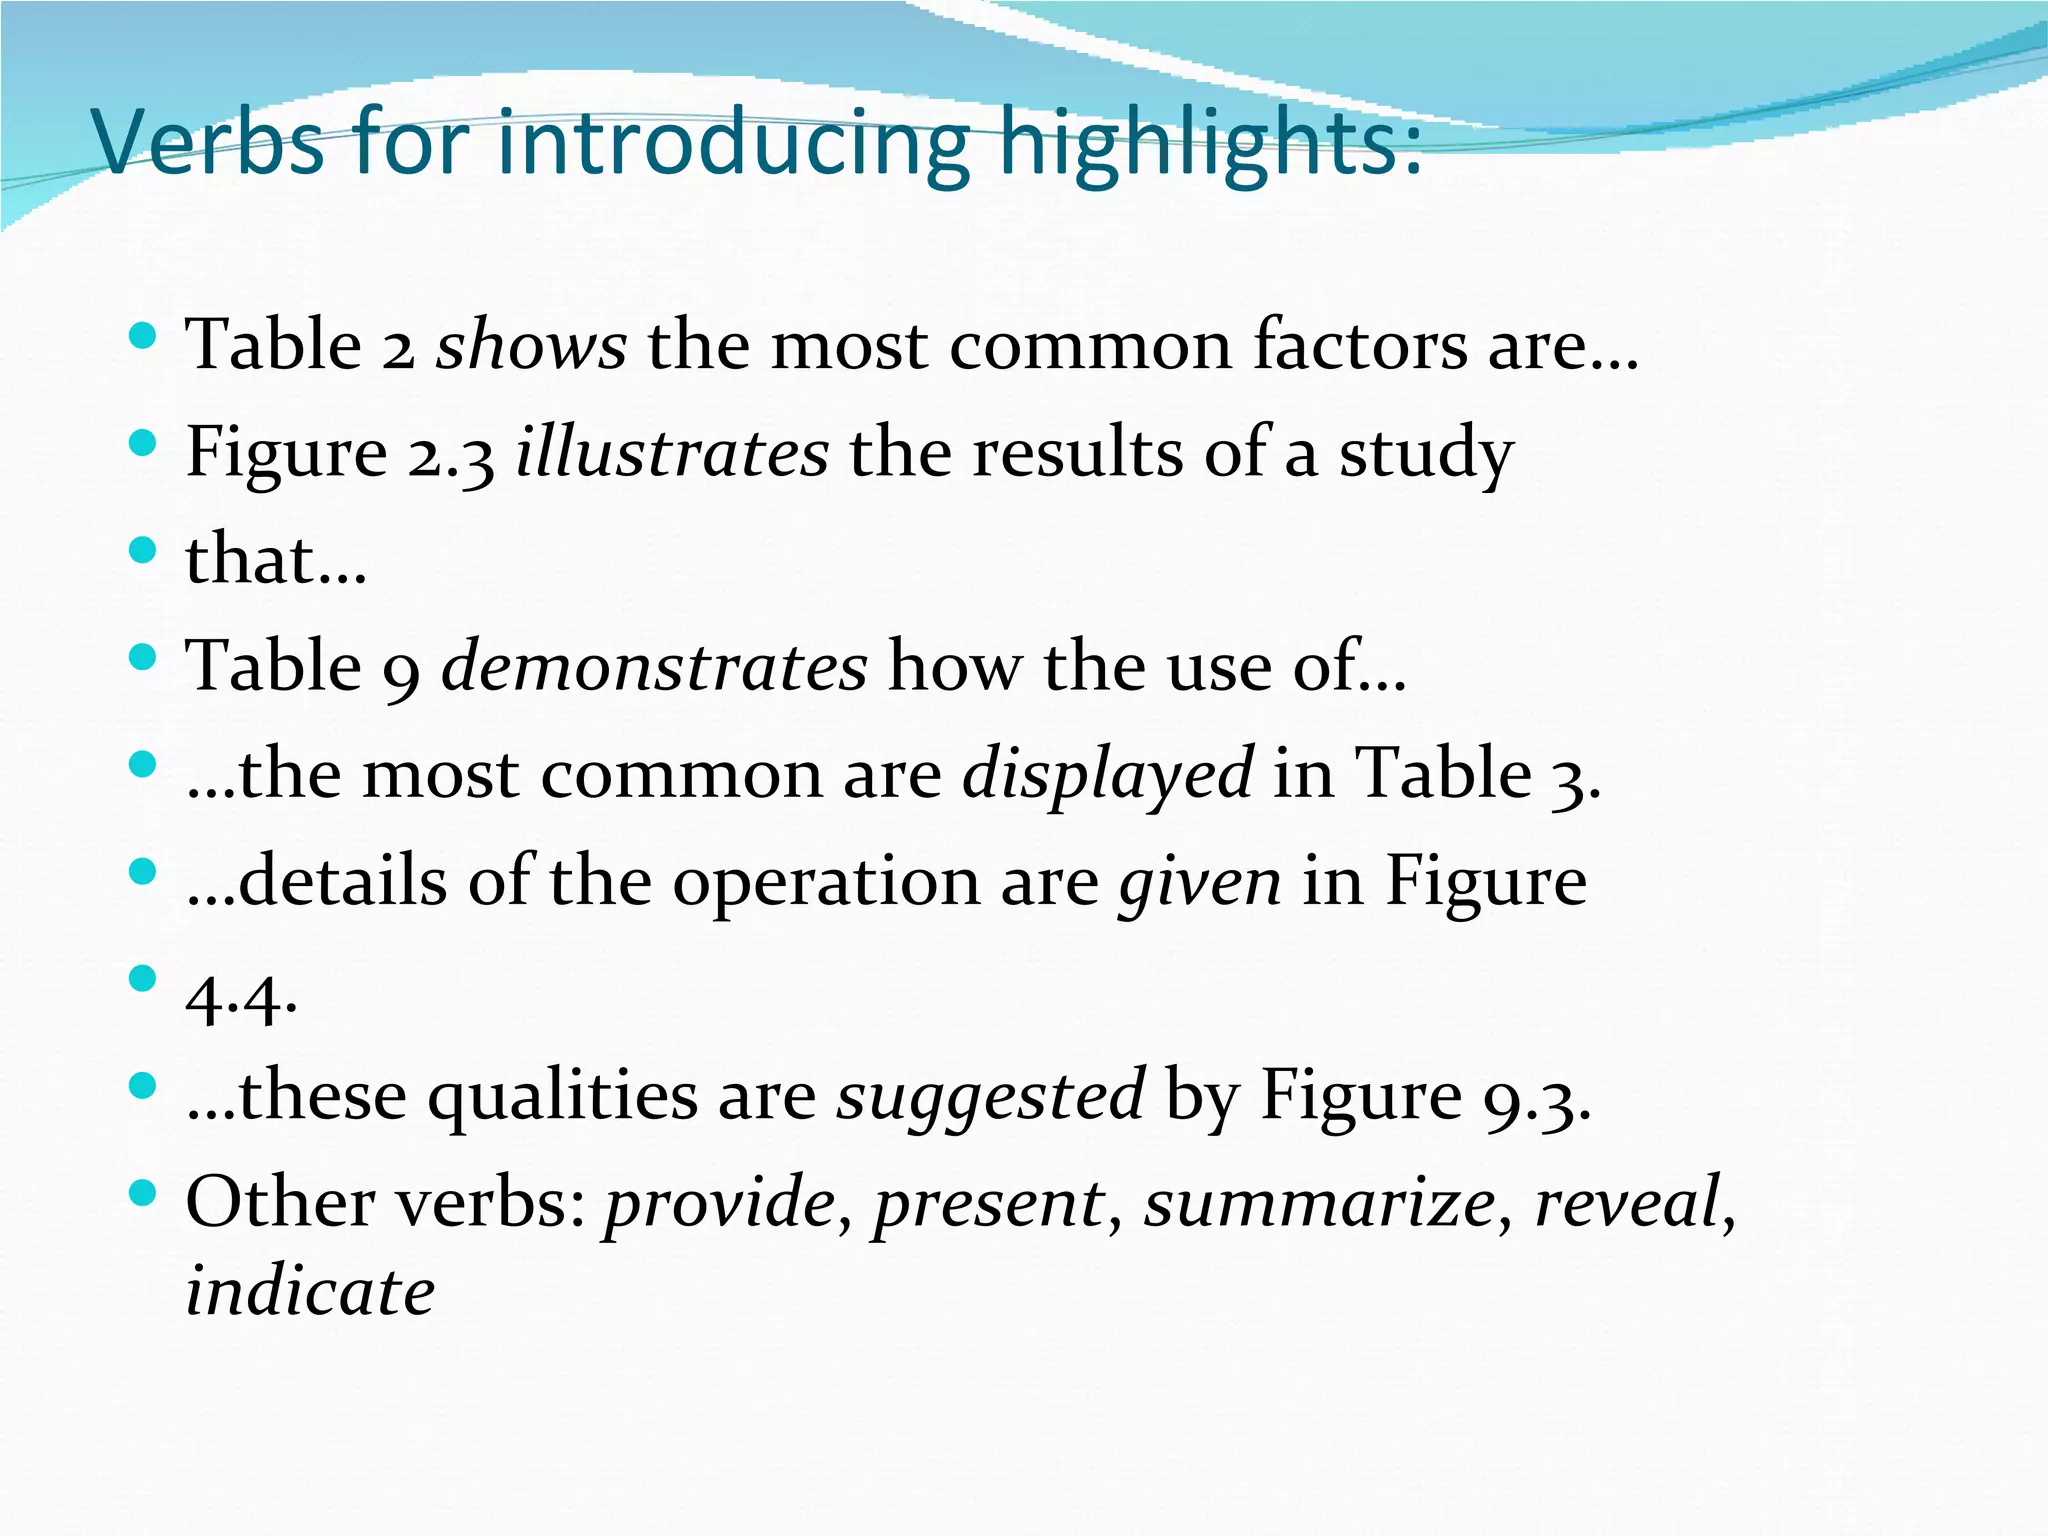
Various verbs for introducing highlight statements in data commentary.
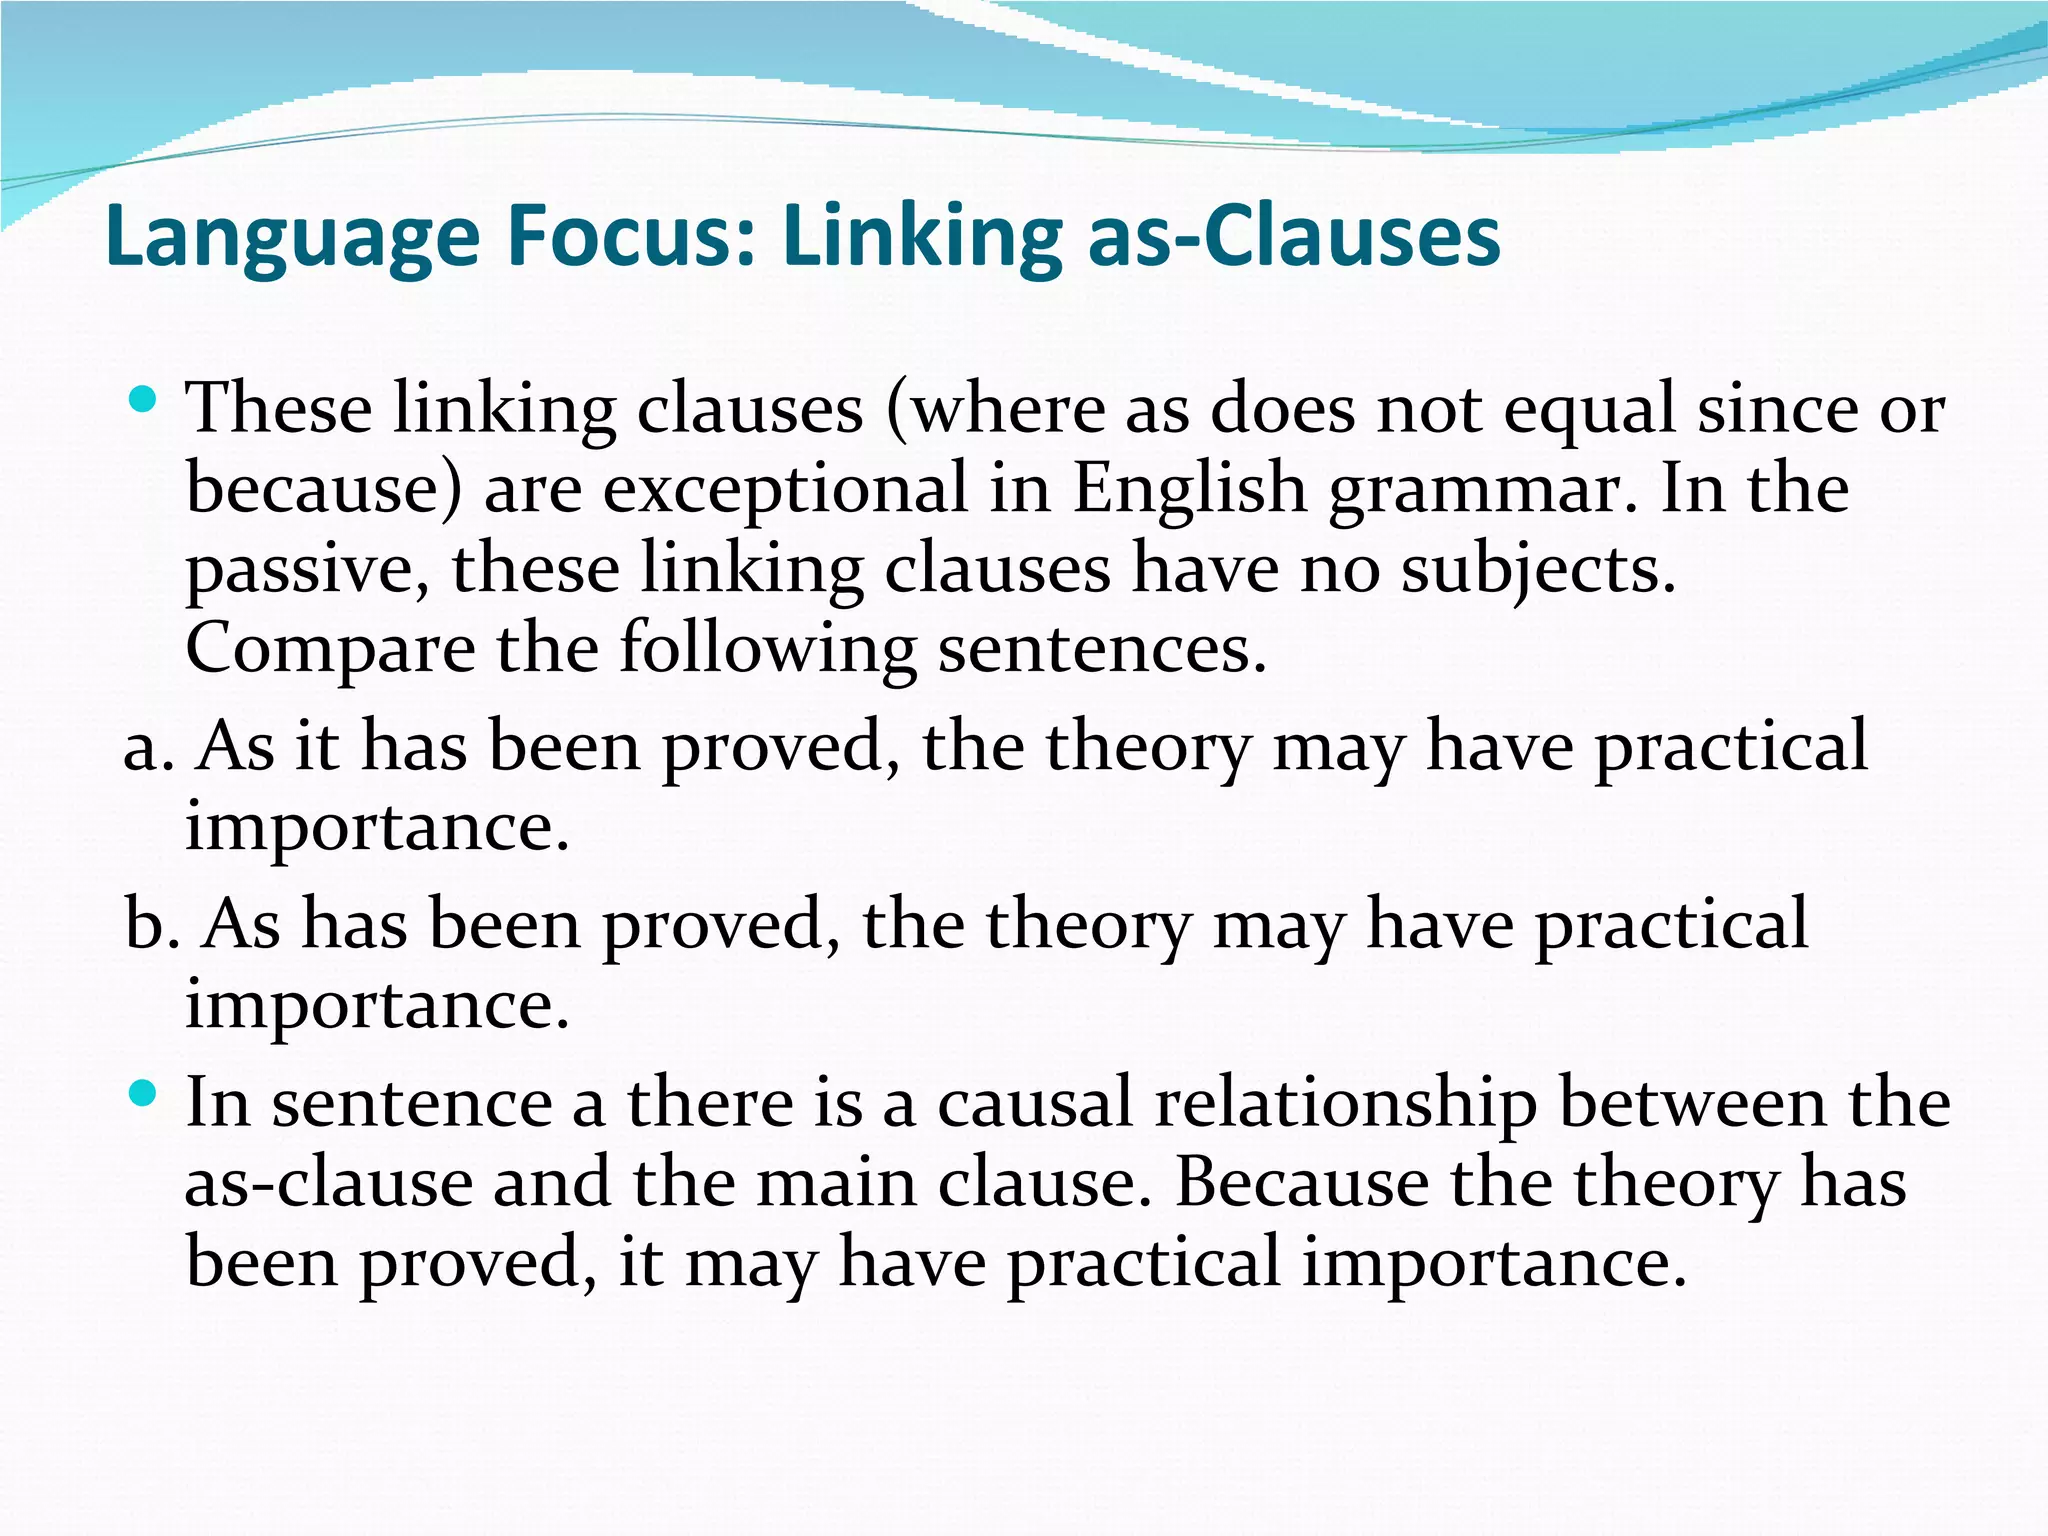
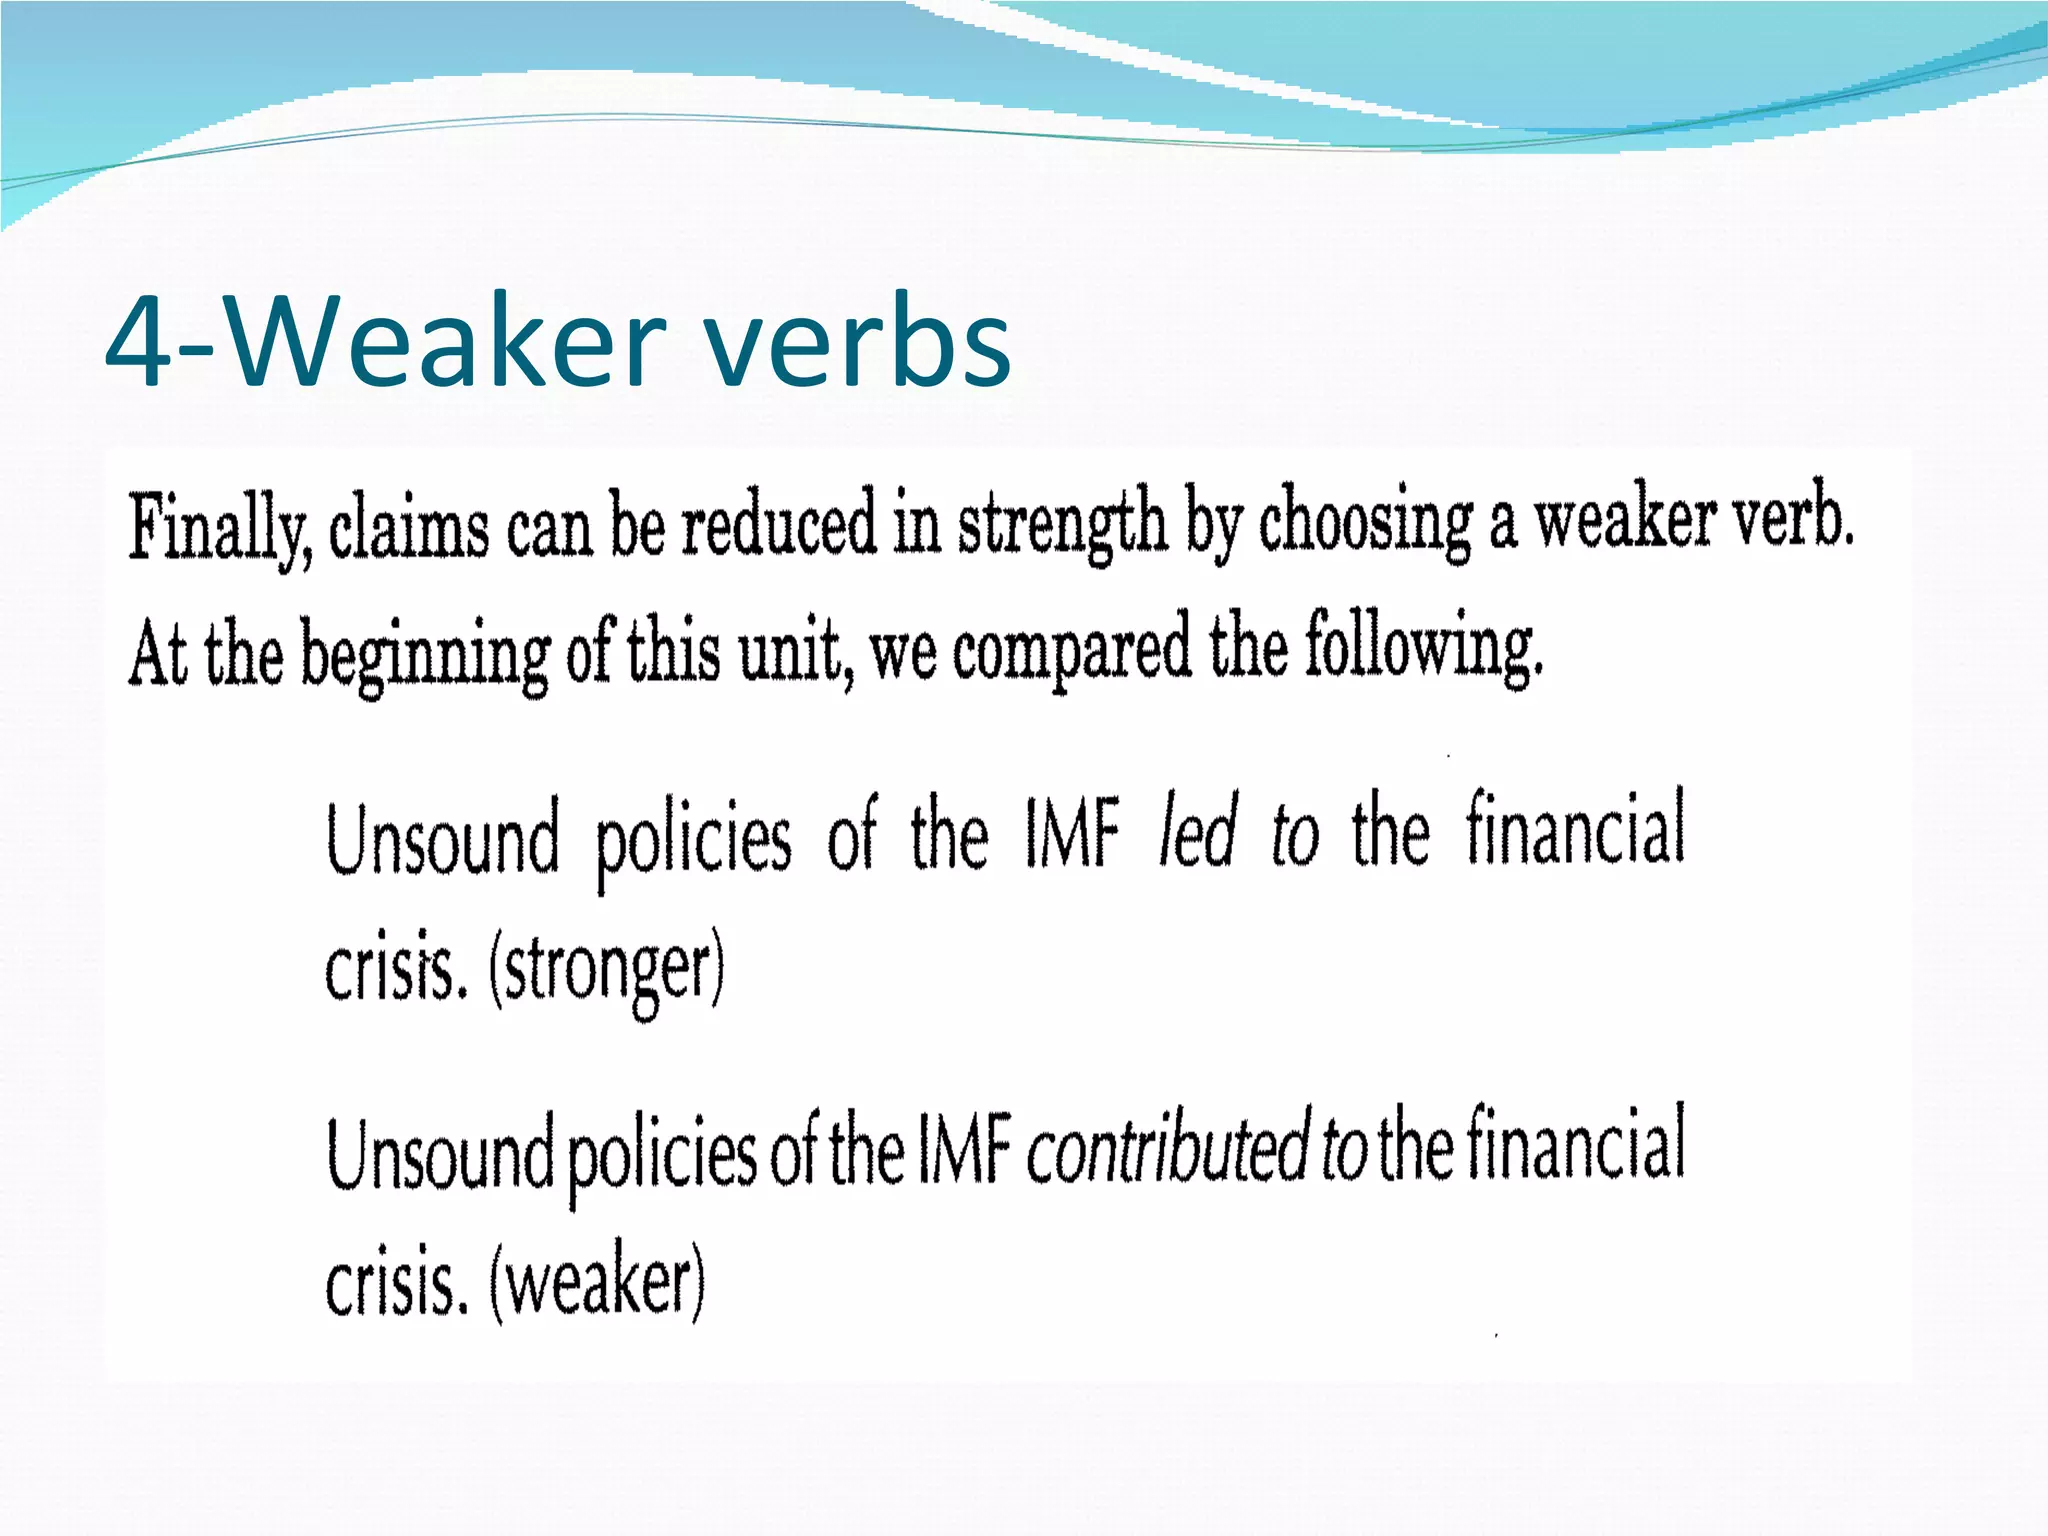
Use of linking clauses for causal relationships in English grammar.
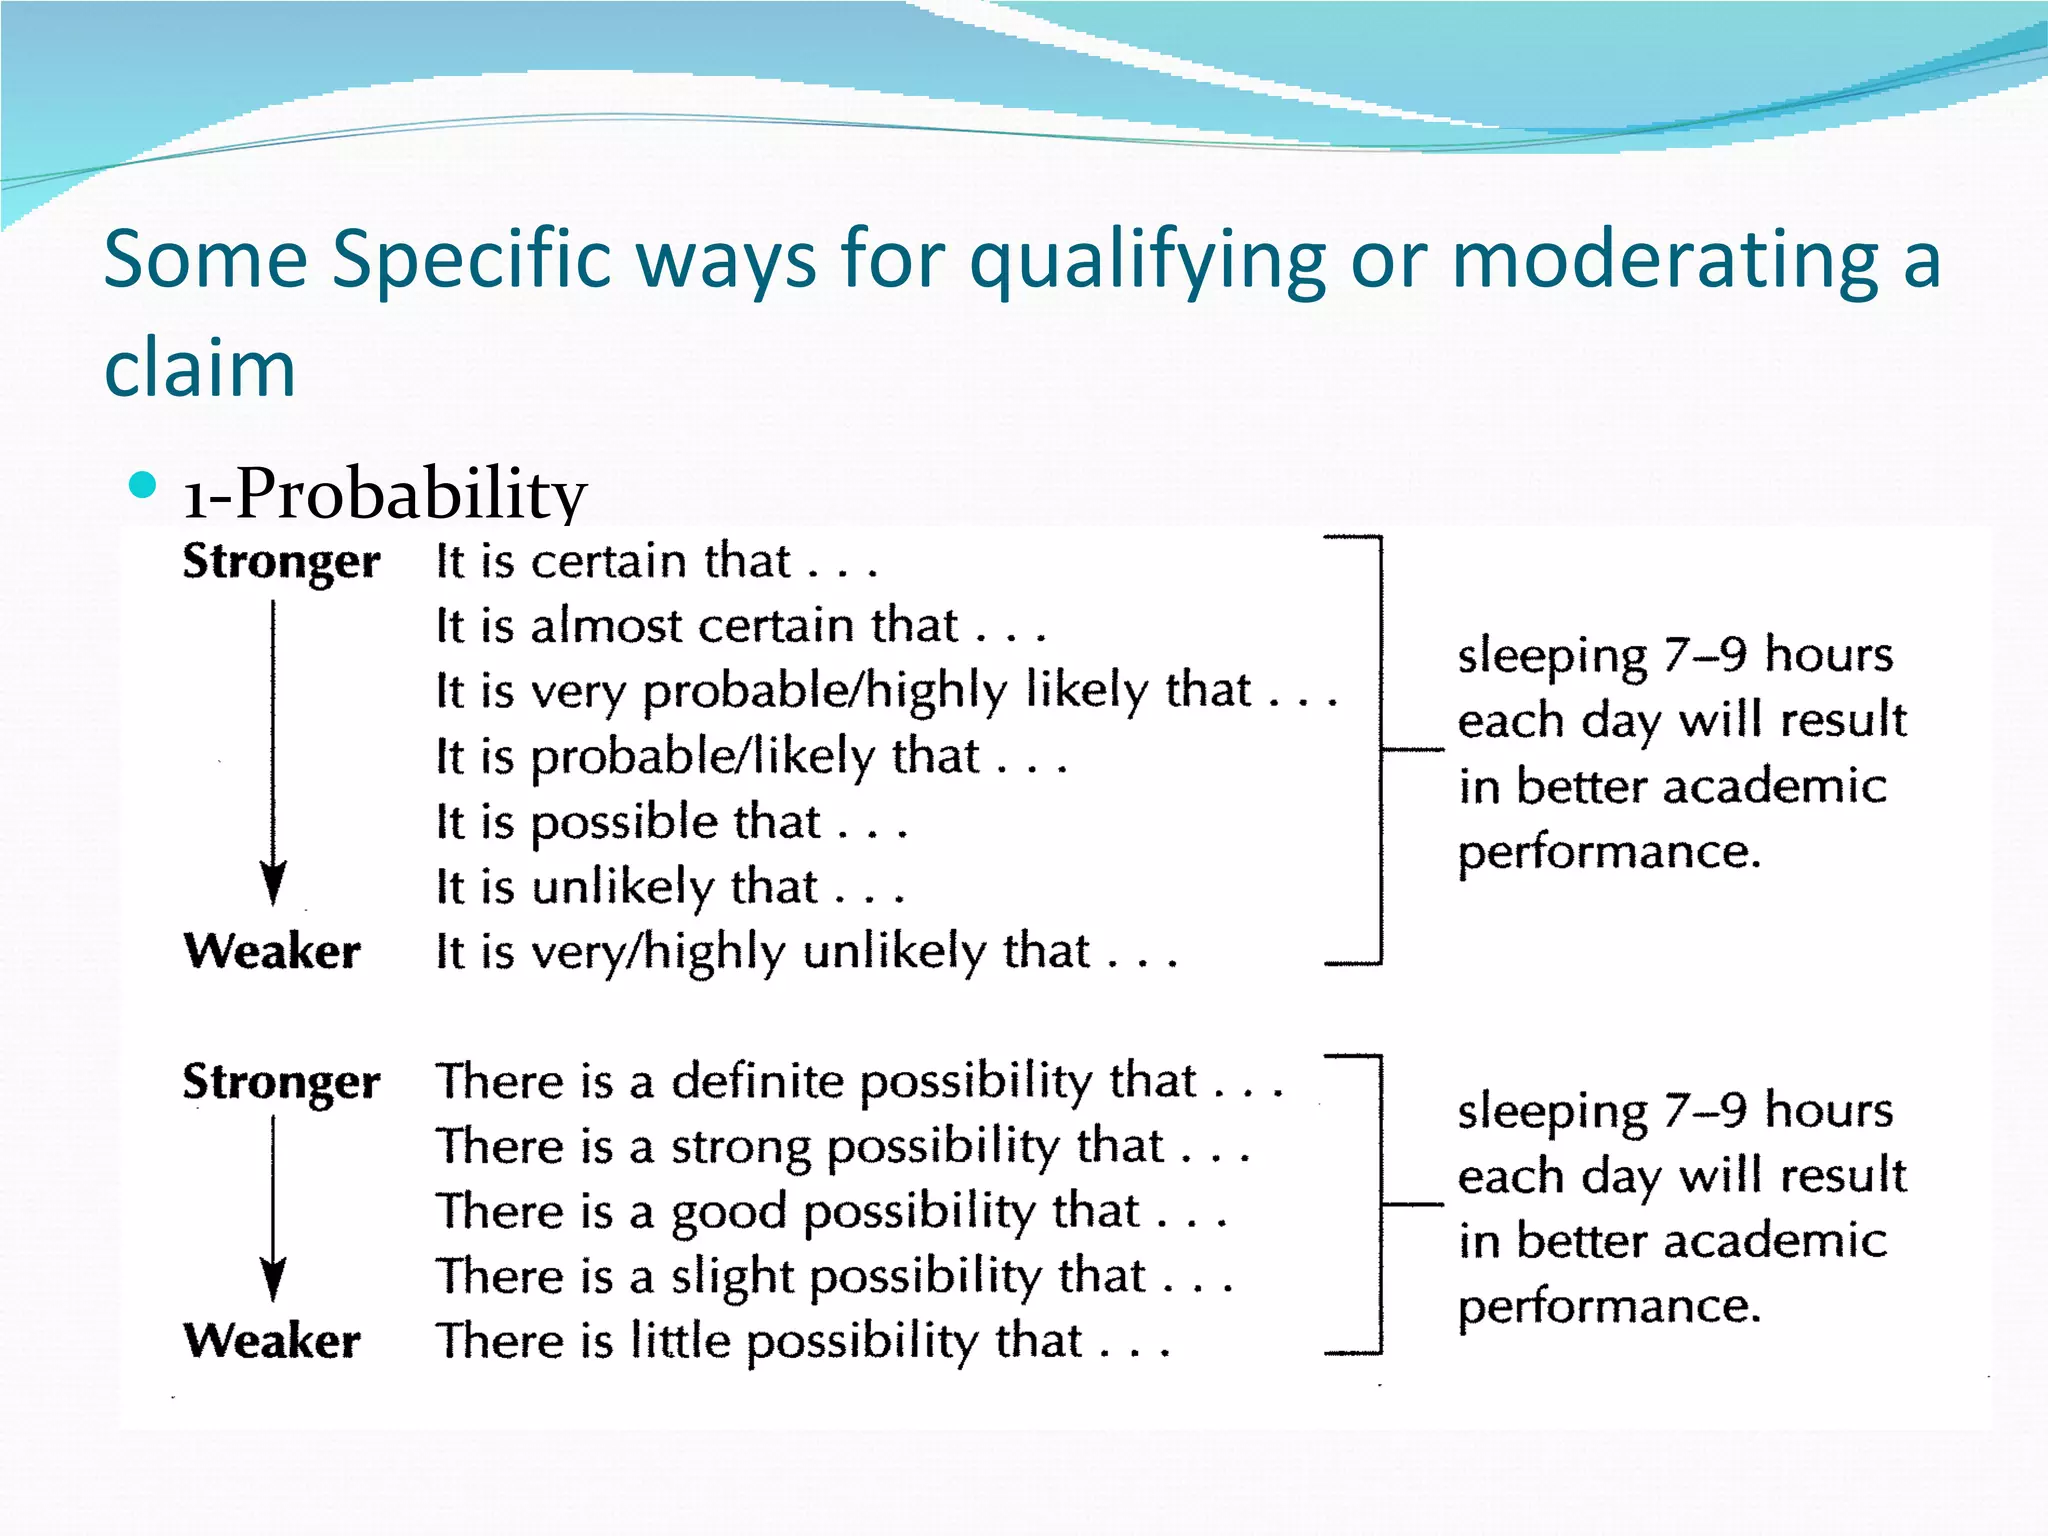
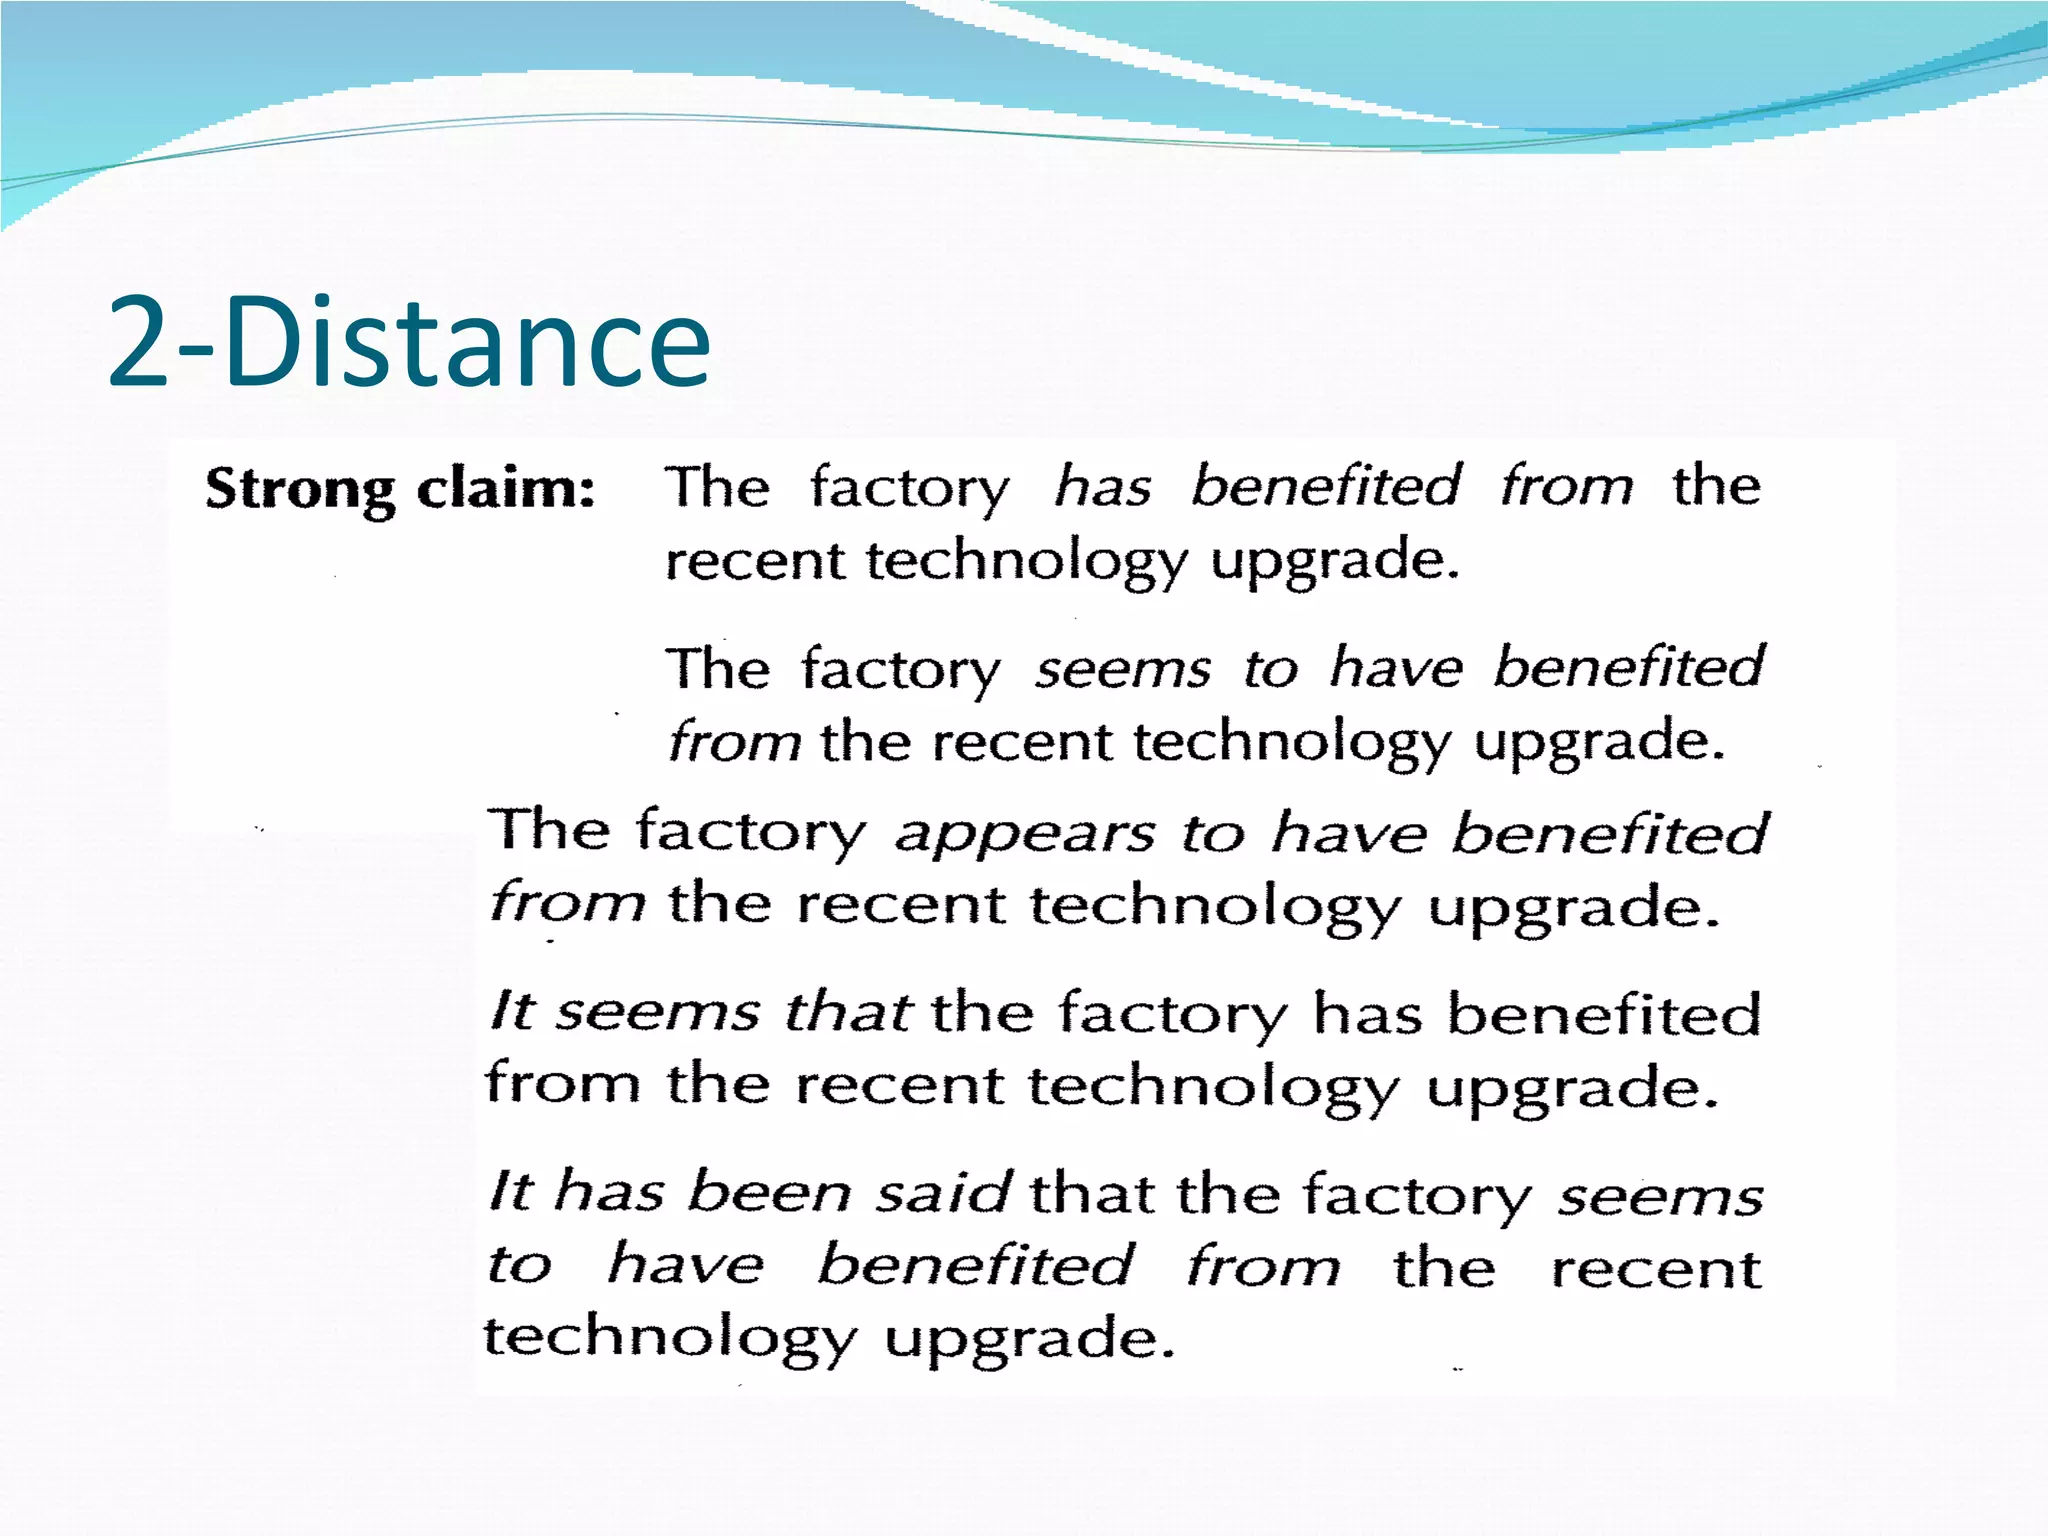
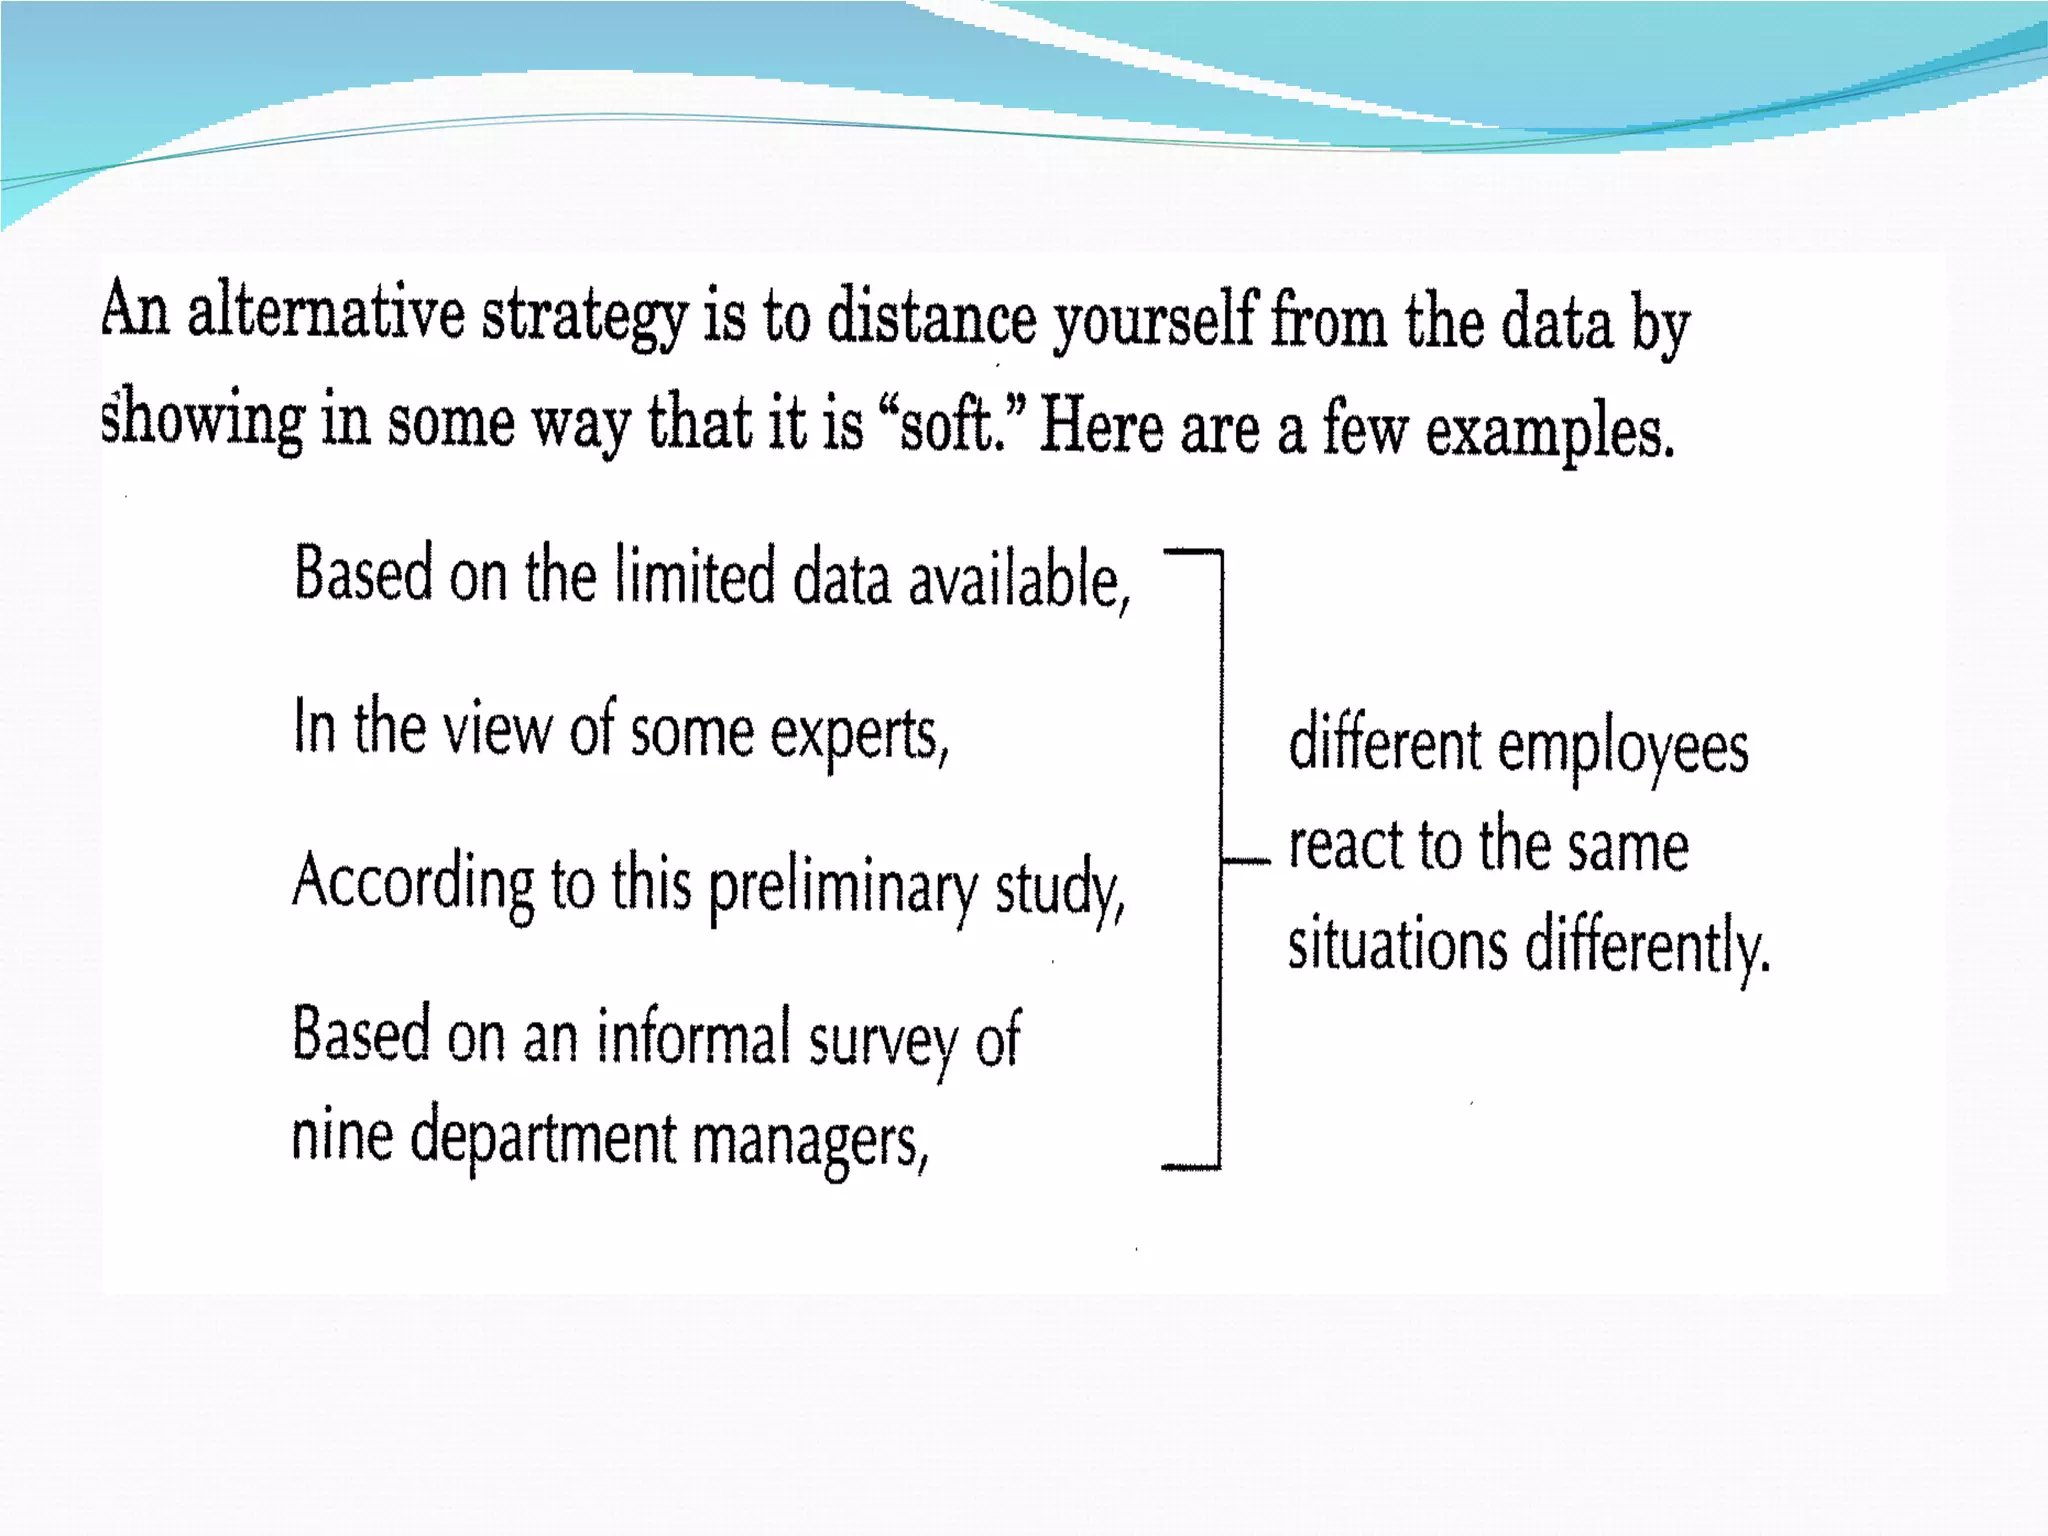
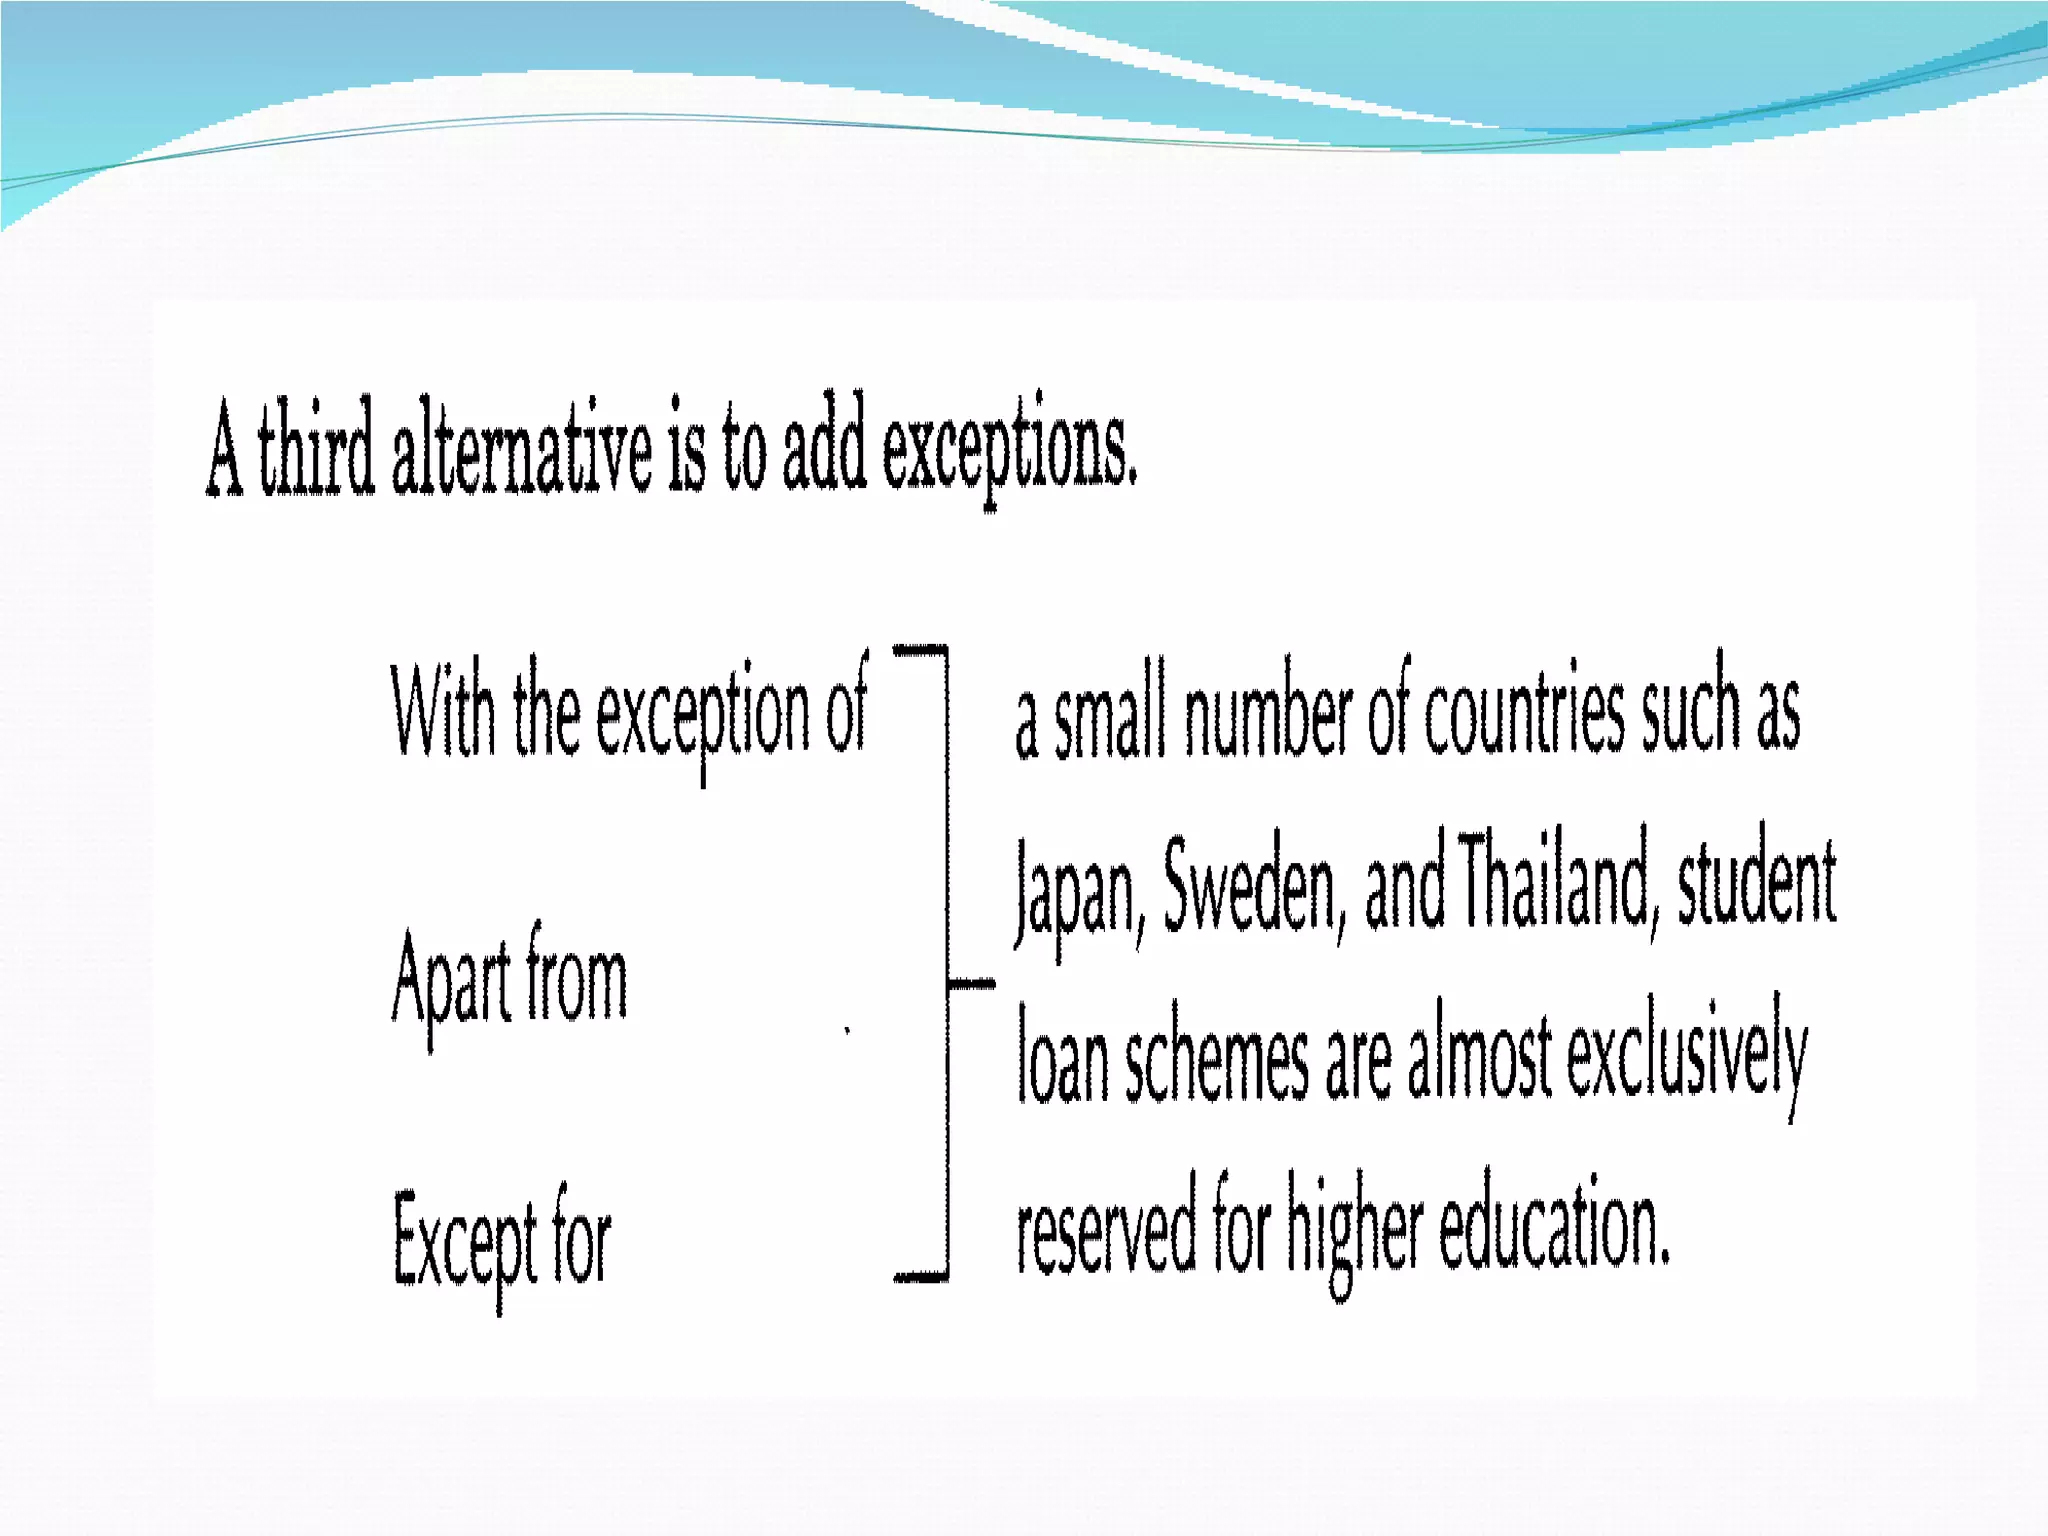
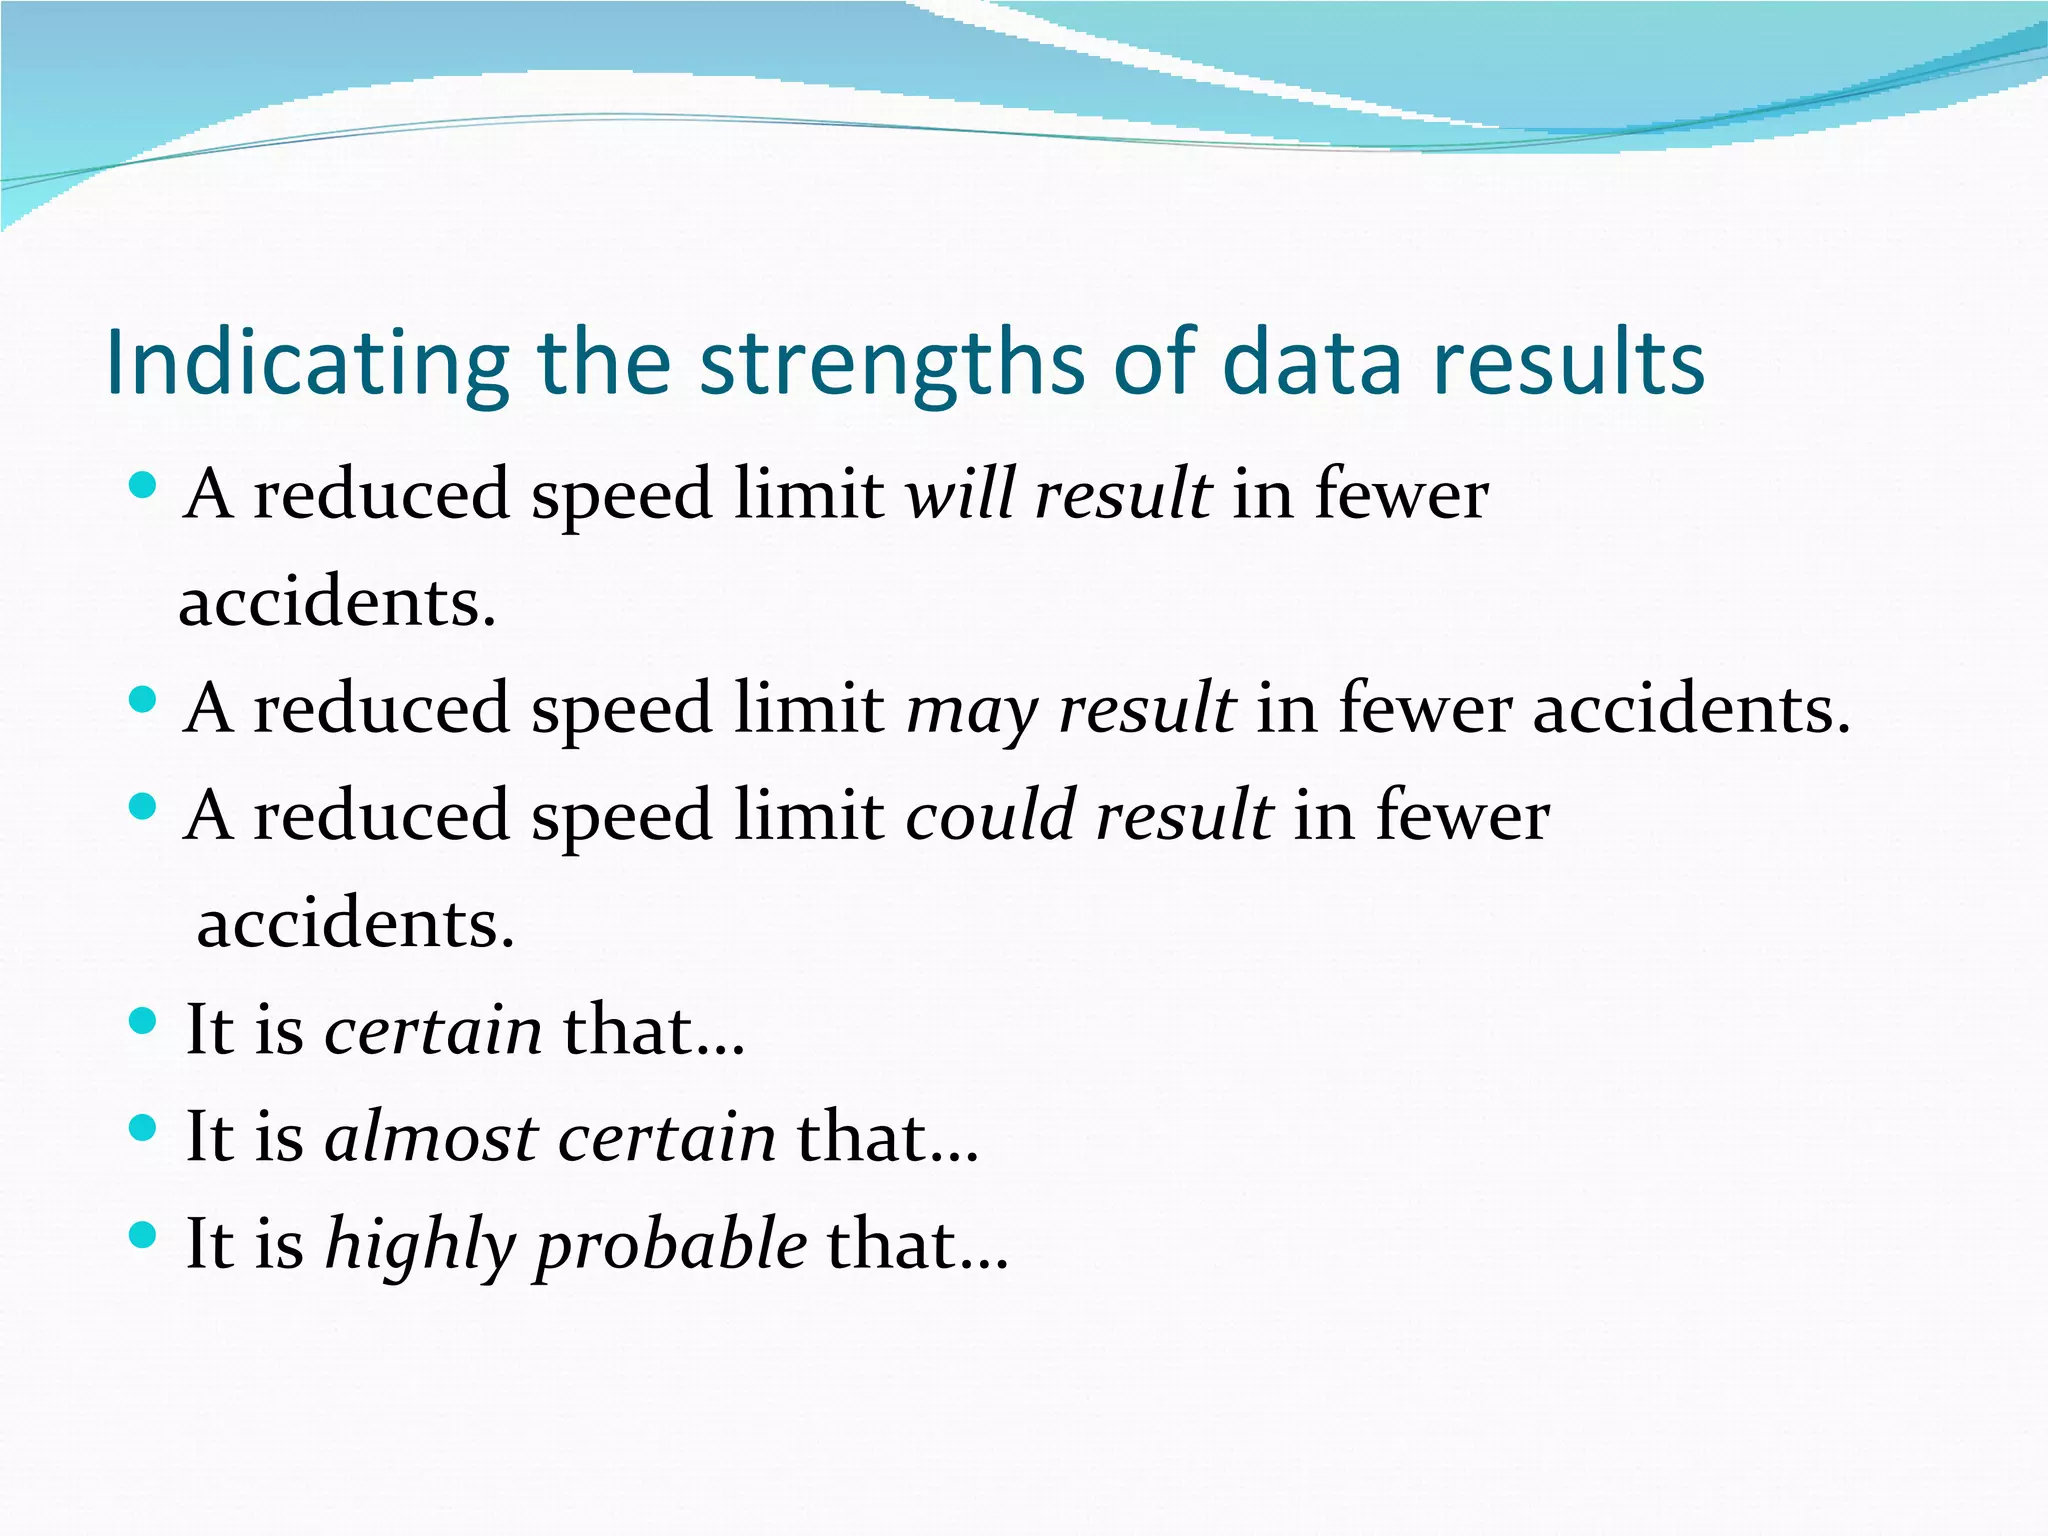
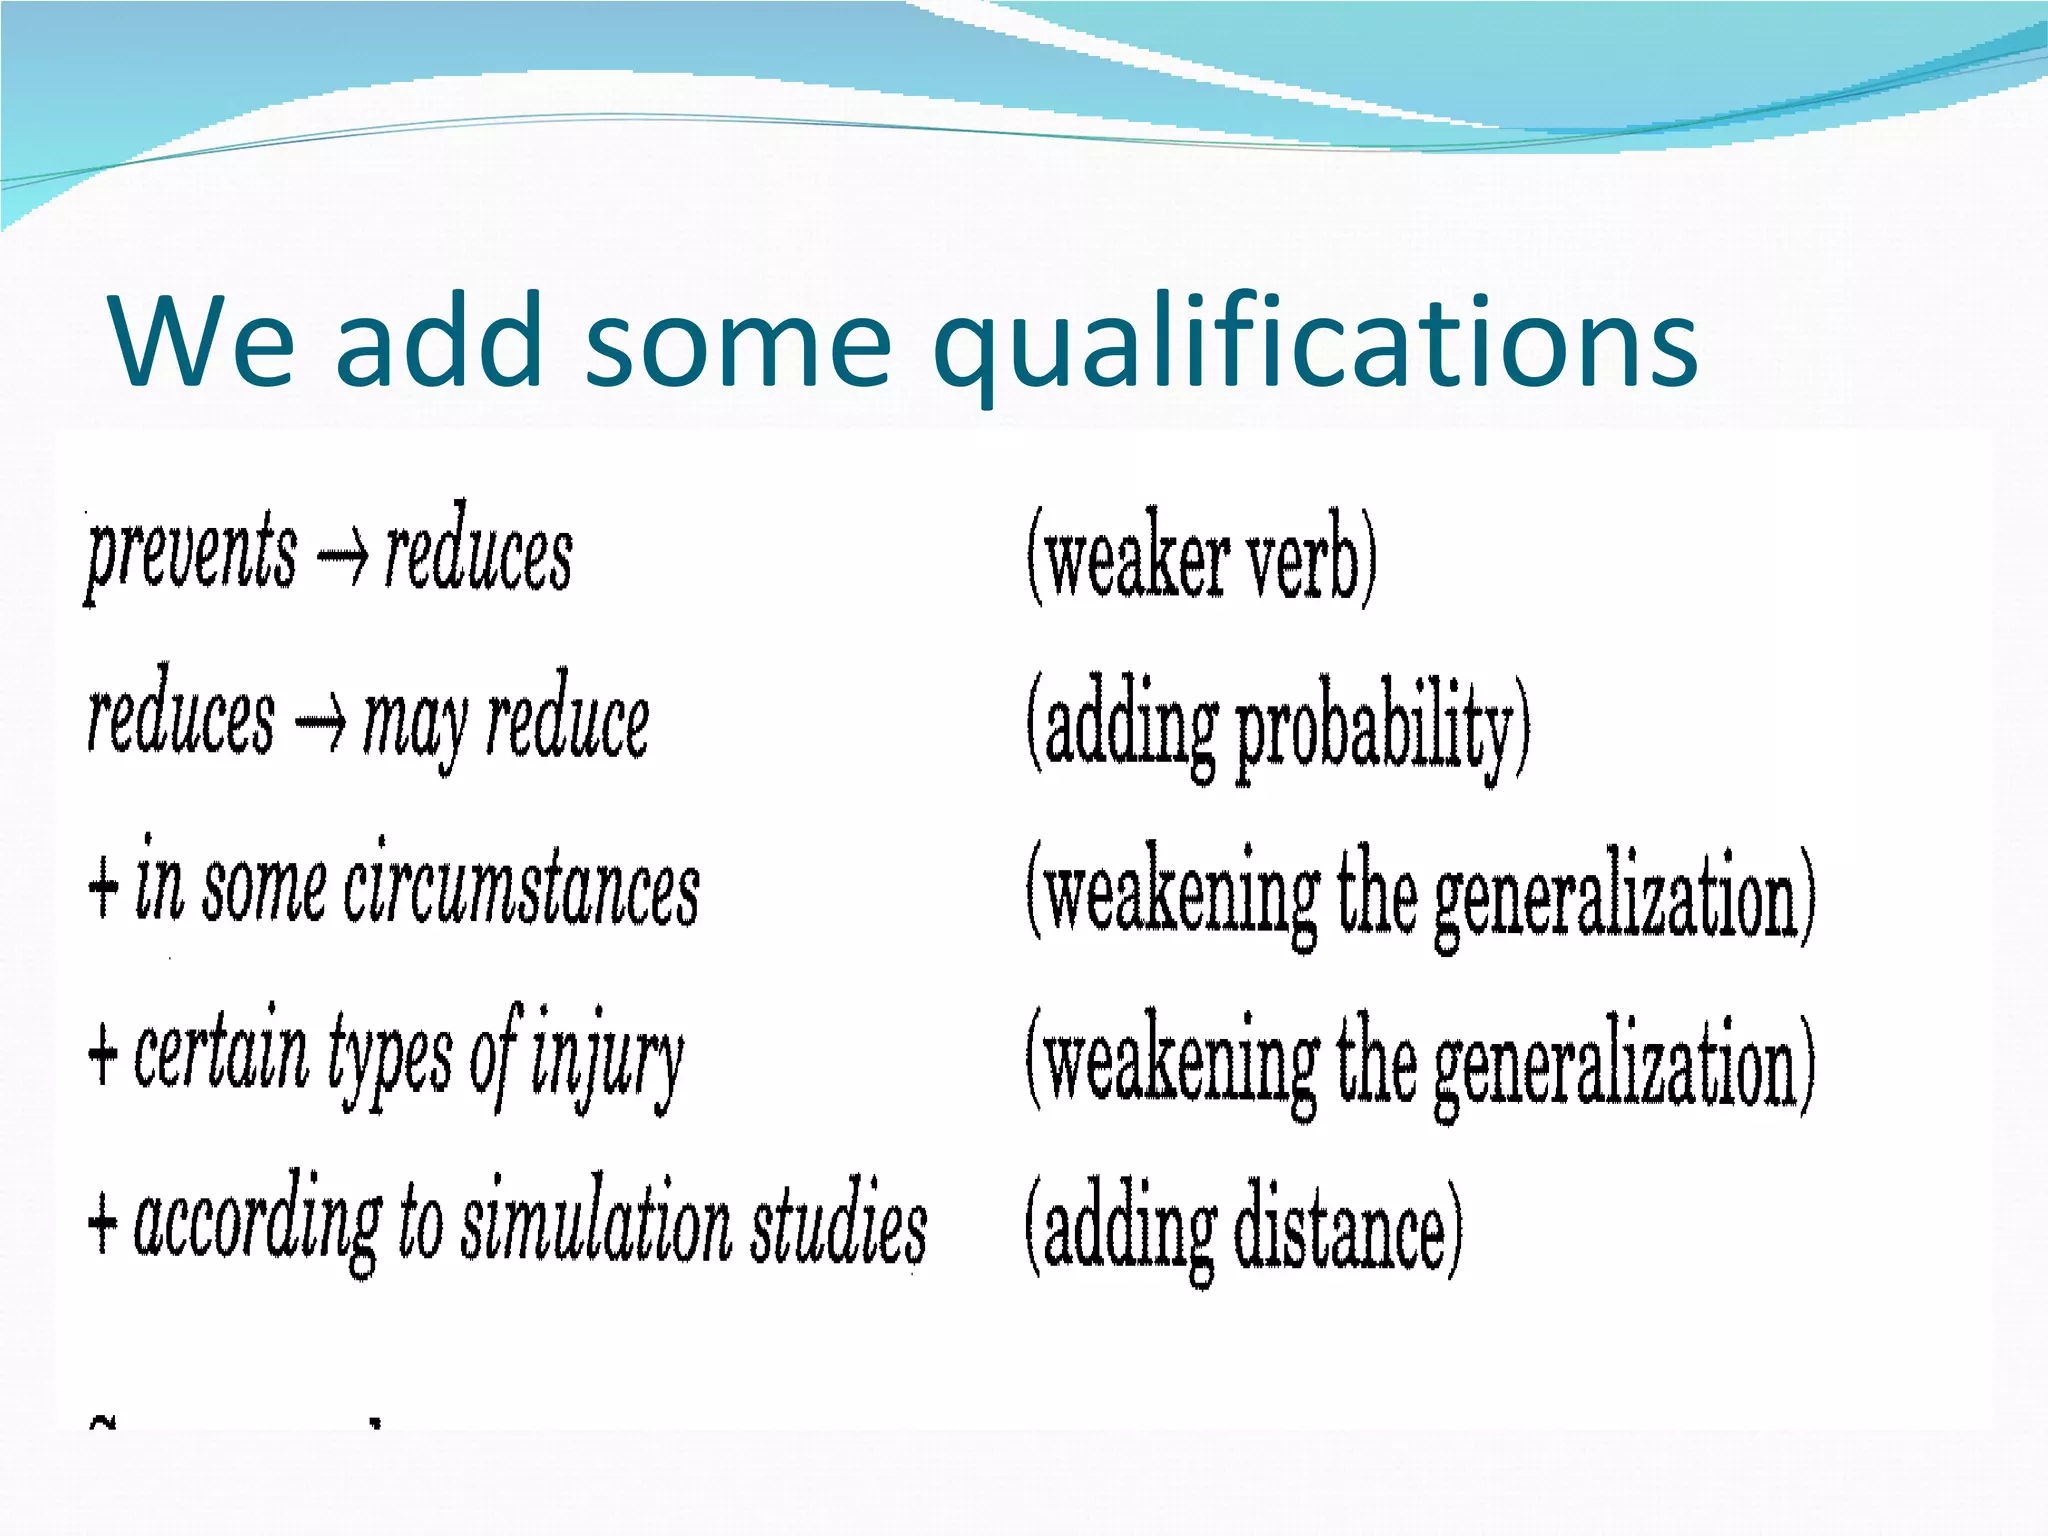
Methods for qualifying claims in commentary using probability and generalization.
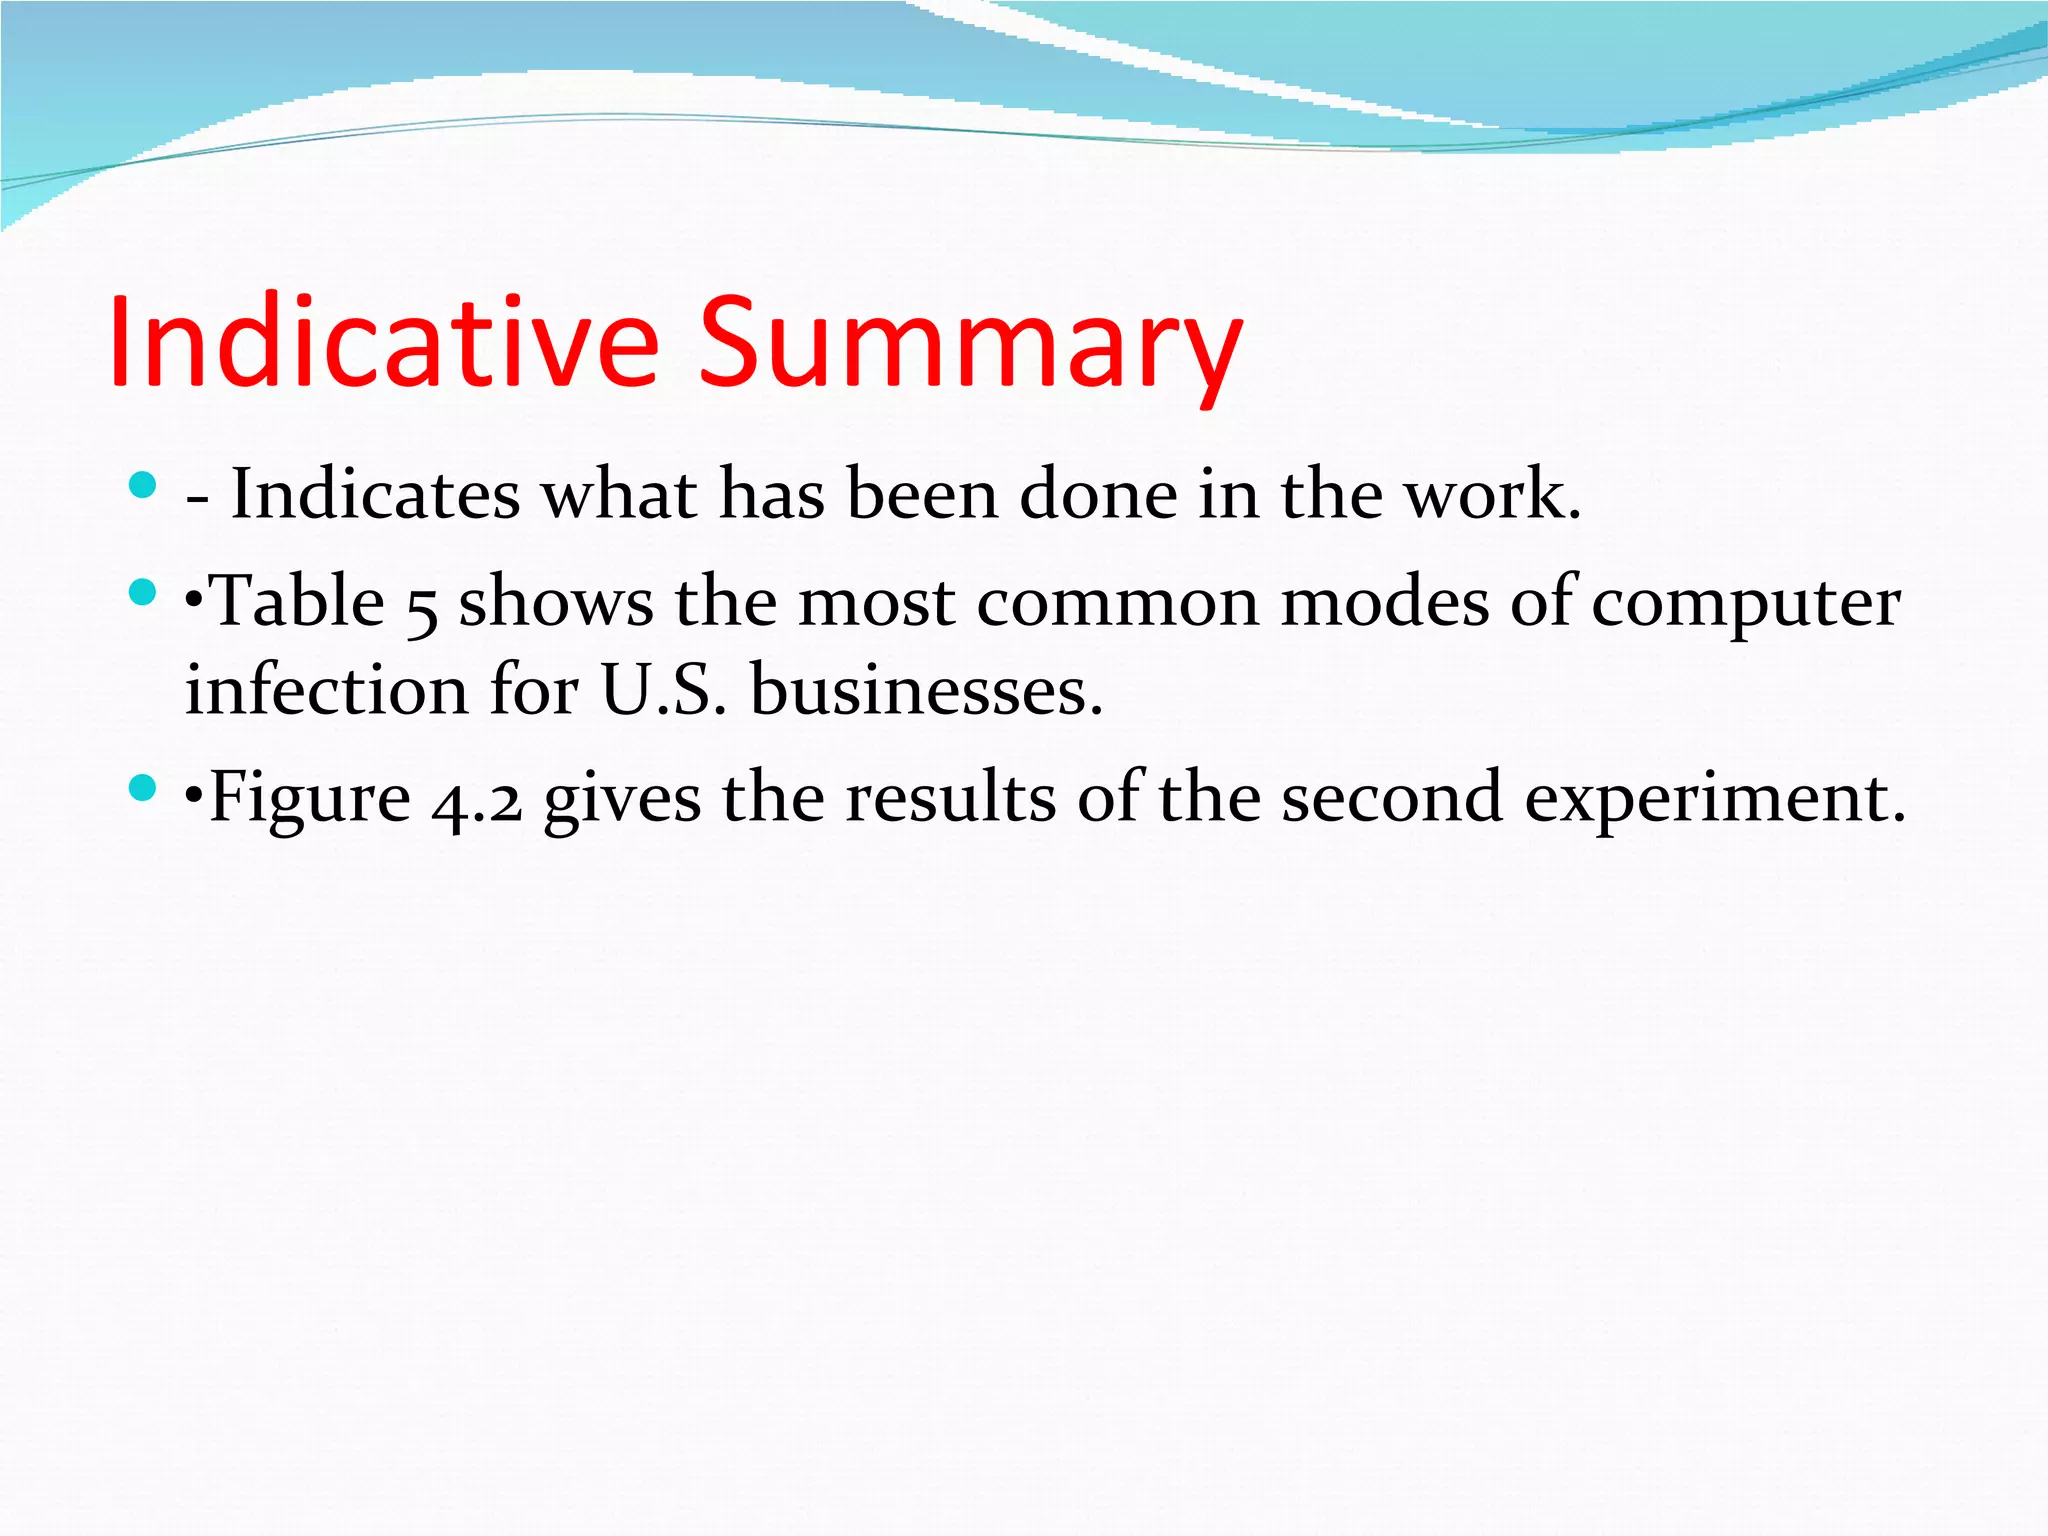
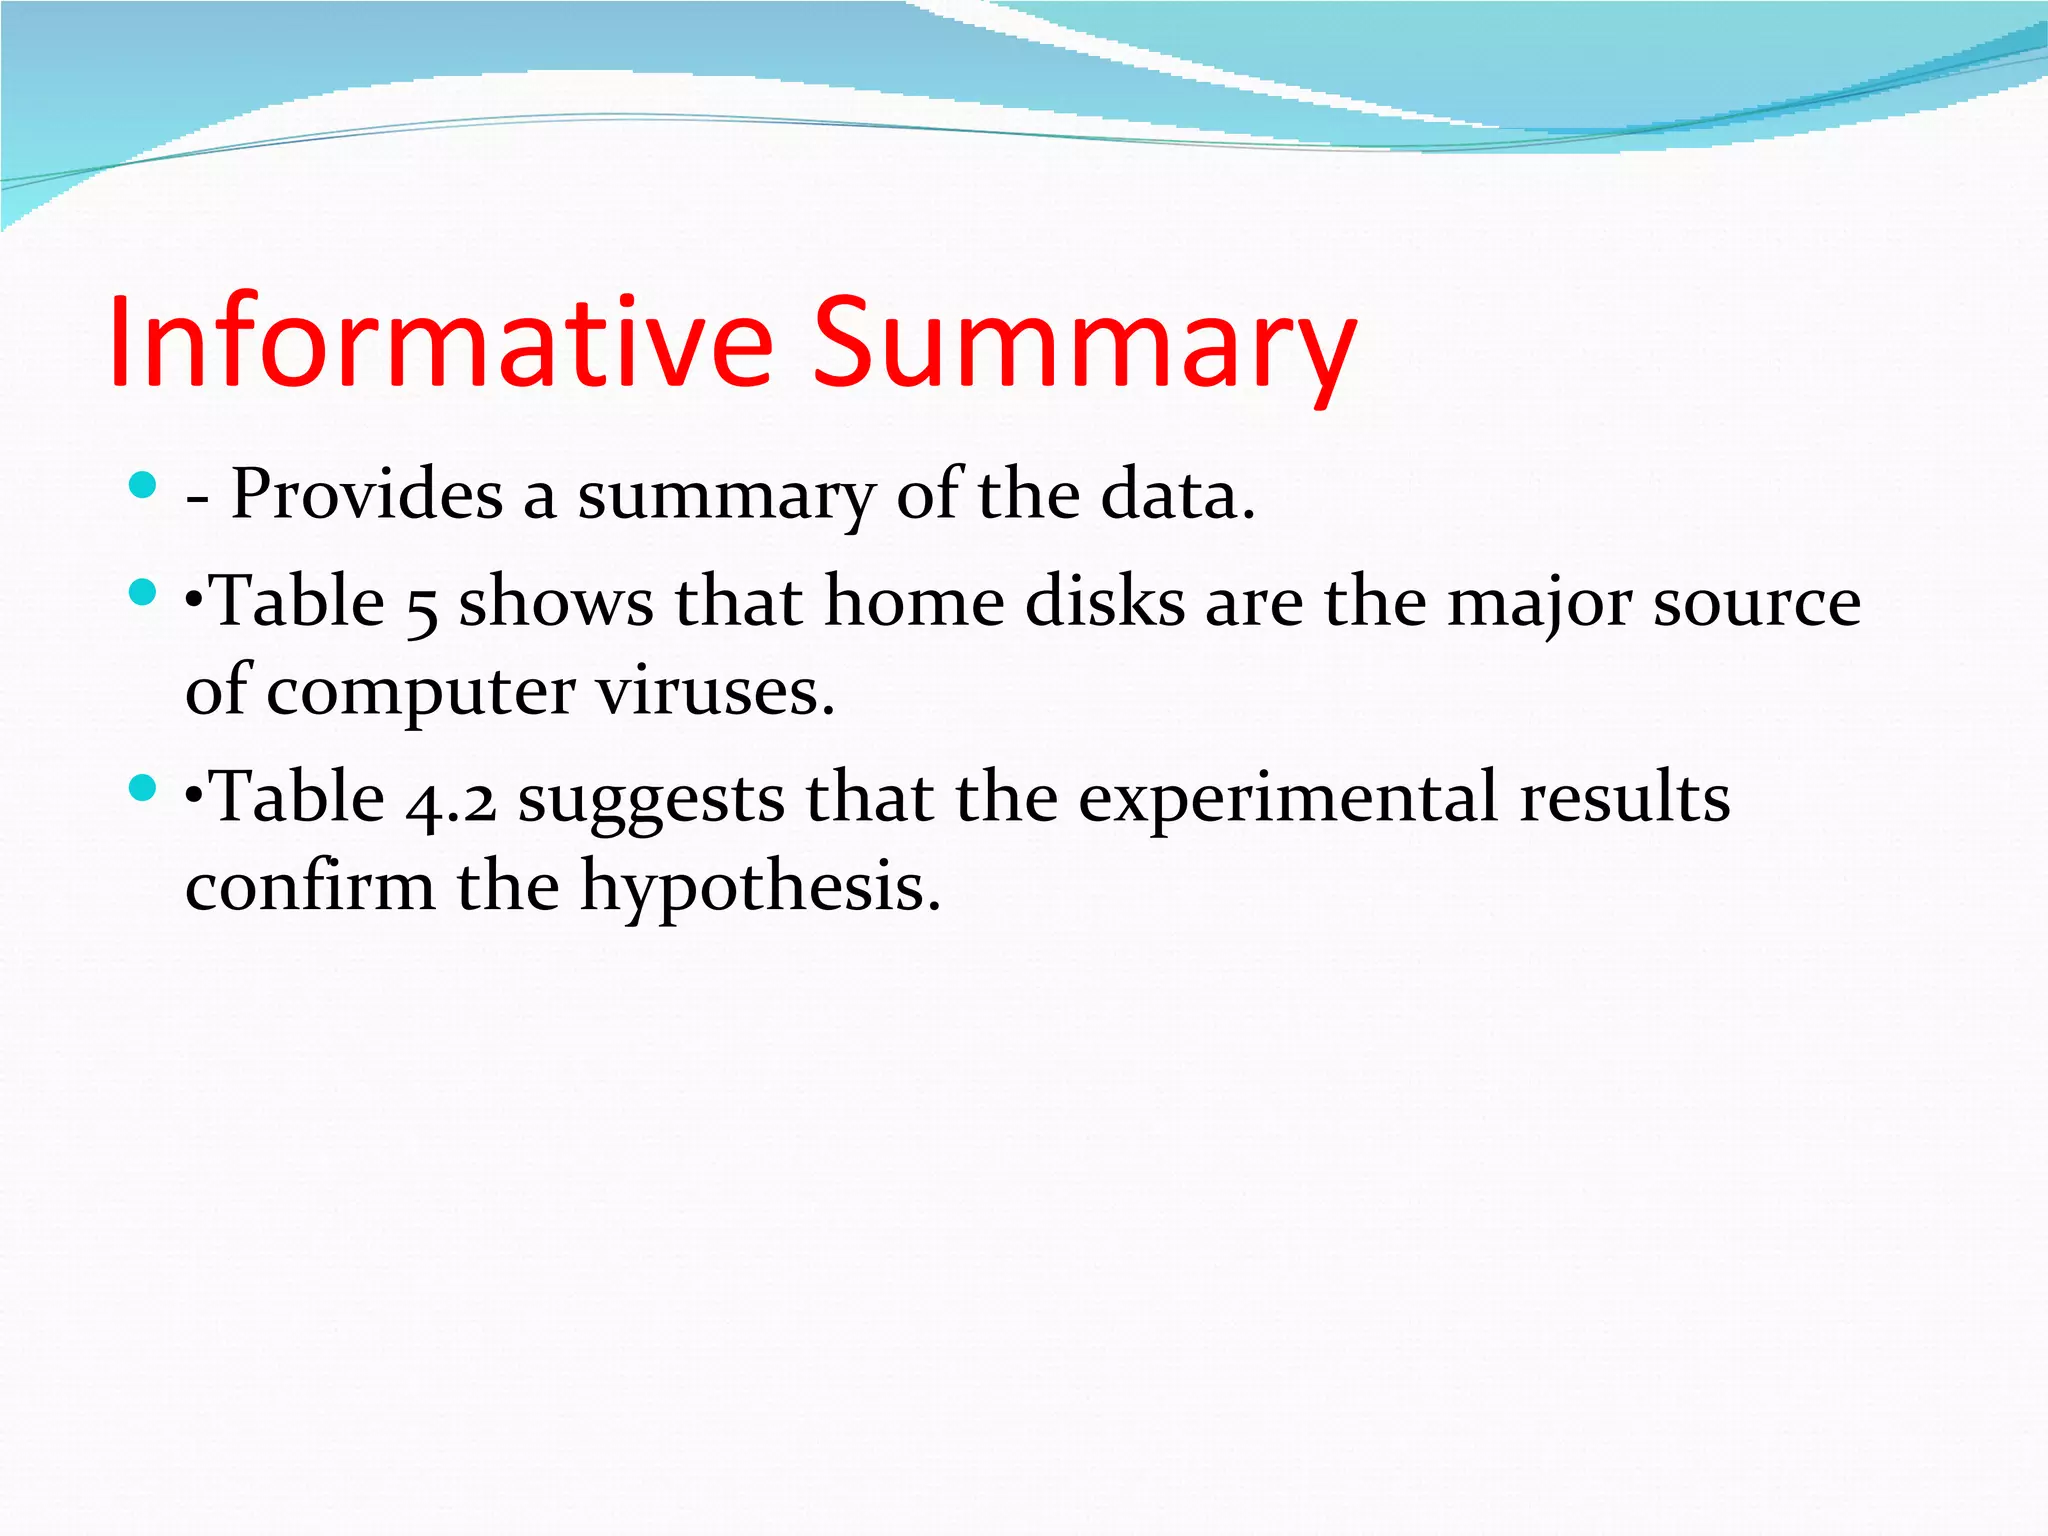
Summarizing data results with indicative summaries and varying degrees of certainty.
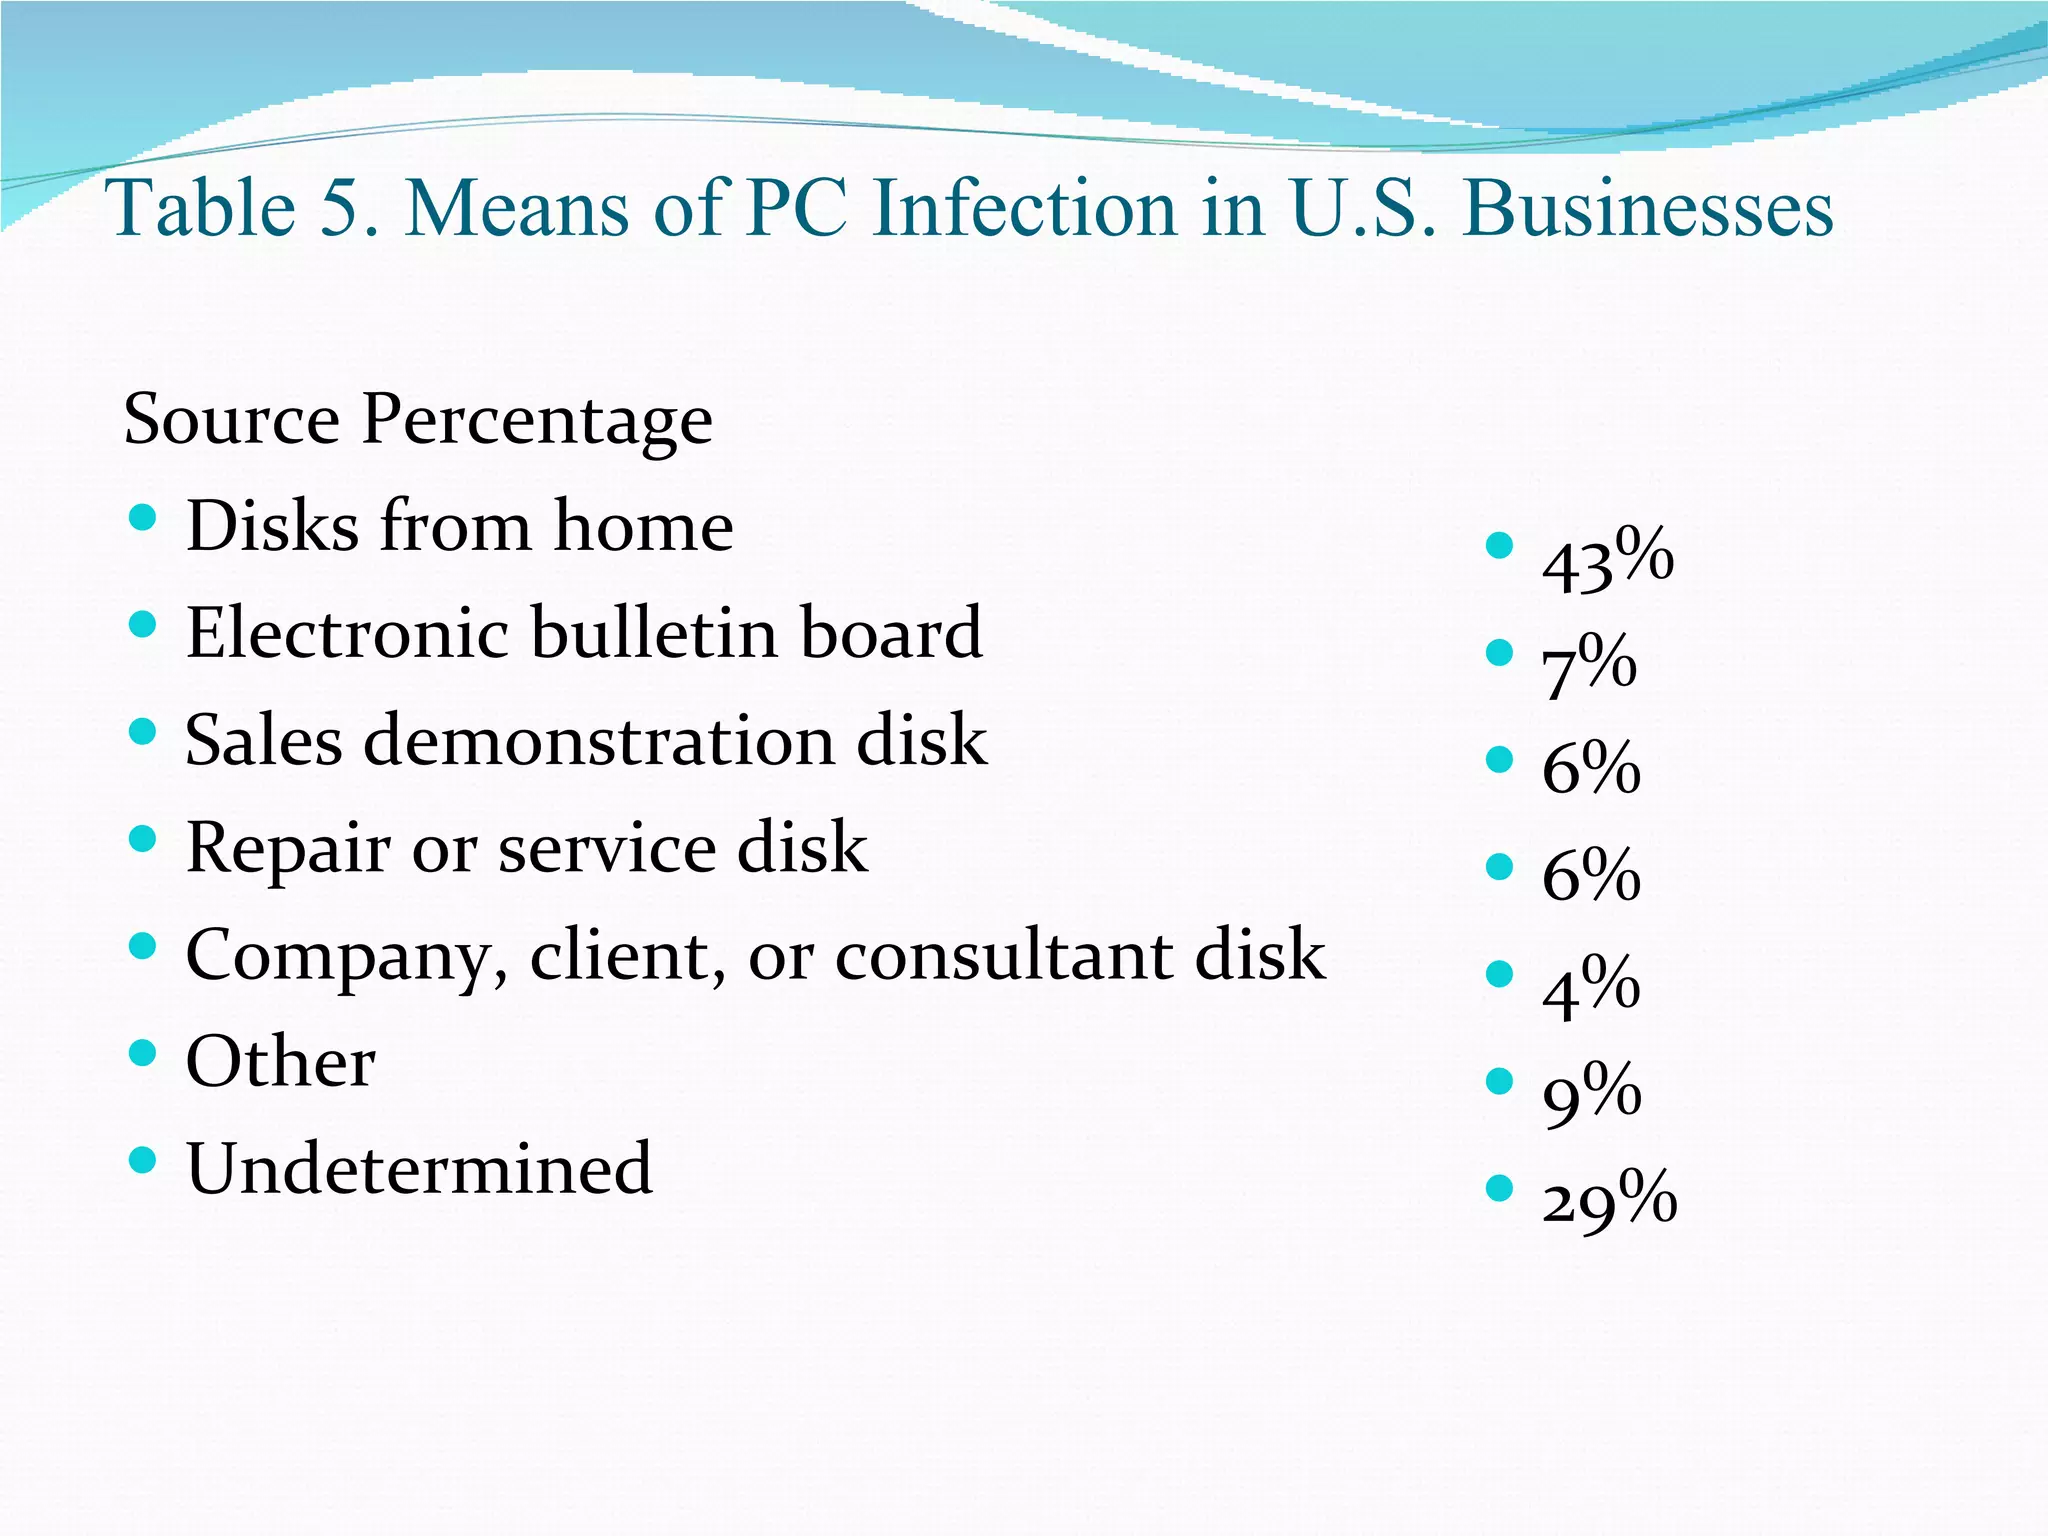
Example of a table showing PC infection sources, emphasizing analysis and implications.
Formulating strong claims and adding qualifications for clear data results.
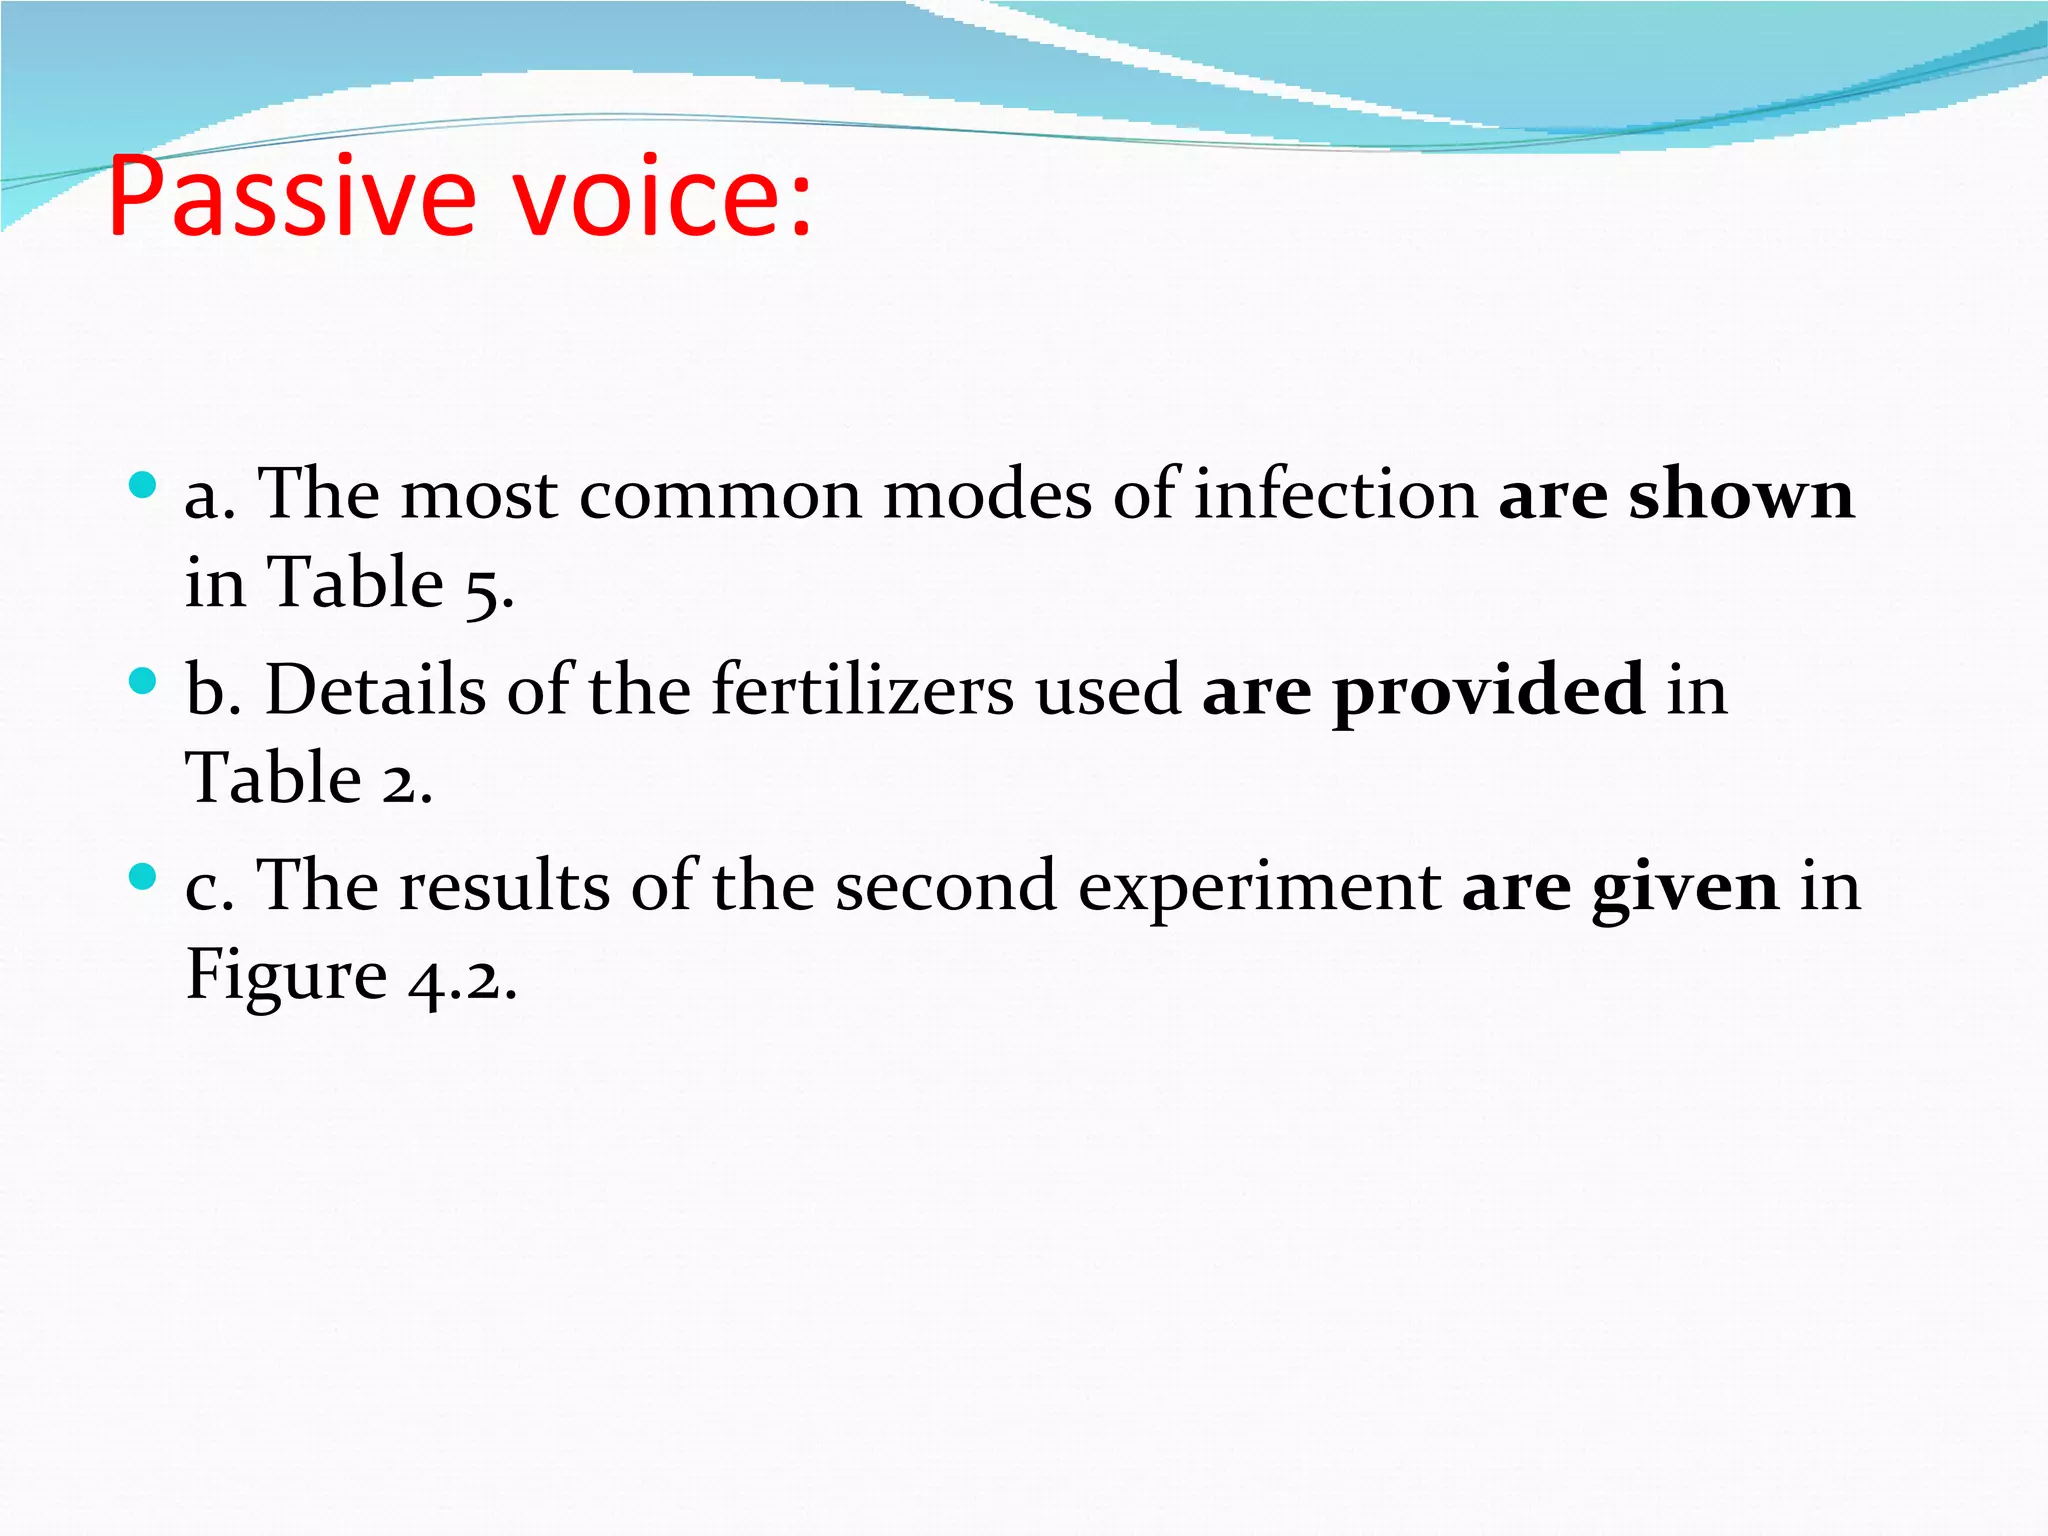
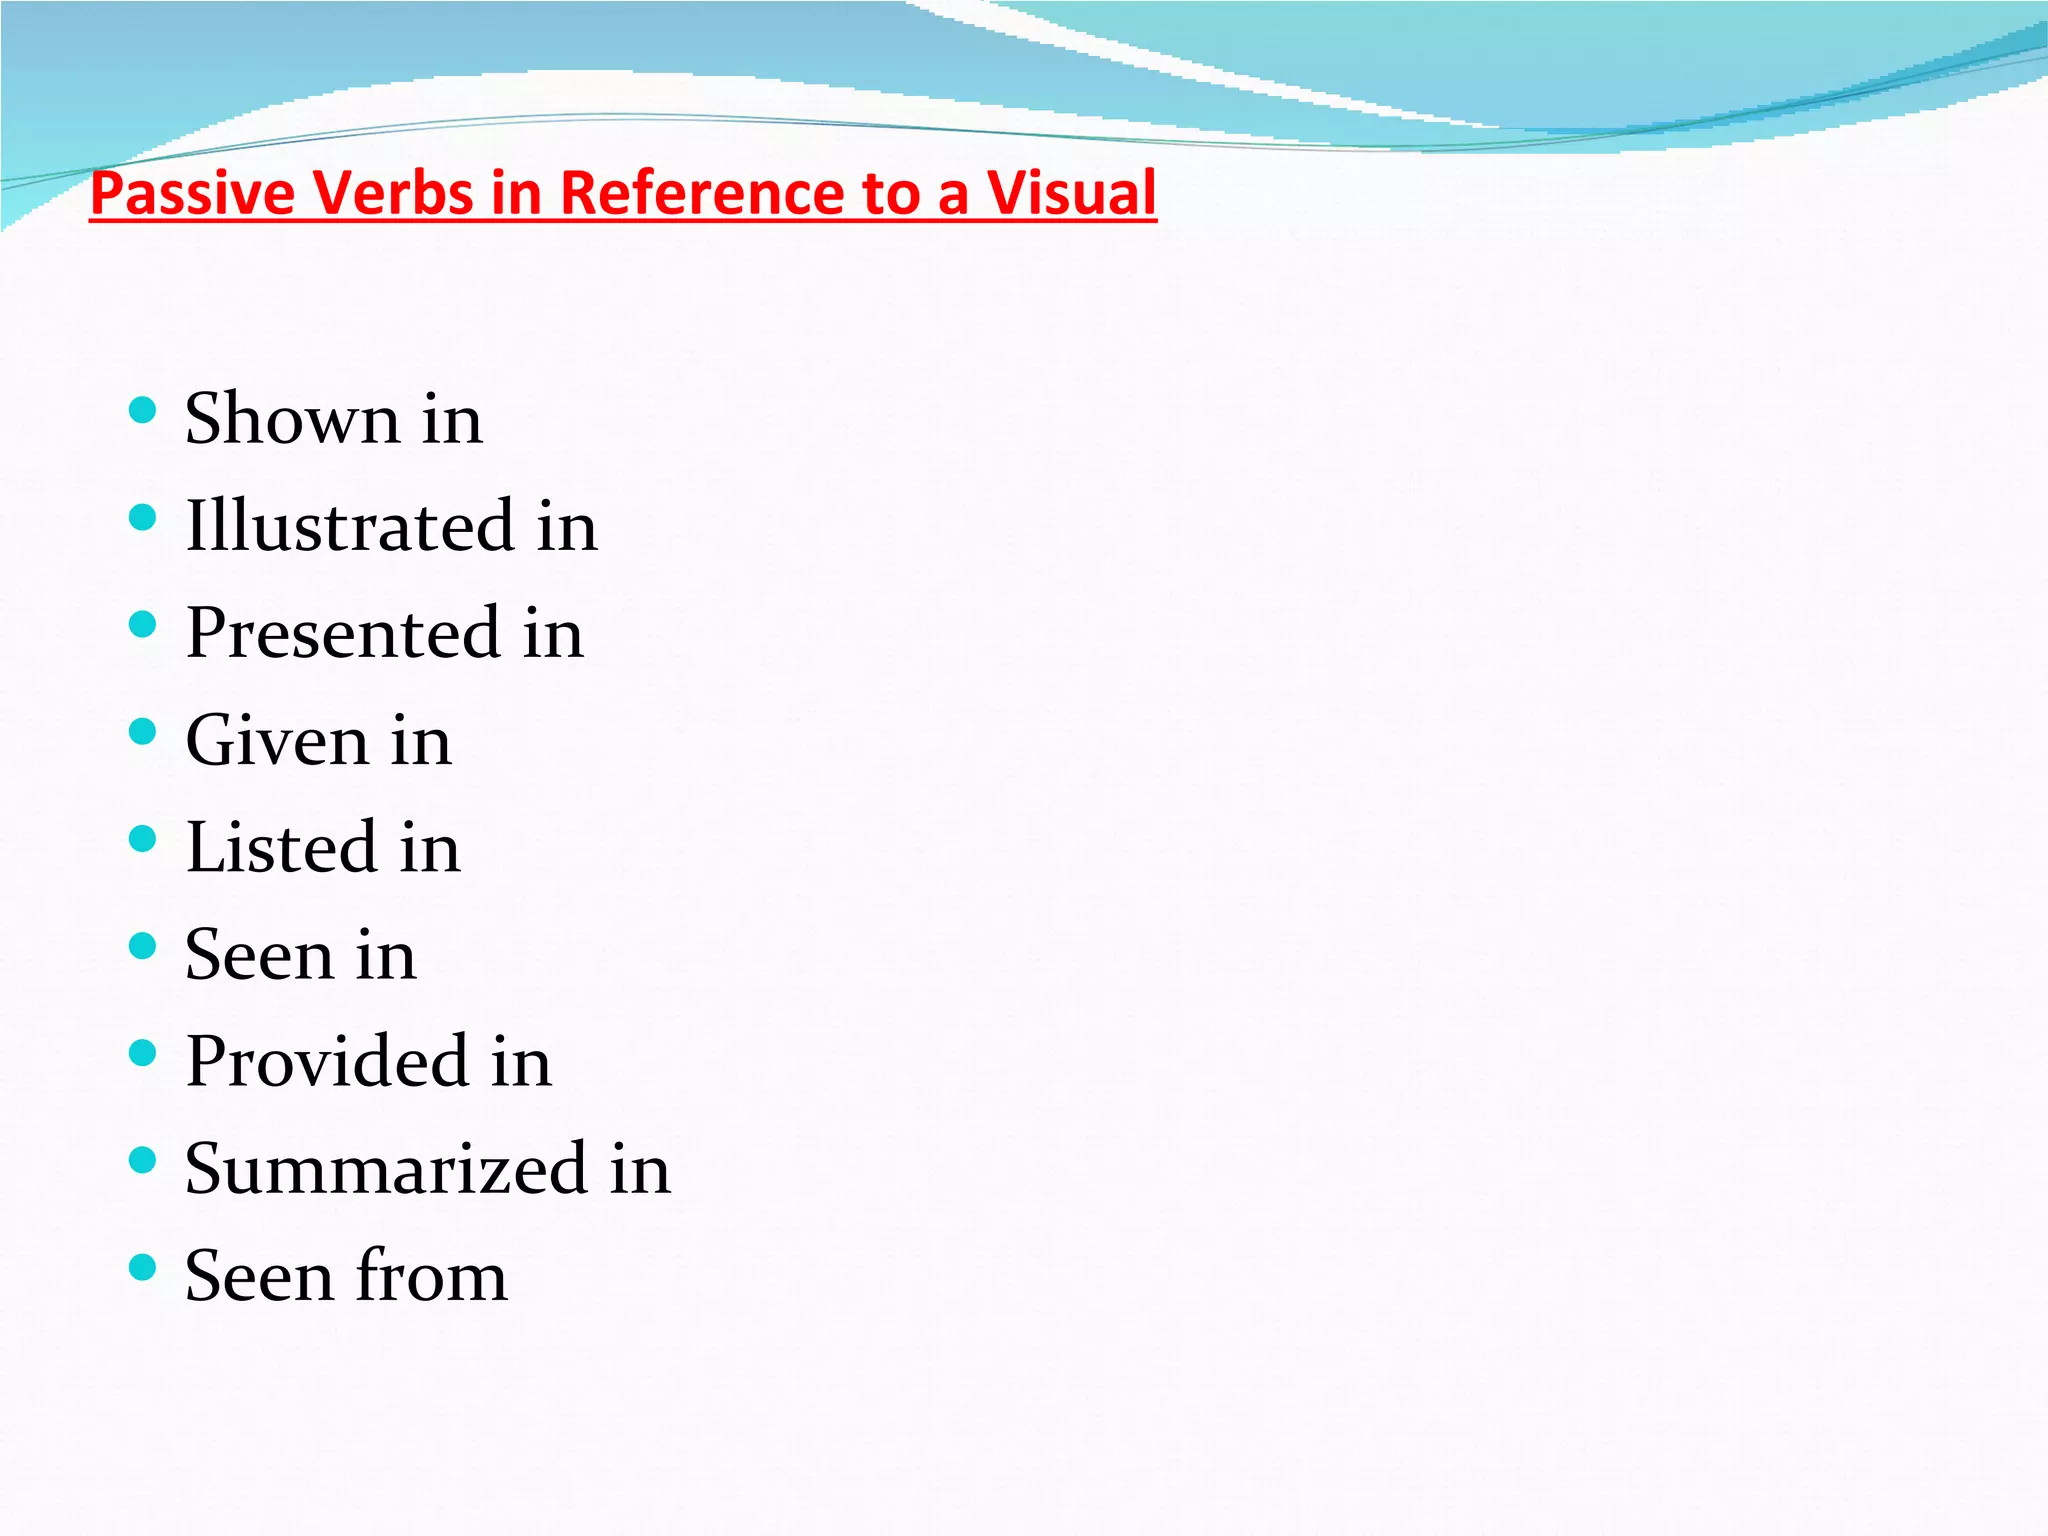
Examples of passive voice usage when referencing visual data.
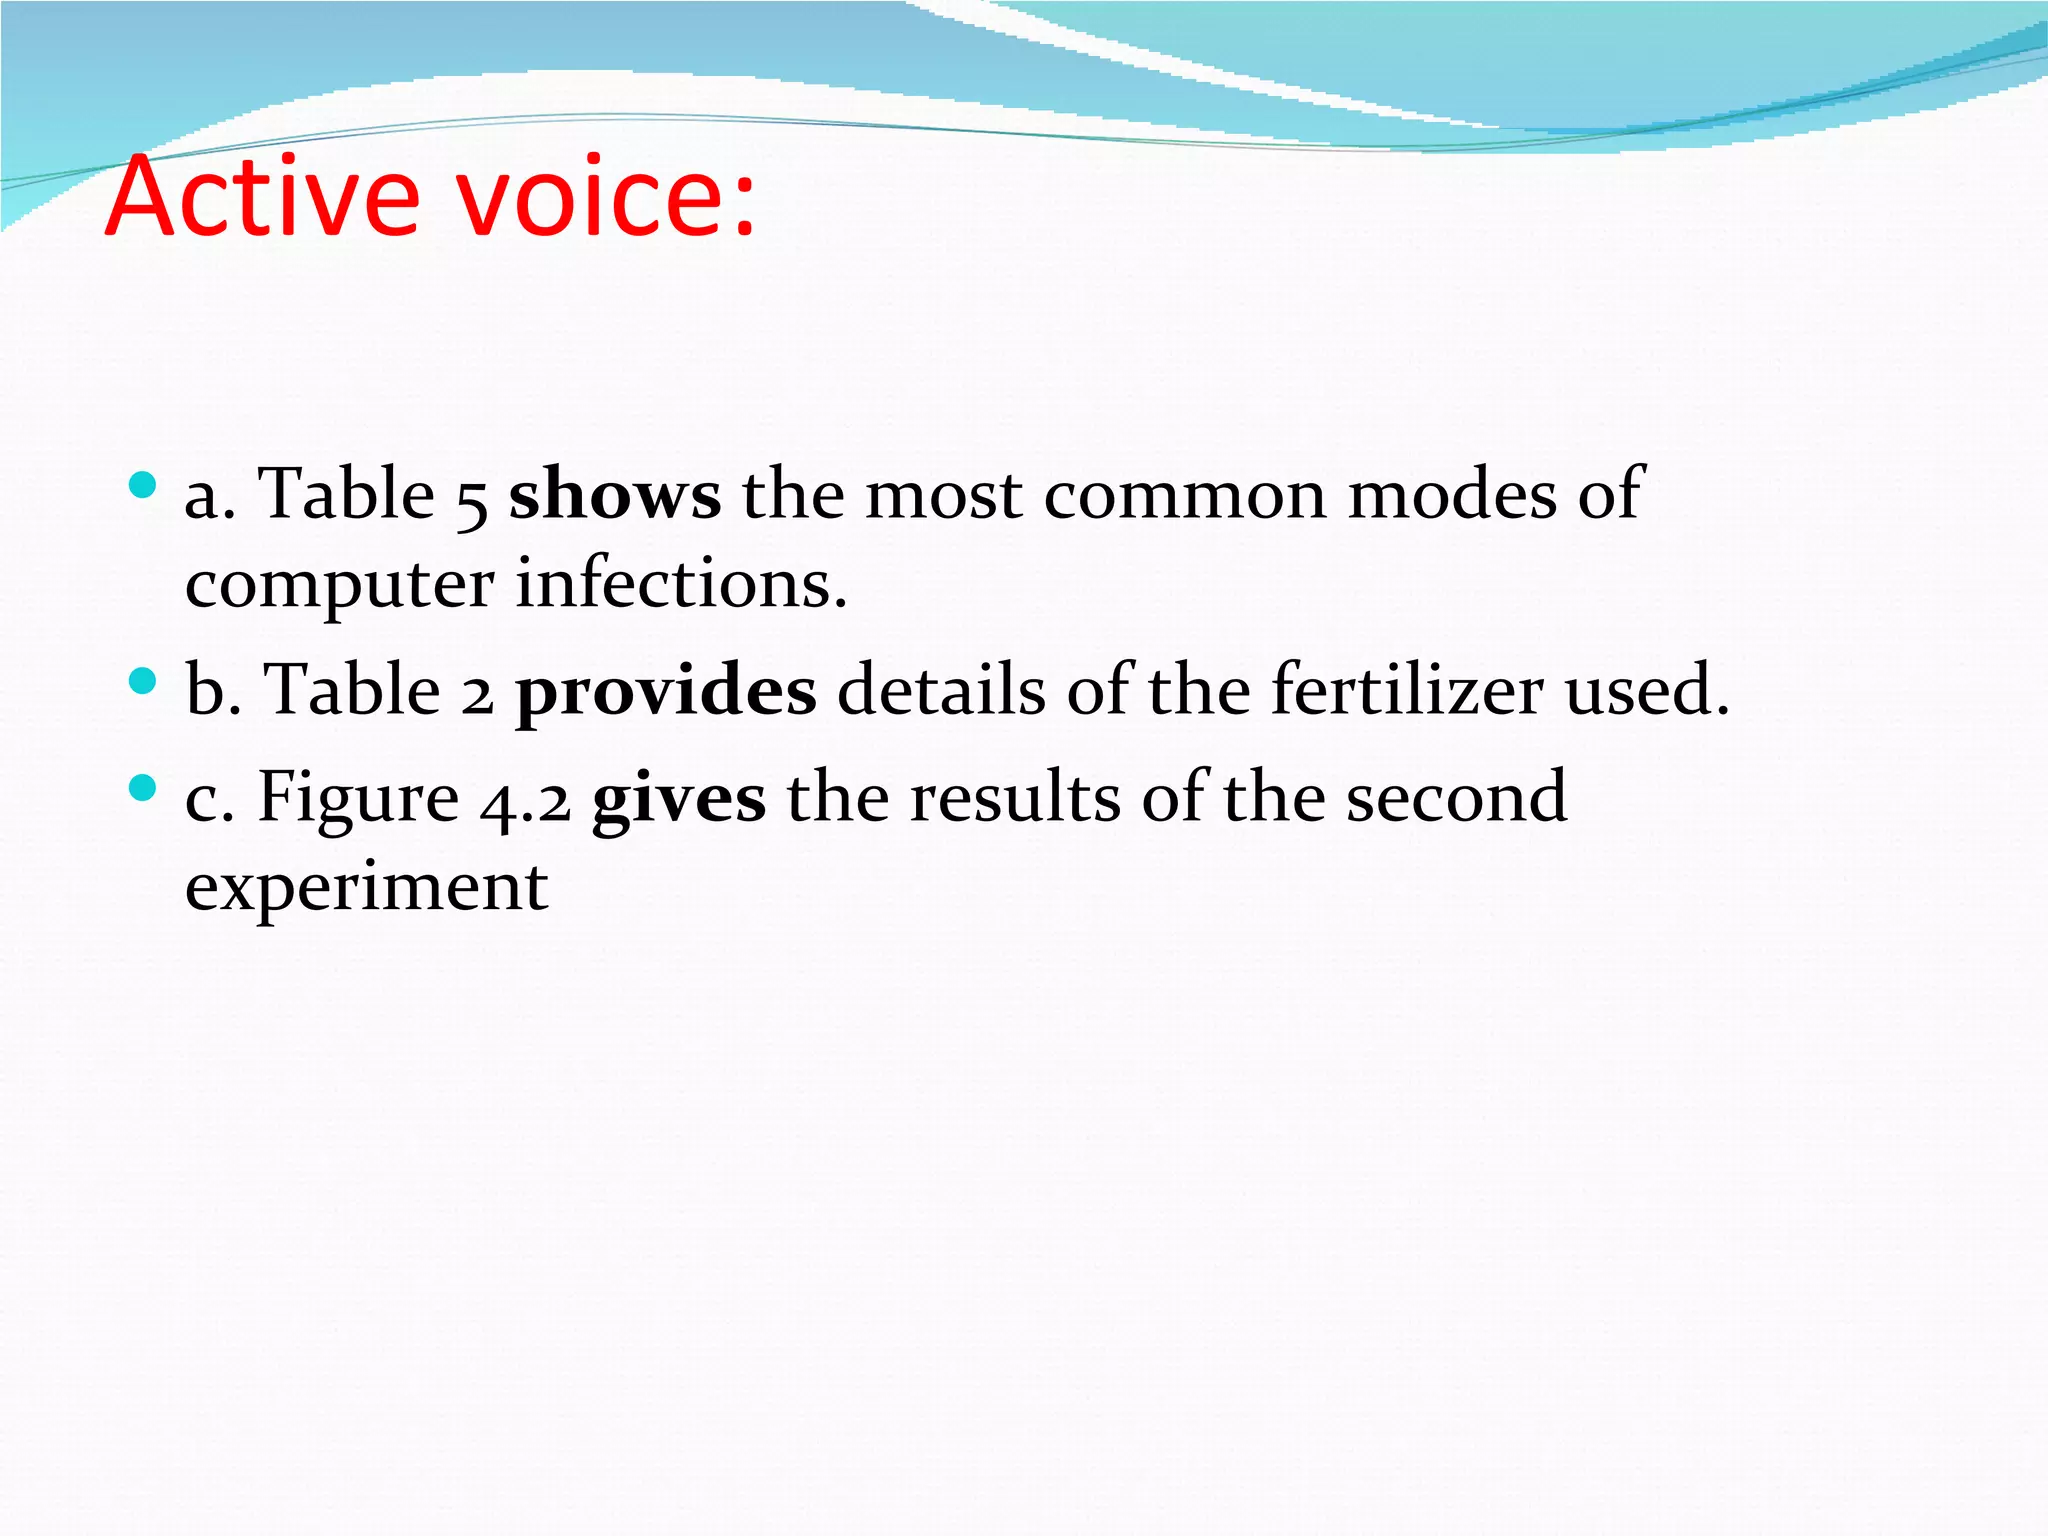
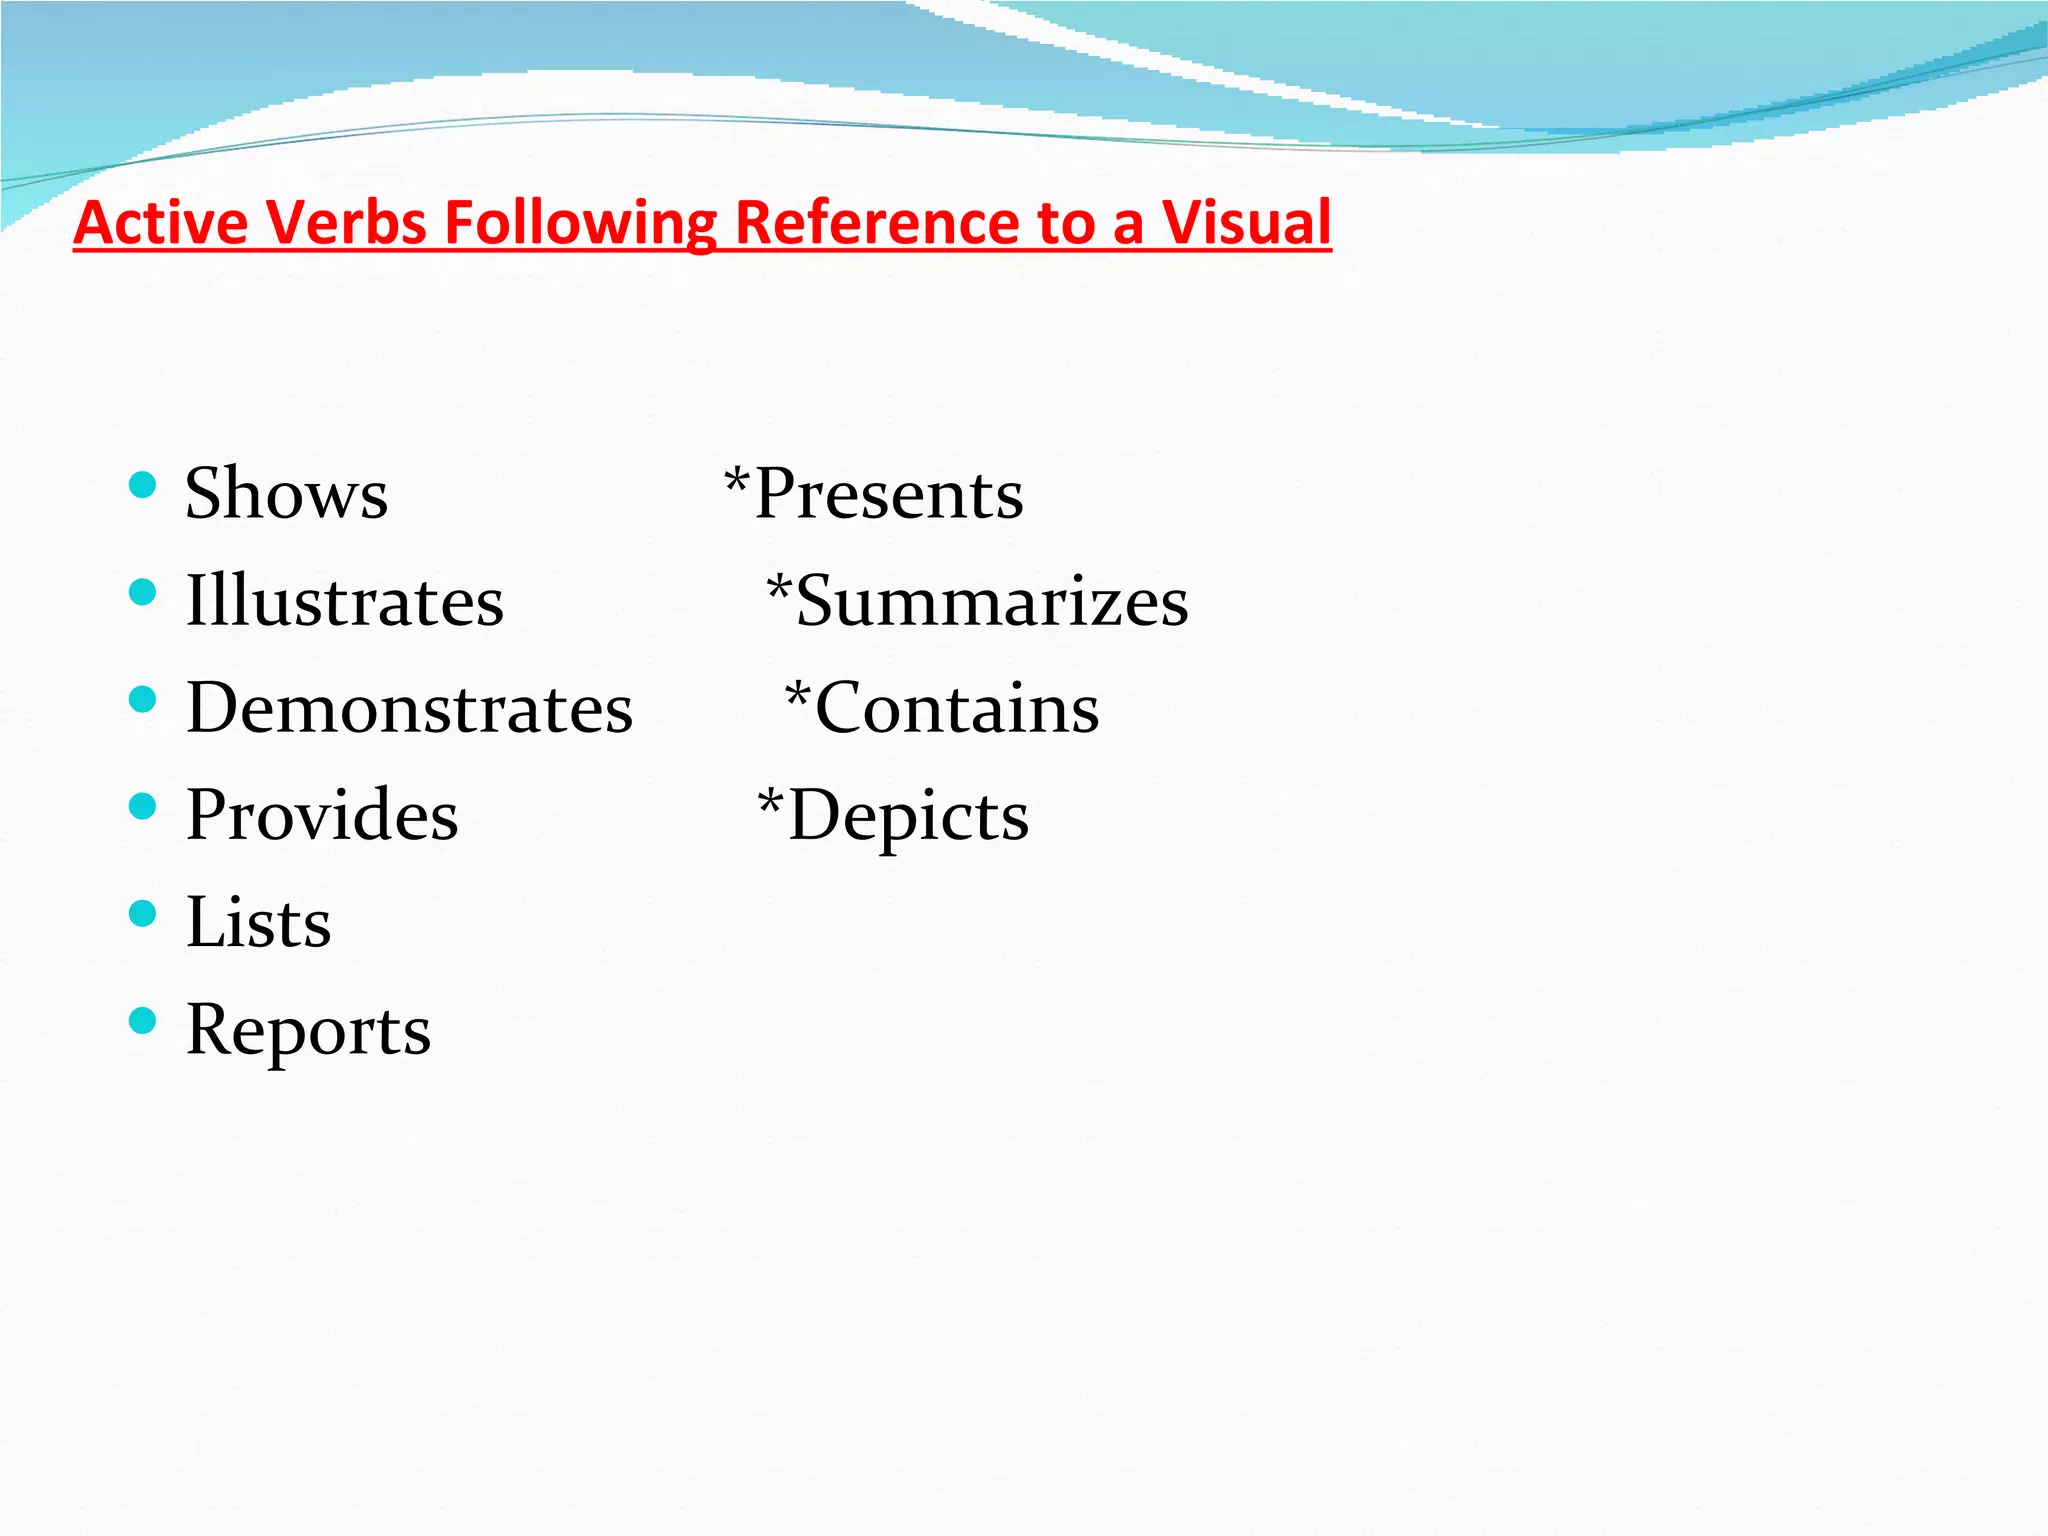
Demonstration of ways to use active voice in referencing visual data.
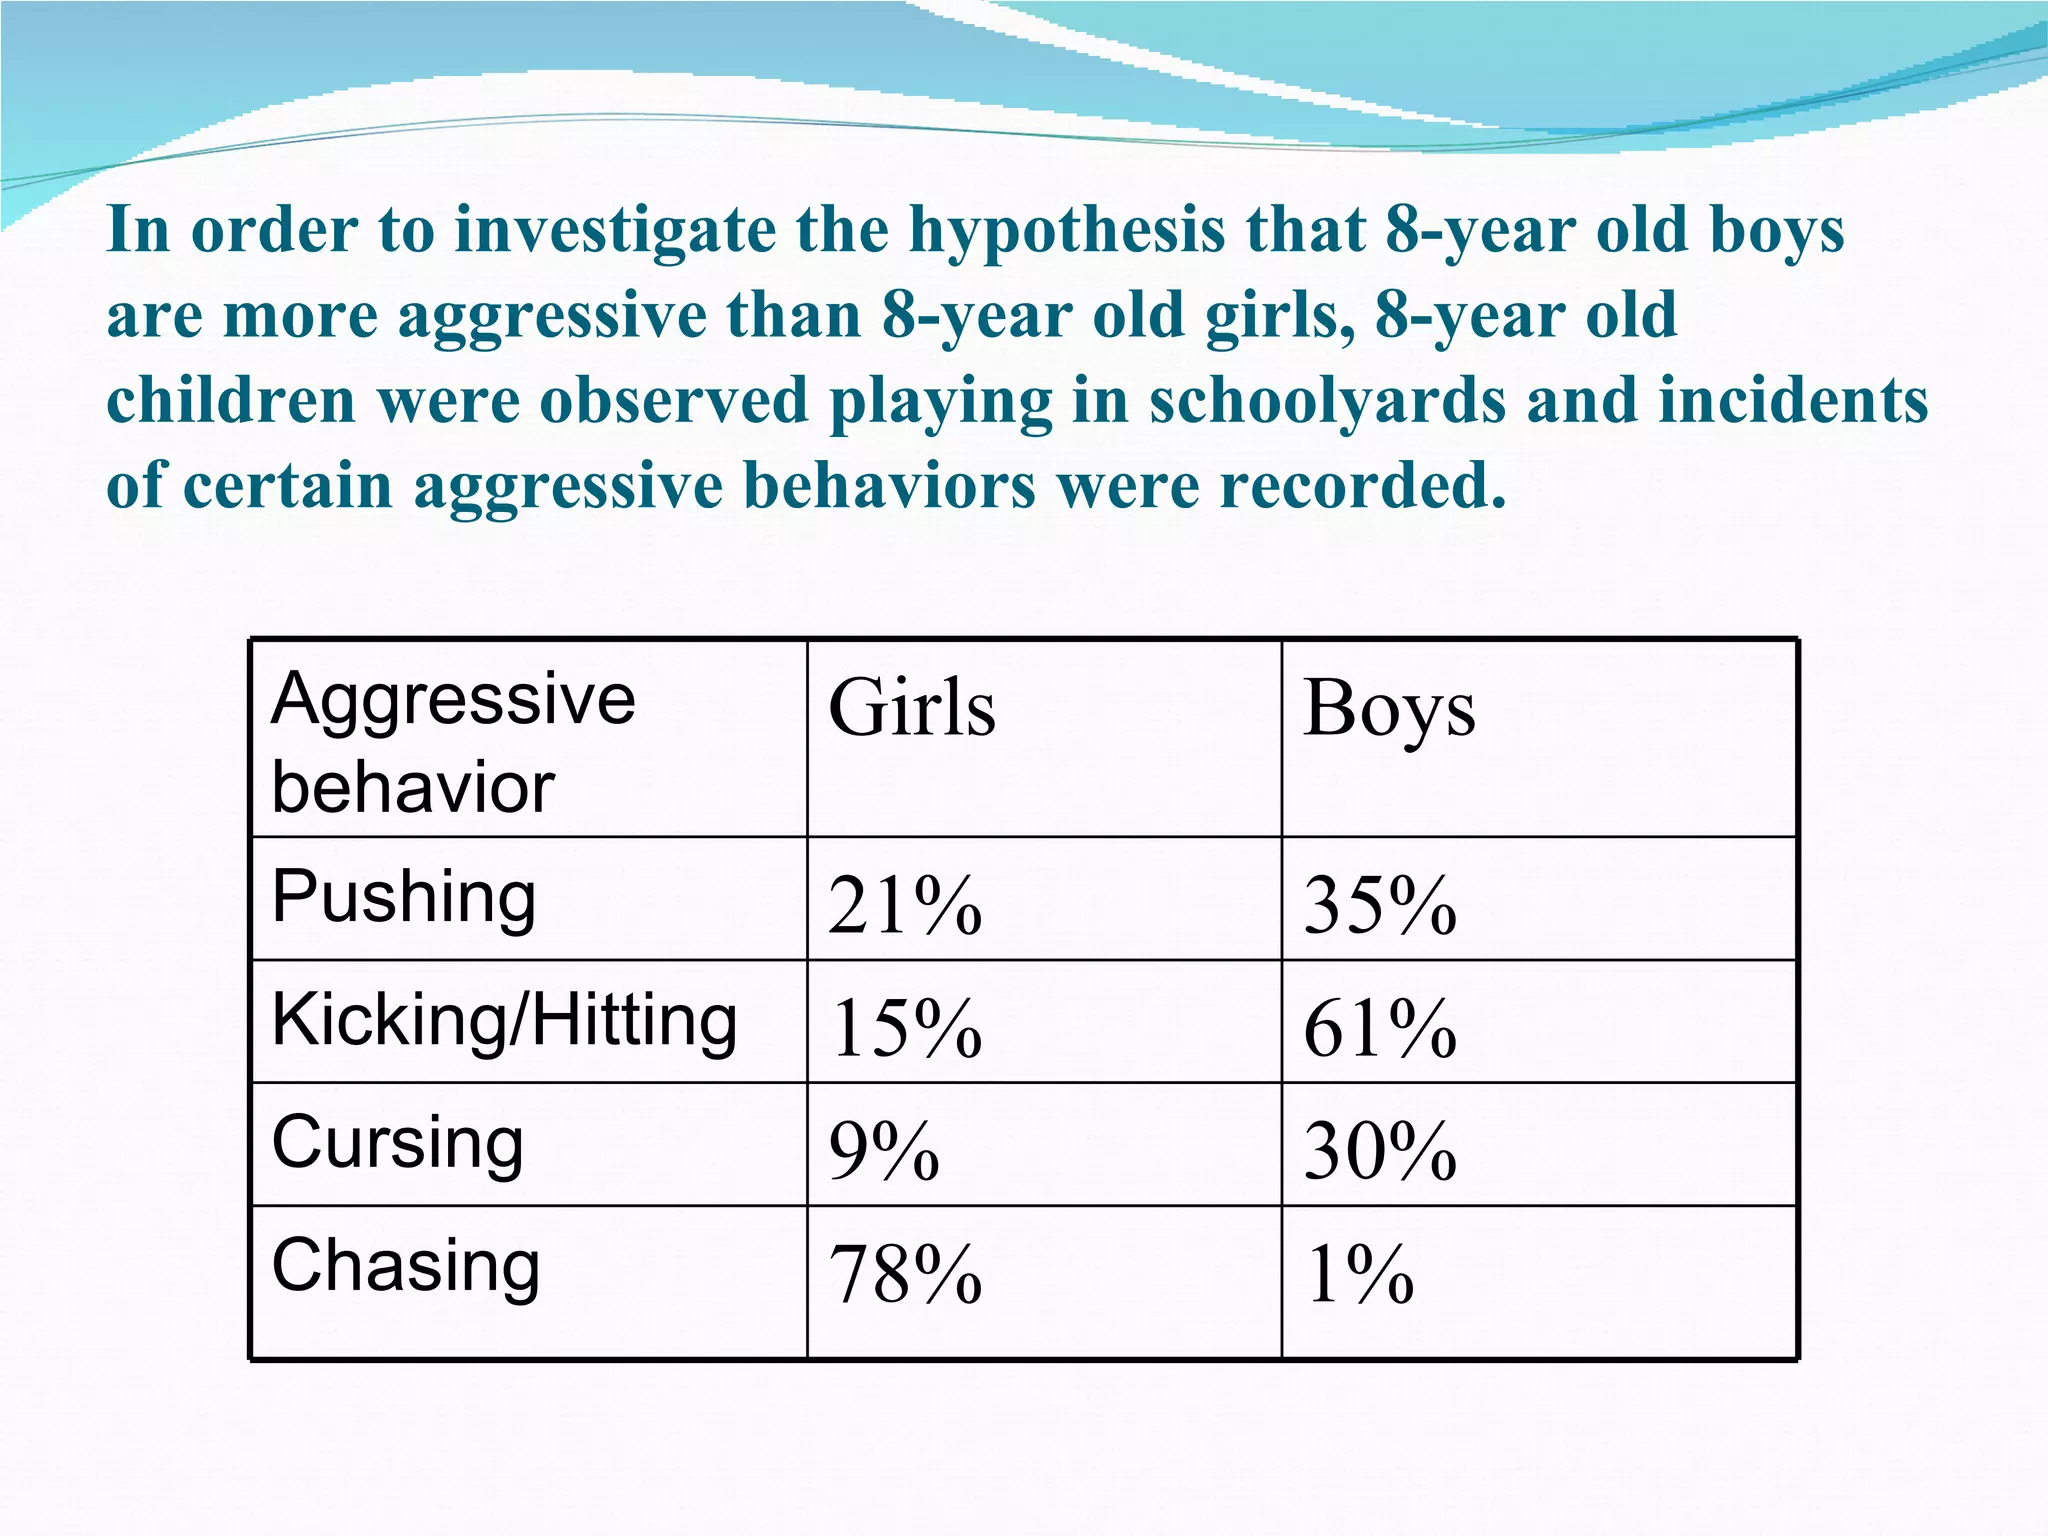
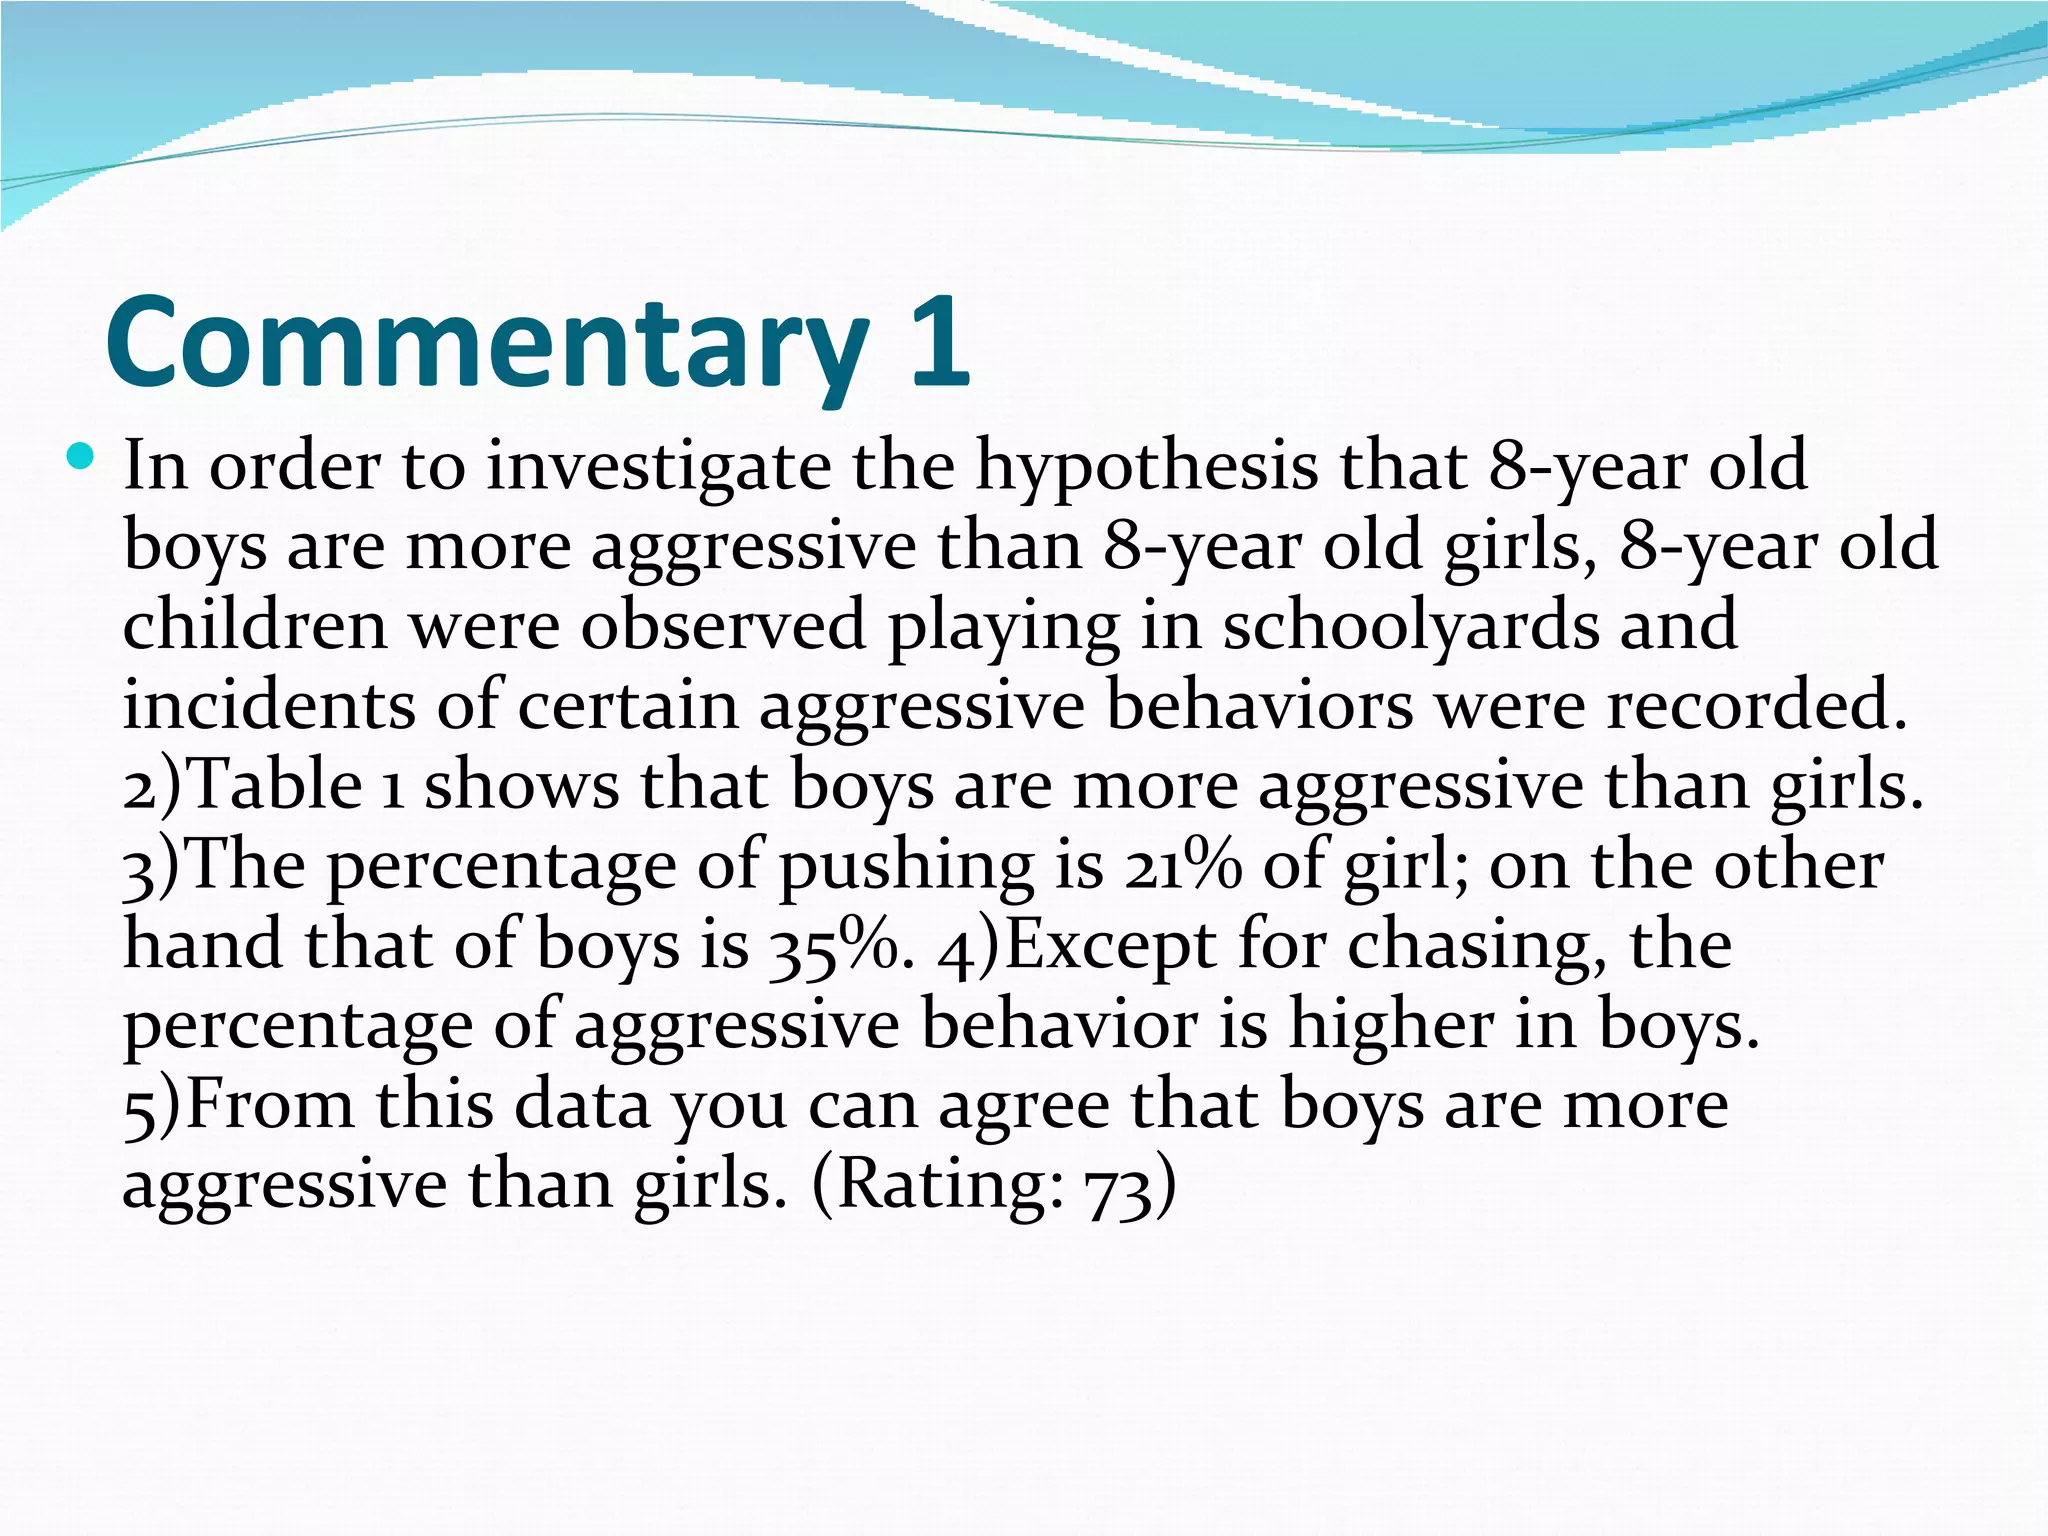
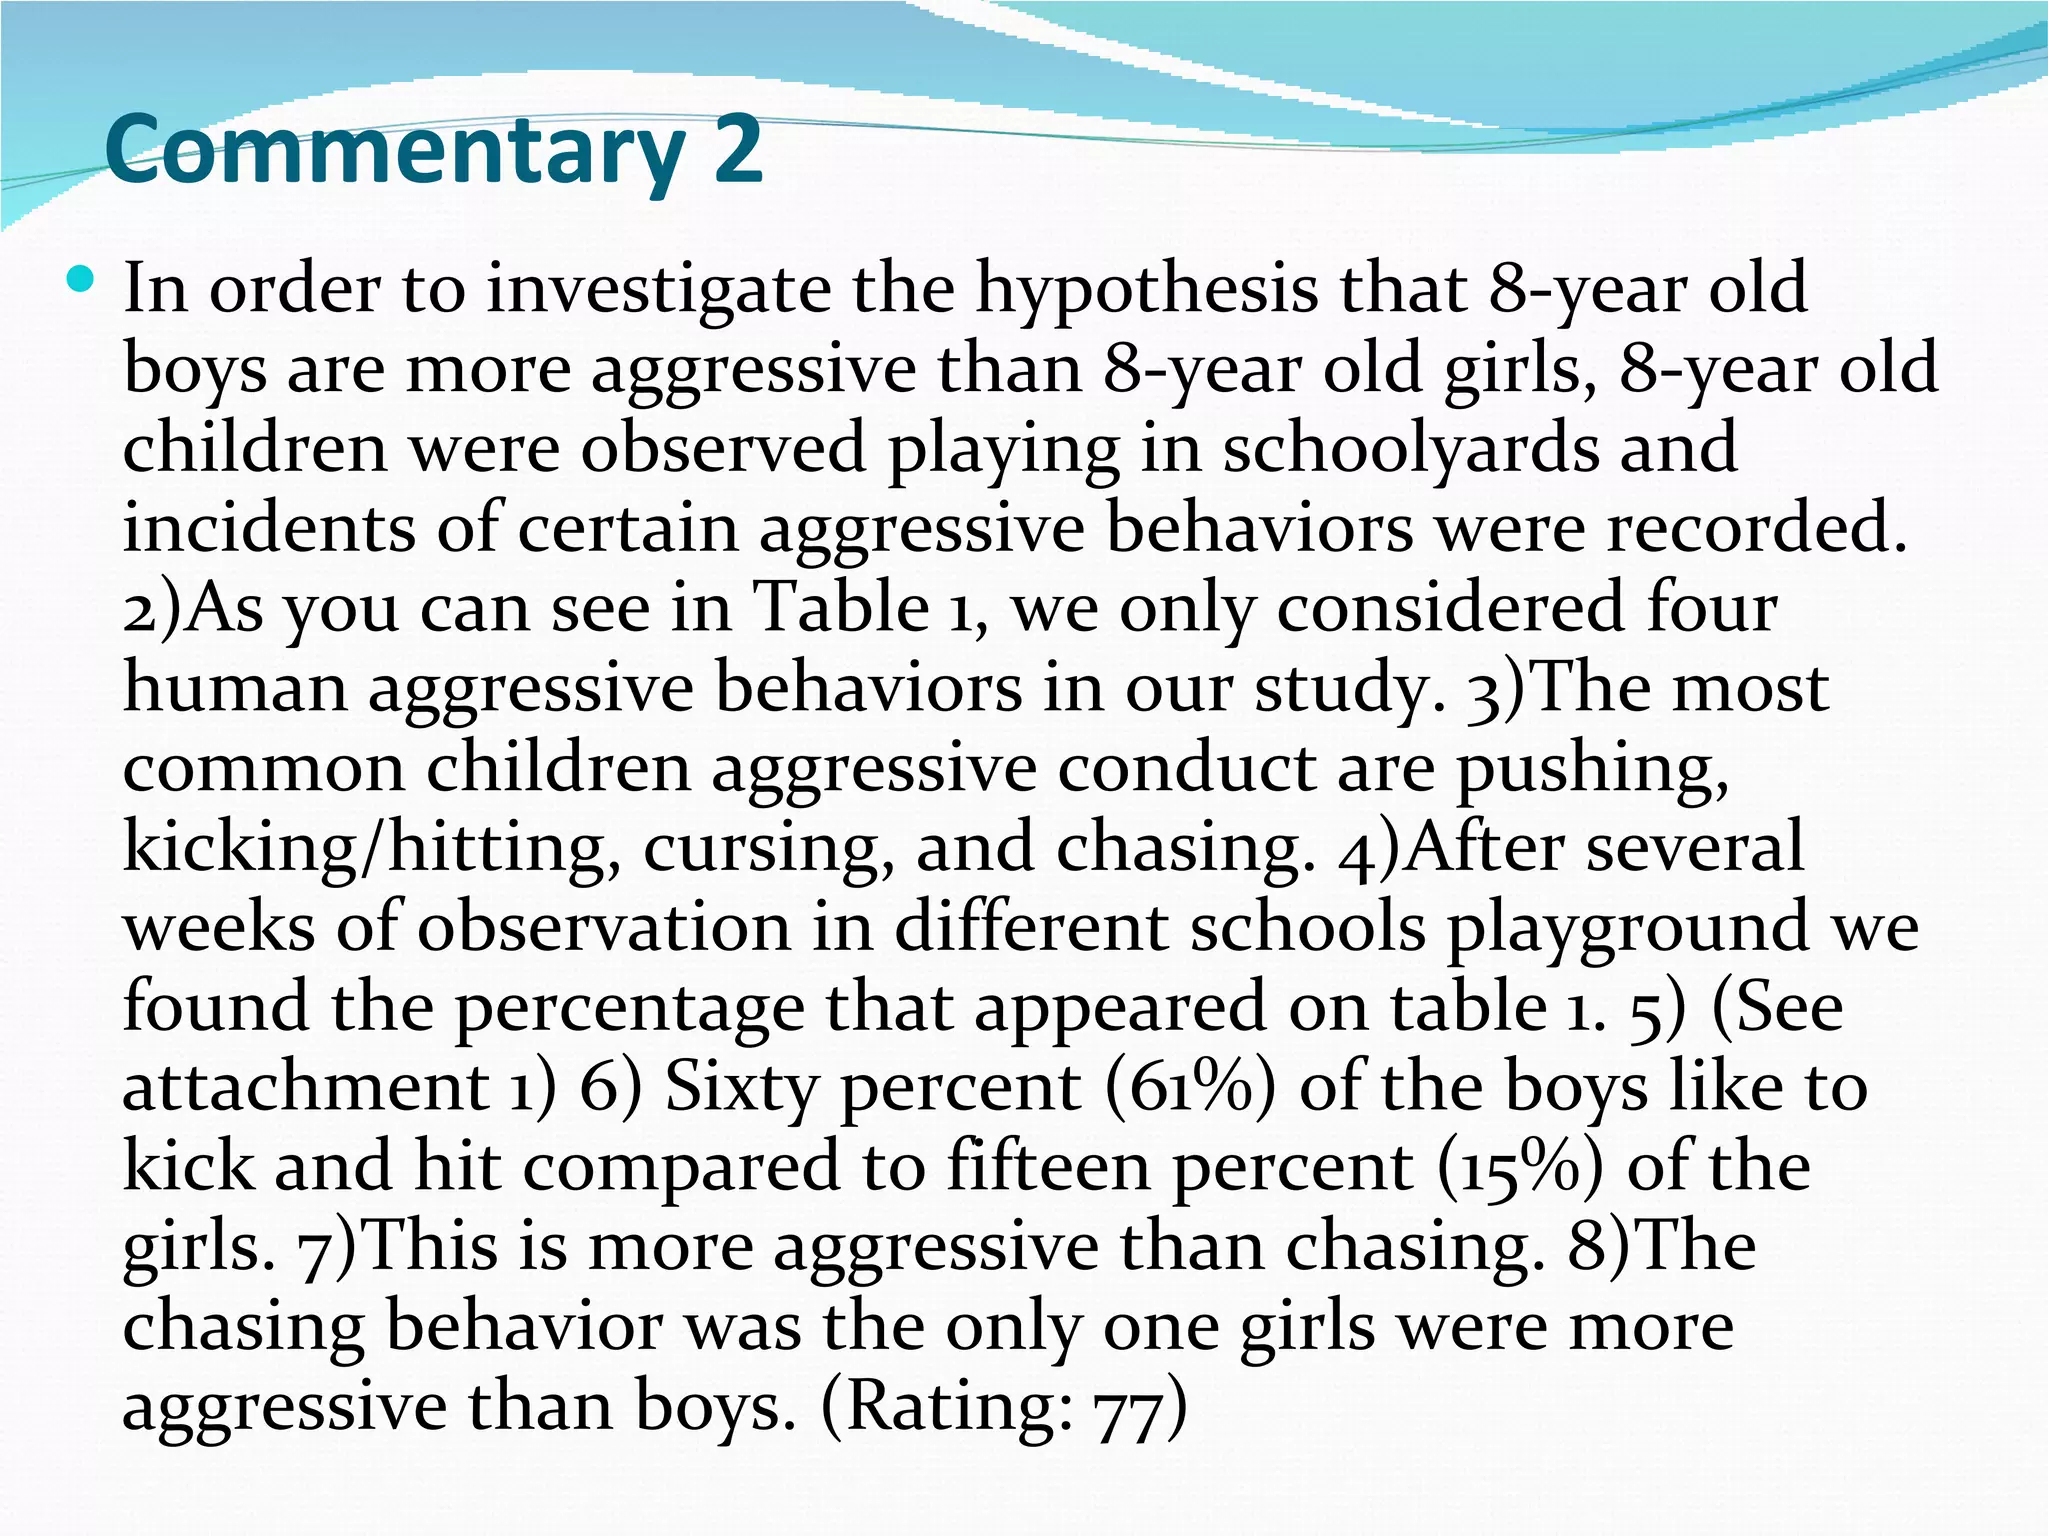
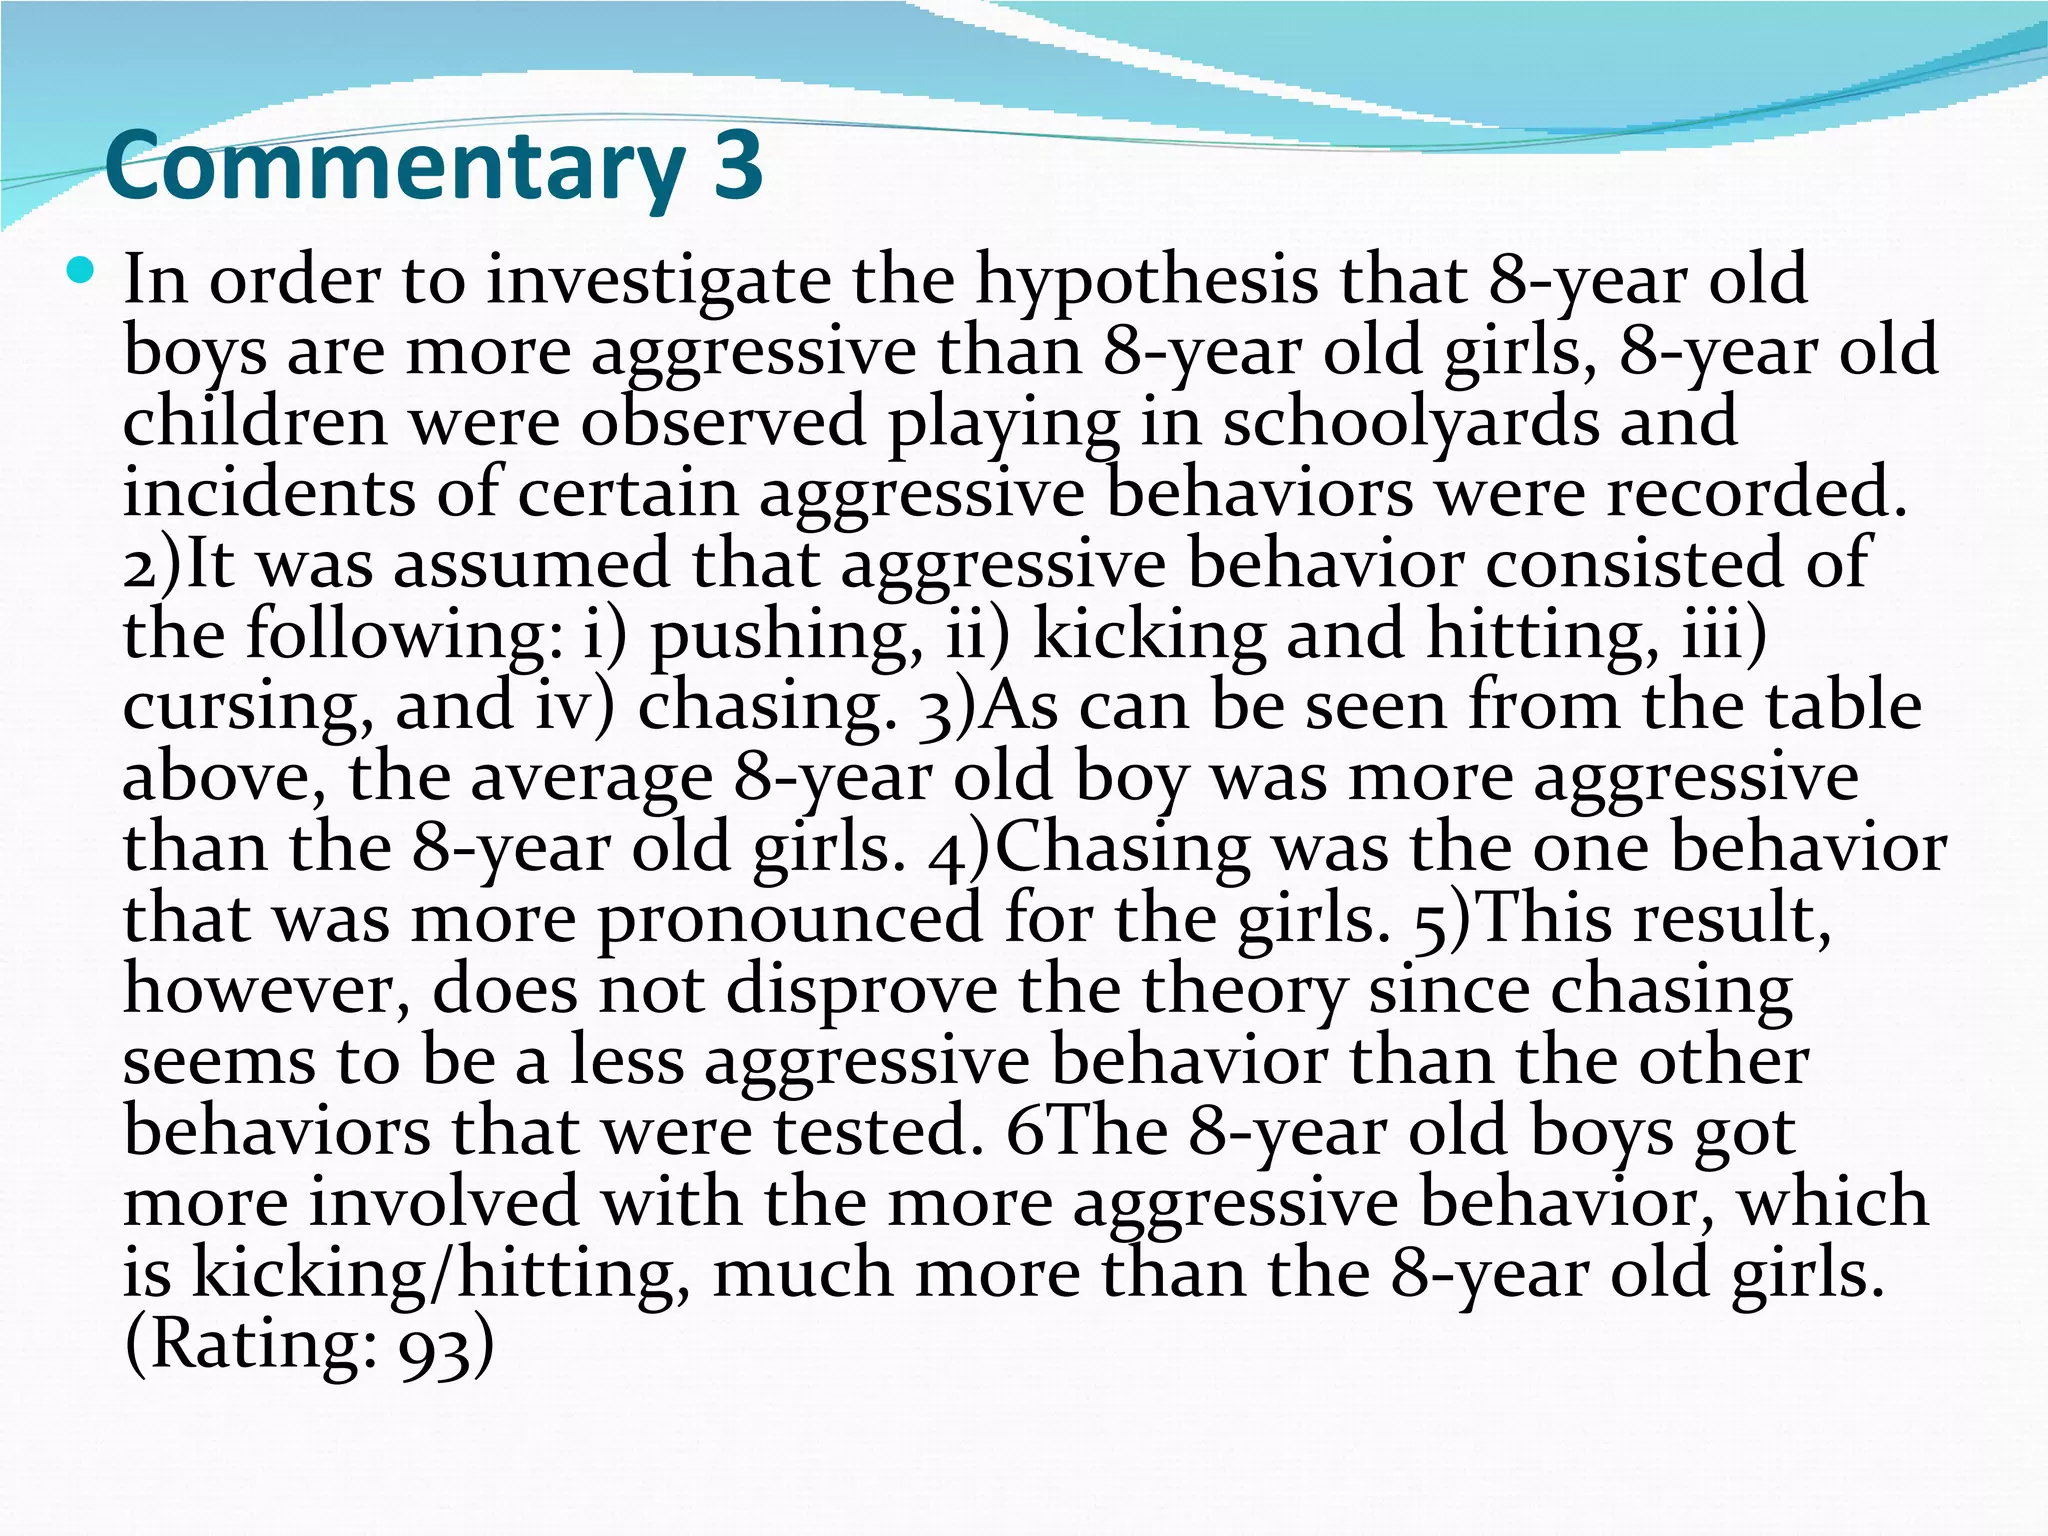
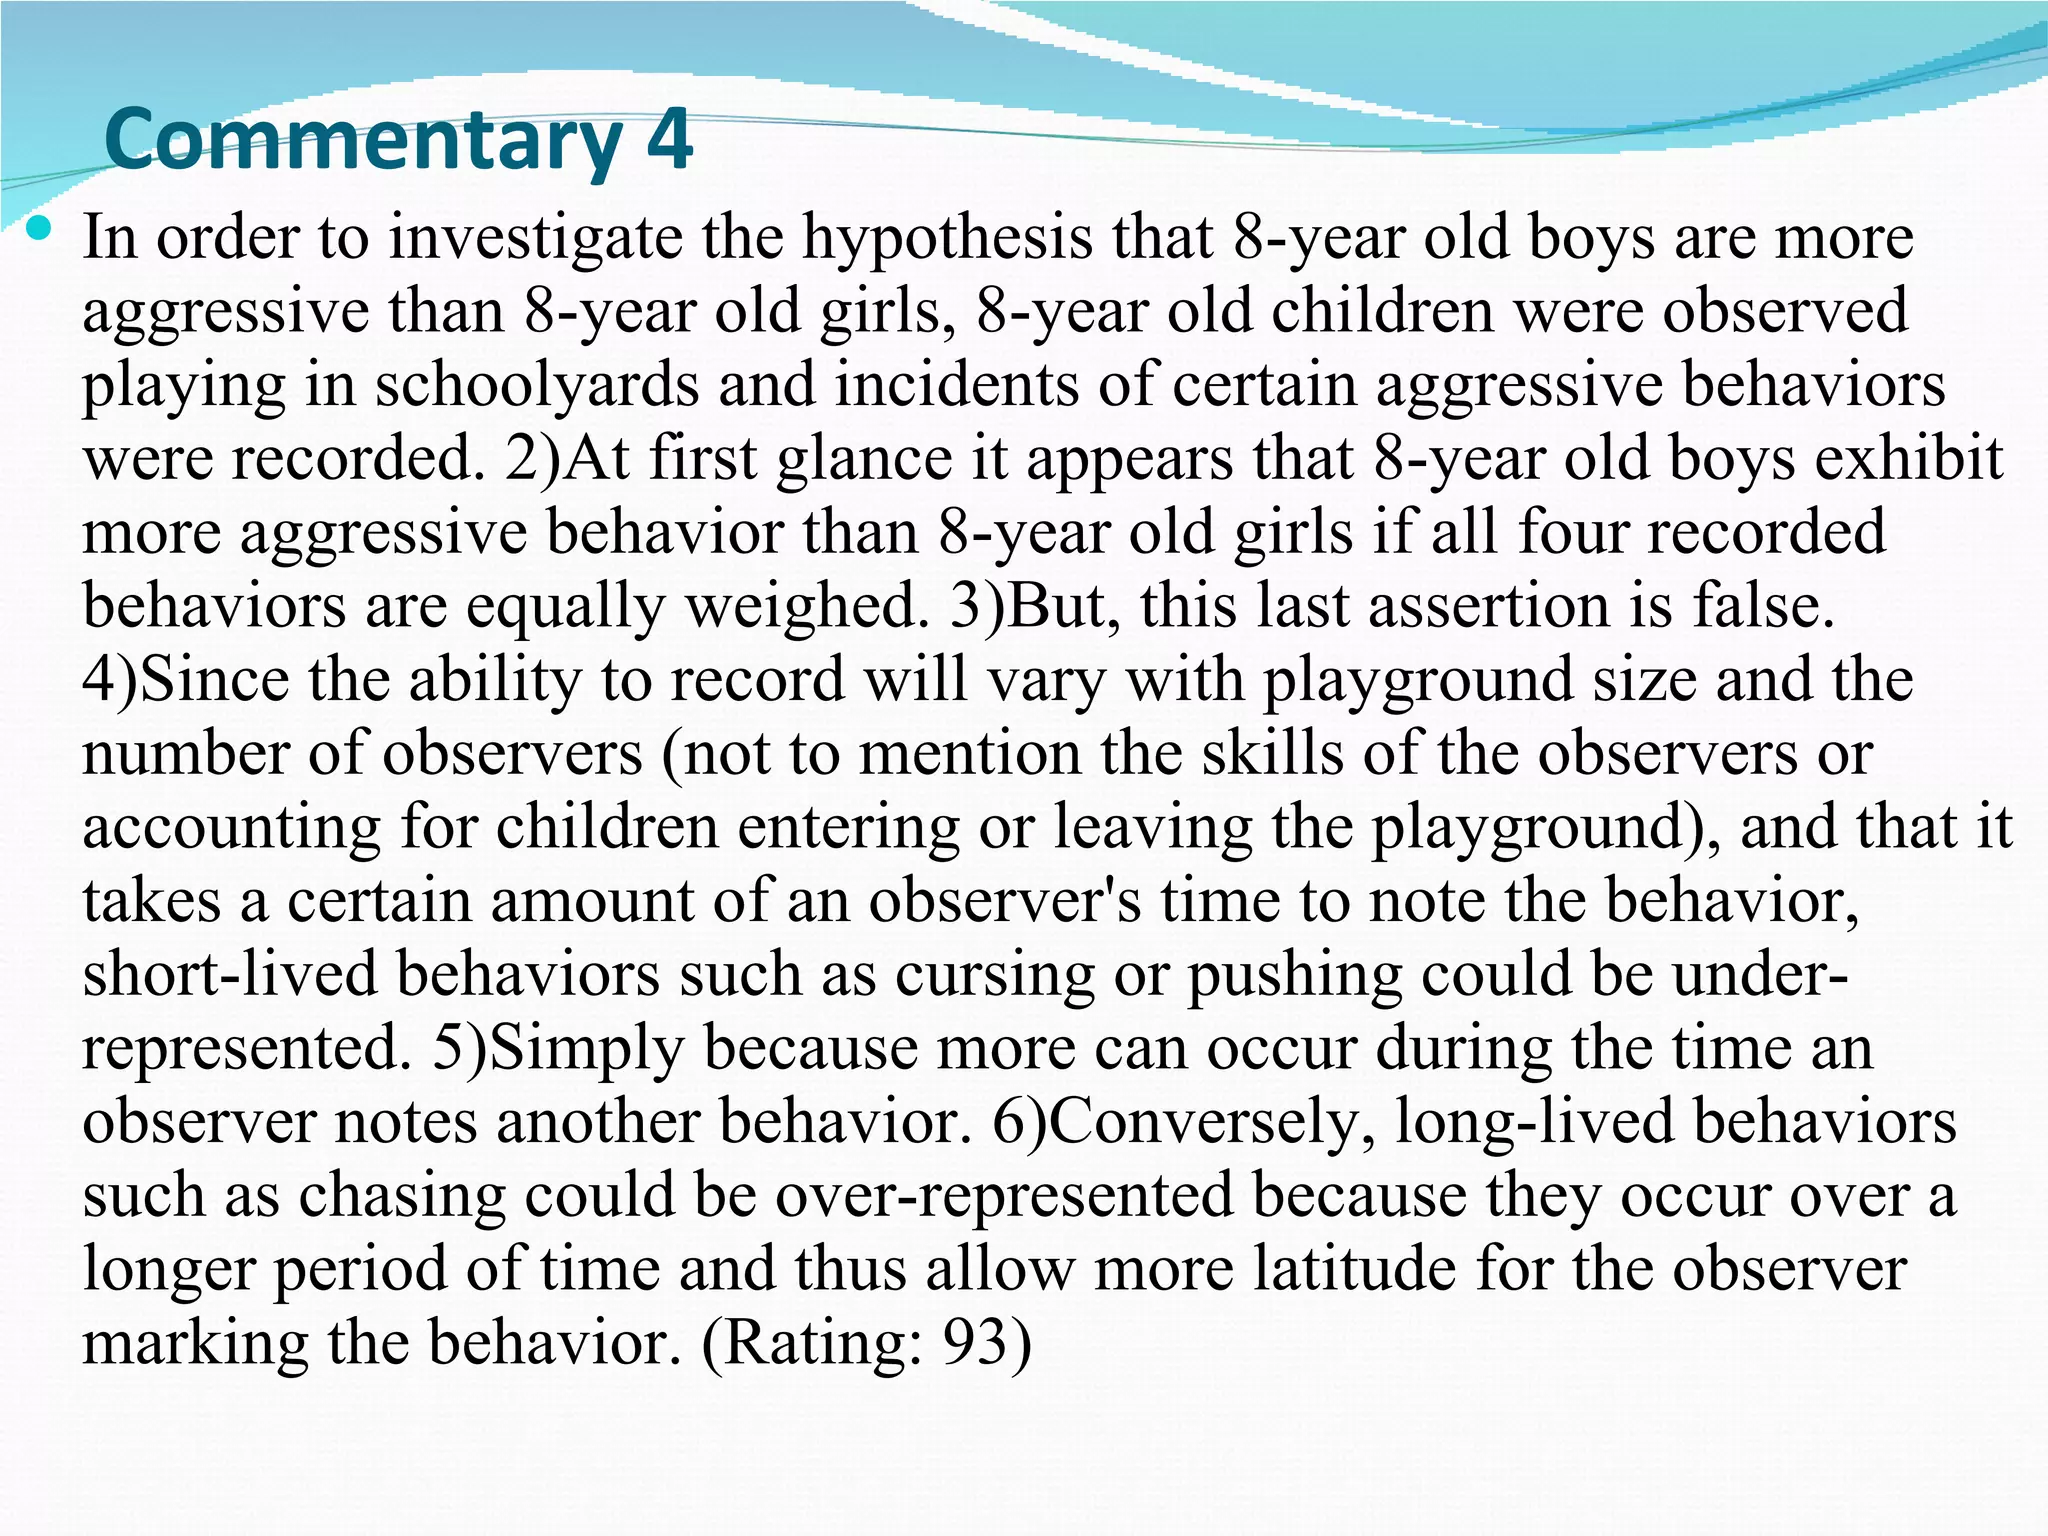
Analysis of aggressive behavior in children, presenting data and various commentaries.


