Influencing policy (training slides from Fast Track Impact)
Markov exercises
1. OPERES3
Problem Set in MARKOV ANALYSIS
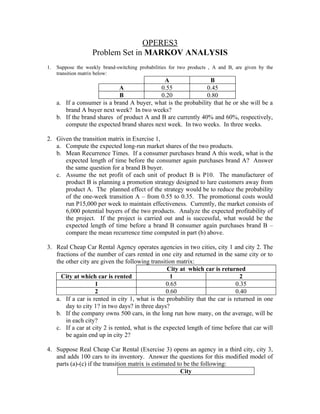
1. Suppose the weekly brand-switching probabilities for two products , A and B, are given by the
transition matrix below:
A B
A 0.55 0.45
B 0.20 0.80
a. If a consumer is a brand A buyer, what is the probability that he or she will be a
brand A buyer next week? In two weeks?
b. If the brand shares of product A and B are currently 40% and 60%, respectively,
compute the expected brand shares next week. In two weeks. In three weeks.
2. Given the transition matrix in Exercise 1,
a. Compute the expected long-run market shares of the two products.
b. Mean Recurrence Times. If a consumer purchases brand A this week, what is the
expected length of time before the consumer again purchases brand A? Answer
the same question for a brand B buyer.
c. Assume the net profit of each unit of product B is P10. The manufacturer of
product B is planning a promotion strategy designed to lure customers away from
product A. The planned effect of the strategy would be to reduce the probability
of the one-week transition A – from 0.55 to 0.35. The promotional costs would
run P15,000 per week to maintain effectiveness. Currently, the market consists of
6,000 potential buyers of the two products. Analyze the expected profitability of
the project. If the project is carried out and is successful, what would be the
expected length of time before a brand B consumer again purchases brand B –
compare the mean recurrence time computed in part (b) above.
3. Real Cheap Car Rental Agency operates agencies in two cities, city 1 and city 2. The
fractions of the number of cars rented in one city and returned in the same city or to
the other city are given the following transition matrix:
City at which car is returned
City at which car is rented 1 2
1 0.65 0.35
2 0.60 0.40
a. If a car is rented in city 1, what is the probability that the car is returned in one
day to city 1? in two days? in three days?
b. If the company owns 500 cars, in the long run how many, on the average, will be
in each city?
c. If a car at city 2 is rented, what is the expected length of time before that car will
be again end up in city 2?
4. Suppose Real Cheap Car Rental (Exercise 3) opens an agency in a third city, city 3,
and adds 100 cars to its inventory. Answer the questions for this modified model of
parts (a)-(c) if the transition matrix is estimated to be the following:
City
2. City 1 2 3
1 0.60 0.20 0.20
2 0.40 0.10 0.50
3 0.25 0.10 0.65
5. A study has revealed several patterns concerning the behavior of juvenile offenders in Crowsville. A
juvenile offender is either in the custody of a halfway house supervised by resident social workers, is
on probationary status, or is free. The results of the study can be summarized by the following
transition matrix for a typical juvenile offender (the transition time period is one month):
Halfway Probation Free
Halfway 0.60 0.40 0.0
Probation 0.30 0.40 0.30
Free 0.10 0.10 0.80
a. For a typical juvenile offender, what proportion of time can he or she expect to
spend in the halfway house?
b. For a juvenile offender in the halfway house this month, what is the mean number
of months before the juvenile returns to the halfway house?
c. If there are approximately 900 juveniles on record as having engaged in criminal
activities, what is the expected number of juveniles in each of the three
categories?
6. Suppose a gambling device is rigged so that a player who wins on a given trial will
win on the next trials with a probability of 0.4 and will lose with a probability of 0.6.
If the player losses on a given trial he or she will win or lose on the next trial with
probabilities of 0.7 and 0.3, respectively.
a. Design a Markov chain model for this process; specify the transition matrix.
b. If a player wins on a given trial, what is the probability that the player will win on
each of the next two trials? (Three wins in a row)
c. In the long run, what proportion of the time will the player win? What
proportion of the time will he lose? Is this a fair game?
d. If the player wins on a given trial, how many games on the average will he or she
play before winning again?
e. If the player receives P1 for each trial on which he or she wins, and pays 50
centavos for each loss, what is the player’s expected gain (or loss) per trial?
7. A pottery maker specializes in the manufacture of intricately designed handcrafted
flower pots and has hired three apprentices to work in his shop to manufacture the
pots. Each pot is considered to be in one of four categories during any given day:
finished (and ready for shipment); damaged beyond rework capability; in the process
of manufacture; or being reworked (to correct defects which occur during the in-
process stage). The transition matrix describing the status of a typical flower pot is
given in the table below. Transition time period is one day.
Finished Damaged In process Rework
Finished 1 0 0 0
Damaged 0 1 0 0
3. In process 0.4 0.25 0.2 0.15
Rework 0.5 0.3 0 0.2
a. If a flower pot is in process, what is the probability that it will eventually be
finished? What is the probability that it will be damaged beyond repair?
b. Answer the same question for a flower pot that is in rework.
c. If there are currently 10 flower pots in process and 3 flower pots in rework, and if
each finished flower pot yields a P75 profit and each damaged pot results in a P20
loss, what is the expected net profit on the current work?
8. A machine can be in one of two states, “in adjustment” or “out of adjustment”. If it is
in adjustment, the machine earns revenue at the rate of P200 per day. If the machine
is out of adjustment at the start of a day, it is repaired at a cost of P100, which then
places it in adjustment. The repair time requires a full day, during which no revenue
is earned. The transition matrix is given below.
In adjustment Out of adjustment
In adjustment 0.7 0.3
Out of adjustment 1 0
a. What fraction of time in the long run can the machine be expected to be in
adjustment? What fraction of time is it out of adjustment?
b. Compute the expected long-run daily revenue earned by the machine.
9. (refer to #8) Clipco, Inc., a manufacturer of paper clips and other fasteners, must
select one of two machines to employ in its operations. The revenue, operating
characteristics, and repair costs for the first machine is given in #8, while the data for
the second machine is given below. Which machine should Clipco purchase?
In adjustment Out of adjustment
In adjustment 0.75 0.25
Out of adjustment 1 0
for Machine 2: daily revenue (in adjustment) is P225; repair cost (when out of
adjustment) is P90
10. The Over-the-Road Trucking Company periodically inspects the bearings on its
trucks and categorizes them in one of four states: (1) new bearings, (2) lightly worn
bearings, (3) moderately worn bearings, and (4) worn-out bearings. If the company
replaces a set of bearings during inspection, it costs P50. If, however, a truck in
service develops bad bearings, the company estimates the cost to be P250. On the
basis of past experience, it has been found that a set of bearings which is new at a
given inspection has a 0.90 probability of being in state 2 and a 0.1 probability of
being in state 3 by the next inspection. A set of bearings classified as state 2 has a
0.60 probability of remaining in state 2, a 0.30 probability of going to state 3, and
0.10 probability of wearing out by the next inspection date. A set of bearings
classified as state 3 has a 0.70 probability of remaining in state 3 and a 0.30
probability of wearing out by the next inspection. The company has decided to either
(1) replace all bearings in state 2 or worse at each inspection or (2) replace all
bearings in state 3 or worse at each inspection. Which policy will result in lower
cost?
4. 11. Pedal Power, Inc., sell bicycles in competition with two other shops in a university community.
Reports from the local chamber of commerce indicate that Pedal Power has about 25 percent of the
local market, while its competitors - the Bicycle Shop and Wheels, Unlimited, have about 40 percent
and 35 percent, respectively. Pedal Power had a profit last year of 6 percent of its sales in a total
market of approximately P1 million sales. An MBA class in marketing at the local university offered
Pedal Power its advice as a part of a project. The class feels that P1,500 invested in more well-directed
advertising by Pedal Power would create this matrix of transition probabilities:
Pedal Power Bicycle Shop Wheels
Pedal Power 0.8 0.15 0.05
Bicycle Shop 0.15 0.8 0.05
Wheels 0.05 0.05 0.9
If Pedal Power wants to get a 20% return on the P1,500 within a year, should it take
the students’ advice?
12. A large university has been studying the aggregate flow of faculty to three ranks of
assistant professor, associate professor, and full professor. Currently 50% of the
faculty are assistant professor, 30% are associate professors, and 20% are full
professors. Only when full professors die, retire, or resign are new assistant professor
hired. The accompanying transition probability matrix reflects the proportion of
annual movement among three academic ranks. (The transition from full professor to
assistant professor represents the replacement of a full professor by an assistant
professor.)
FromTo Asst. Prof. Asso. Prof. Full Prof.
Asst. Prof. 0.90 0.10 0
Asso. Prof. 0 0.80 0.20
Full Prof. 0.05 0 0.95
a. Calculate the expected proportion in each of the three ranks two years from now.
b. The current average annual salaries for the three ranks are P50,000, P72,000, and
P100,000, respectively. The average salary for each rank is anticipated to
increase at the rate of 5 percent each year (compounded), what will be the
expected salary per faculty member two years from now?
c. What fraction of the increase in average salary two years from now can be
attributed to the change in the proportion in each faculty rank?
d. Determine the steady-state proportion in each faculty rank.
e. What is the expected number of years until an associate professor is promoted to
full professor?
13. John Byer, director of product planning for P&C Chemical Corporation felt
somewhat satisfied as he scanned the latest marketing research results of last year’s
big gamble. The argument, as he recalled the meeting of the Executive Committee,
centered around the question of competing with one’s own product. P&C’s original
entry, known inside the company by the code “Brand A,” in the already well-
established household detergents market had been well accepted by the market until
two years ago when a competitor moved in with a flashy promotional campaign and
began luring P&C’s customers away. John’s suggestions to the Executive Committee
5. was to bring out an improved detergent (Brand B) with a countering advertising
campaign stressing the quality of the new brand based on P&C’s experience in the
area with the successful Brand A.
But the executive vice president , Bill Harmon, was deeply worried that Brand B
might compete more the P&C’c own Brand A than the competitor’s brand. Other
members of the committee pointed out that these would probably be customers P&C
would have lost due to the competition anyway, but this did not seem to appease Bill.
Finally, John pointed out how common it was in the detergent market for companies
to offer multiple brands, in stark contrast to their chemicals market. He argued that
detergents being in the consumer market, were totally unlike industrial chemicals.
The Executive Committee finally decided to go along with John’s idea, but they were
not completely convinced. Thus, the first year’s report took on special importance for
John. At the time of the introduction of Brand B a year ago P&C held 40 percent of
the market and the competitor had 60 percent. The 12-month report summary now
indicated that Brand A’s share has dropped somewhat to 27.5 percent but that the
competitor’s share had almost been halved, now standing at 35 percent, the losses in
each case going to the new Brand B, currently holding 37.5 percent of the market.
The detailed report showed month-to-month “brand loyalty” (brand switching)
figures from the date of introduction of Brand B until this last month. Initially the
rate of shifting between brands changed every month, but it has now settled down to
the general situation illustrated in Figure 1. Customers were still being drawn from
Brand A to the competitor (Brand C), to the extent of 60 percent of them each month
(the remainder divided evenly at 20 percent each between switching to B and staying
with A). However, half of the competitor’s market (Brand C) would return to A in
any particular month, with another 20 percent switching from C to B, resulting in the
competition maintaining only 30 percent of their customers. Of particular interest
was the response to Brand B, with half of B’ purchases remaining loyal to B and only
40 percent switching to C.
6. Current Month Following Month
0.2
Brand A Brand A
0.2
0.6
0.1
0.5
Brand B 0.4 Brand B
0.5
0.2
Brand C Brand C
0.3
John felt that these figures substantiated his words from a year earlier and saved P&C
from failing in this market venture. Although John realized that the competition
might upset this delicate balance at any moment with a new product introduction or a
new marketing campaign, he wondered how the market shares would shift in the
coming months, given the brand switching results above. In particular, he wondered
what the ultimate market shares would be if conditions ever settled down.
a. Set up the matrix of transition probabilities.
b. Find the market shares of the three brands after two months.
c. P&C is considering two alternative policies for promoting its product.
Policy 1: Promote Brand A only
This will cost P150,000 invested in a lump sum and is expected to change the
transition matrix to:
FromTo A B C
A 0.60 0.20 0.20
B 0.40 0.40 0.20
C 0.60 0.10 0.30
Policy 2: Promote Brand B only
This will cost P280,000 (lump sum, one shot) and is expected to change the
transition matrix to:
FromTo A B C
A 0.10 0.50 0.40
B 0.20 0.80 0.0
C 0.30 0.50 0.20
1. Which policy will bring larger increase in P&C’s total share of the market in the
long run?
2. Which policy is more efficient )gain per peso invested) in the long run?
3. Assume that each percentage of increased share in the total market is worth
P10,000 to P&C, which policy (if any) should P&C take?
4. What is the break-even point for each of the two possible policies? That is, at
what peso value of worth, for each percentage gain, will the policies start to be
profitable, disregarding interest rates?
7. 14. Northeast Electrical is a company specializing in appliances. Many of Northeast’s
sales are on the installment basis; as a result, much of the firm’s working capital is
tied up in accounts receivable. Although most of the firm’s customers make their
payments on time, a certain percentage of the accounts are always overdue and some
few customers never pay, thereby becoming bad debts. Northeast Electrical’s
experience is that when a customer is two or more payments behind, the account will
generally turn into a bad debt. In these cases, Northeast discontinues credit to the
customer and writes the account off as bad debt. At the beginning of each month, the
accounts receivable manager reviews each account and classifies it as paid, current
(being paid on time), overdue (one payment behind), or bad debt. The accounts
receivables manager has provided this transition matrix from the last month’s data
and this month’s data:
State of a peso this month
State of a peso last month Paid Current Overdue Bad Debt
Paid 1.0 0.0 0.0 0.0
Current 0.40 0.30 0.30 0.0
Overdue 0.50 0.20 0.20 0.10
Bad Debt 0.0 0 0 1.0
If Northeast now has P20,000 in the current category and P14,000 in the overdue
classification, how much will eventually be paid and how much should it plan to
write off as bad debts? What is the average number of months it will take before a
current amount is paid?
15. A machine in Reliable Machine Shop is in one of two possible states during the week.
(1) it is in working order all through the week and (2) it is broken sometimes during
the week. In the absence of preventive maintenance at the beginning of the week, the
probability of the machine’s breaking down during the week is 0.40. With preventive
maintenance work at the beginning of the week the probability of breakdown during
the week is reduced to 0.20. If the machine breaks down during the week, it may be
simply repaired or overhauled. If it is repaired, the probability of breakdown during
the next week is 0.50. But if it is overhauled, the probability of a breakdown during
the following week is 0.10. The machine shop nets P2,000 during a week if the
machine works all week. However, the average profit during a week that the
machine breaks down is only P1,000. Preventive maintenance takes about half a day.
The lost revenue during this duration is P200. An additional P100 must be expended
for the labor and materials required for maintenance. The labor and material cost of
repairing a broken down machine is P400 and that of overhauling a broken-down
machine is P800.
Determine the optimal policy for Reliable Machine Shop. Use Markov Analysis to
support your answer.
8. Three service stations share a local market in which customers make a weekly purchase.
In week 1, stations A and B each had 40% of the market, while station C had 20% of the
market. A market research firm has discovered the following weekly changes in
purchasing habits: A retains 60% of its customers and loses 20% to B and 20% to C. B
retains 50% of its customers and loses 20% to A and 30% to C. C retains 70% of its
customers and loses 20% to B and 10% to A.
a) Construct the transition matrices for week 1 and week 2.
b) Find the market share of each station at the end of week 3.
c) What is the equilibrium market share of each station?
d) Find the probability that a customer of A will become a customer of C for the
first time after three weeks.
e) How long, on the average, will it take for a customer of B to become a
customer of A?
Three service stations share a local market in which customers make a weekly purchase.
In week 1, stations A and B each had 40% of the market, while station C had 20% of the
market. A market research firm has discovered the following weekly changes in
purchasing habits: A retains 60% of its customers and loses 20% to B and 20% to C. B
retains 50% of its customers and loses 20% to A and 30% to C. C retains 70% of its
customers and loses 20% to B and 10% to A.
a) Construct the transition matrices for week 1 and week 2.
b) Find the market share of each station at the end of week 3.
c) What is the equilibrium market share of each station?
d) Find the probability that a customer of A will become a customer of C for the first
time after three weeks.
e) How long, on the average, will it take for a customer of B to become a customer
of A?