Downloaded 13 times
![A data-‐driven approach
Core
of
FairTest
is
based
on
staQsQcal
machine
learning
FairTest
Find
context-‐specific
associaQons
StaQsQcally
validate
associaQons
Sta4s4cal
machine
learning
internals:
• top-‐down
spaQal
parQQoning
algorithm
• confidence
intervals
for
assoc.
metrics
• …
Training
data
Test
data
Ideally
sampled
from
relevant
user
populaQon
This is a confidential draft. Please do not redistribute. 7 CONCLUSION
Report of associations of O=Labels on Si=Race:
Global Population of size 1,324
* Labels associated with Race=Black:
Label Black White DIFF p-value
Cart 4% 0% [0.0137,0.0652] 3.31e-05
Drum 4% 0% [0.0095,0.0604] 3.83e-04
Helmet 8% 3% [0.0096,0.0888] 2.34e-03
Cattle 2% 0% [0.0037,0.0432] 4.73e-03
* Labels associated with Race=White:
Label Black White DIFF p-value
Face Powder 1% 10% [-0.1339,-0.0525] 5.60e-12
Maillot 4% 15% [-0.1590,-0.0575] 3.46e-10
Person 96% 99% [-0.0563,-0.0042] 6.06e-03
Lipstick 1% 4% [-0.0622,-0.0034] 1.03e-02
Fig. 9: Racial Label Associations in the Image Tagger. Shows par-
tial report of a Discovery (top k=35); the four most strongly associated
labels (for the binary difference metric DIFF) are shown for each race.
Fig.9 shows part of FairTest’s report. It lists the labels
most disparately applied to images of black people (first
table) and white people (second table); we show only
4 (of 35) labels per race. A developer could inspect
all top k labels and judge which ones deserve further
scrutiny. In Fig.9, the ‘cattle’ label might draw attention
due to its potentially negative connotation; upon inspec-
tion, we find that none of the tagged images depict farm
animals. Moreover, black people receive the ‘person’
tag less often, thus the model seems less accurate at de-
tecting them. Further work is needed to understand these
Report of associations of O=Income on Si=Race:
Global Population of size 24,421
p-value = 1.39e-53 ; NMI = [0.0063, 0.0139]
Income Asian Black ... White Total
<=50K 556(73%) 2061(88%) 15647(75%) 18640 (76%)
>50K 206(27%) 287(12%) 5238(25%) 5781 (24%)
Total 762 (3%) 2348(10%) ... 20885(86%) 24421(100%)
1. Subpopulation of size 341
Context = Age <= 42, Hours <= 55, Job: Fed-gov
p-value = 3.24e-03 ; NMI = [0.0085, 0.1310]
Income Asian Black ... White Total
<=50K 10(71%) 62(91%) 153(63%) 239 (70%)
>50K 4(29%) 6 (9%) 91(37%) 102 (30%)
Total 14 (4%) 68(20%) ... 244(72%) 341(100%)
2. Subpopulation of size 14,477
Context = Age <= 42, Hours <= 55
p-value = 7.50e-31 ; NMI = [0.0070, 0.0187]
Income Asian Black ... White Total
<=50K 362(79%) 1408(93%) 10113(83%) 12157 (84%)
>50K 97(21%) 101 (7%) 2098(17%) 2320 (16%)
Total 459 (3%) 1509(10%) ... 12211(84%) 14477(100%)
Report of associations of O=Income on Si=Gender:
Global Population of size 24,421
p-value = 1.44e-178 ; NMI = [0.0381, 0.0540]
Income Female Male Total
<=50K 7218(89%) 11422(70%) 18640 (76%)
>50K 876(11%) 4905(30%) 5781 (24%)
Total 8094(33%) 16327(67%) 24421(100%)
1. Subpopulation of size 1,371
Context = 9 <= Education <= 11, Age >= 47
p-value = 2.23e-35 ; NMI = [0.0529, 0.1442]
Income Female Male Total
<=50K 423(88%) 497(56%) 920 (67%)
Data
6](https://image.slidesharecdn.com/wcui1y7jthc8cddjivfj-signature-7a356bac0e268d89802a4a730cb95727ff3879b820b221358633f4432cf3778b-poli-160523193313/75/Florian-Tramer-Researcher-EPFL-at-MLconf-SEA-5-20-16-6-2048.jpg)
![Debugging with FairTest
Are
there
confounding
factors?
Do
associaQons
disappear
aher
condiQoning?
⇒
AdapQve
Data
Analysis!
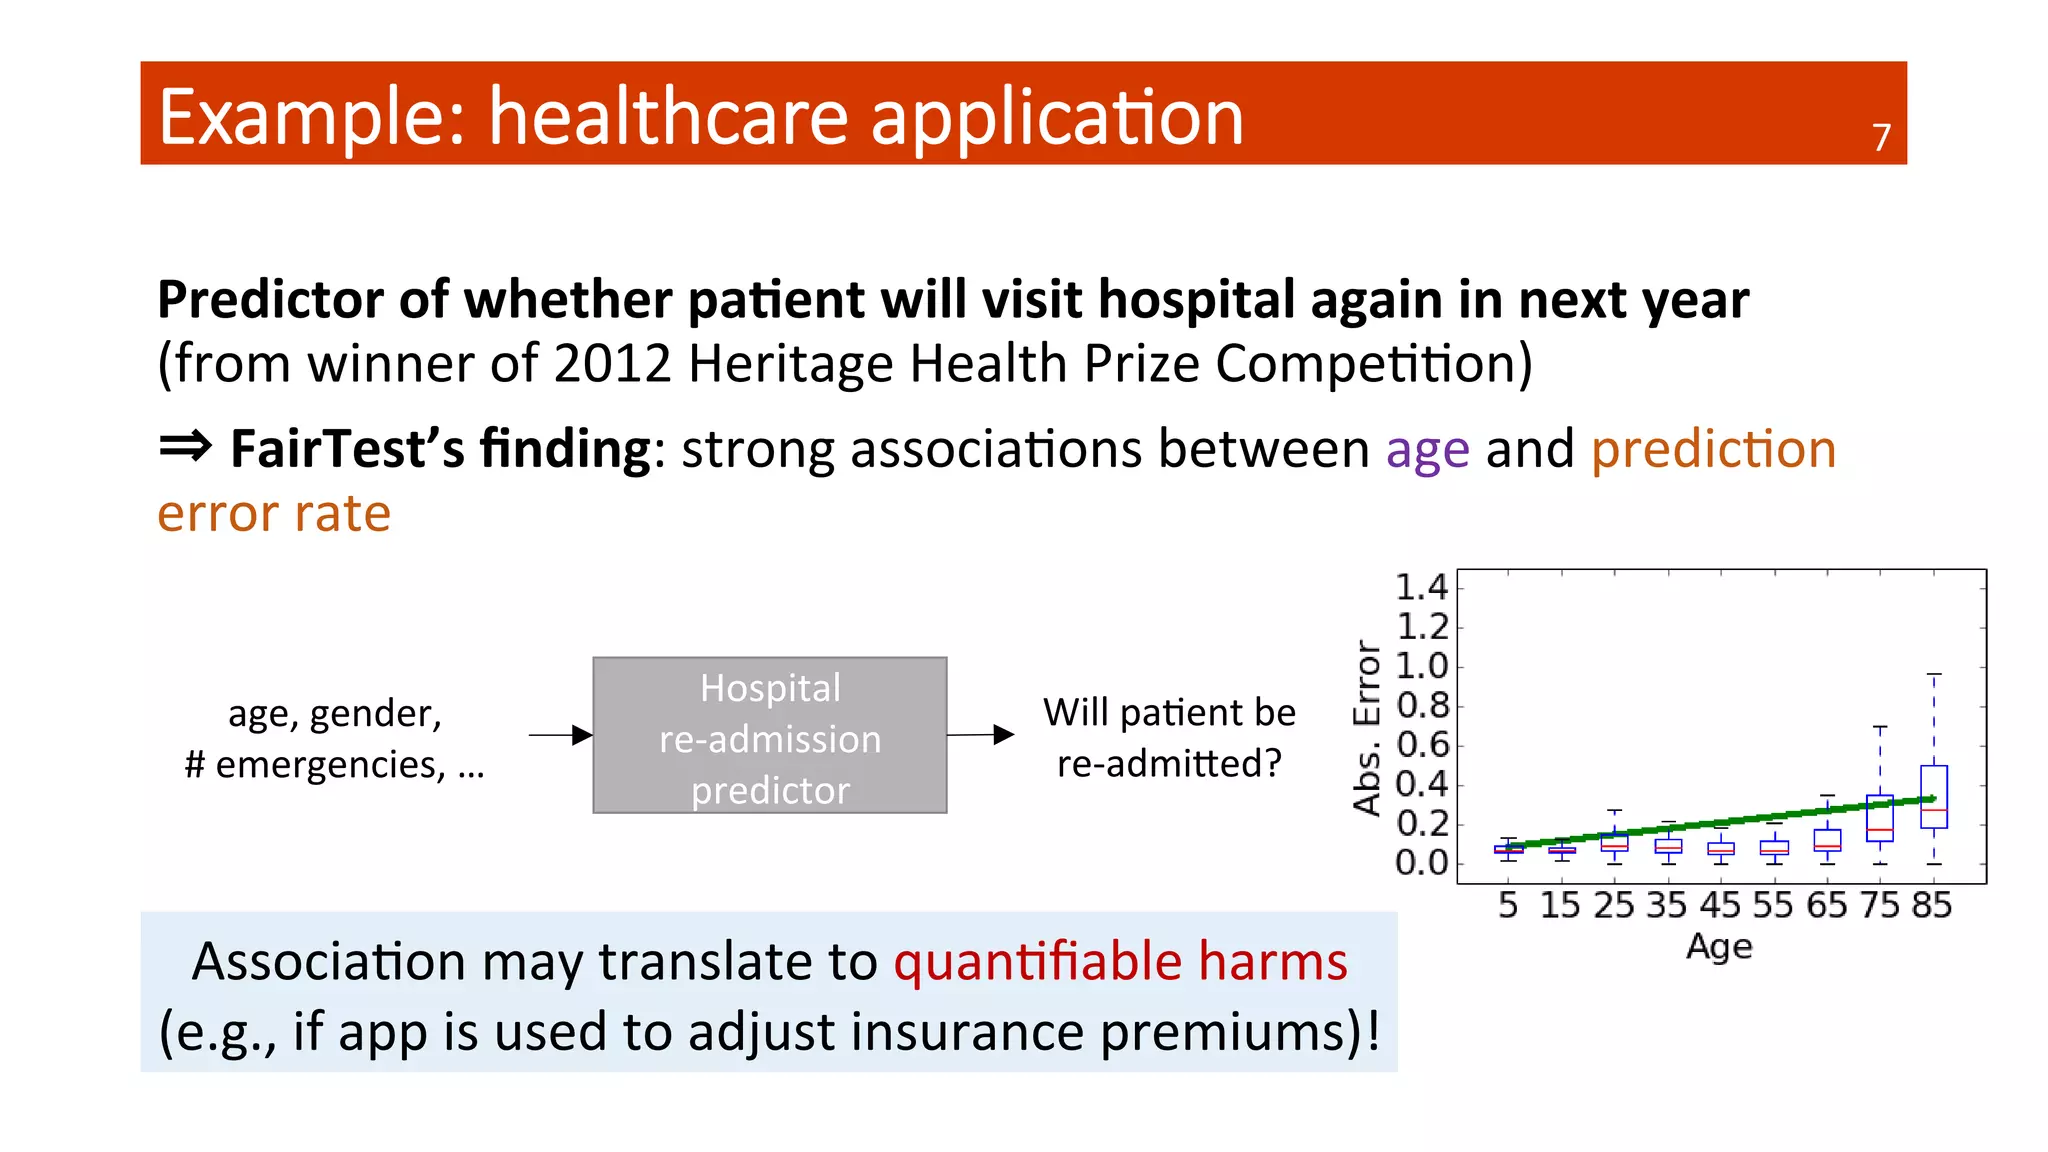
Example:
the
healthcare
applicaQon
(again)
• EsQmate
predicQon
target
variance
• Does
this
explain
the
predictor’s
behavior?
• Yes,
parQally
FairTest
helps
developers
understand
&
evaluate
potenQal
associaQon
bugs.
of size 6,252
Care Treatments >= 1
141 ; CORR = [0.2724, 0.3492]
e for Health Predictions. Shows the global
population with highest effect size (correlation).
correlation between age and prediction error,
1 + number of visits). For each age-decade, we
ots (box from the 1st to 3rd quantile with a line
skers at 1.5 interquantile-ranges). The straight
* Low Confidence: Population of size 14,48
p-value = 2.27e-128 ; CORR = [0.1722, 0.
* High Confidence: Population of size 14,4
p-value = 2.44e-13 ; CORR = [0.0377, 0.0
Fig. 8: Error Profile for Health Predictions usin
confidence as an explanatory attribute. Shows correla
prediction error and user age, broken down by prediction
High
confidence
in
predic#on
8](https://image.slidesharecdn.com/wcui1y7jthc8cddjivfj-signature-7a356bac0e268d89802a4a730cb95727ff3879b820b221358633f4432cf3778b-poli-160523193313/75/Florian-Tramer-Researcher-EPFL-at-MLconf-SEA-5-20-16-8-2048.jpg)

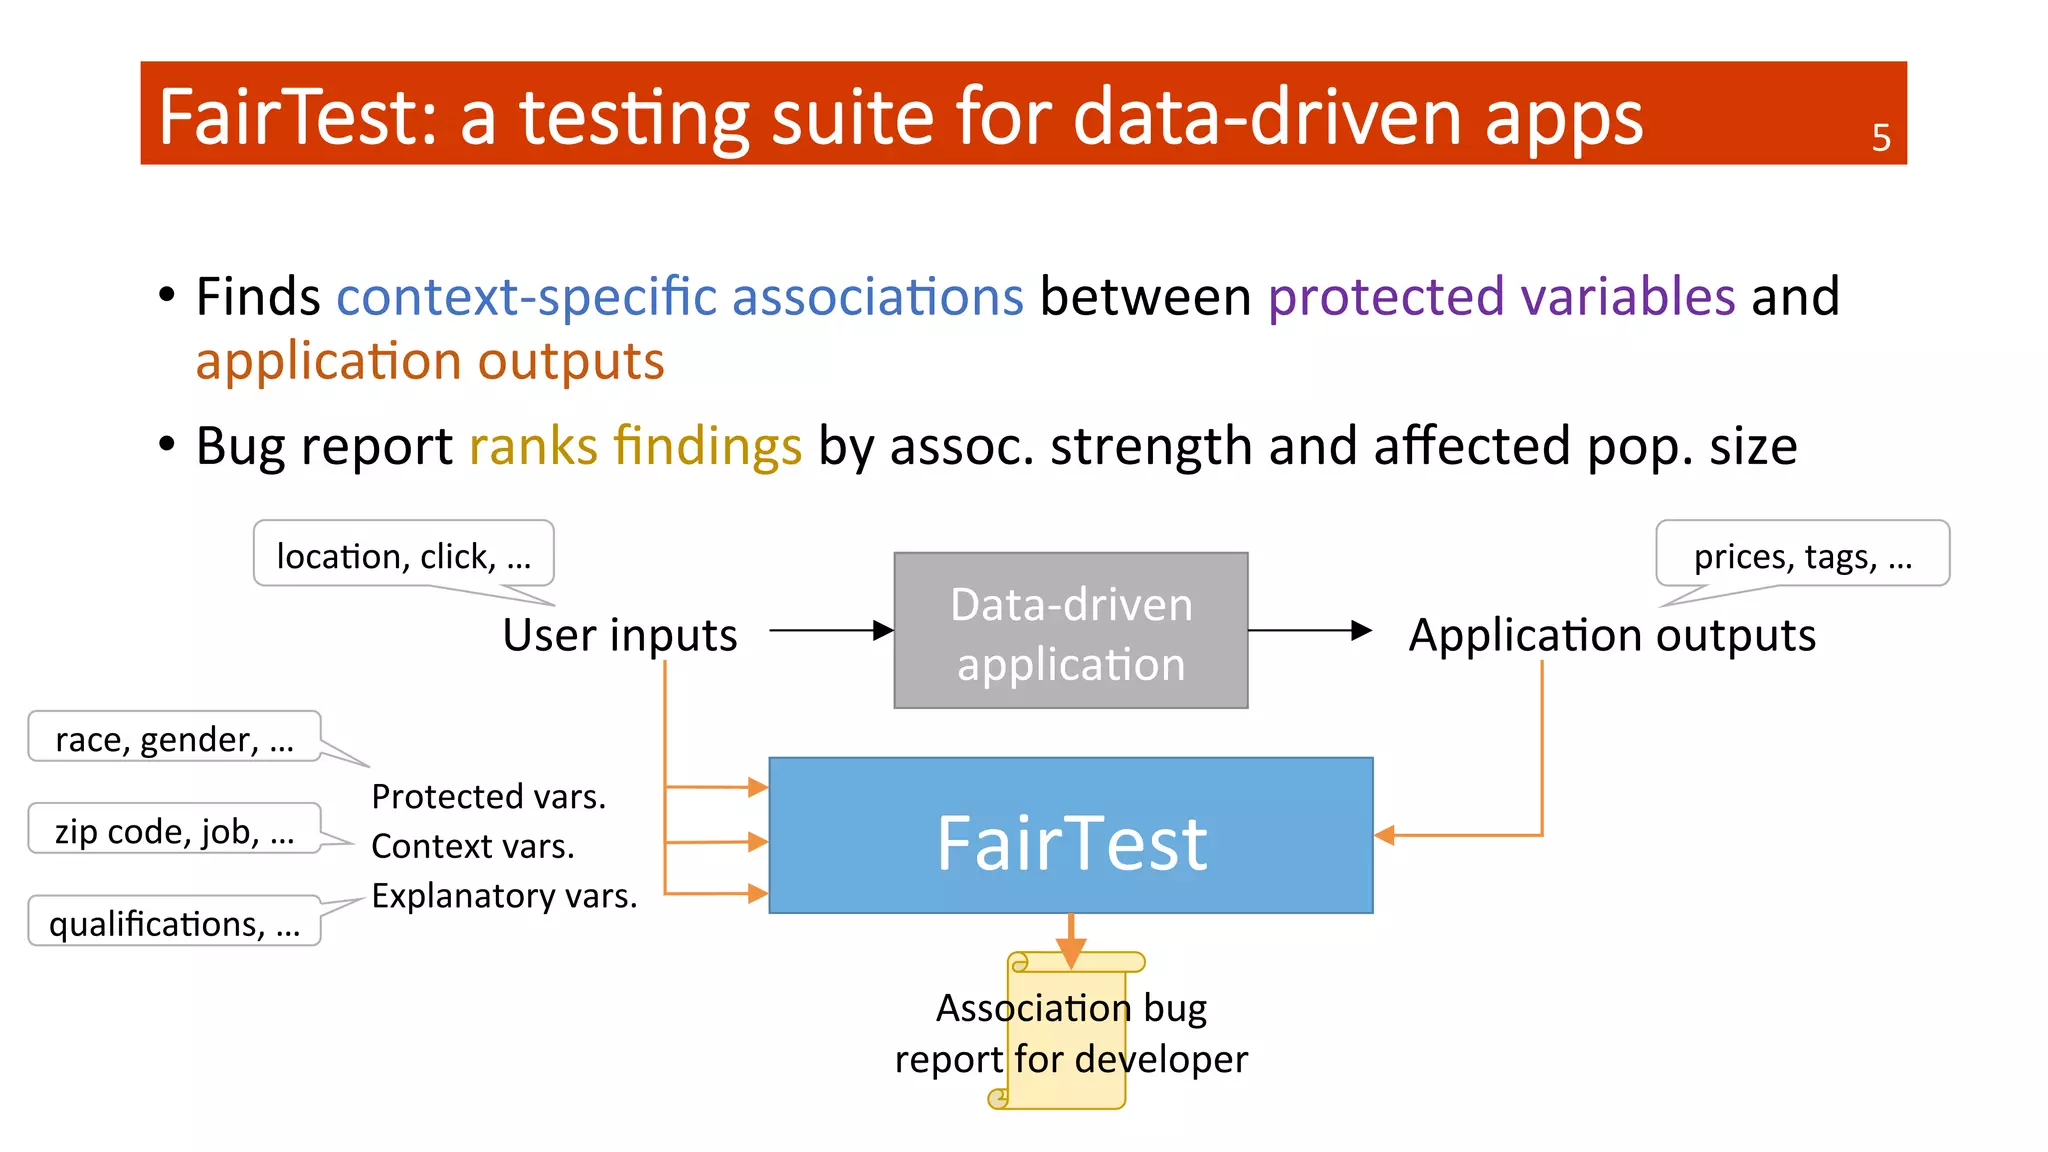
The document discusses fairtest, a testing suite designed to identify and debug unwarranted associations in data-driven applications, particularly related to issues of fairness concerning race, gender, and other protected variables. It emphasizes the importance of actively testing for these associations, as traditional preventative measures have limitations. The findings illustrate significant disparities in label associations and income data, highlighting potential biases that developers must address to prevent quantifiable harm.