Download as PDF, PPTX
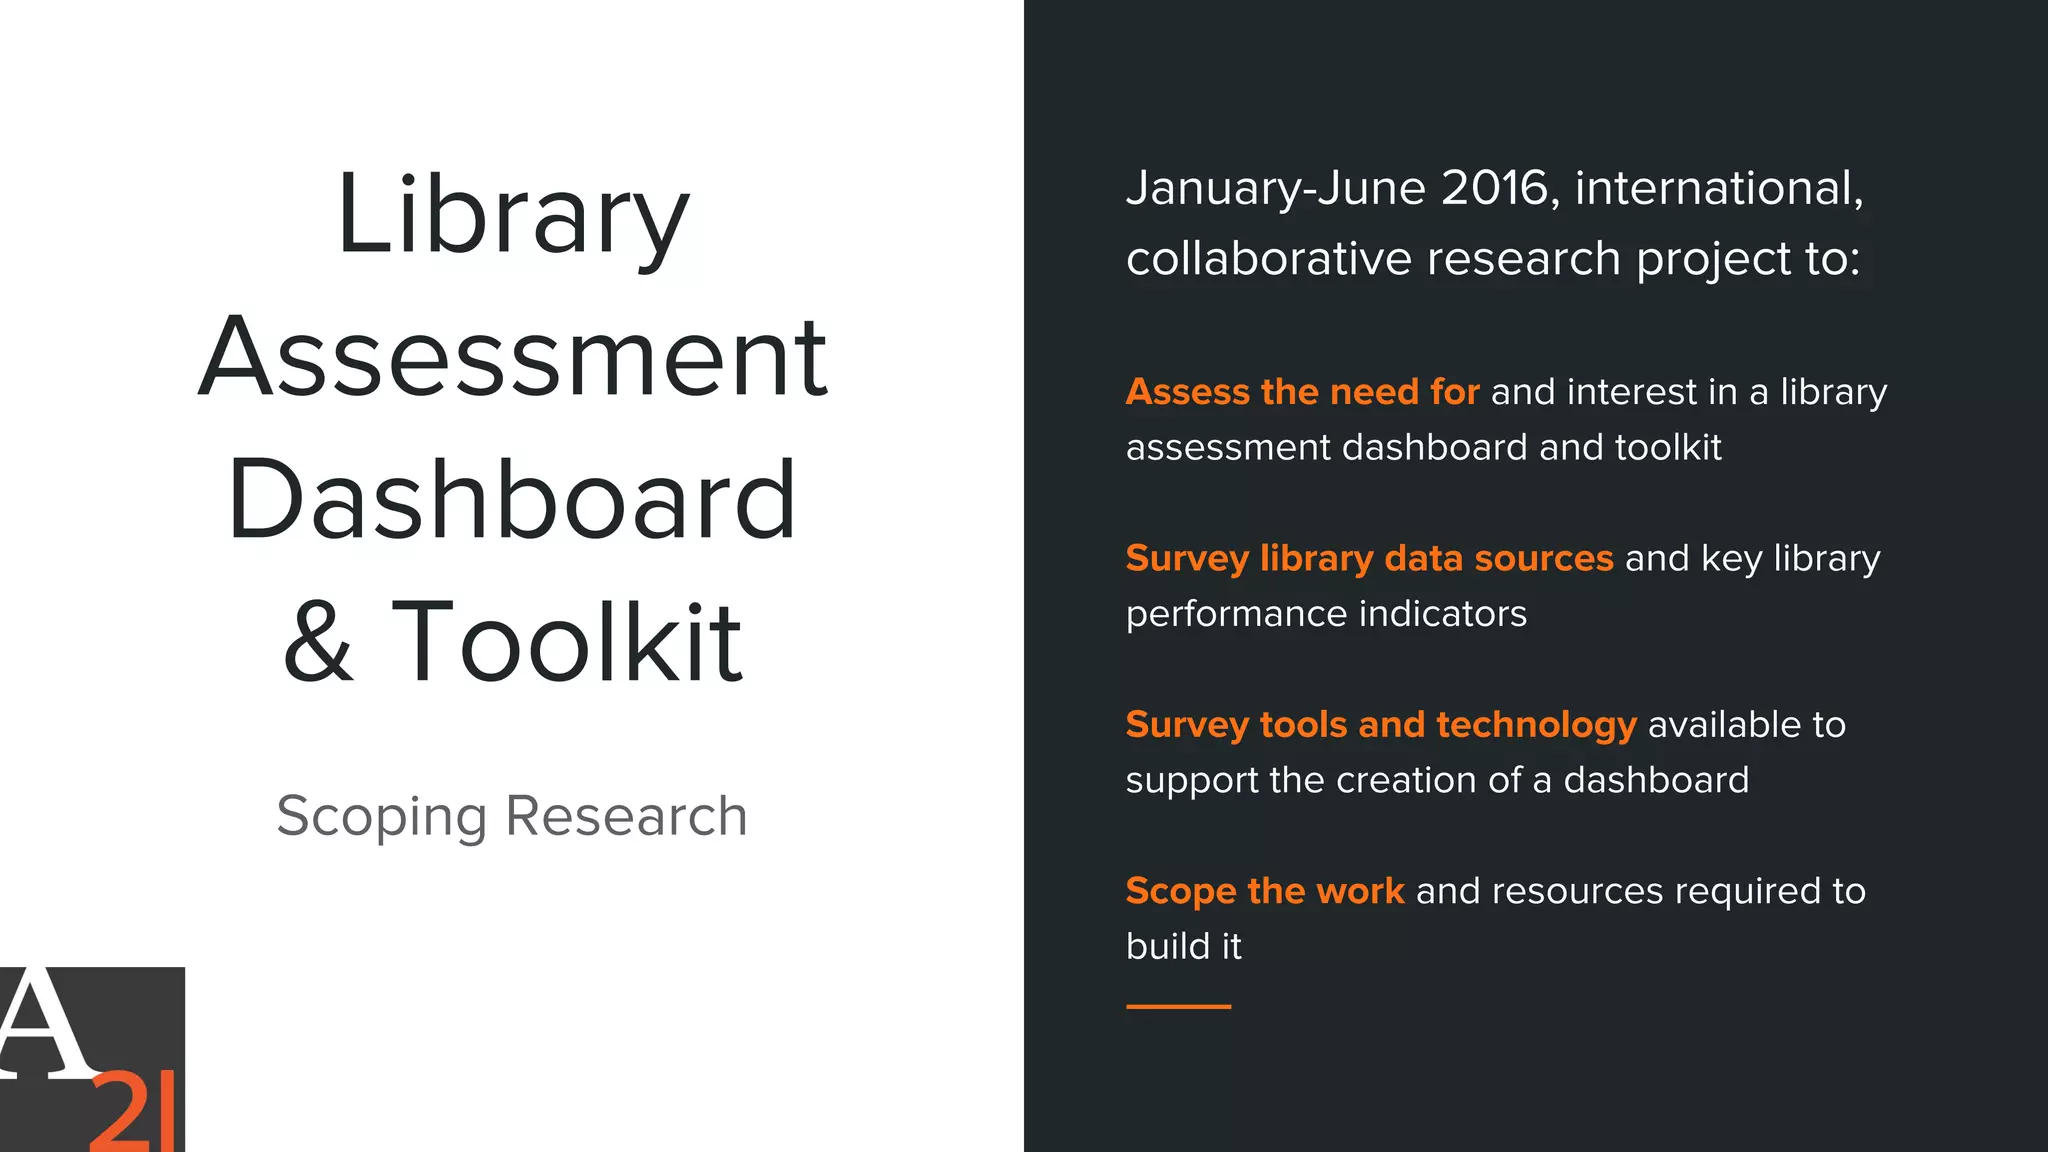
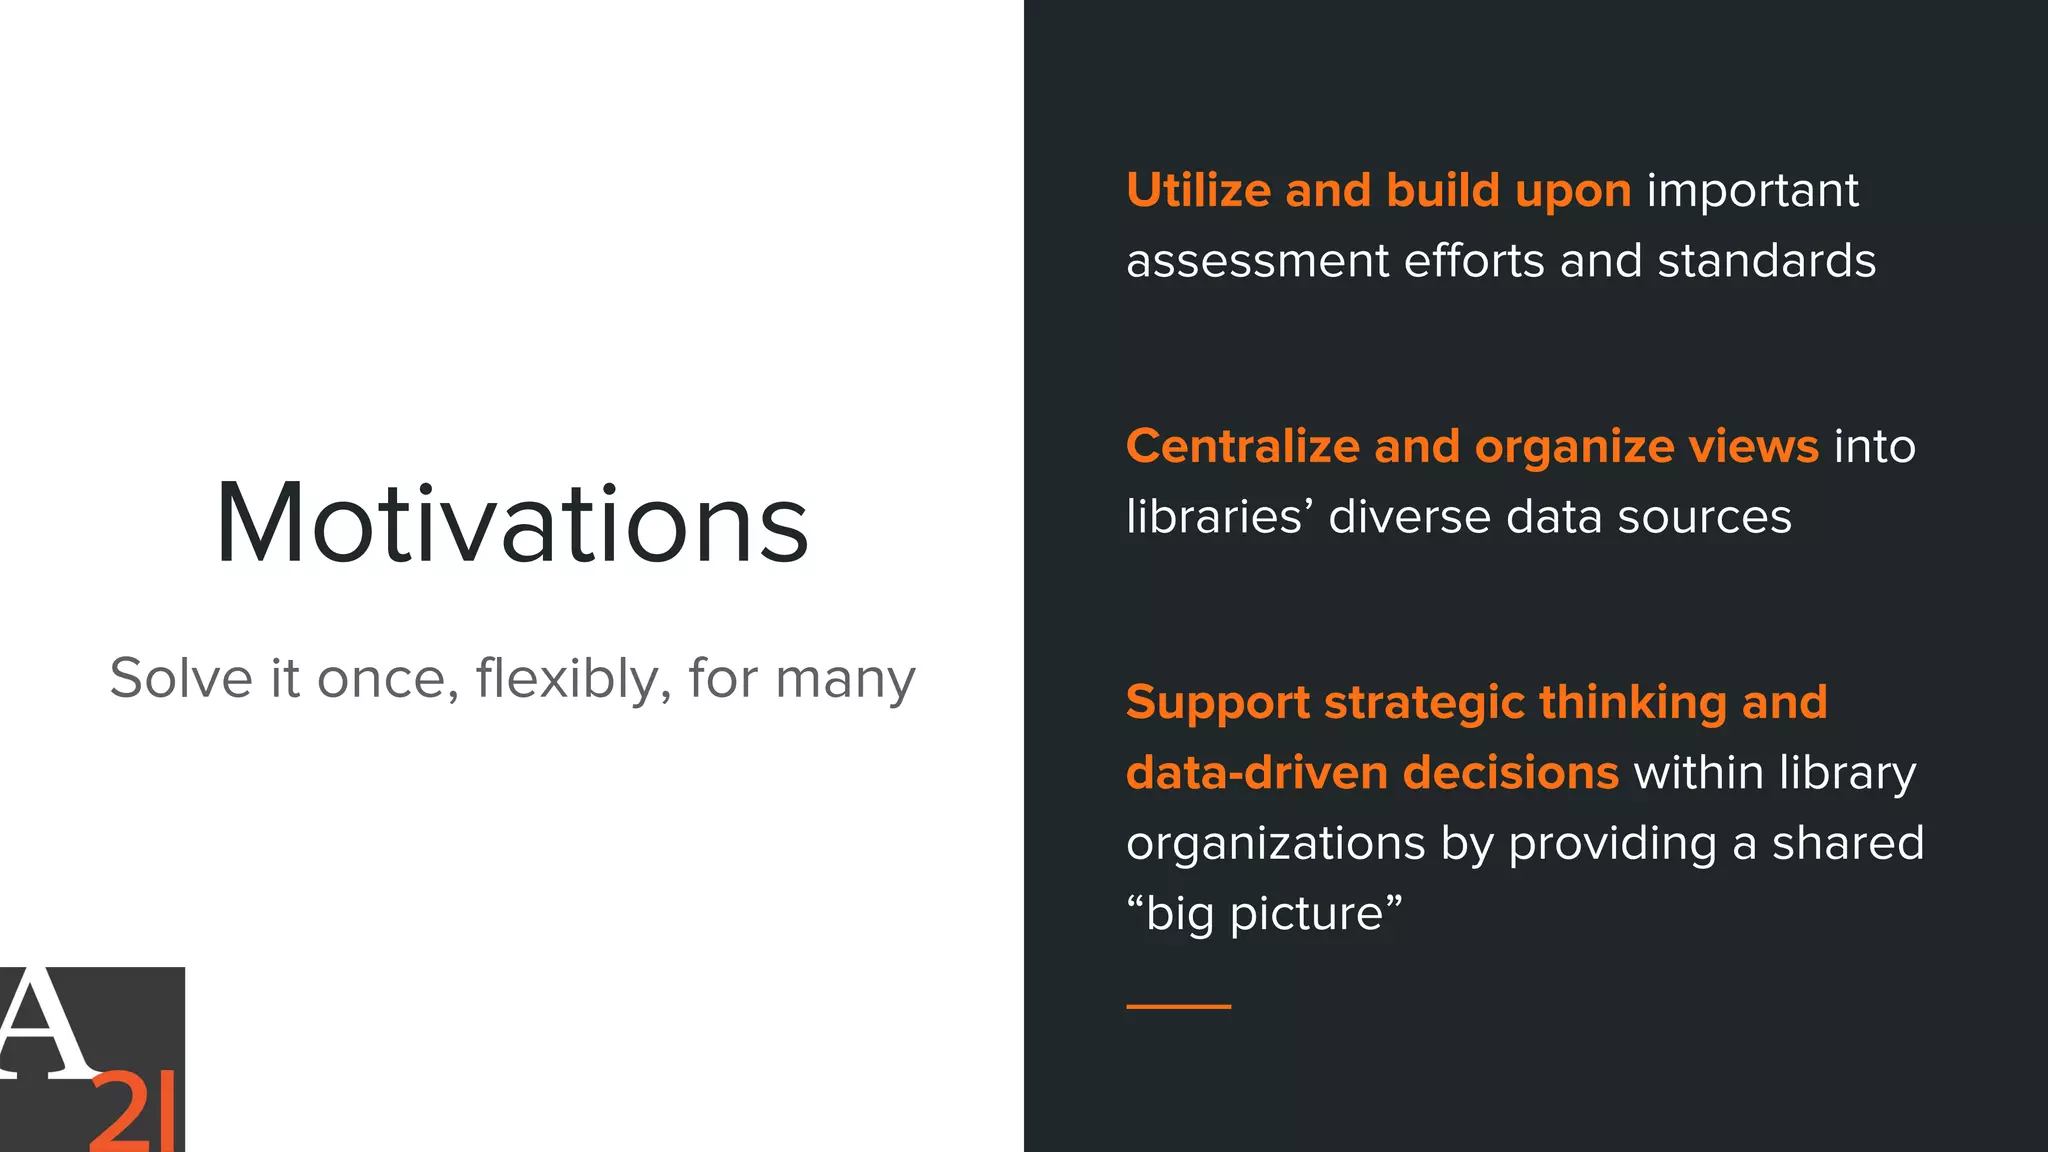

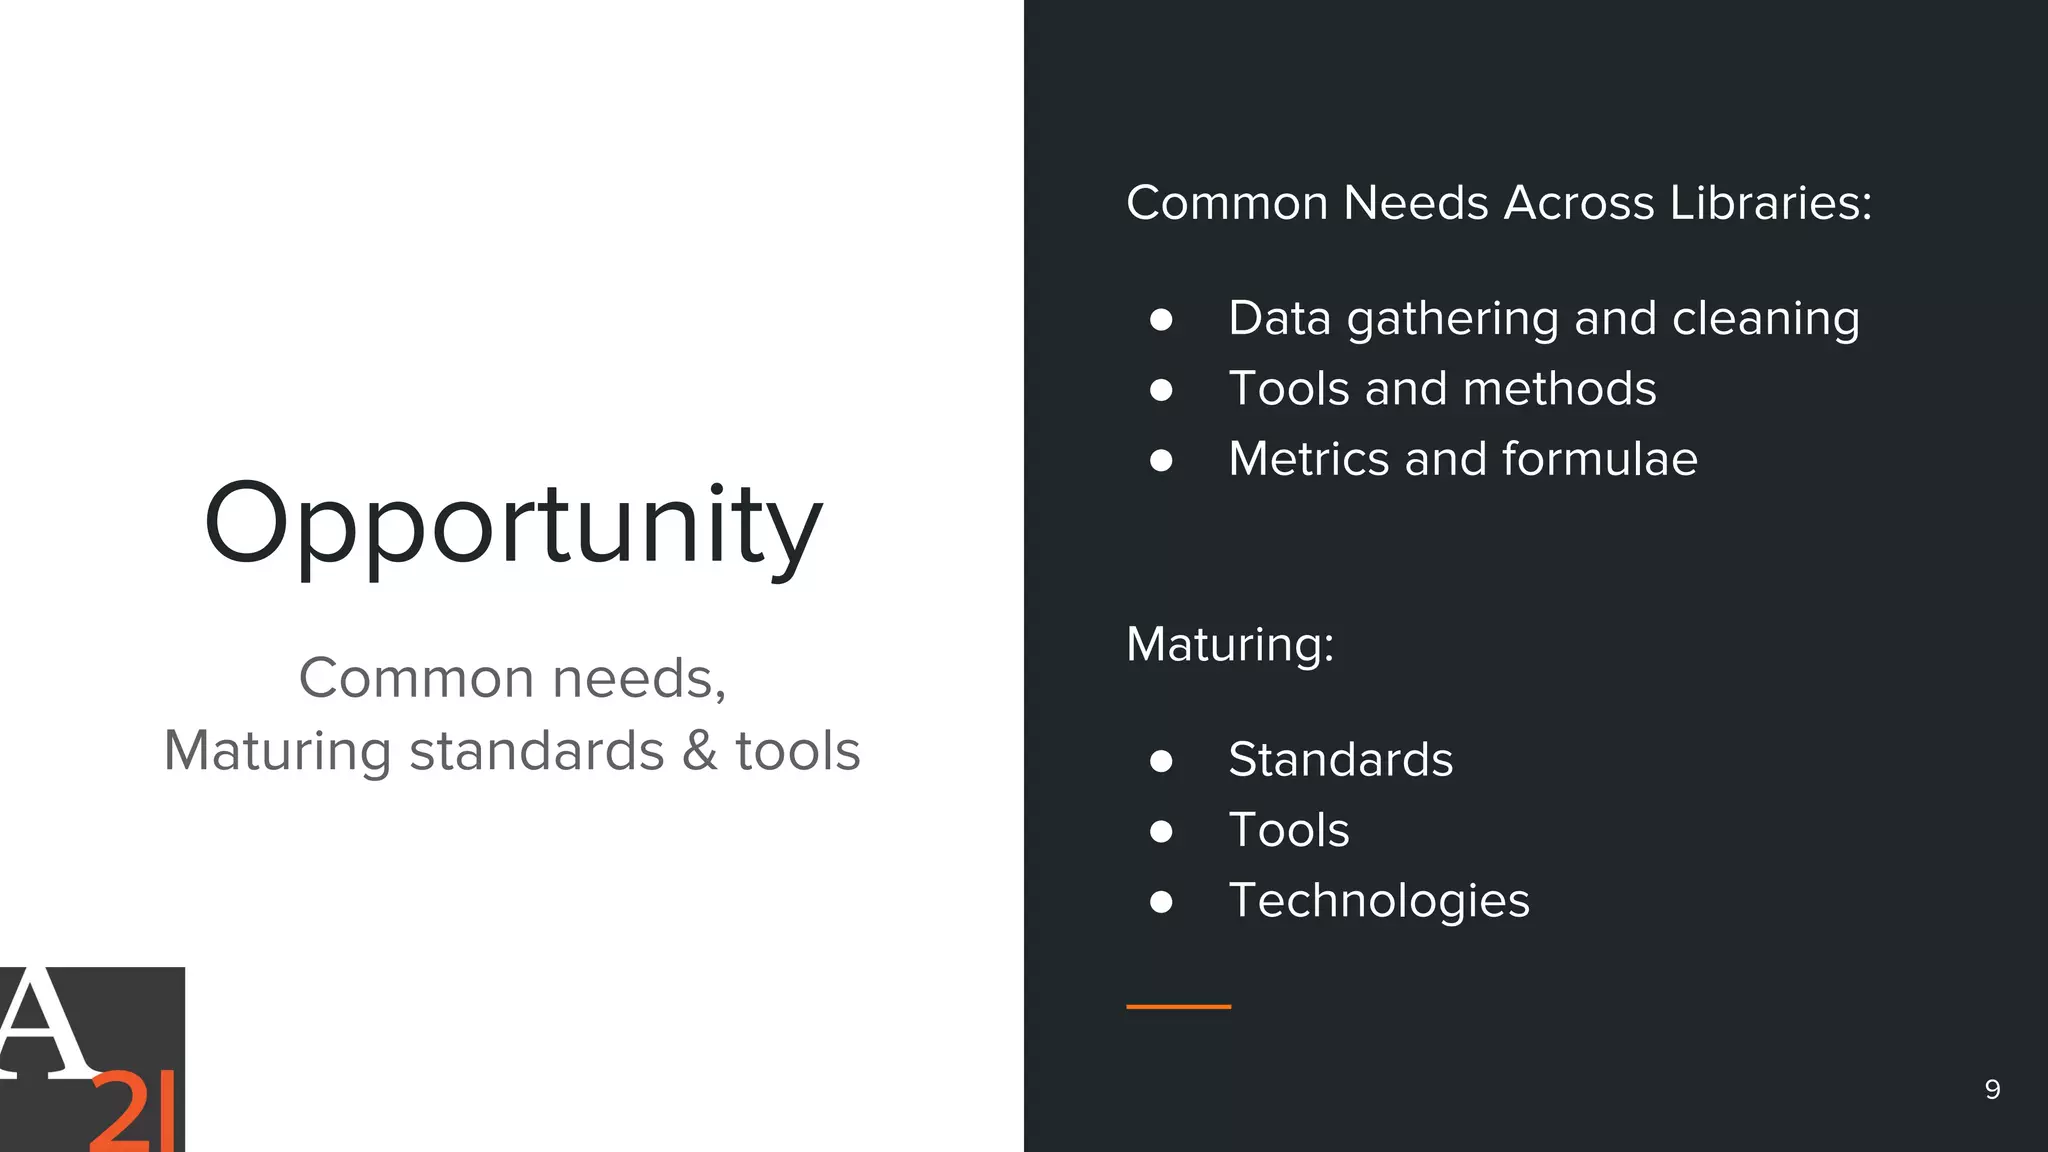
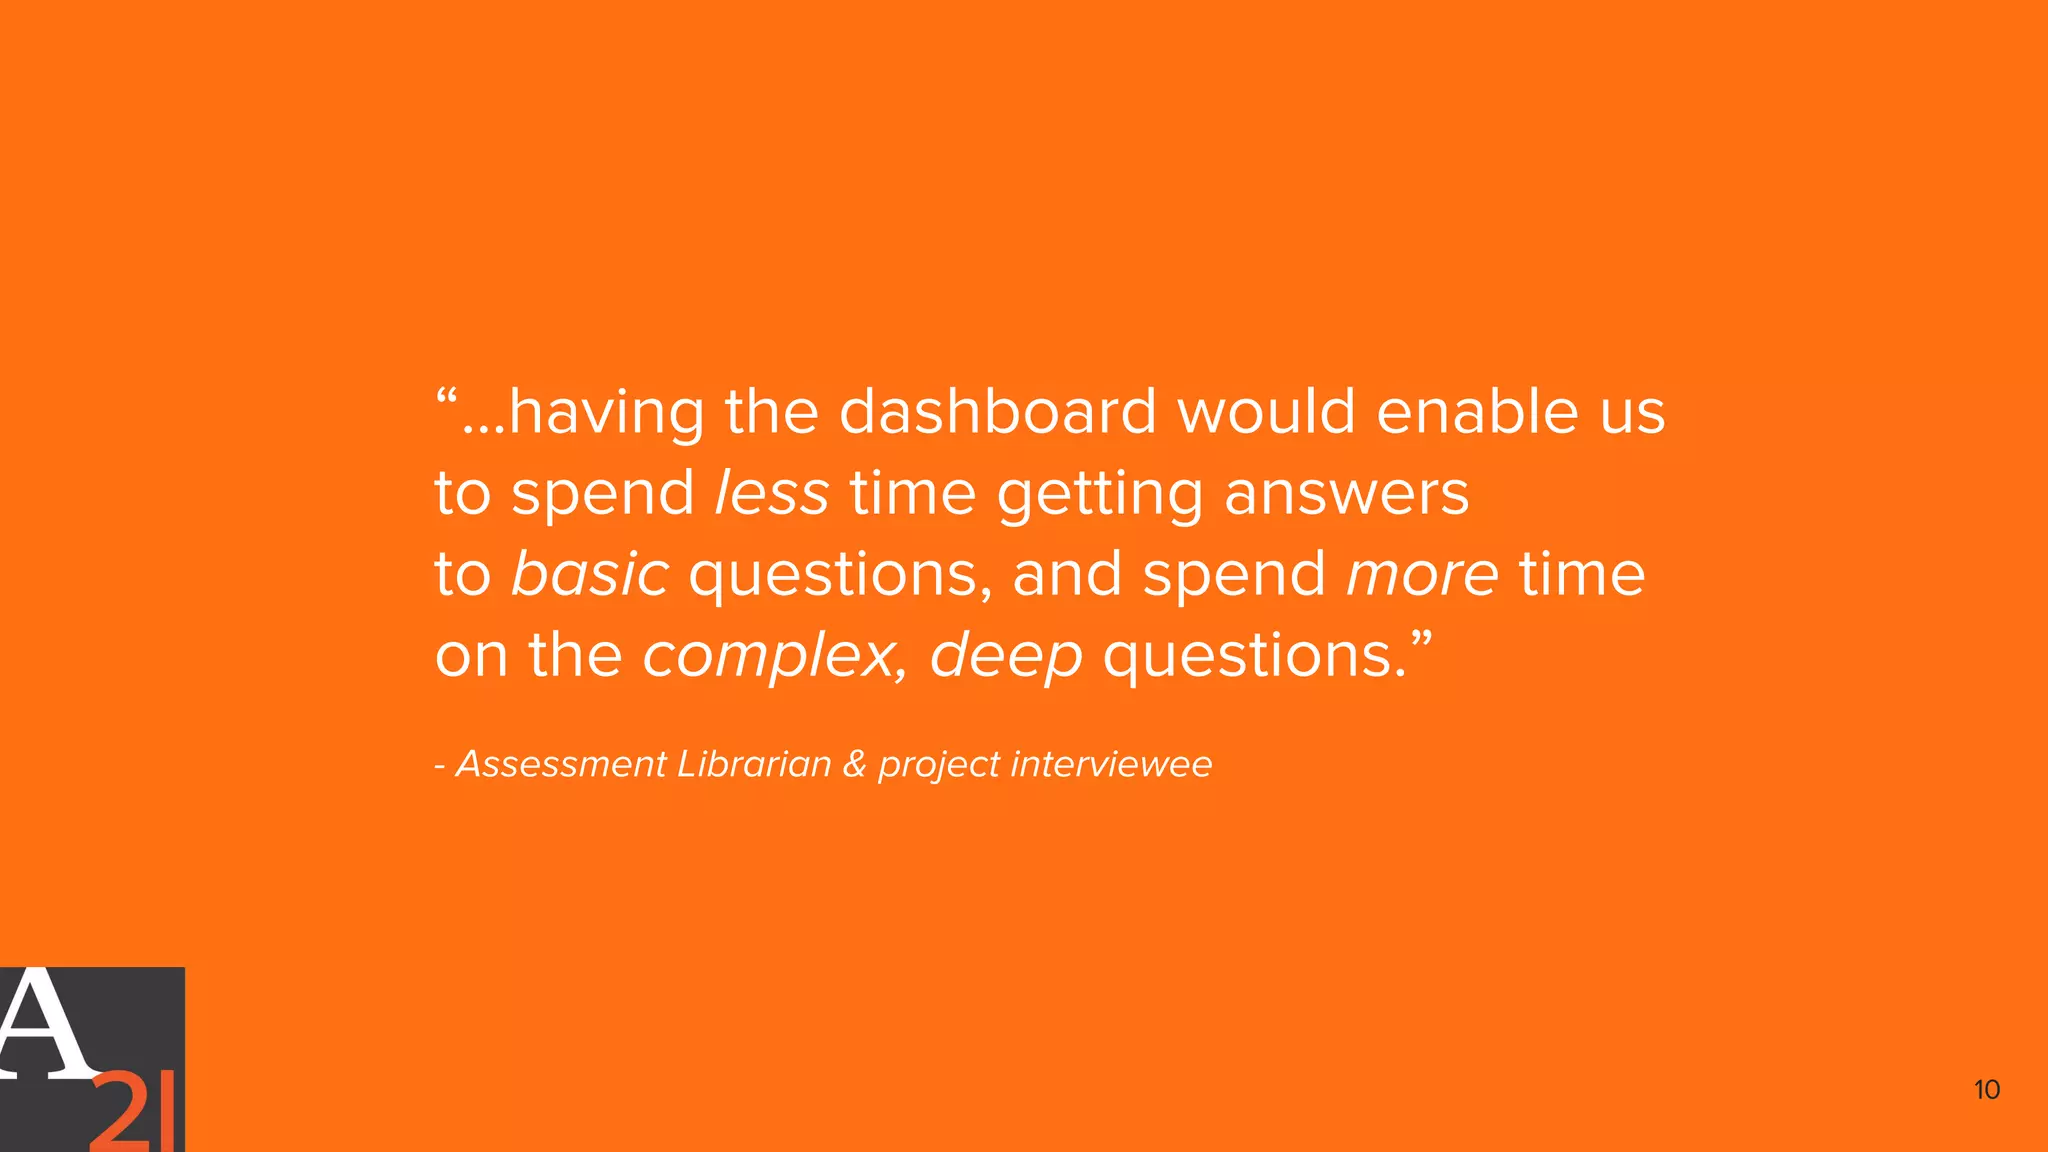
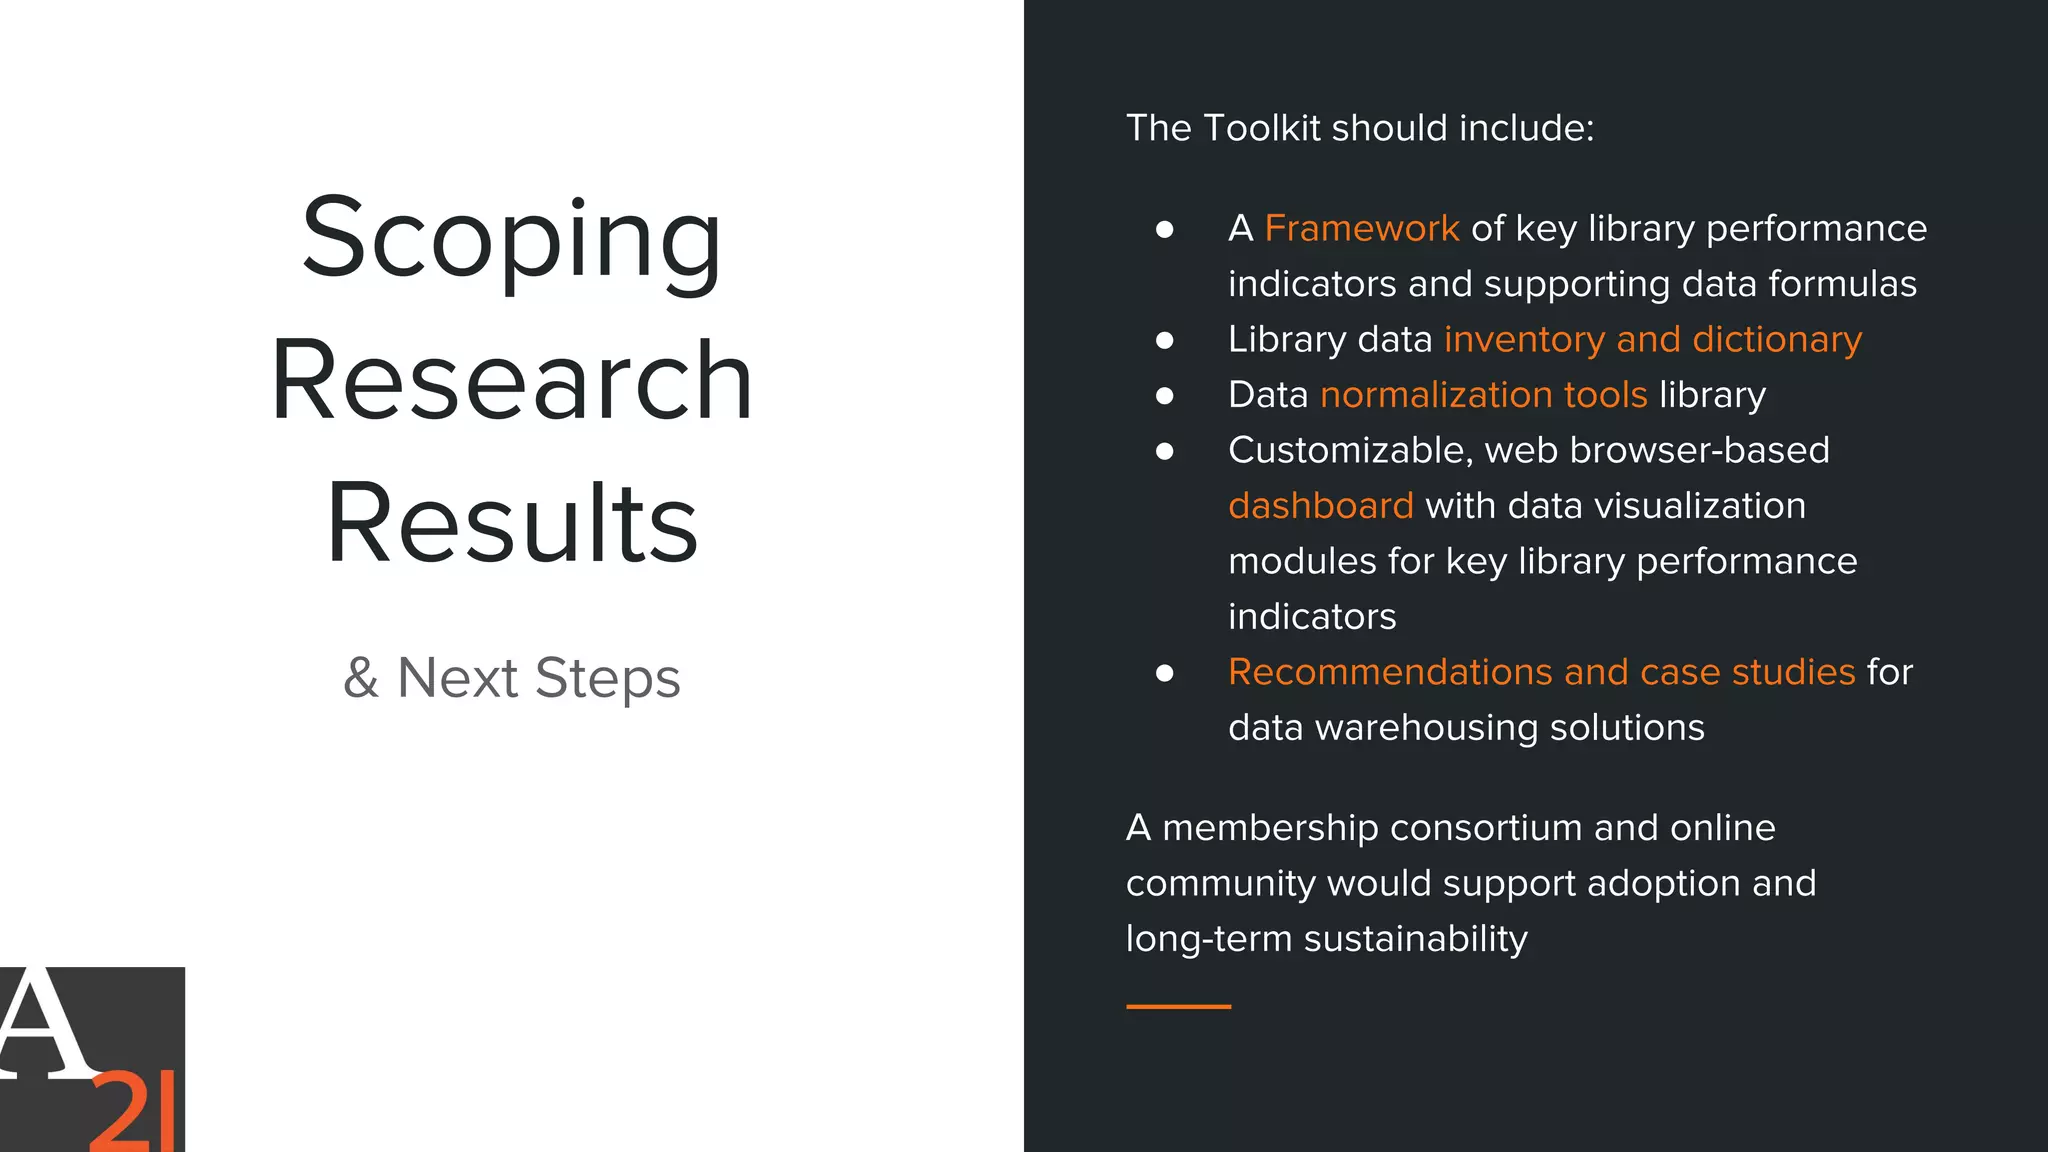

The document outlines the scoping research for a library assessment dashboard and toolkit, conducted from January to June 2016. The project seeks to identify the need for a centralized system to enhance data-driven decision-making in libraries by providing a framework of key performance indicators and tools for data management. Key recommendations include the establishment of a membership consortium to support ongoing development and adoption of the toolkit.


![[DSC Europe 25] Goran Obradovic - The Rise of Sovereign AI: Building the Regi...](https://cdn.slidesharecdn.com/ss_thumbnails/7nw2xxixrxqdxvrb5wca-6-251205085714-ab09a2ac-thumbnail.jpg?width=640&height=640&fit=bounds)


![[DSC Europe 25] Bogdan Daniel Maruneac - AI - It starts with you.pptx](https://cdn.slidesharecdn.com/ss_thumbnails/odov3snhrcqs9hx5ny2n-4-251205085715-f1daacfe-thumbnail.jpg?width=640&height=640&fit=bounds)


