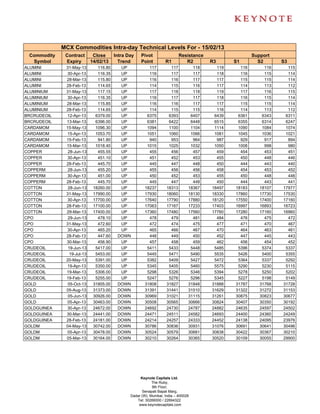
2. MCX Commodities Intra-day Technical Levels For - 15/02/13
Commodity Contract Close Intra Day Pivot Resistance Support
Symbol Expiry 14/02/13 Trend Point R1 R2 R3 S1 S2 S3
GOLDPETAL 30-Apr-13 3082.00 DOWN 3085 3089 3096 3107 3078 3074 3063
GOLDPETAL 30-Mar-13 3054.00 DOWN 3058 3062 3071 3084 3049 3045 3032
GOLDPETAL 28-Feb-13 3023.00 DOWN 3027 3032 3042 3057 3017 3012 2997
GOLDPTLDEL 30-Apr-13 3120.00 DOWN 3120 3120 3120 3120 3120 3120 3120
GOLDPTLDEL 30-Mar-13 3068.00 DOWN 3075 3086 3103 3131 3058 3047 3019
GOLDPTLDEL 28-Feb-13 3046.00 DOWN 3047 3061 3077 3107 3031 3017 2987
KAPAS 30-Mar-13 865.70 UP 862 873 880 899 854 843 824
KAPAS 30-Apr-13 911.40 UP 907 918 925 942 901 890 873
KAPASKHALI 31-May-13 1387.00 UP 1382 1394 1400 1418 1376 1364 1346
KAPASKHALI 30-Apr-13 1361.50 UP 1355 1371 1381 1407 1345 1329 1303
KAPASKHALI 28-Feb-13 1300.00 UP 1293 1310 1320 1347 1283 1266 1239
KAPASKHALI 30-Mar-13 1330.00 UP 1322 1339 1347 1372 1314 1297 1272
LEAD 31-May-13 130.40 UP 130 131 131 131 130 130 129
LEAD 30-Apr-13 130.30 DOWN 130 131 131 132 130 130 129
LEAD 28-Mar-13 130.40 UP 130 131 131 132 130 129 129
LEAD 28-Feb-13 129.85 UP 130 130 131 132 129 129 128
LEADMINI 31-May-13 130.35 DOWN 130 131 131 132 130 130 129
LEADMINI 30-Apr-13 130.55 UP 130 131 131 132 130 130 129
LEADMINI 28-Mar-13 130.35 UP 130 131 131 132 130 129 128
LEADMINI 28-Feb-13 129.85 UP 130 130 131 132 129 129 128
MENTHAOIL 30-Apr-13 1246.90 DOWN 1249 1256 1265 1281 1240 1234 1218
MENTHAOIL 31-May-13 1149.20 UP 1148 1154 1158 1168 1143 1138 1127
MENTHAOIL 30-Mar-13 1286.60 DOWN 1289 1298 1310 1330 1277 1268 1247
MENTHAOIL 28-Feb-13 1372.80 DOWN 1380 1393 1414 1448 1360 1347 1313
NATURALGAS 25-Apr-13 180.00 DOWN 182 185 190 198 177 174 167
NATURALGAS 25-Mar-13 175.00 DOWN 178 181 186 195 172 169 160
NATURALGAS 25-Feb-13 170.30 DOWN 173 176 182 191 167 164 155
NICKEL 31-May-13 1000.10 UP 1000 1005 1009 1019 995 991 981
NICKEL 30-Apr-13 997.20 UP 996 1002 1007 1019 991 985 974
NICKEL 28-Mar-13 989.00 DOWN 991 995 1002 1013 985 980 969
NICKEL 28-Feb-13 984.30 DOWN 986 991 998 1010 979 974 962
NICKELM 31-May-13 999.30 UP 997 1005 1012 1027 991 982 967
NICKELM 30-Apr-13 992.80 DOWN 995 999 1005 1014 989 986 976
NICKELM 28-Mar-13 989.10 DOWN 991 995 1001 1012 985 980 970
NICKELM 28-Feb-13 984.30 DOWN 986 991 998 1009 980 975 963
POTATO 15-Apr-13 819.90 UP 818 824 828 838 814 808 798
POTATO 15-Mar-13 830.70 UP 830 835 840 849 826 820 811
POTATO 15-May-13 817.00 DOWN 818 824 830 842 812 806 795
SILVER 05-Jul-13 59353.00 DOWN 59636 60018 60684 61732 58970 58588 57540
SILVER 04-May-13 57999.00 DOWN 58296 58693 59386 60476 57603 57206 56116
SILVER 05-Mar-13 56630.00 DOWN 56937 57323 58017 59097 56243 55857 54777
SILVER1000 30-Apr-13 58410.00 DOWN 58410 58410 58410 58410 58410 58410 58410
SILVER1000 30-Mar-13 57555.00 DOWN 57855 58499 59444 61033 56910 56266 54677
SILVER1000 28-Feb-13 56350.00 DOWN 56450 57599 58848 61246 55201 54052 51654
SILVERM 29-Jun-13 59354.00 DOWN 59665 60029 60705 61745 58989 58625 57585
SILVERM 30-Apr-13 58034.00 DOWN 58338 58711 59387 60436 57662 57289 56240
SILVERM 28-Feb-13 56655.00 DOWN 56966 57354 58053 59140 56267 55879 54792
SILVERMIC 29-Jun-13 59387.00 DOWN 59683 60034 60680 61677 59037 58686 57689
SILVERMIC 30-Apr-13 58036.00 DOWN 58342 58714 59393 60444 57663 57291 56240
SILVERMIC 28-Feb-13 56659.00 DOWN 56964 57345 58032 59100 56277 55896 54828
Keynote Capitals Ltd.
The Ruby,
9th Floor,
Senapati Bapat Marg,
Dadar (W), Mumbai, India – 400028
Tel: 30266000 / 22694322
www.keynotecapitals.com
3. MCX Commodities Intra-day Technical Levels For - 15/02/13
Commodity Contract Close Intra Day Pivot Resistance Support
Symbol Expiry 14/02/13 Trend Point R1 R2 R3 S1 S2 S3
STEELRPR 20-May-13 32450.00 UP 32430 32610 32770 33110 32270 32090 31750
STEELRPR 18-Apr-13 31850.00 DOWN 31887 31963 32077 32267 31773 31697 31507
STEELRPR 20-Feb-13 30810.00 DOWN 30877 30963 31117 31357 30723 30637 30397
STEELRPR 20-Mar-13 31350.00 DOWN 31383 31467 31583 31783 31267 31183 30983
ZINC 31-May-13 119.25 DOWN 119 120 120 120 119 119 118
ZINC 30-Apr-13 118.50 DOWN 119 119 120 121 118 118 117
ZINC 28-Mar-13 118.15 DOWN 118 119 119 121 118 117 116
ZINC 28-Feb-13 117.30 DOWN 117 118 119 120 117 116 115
ZINCMINI 31-May-13 119.55 DOWN 120 120 121 123 119 118 116
ZINCMINI 30-Apr-13 118.75 DOWN 119 119 120 121 118 118 117
ZINCMINI 28-Mar-13 118.15 DOWN 118 119 119 121 118 117 116
ZINCMINI 28-Feb-13 117.30 DOWN 117 118 119 120 117 116 115
Sanjay Bhatia (AVP – Technical Research), Email Id sanjay@keynotecapitals.net
Pivot Point: Intra- Day Trading Tool. - The key to the use of this tool is the use of Stop Loss
Intra Day Trend: It is valid only till the point where Price trades above Pivot Point. For Eg. “UP” would be valid till Price
remains above Pivot Point. It would become “DOWN” in event Price trades below Pivot Point.
Pivot Point (PP): This is a trigger point for Intra Day Buy / Sell based on the price range of the previous day.
R1: Resistance 1: 1st Resistance level over Pivot Point, R2: Resistance 2: Next Resistance level after R1.
R3: Resistance 3: Next Resistance level after R2.
S1: Support 1: 1st Support level after Pivot Point, S2: Support 2: Next Support level after S1.
S3: Support 3: Next Support level after S2.
Note: As per this tool, the trader should take BUY position just above the Pivot Point and keep the Pivot Point level as stop
loss and the first target would be R1 level (Resistance 1). If R1 is crossed then R2 (Resistance 2) becomes the next target
with the stop loss placed at R1 level. If R2 is crossed then R3 (Resistance 3) becomes the next target with the stop loss
placed at R2 level.
Similarly if price goes below the Pivot Point the trader should take a SELL position and keep the Pivot Point level as the
stop loss and the first target would be S1 level (Support 1). If S1 level is breached then S2 level (Support 2) becomes the
next target with the stop loss placed at S1 level. If S2 level is breached then S3 level (Support 3) becomes the next target
with the stop loss placed at S2 level.
Disclaimer: This document is not for public distribution and has been furnished to you solely for your information and must not be reproduced or
redistributed to any other person. Persons into whose possession this document may come are required to observe these restrictions. This material is for
the personal information of the authorized recipient, and we are not soliciting any action based upon it. This report is not to be construed as an offer to
sell or the solicitation of an offer to buy any security in any jurisdiction where such an offer or solicitation would be illegal. It is for the general information
of clients of Keynote Capitals Ltd. It does not constitute a personal recommendation or take into account the particular investment objectives, financial
situations, or needs of individual clients. We have reviewed the report, and in so far as it includes current or historical information, it is believed to be
reliable though its accuracy or completeness cannot be guaranteed. Neither Keynote Capitals Ltd., nor any person connected with it, accepts any liability
arising from the use of this document. The recipients of this material should rely on their own investigations and take their own professional advice. Price
and value of the investments referred to in this material may go up or down. Past performance is not a guide for future performance. Certain transactions
-including those involving futures, options and other derivatives as well as non-investment grade securities - involve substantial risk and are not suitable
for all investors. Reports based on technical analysis centers on studying charts of a stock’s price movement and trading volume, as opposed to focusing
on a company’s fundamentals and as such, may not match with a report on a company’s fundamentals. Opinions expressed are our current opinions as
of the date appearing on this material only. While we endeavor to update on a reasonable basis the information discussed in this material, there may be
regulatory, compliance, or other reasons that prevent us from doing so. Prospective investors and others are cautioned that any forward-looking
statements are not predictions and may be subject to change without notice. Our proprietary trading and investment businesses may make investment
decisions that are inconsistent with the recommendations expressed herein. We and our affiliates, officers, directors, and employees world wide may: (a)
from time to time, have long or short positions in, and buy or sell the securities thereof, of company (ies) mentioned herein or (b) be engaged in any other
transaction involving such securities and earn brokerage or other compensation or act as a market maker in the financial instruments of the company
(ies) discussed herein or act as advisor or lender / borrower to such company (ies) or have other potential conflict of interest with respect to any
recommendation and related information and opinions. The analyst for this report certifies that all of the views expressed in this report accurately reflect
his or her personal views about the subject company or companies and its or their securities, and no part of his or her compensation was, is or will be,
directly or indirectly related to specific recommendations or views expressed in this report. No part of this material may be duplicated in any form and/or
redistributed without Keynote Capitals Ltd’s., prior written consent.
Keynote Capitals Ltd.
The Ruby,
9th Floor,
Senapati Bapat Marg,
Dadar (W), Mumbai, India – 400028
Tel: 30266000 / 22694322
www.keynotecapitals.com