Mobile media consumption_wave_2_apac
•
0 likes•237 views

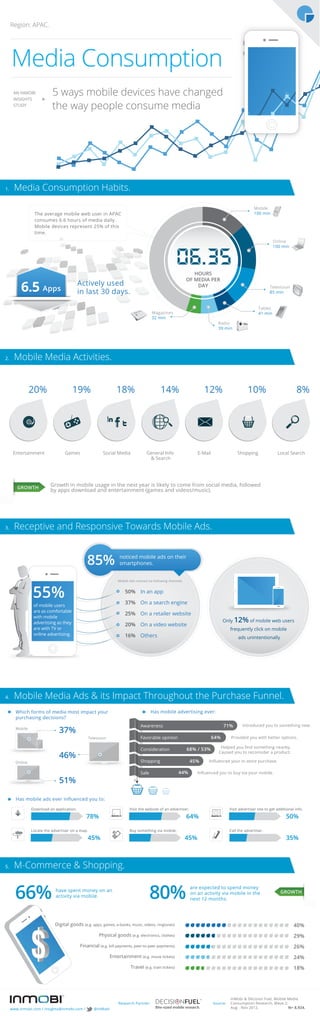
How are people engaging with their mobile devices? How effective are mobile ads? The results from our global research study with InMobi on Mobile Media Consumption was officially released at this year's World Mobile Congress last week. In this second wave of research, we tracked how mobile devices have changed they way media is consumed across 14 countries. This report summarizes the findings for the APAC region.
Recommended

Recommended
More Related Content
What's hot
What's hot (18)
Viewers also liked
Similar to Mobile media consumption_wave_2_apac
Similar to Mobile media consumption_wave_2_apac (20)
More from Pohchin Loh
More from Pohchin Loh (6)
Recently uploaded
Recently uploaded (20)
Mobile media consumption_wave_2_apac
- 1. Region: APAC. Media Consumption AN INMOBI INSIGHTS » 5 ways mobile devices have changed STUDY the way people consume media 1. Media Consumption Habits. Mobile The average mobile web user in APAC 100 min consumes 6.6 hours of media daily. Mobile devices represent 25% of this time. Online 100 min HOURS OF MEDIA PER 6.5 Apps Actively used in last 30 days. DAY Television 85 min Tablet Magazines 41 min 32 min Radio 39 min 2. Mobile Media Activities. 20% 19% 18% 14% 12% 10% 8% Entertainment Games Social Media General Info E-Mail Shopping Local Search & Search GROWTH Growth in mobile usage in the next year is likely to come from social media, followed by apps download and entertainment (games and videos/music). 3. Receptive and Responsive Towards Mobile Ads. 85% noticed mobile ads on their smartphones. Mobile Ads noticed via following channels 55% 50% In an app 37% On a search engine of mobile users are as comfortable 25% On a retailer website with mobile advertising as they Only 12% of mobile web users 20% On a video website are with TV or frequently click on mobile online advertising. 16% Others ads unintentionally 4. Mobile Media Ads & its Impact Throughout the Purchase Funnel. Which forms of media most impact your Has mobile advertising ever: purchasing decisions? Awareness 71% Introduced you to something new. Mobile 37% Television Favorable opinion 64% Provided you with better options. Helped you find something nearby. Consideration 68% / 53% 46% Caused you to reconsider a product. Online Shopping 45% Influenced your in-store purchase. Sale 44% Influenced you to buy via your mobile. 51% Has mobile ads ever influenced you to: Download an application. Visit the website of an advertiser. Visit advertiser site to get additional info. 78% 64% 50% Locate the advertiser on a map. Buy something via mobile. Call the advertiser. 45% 45% 35% 5. M-Commerce & Shopping. 66% 80% are expected to spend money have spent money on an GROWTH on an activity via mobile in the activity via mobile. next 12 months. Digital goods (e.g. apps, games, e-books, music, videos, ringtones) 40% Physical goods (e.g. electronics, clothes) 29% Financial (e.g. bill payments, peer-to-peer payments) 26% Entertainment (e.g. movie tickets) 24% Travel (e.g. train tickets) 18% TM InMobi & Decision Fuel, Mobile Media Research Partner: Source: Consumption Research, Wave 2: www.inmobi.com / insights@inmobi.com / @InMobi Aug - Nov 2012. N= 8,924.