Predictive Model Example
•Download as PPTX, PDF•
0 likes•31 views

Representation for designing an optimization paid media model to optimize media spend by ad group.

Recommended
Recommended
More Related Content
Similar to Predictive Model Example
Similar to Predictive Model Example (20)
More from Daniel McKean
More from Daniel McKean (20)
Recently uploaded
Recently uploaded (20)
Predictive Model Example
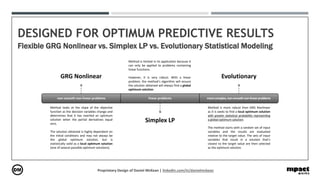
- 1. Flexible GRG Nonlinear vs. Simplex LP vs. Evolutionary Statistical Modeling non-smooth non-linear problems GRG Nonlinear linear problems Simplex LP morecomplex,non-smoothnon-linearproblems Evolutionary Proprietary Design of Daniel McKean | linkedin.com/in/danielmckean DESIGNED FOR OPTIMUM PREDICTIVE RESULTS Method is limited in its application because it can only be applied to problems containing linear functions. However, it is very robust. With a linear problem, the method’s algorithm will ensure the solution obtained will always find a global optimum solution. Method looks at the slope of the objective function as the decision variables change and determines that it has reached an optimum solution when the partial derivatives equal zero. The solution obtained is highly dependent on the initial conditions and may not always be the global optimum solution, but is statistically valid as a local optimum solution (one of several possible optimum solutions). Method is more robust than GRG Nonlinear as it is seeks to find a local optimum solution with greater statistical probability representing a global optimum solution. The method starts with a random set of input variables and the results are evaluated relative to the target value. The sets of input variables that result in a solution that’s closest to the target value are then selected as the optimum solution.
- 2. Predictive Modeling Design Goal: data modeling uses a four-step design to analyze and optimize different subsets of linear or nonlinear variable constraints to find the optimal combination of decision variables that meets the model’s defined objective function. Design: the model’s core design is built to meet varying demanding objectives that align to improving business and marketing performance across digital channels and measurable executable tactics. Objectives: the model can be used for leading business and marketing objectives including optimizing budget spends, conversions, ROI, revenue, CLV, engagements, customer leads, and much more by linking the model to a mix of relational KPIs and metrics benchmarked from past business performance. Flexibility: the predictive model will work with most (if not all) digital marketing channels including paid advertising, PPC, SEO, email, SMM, and content marketing. Integrity: the model’s optimization insights are based on the business or marketing objective you define leveraging relevant variable goal constraints against real historic business or campaign performance benchmarks. Statistical Outcomes: the model optimizes to your leading business objectives by statistically minimizing risk or executing within an acceptable target level of risk using a relevant Beta coefficient which takes into consideration actual real-world business performance dynamics and volatility. -------------------- 4 Steps to Business | Marketing Optimization Proprietary Design of Daniel McKean | linkedin.com/in/danielmckean Track and measure business performance. Benchmark leading KPI and metrics. Define a business objective for optimization. Map relevant KPIs to business objective. 1. Define the Problem Identify business performance to decision variables and constraints. Link variable constraints to the model. Test and validate the model. 2. Align the Objective Execute a course of action based on a chosen acceptable model outcome. Continue to test and measure optimized performance. Re-run the model and adjust execution accordingly over specified time periods. 4. Execute & Optimize Run the model to find the baseline localized optimal solution using the appropriate statistical method. Continue to model acceptable upper and lower thresholds for the best outcome and optimal solution. 3. Run the Model 4-STEP OPTIMIZATION PROCESS 1. Define the Problem 2. Align Objective to Model 3. Run the Model 4. Execute & Optimize
- 3. Representation Marketing Channel Paid Media (Display Advertising) Benchmarked Business Performance A 90-day programmatic campaign period with a modest media budget using 10 Ad Groups to target the online sale of commercial DTC products. Business Optimization Objective Improve campaign’s return on media spend (ROAS) Campaign Leading KPIs Media spend, budget allocation, impressions, clicks, CPC, revenue, ROAS -------------------- Predictive Analysis Example ROAS Optimization Problem Specifics Maximize ROAS (Return On Ad Spend) To find the optimal predicted maximum ROAS, the model uses a historic business benchmark and variable constraints to control the statistical analysis. Find the optimum Ad Group budget spend mix for maximizing ROAS within an acceptable assigned eta (maximum assumed risk for CPC performance volatility). Solution should include THE MAXIMUM % of total budget spend applied per any single Ad Group (if applicable) for managing budget distribution aligned to campaign objectives. Solution should include A MINIMUM NUMBER OF Ad Groups (if applicable) for managing budget diversification to meet defined campaign objectives. Solution should optimize to the assigned budget allocation. Variable constraints should allow for the analysis of the acceptable upper/lower optimization thresholds to find the global optimal solution which meets the business objective. -------------------- Represented Benchmarked Model Data: An actual 90-day campaign period with a modest media budget for a programmatic media buy using 10 Ad Groups to target the online sale of commercial DTC home video content across multiple genres is used to demonstrate the model’s functionality. Proprietary Design of Daniel McKean | linkedin.com/in/danielmckean Sample 90-Day Campaign Benchmark Performance PivotTable CPC Risk Volatility ROAS = Revenue / Media Spend The Predictive Model represented uses the benchmarked correlation between CPC and ROAS to determine the optimal spend by Ad Group. As a first step to analyze campaign optimization, the model will calculate the optimal budget spend by Ad Group for maximum returns if overall campaign CPC performance continues to perform at or below the maximum threshold of the historic CPC benchmark performance enabling a more efficient media buy and budget. Of Note: the model’s statistical analysis assumes if average CPC rises, ROAS will decrease, and conversely if average CPC decreases, ROAS will increase. Therefore, the model by changing the defined variable constraints will find the baseline optimization solution with upper and lower thresholds for a campaign’s acceptable CPC performance as measured against acceptable ROAS gains to fully analyze strategic alignment with all required (as applicable) dynamic campaign performance considerations measured against desired outcomes (e.g., minimum Ad Group inclusion, budget share spend, minimum/maximum budget, etc.). Upper and lower thresholds can be used in ongoing campaign analysis and optimization and be further used as alerts for replicating best practices or refreshing campaign executable dynamics such as Ad Groups, placement, creative, messaging, imagery, targeting, and more.
- 4. Model Baseline Optimization Results Solving Method #1: GRG Nonlinear Statistical Algorithm Represented Marketing Channel Paid Media (Display Advertising) Represented Business Objective Improve return on media spend (ROAS) Variable Constraints No change to benchmark variable constraints -------------------- (Baseline Analysis #1) ROAS Optimization Problem Specifics Maximize ROAS (Return On Ad Spend) 1. Find the best Ad Group budget spend mix to maximize ROAS. 2. Optimize current campaign performance using the current eta benchmark of 6.71 (maximum assumed risk for CPC performance volatility). 3. Allocate no more than 30% of total budget spend to any single Ad Group per historic campaign performance. 4. Maintain current media buy diversification by including all (10) Ad Groups in final model outcome. -------------------- Model Optimization Outcome Using historical benchmarked performance constraints: (10) Ad Groups, 6.71 Beta (campaign CPC performance), 30% max. budget share per any single Ad Group… …a 40% lift in ROAS performance can be realized by simply reallocating budget spend across the Ad Groups. Proprietary Design of Daniel McKean | linkedin.com/in/danielmckean The Predictive Model represented uses the benchmarked correlation between CPC and ROAS to determine the optimal spend by Ad Group. As a first step to campaign optimization, the model will calculate the optimal budget spend by Ad Group for maximum returns if overall campaign CPC performance continues to perform at or within a minimal threshold below the historic benchmark enabling a more efficient media budget.