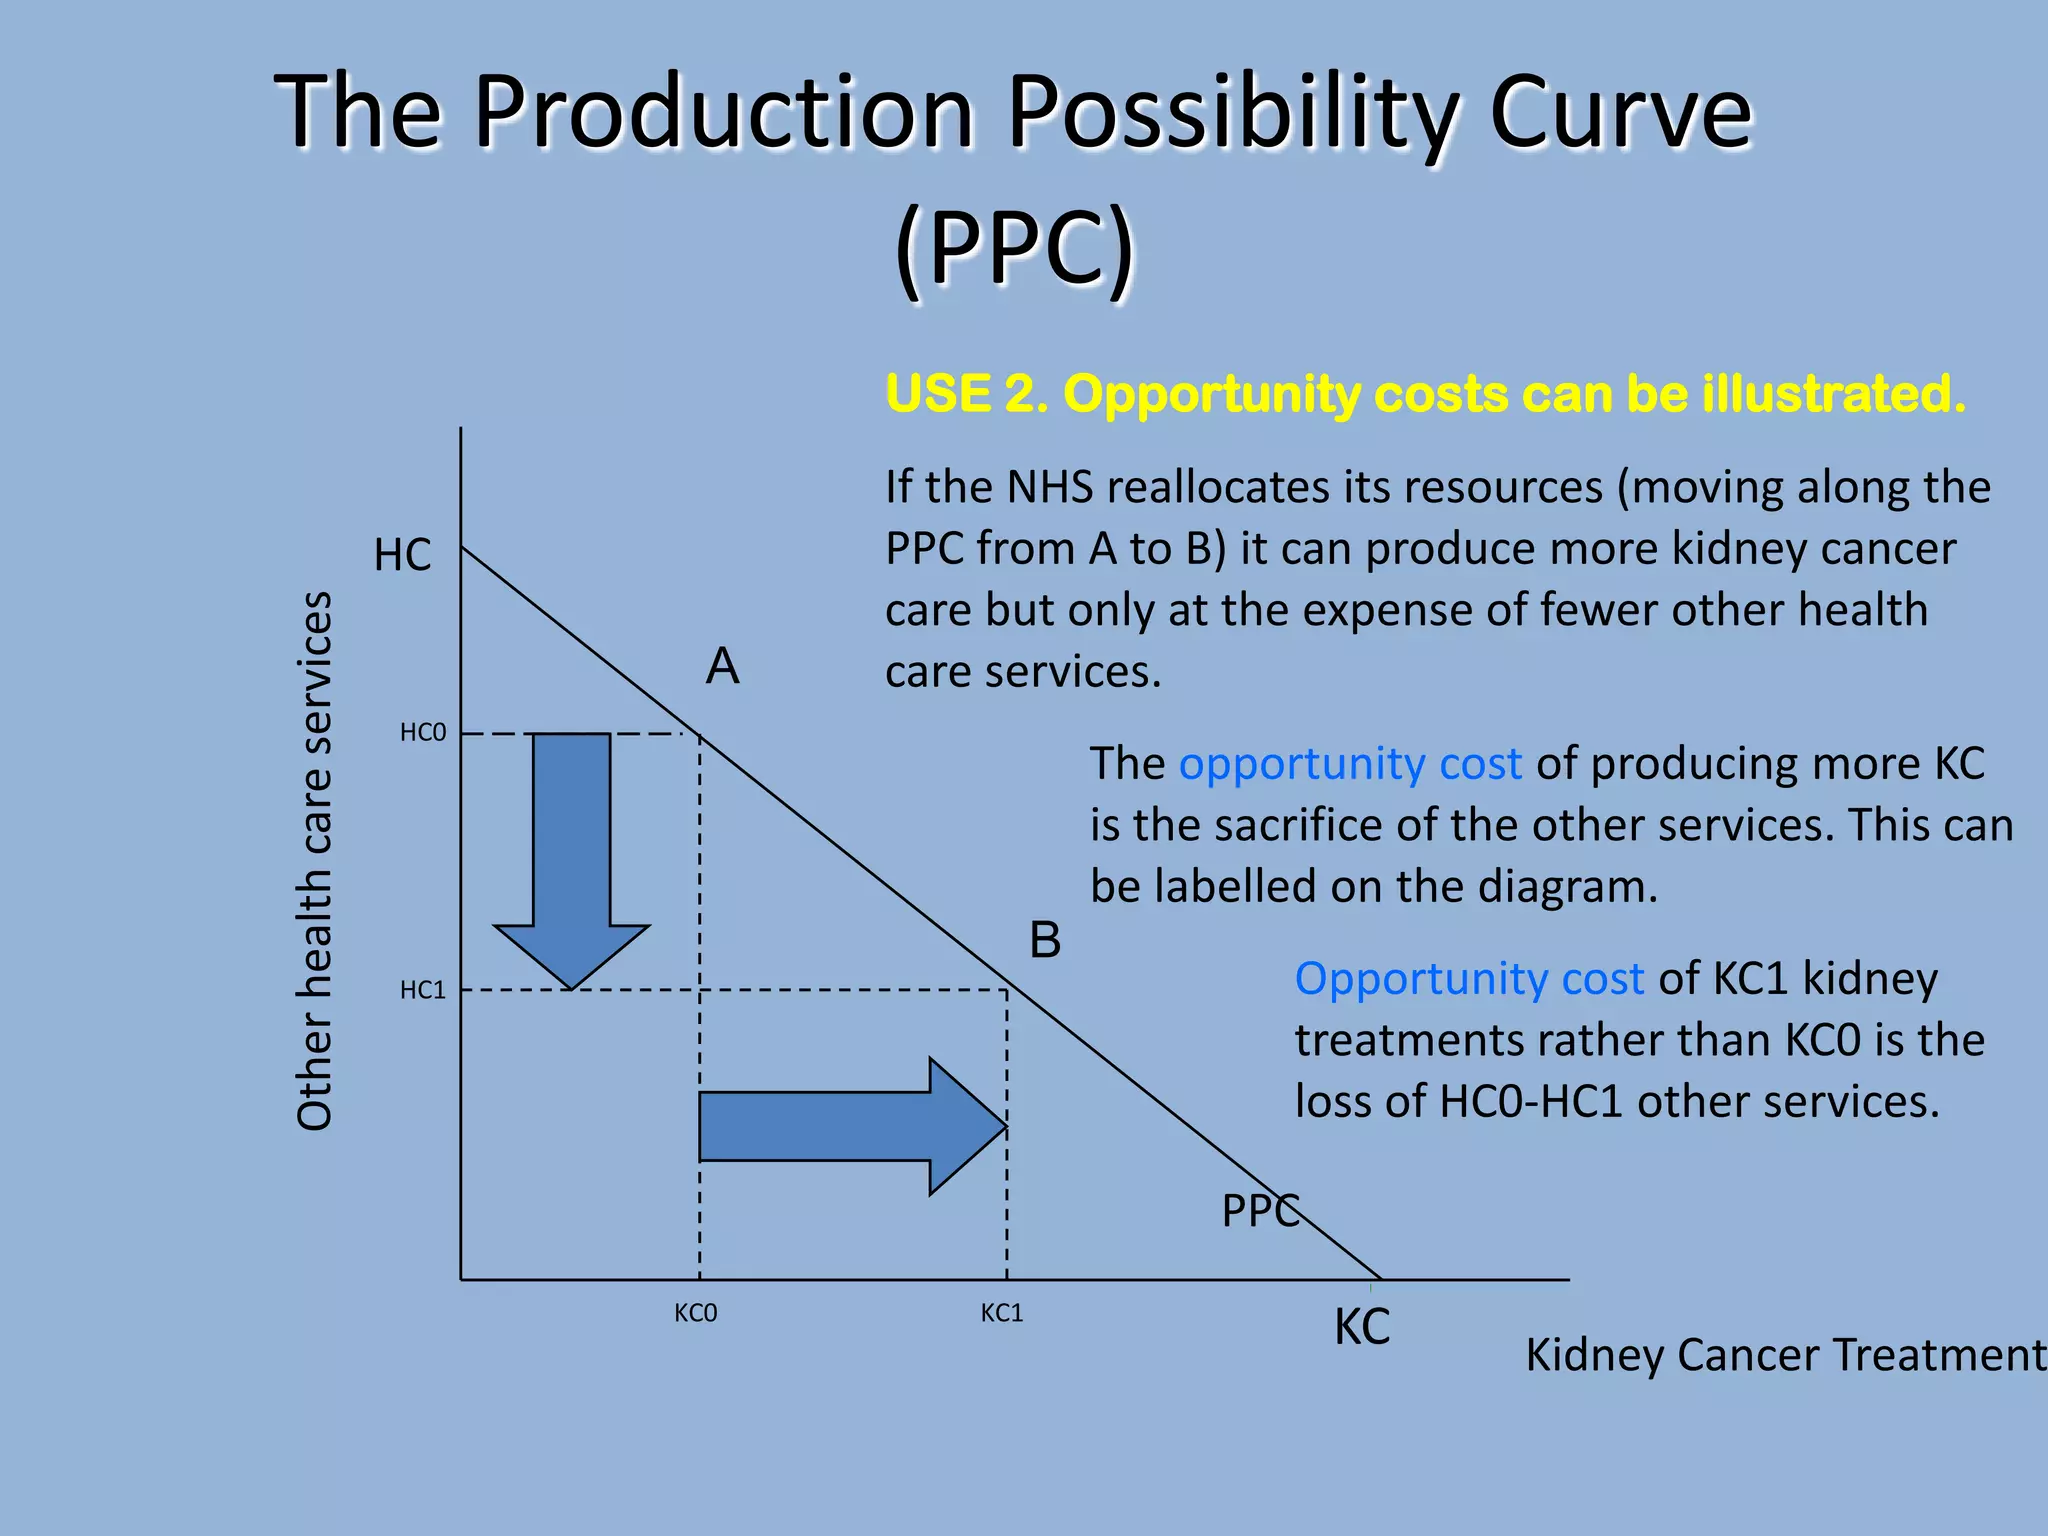
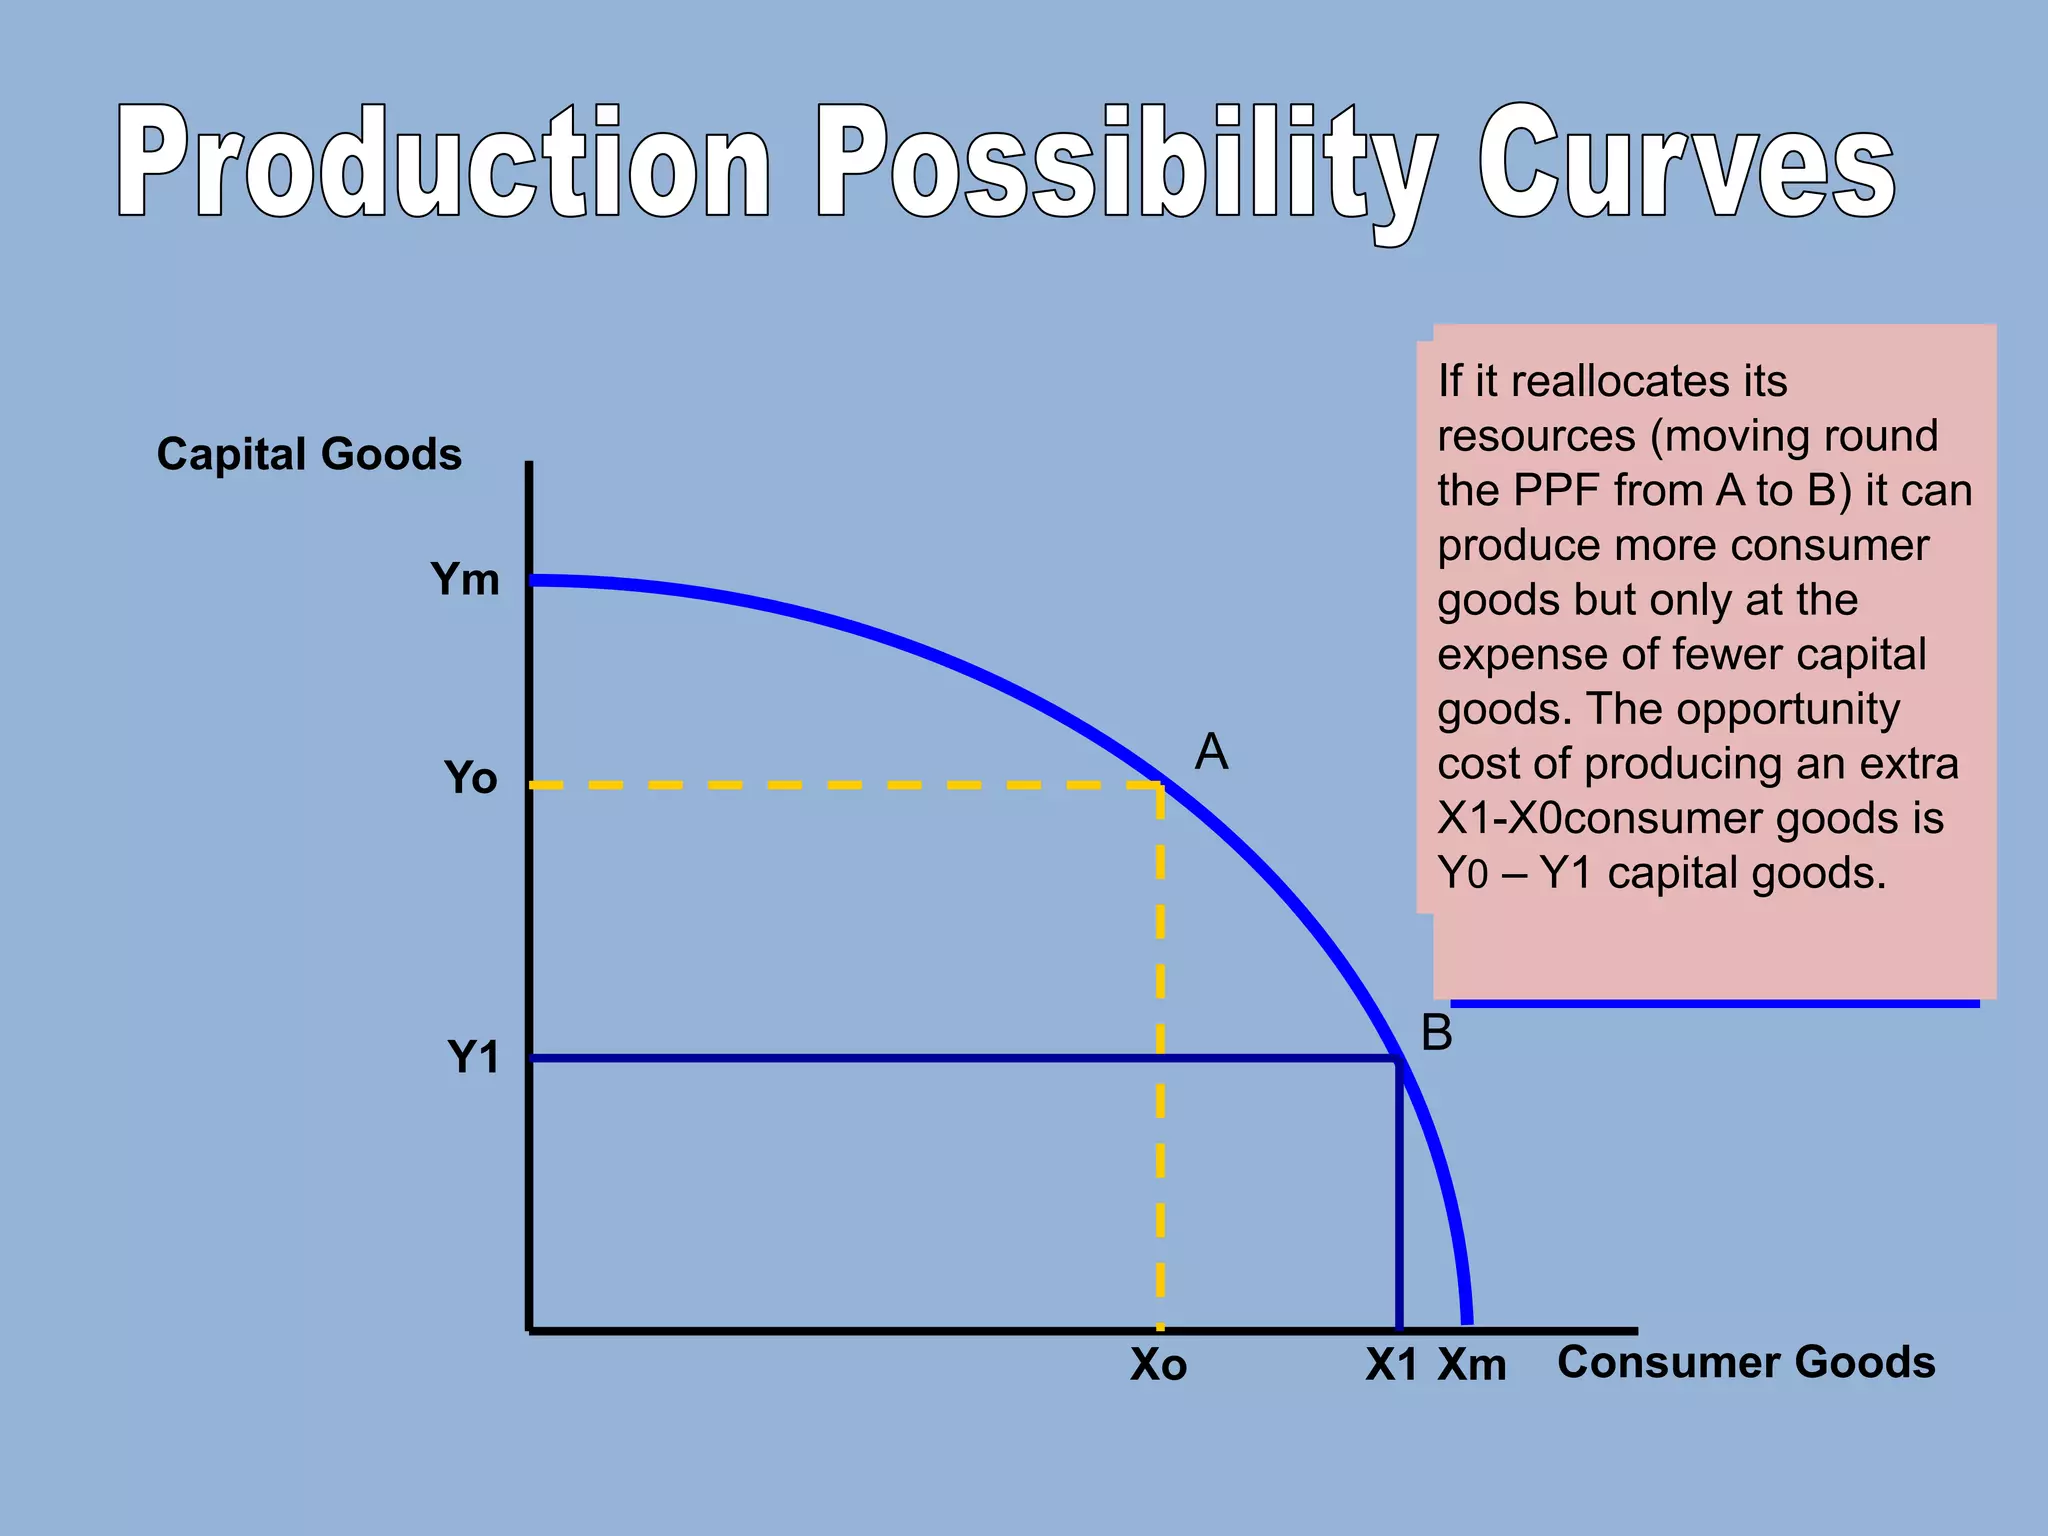
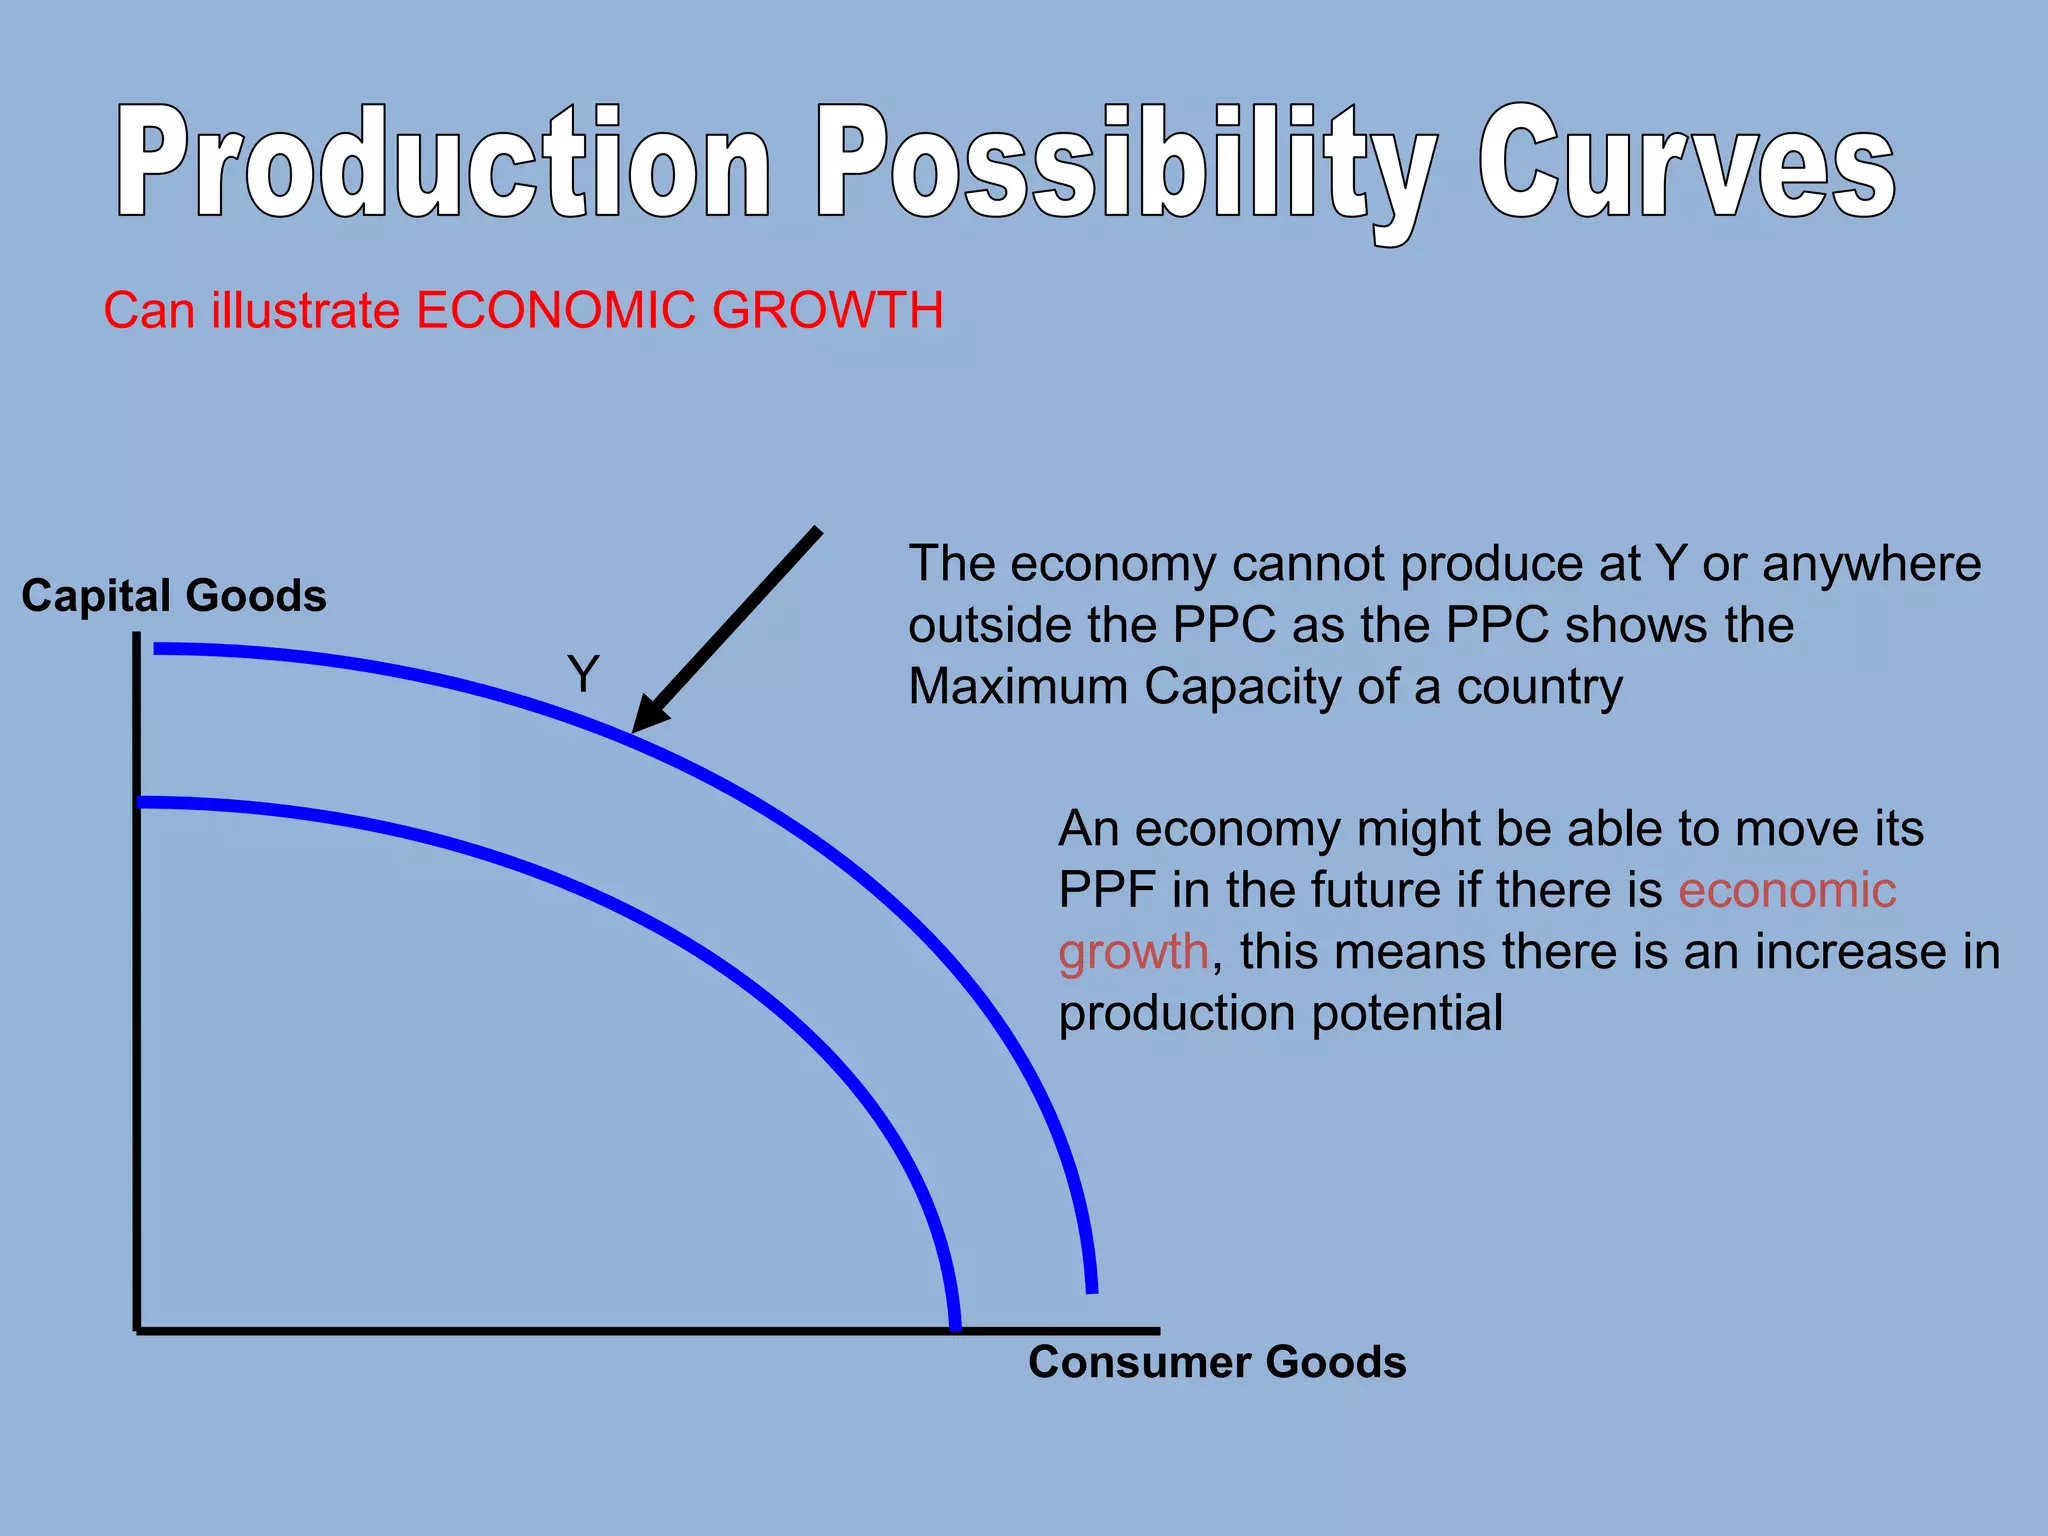
The Production Possibility Curve (PPC)

A PPC shows all the combinations of two
‘goods’ which can be provided if all
resources are being used efficiently
The Production Possibility Curve (PPC)

Other health care services

HC

HCA

A

USE 1. Showing Choices
This PPC shows all the
combinations of Kidney Cancer
Treatments and other health
care services available in the
economy.
The NHS can provide KC kidney
care treatments and no other
services, HC other services and
no kidney treatment
or any of the combinations in
between such as A where HCA
health care services and KCA
kidney treatments are provided.
PPC

KCA

KC
Kidney Cancer Treatment
The Production Possibility Curve
(PPC)
USE 2. Opportunity costs can be illustrated.

Other health care services

HC
A

If the NHS reallocates its resources (moving along the
PPC from A to B) it can produce more kidney cancer
care but only at the expense of fewer other health
care services.

HC0

The opportunity cost of producing more KC
is the sacrifice of the other services. This can
be labelled on the diagram.
B

HC1

Opportunity cost of KC1 kidney
treatments rather than KC0 is the
loss of HC0-HC1 other services.
PPC

KC0

KC1

KC

Kidney Cancer Treatment
Capital Goods
Ym

A

Yo

IfIfitthe countryits at
If reallocates all
it devotes is
point A on a country
resources (moving round
Assume the capital
resources to PPF It
the PPF from A the it can
can produce to two
goods it could
can produce B)
produce more consumer
combination of Yo
produce a maximum
types of goods
goods but only at the Xo
capital goods and
of Ym. fewer capital
with its
expense ofresources
consumer goods
goods. The opportunity
– it devotes all its
If capital goods
cost of consumer extra
and producing an
resources to
X1-X0consumer goods is
consumer goods it
goods
Y0 – Y1 capital goods.

could produce a
maximum of Xm

B

Y1

Xo

X1 Xm

Consumer Goods
Productive efficiency
• The PPF is drawn on the assumption that all
resources are fully and efficiently employed
• Therefore:
– any point on the PPF shows efficient production
(Productive Efficiency)
– any point inside the PPF shows inefficient production or
unemployed resources

– any point outside the PPF is currently unobtainable
Point X is possible to achieve BUT
represents a point where some resources
are not being used efficiently

Capital Goods

Example: unemployed workers, factories
idle, production inefficiently organised

X

We are not satisfying as many of our wants as
possible

Consumer Goods
Can illustrate ECONOMIC GROWTH

Capital Goods

Y

The economy cannot produce at Y or anywhere
outside the PPC as the PPC shows the
Maximum Capacity of a country
An economy might be able to move its
PPF in the future if there is economic
growth, this means there is an increase in
production potential

Consumer Goods
Economic Growth increases the productive
potential of the economy:
An economy can grow if it increases the quantity
or quality of its factors of production.
e.g. A new technological development results in
an increase in productive potential and the
curve can move outwards.
Capital Goods

What else might cause the PPC to shift to the Right?
Remember that it is also possible for the curve to shrink
inwards.
What might cause this?
Make a note of your ideas…

Consumer Goods
Curved PPCs
When the PPC is
curved, you can see from
the diagram that in
attempting to gain equal
amounts of addition units
of manufacturing
output, the economy is
having to sacrifice
increasing amounts of
agricultural output.

Manufacturing Output

C
B
A

Why would this be the
case?
PPF

Agricultural Output
Curved PPCs
The Opportunity cost of producing more manufactured
goods is increasing as we give up increasing amounts
of agricultural products to achieve it.
The reason is that different factors of production have
different properties or skills and as we concentrate
more and more on the production of one thing we
have to start using resources that are less and less
suitable for it.

Production Possibility Curves

  • 1.
    The Production PossibilityCurve (PPC) A PPC shows all the combinations of two ‘goods’ which can be provided if all resources are being used efficiently
  • 2.
    The Production PossibilityCurve (PPC) Other health care services HC HCA A USE 1. Showing Choices This PPC shows all the combinations of Kidney Cancer Treatments and other health care services available in the economy. The NHS can provide KC kidney care treatments and no other services, HC other services and no kidney treatment or any of the combinations in between such as A where HCA health care services and KCA kidney treatments are provided. PPC KCA KC Kidney Cancer Treatment
  • 3.
    The Production PossibilityCurve (PPC) USE 2. Opportunity costs can be illustrated. Other health care services HC A If the NHS reallocates its resources (moving along the PPC from A to B) it can produce more kidney cancer care but only at the expense of fewer other health care services. HC0 The opportunity cost of producing more KC is the sacrifice of the other services. This can be labelled on the diagram. B HC1 Opportunity cost of KC1 kidney treatments rather than KC0 is the loss of HC0-HC1 other services. PPC KC0 KC1 KC Kidney Cancer Treatment
  • 4.
    Capital Goods Ym A Yo IfIfitthe countryitsat If reallocates all it devotes is point A on a country resources (moving round Assume the capital resources to PPF It the PPF from A the it can can produce to two goods it could can produce B) produce more consumer combination of Yo produce a maximum types of goods goods but only at the Xo capital goods and of Ym. fewer capital with its expense ofresources consumer goods goods. The opportunity – it devotes all its If capital goods cost of consumer extra and producing an resources to X1-X0consumer goods is consumer goods it goods Y0 – Y1 capital goods. could produce a maximum of Xm B Y1 Xo X1 Xm Consumer Goods
  • 5.
    Productive efficiency • ThePPF is drawn on the assumption that all resources are fully and efficiently employed • Therefore: – any point on the PPF shows efficient production (Productive Efficiency) – any point inside the PPF shows inefficient production or unemployed resources – any point outside the PPF is currently unobtainable
  • 6.
    Point X ispossible to achieve BUT represents a point where some resources are not being used efficiently Capital Goods Example: unemployed workers, factories idle, production inefficiently organised X We are not satisfying as many of our wants as possible Consumer Goods
  • 7.
    Can illustrate ECONOMICGROWTH Capital Goods Y The economy cannot produce at Y or anywhere outside the PPC as the PPC shows the Maximum Capacity of a country An economy might be able to move its PPF in the future if there is economic growth, this means there is an increase in production potential Consumer Goods
  • 8.
    Economic Growth increasesthe productive potential of the economy: An economy can grow if it increases the quantity or quality of its factors of production. e.g. A new technological development results in an increase in productive potential and the curve can move outwards.
  • 9.
    Capital Goods What elsemight cause the PPC to shift to the Right? Remember that it is also possible for the curve to shrink inwards. What might cause this? Make a note of your ideas… Consumer Goods
  • 10.
    Curved PPCs When thePPC is curved, you can see from the diagram that in attempting to gain equal amounts of addition units of manufacturing output, the economy is having to sacrifice increasing amounts of agricultural output. Manufacturing Output C B A Why would this be the case? PPF Agricultural Output
  • 11.
    Curved PPCs The Opportunitycost of producing more manufactured goods is increasing as we give up increasing amounts of agricultural products to achieve it. The reason is that different factors of production have different properties or skills and as we concentrate more and more on the production of one thing we have to start using resources that are less and less suitable for it.