Downloaded 1,692 times

![Some important definitions
278
strat·e·gy
strat·e·gy (stràt¹e-jê) noun
plural strat·e·gies
1. a. The science and art of using all the forces of a nation to execute approved plans as effectively as possible during peace or
war. b.
war b The science and art of military command as applied to the overall planning and conduct of large scale combat operations.
large-scale operations
2. A plan of action resulting from strategy or intended to accomplish a specific goal. See synonyms at plan.
3. The art or skill of using stratagems in endeavors such as politics and business.
[French stratégie, from Greek stratêgia, office of a general, from stratêgos, general. See stratagem.]
strategical - adjective
behaving: tactical, strategical
cunning: tactical, strategical, deep-laid, well-planned
warlike: operational, strategical, tactical[1]
strat·a·gem
strat·a·gem (stràt¹e-jem) noun
1. A military maneuver designed to deceive or surprise an enemy.
2. clever
2 A clever, often underhand scheme for achieving an objective See synonyms at artifice
objective. artifice.
[Middle English, from Old French stratageme, from Old Italian stratagemma, from Latin stratêgêma, from Greek, from stratêgein,
to be a general, from stratêgos, general : stratos, army + agein, to lead.]](https://image.slidesharecdn.com/betterperformanceinprojectmanagementthealmostcompleteguide-090722140916-phpapp01/75/Better-Performance-In-Project-Management-The-Almost-Complete-Guide-278-2048.jpg)
![Some important definitions
279
plan
plan (plàn) noun
1. A scheme, program, or method worked out beforehand for the accomplishment of an objective: a plan of attack.
2. A proposed or tentative project or course of action: had no plans for the evening.
3. A systematic arrangement of important parts; an outline or a sketch: the plan of a story.
4. d
4 A drawing or diagram made to scale showing the structure or arrangement of something.
i di d t l h i th t t t f thi
5. In perspective rendering, one of several imaginary planes perpendicular to the line of vision between the viewer and the
object being depicted.
verb
planned, plan·ning, plans verb, transitive
1. To formulate a scheme or program for the accomplishment, enactment, or attainment of: plan a campaign.
2. To have as a specific aim or purpose; intend: They plan to buy a house.
3. To draw or make a graphic representation of.
verb, intransitive
To make plans.
[French, alteration (influenced by plan, flat surface). See plain, of plant, ground plan, map (from planter, to plant, from Latin
plantâre, from planta, sole of the foot).]
— plan¹ner noun
Synonyms: plan, blueprint, design, project, scheme, strategy. The central meaning shared by these nouns is “a method or
program in accordance with which something is to be done or accomplished”: has no vacation plans; a blueprint for the
reorganization of the company; social conventions that are a product of human design; an urban-renewal project; a new scheme
for power conservation; a strategy for capturing a major market share.](https://image.slidesharecdn.com/betterperformanceinprojectmanagementthealmostcompleteguide-090722140916-phpapp01/75/Better-Performance-In-Project-Management-The-Almost-Complete-Guide-279-2048.jpg)


The document provides an extensive overview of project management, detailing its definitions, such as performance improvement and project management knowledge areas. It outlines various modules focusing on essential topics including project selection, the project life cycle, and the triple constraint, emphasizing the systematic process required for effective project management. Additionally, it offers insights into selection criteria and tools for evaluating potential projects against organizational goals.
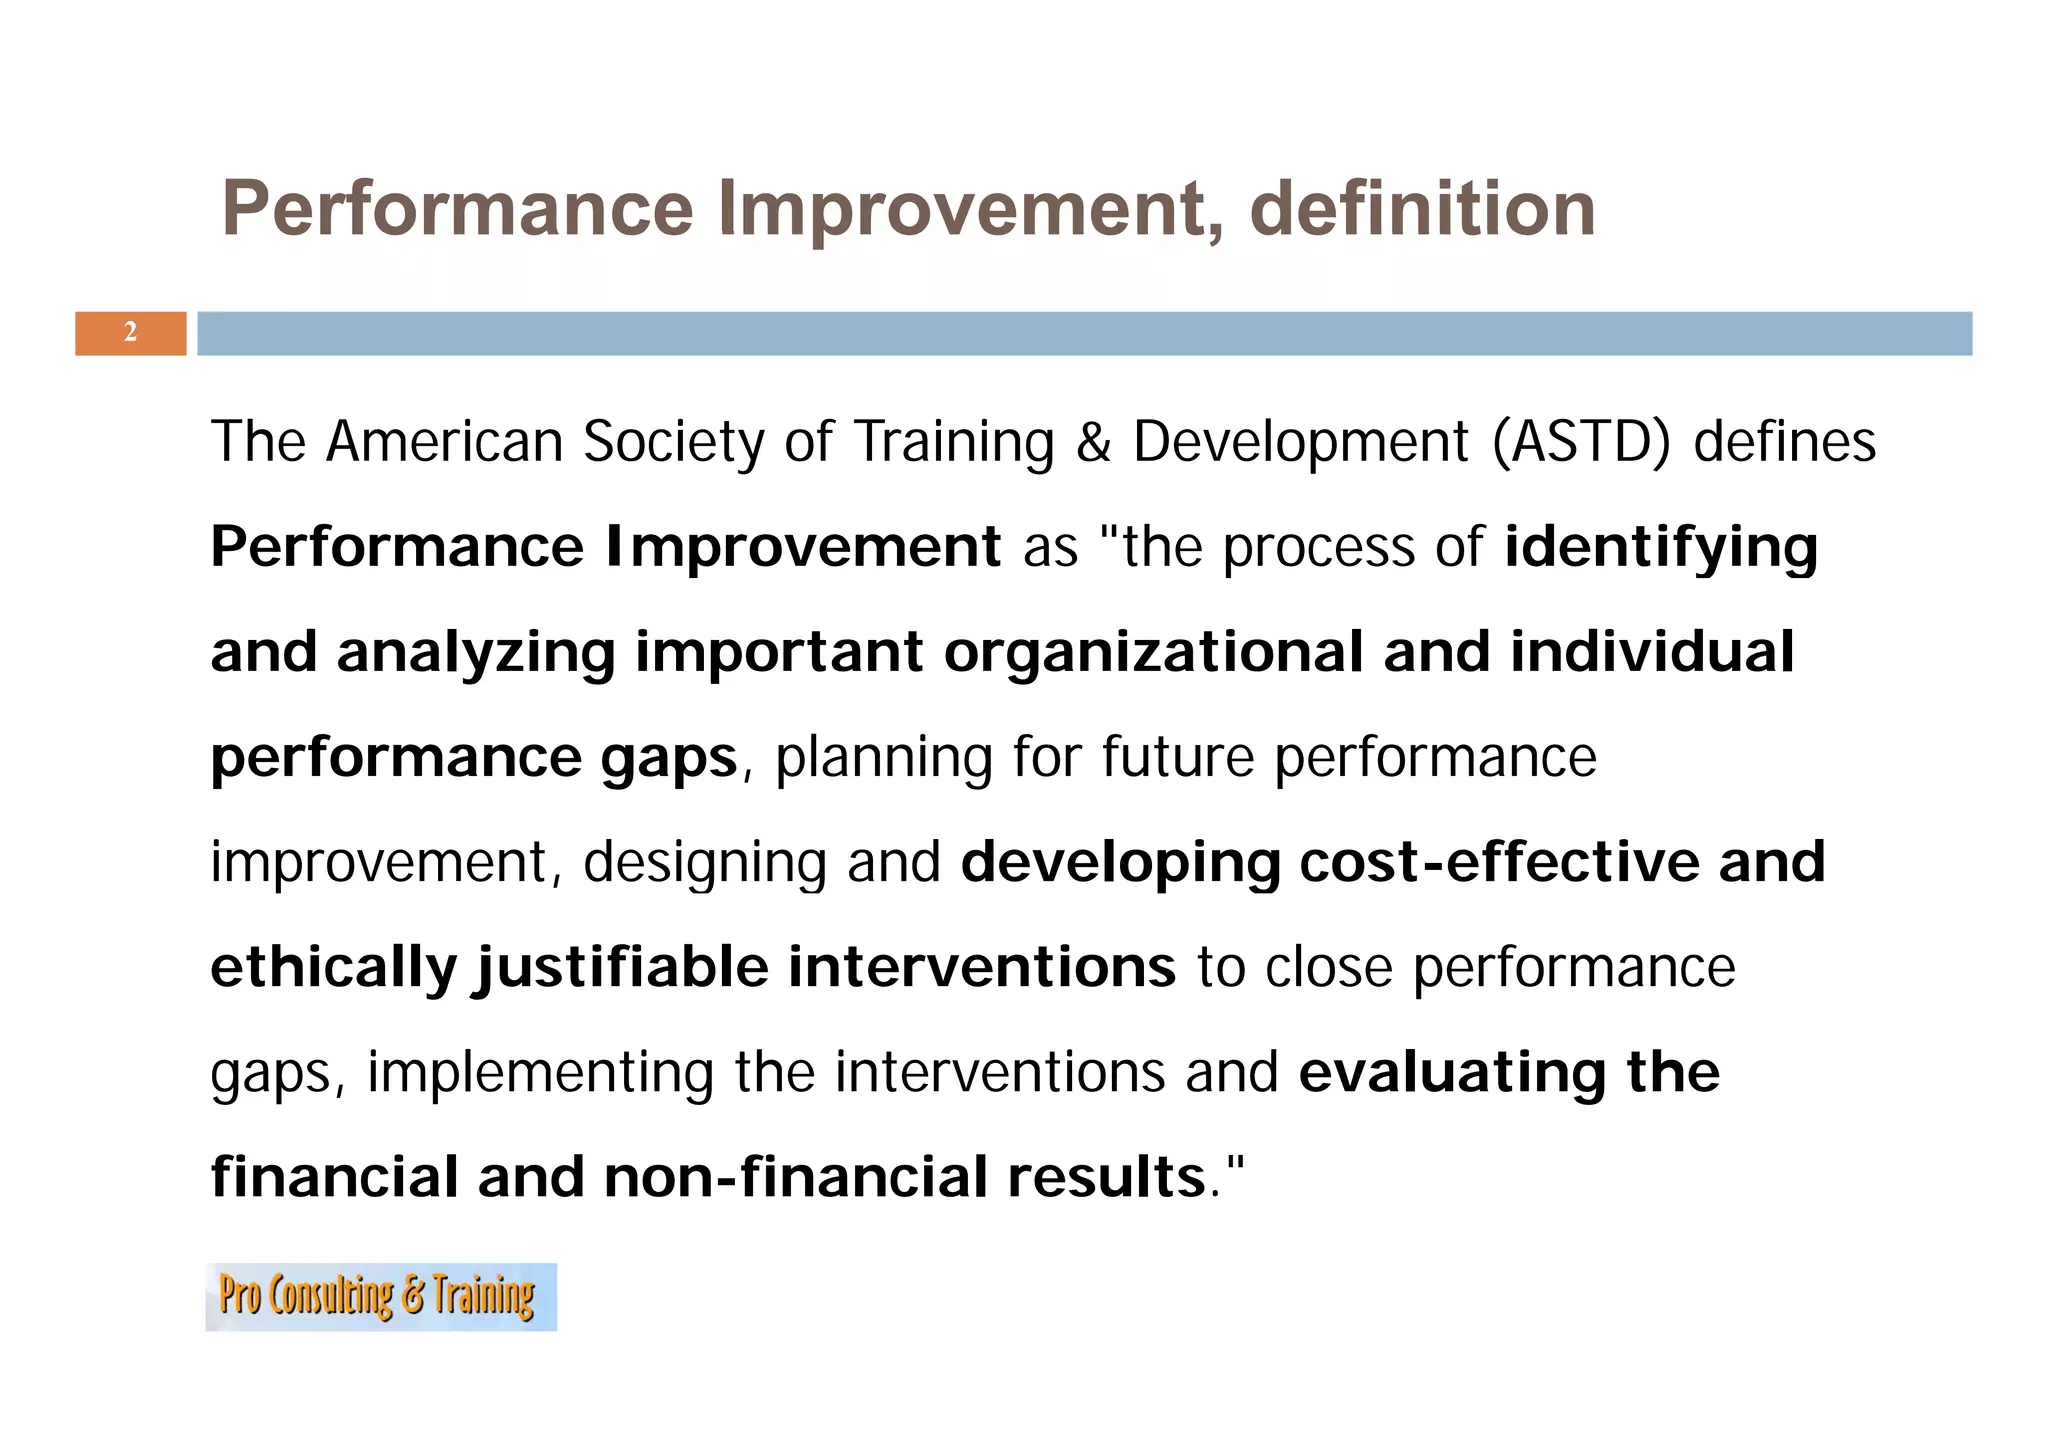
Introduction to project management concepts focusing on performance improvement processes and gaps.
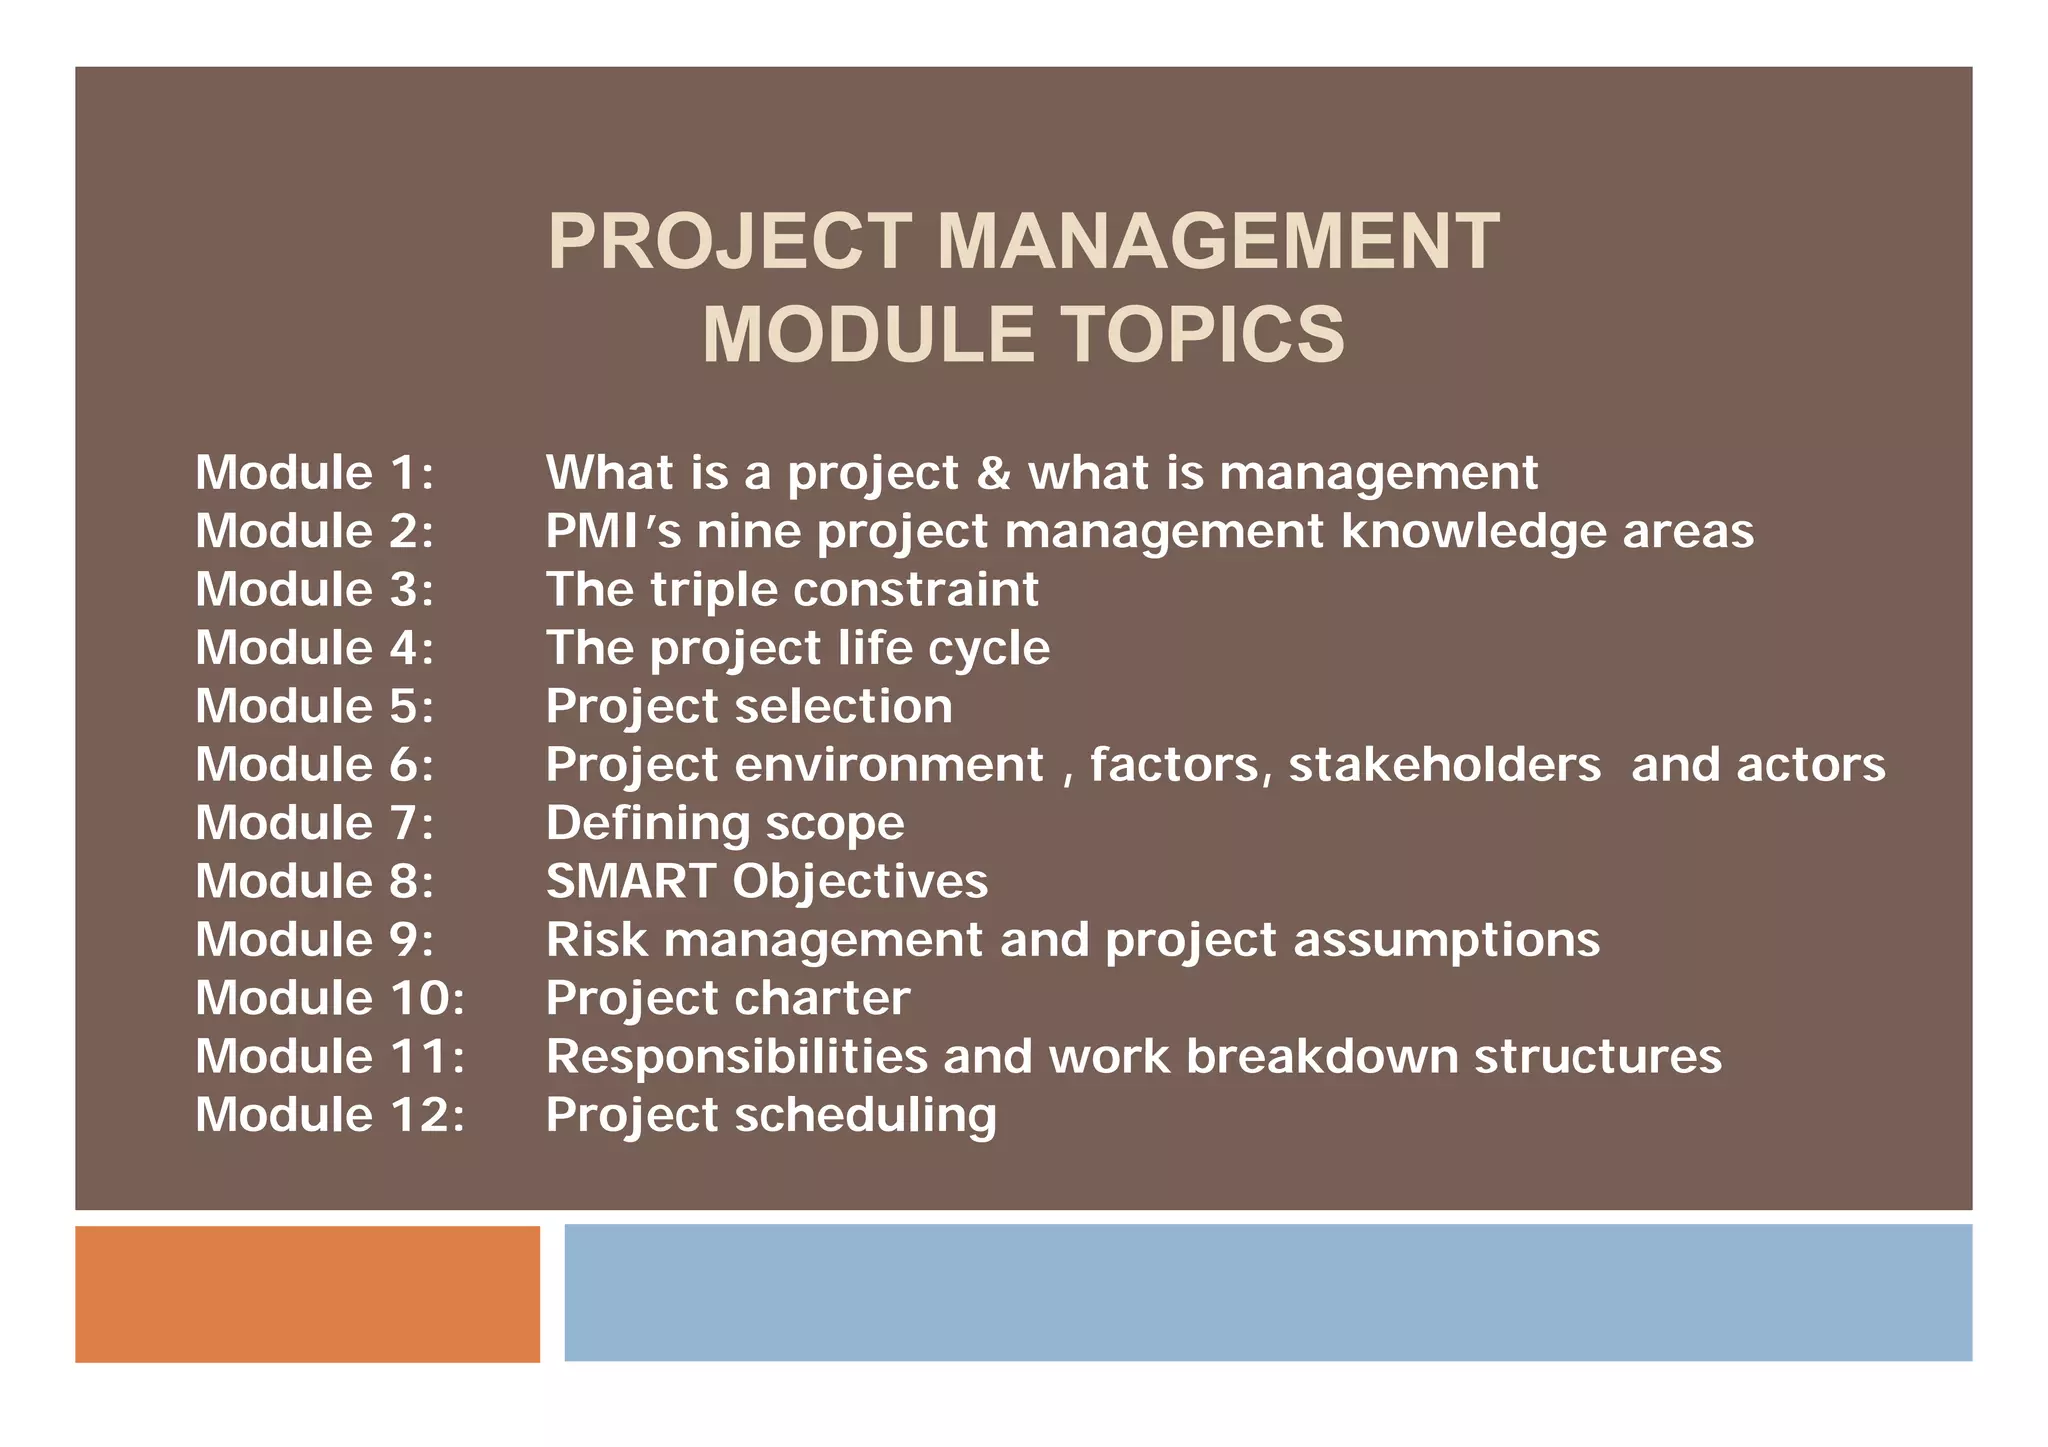
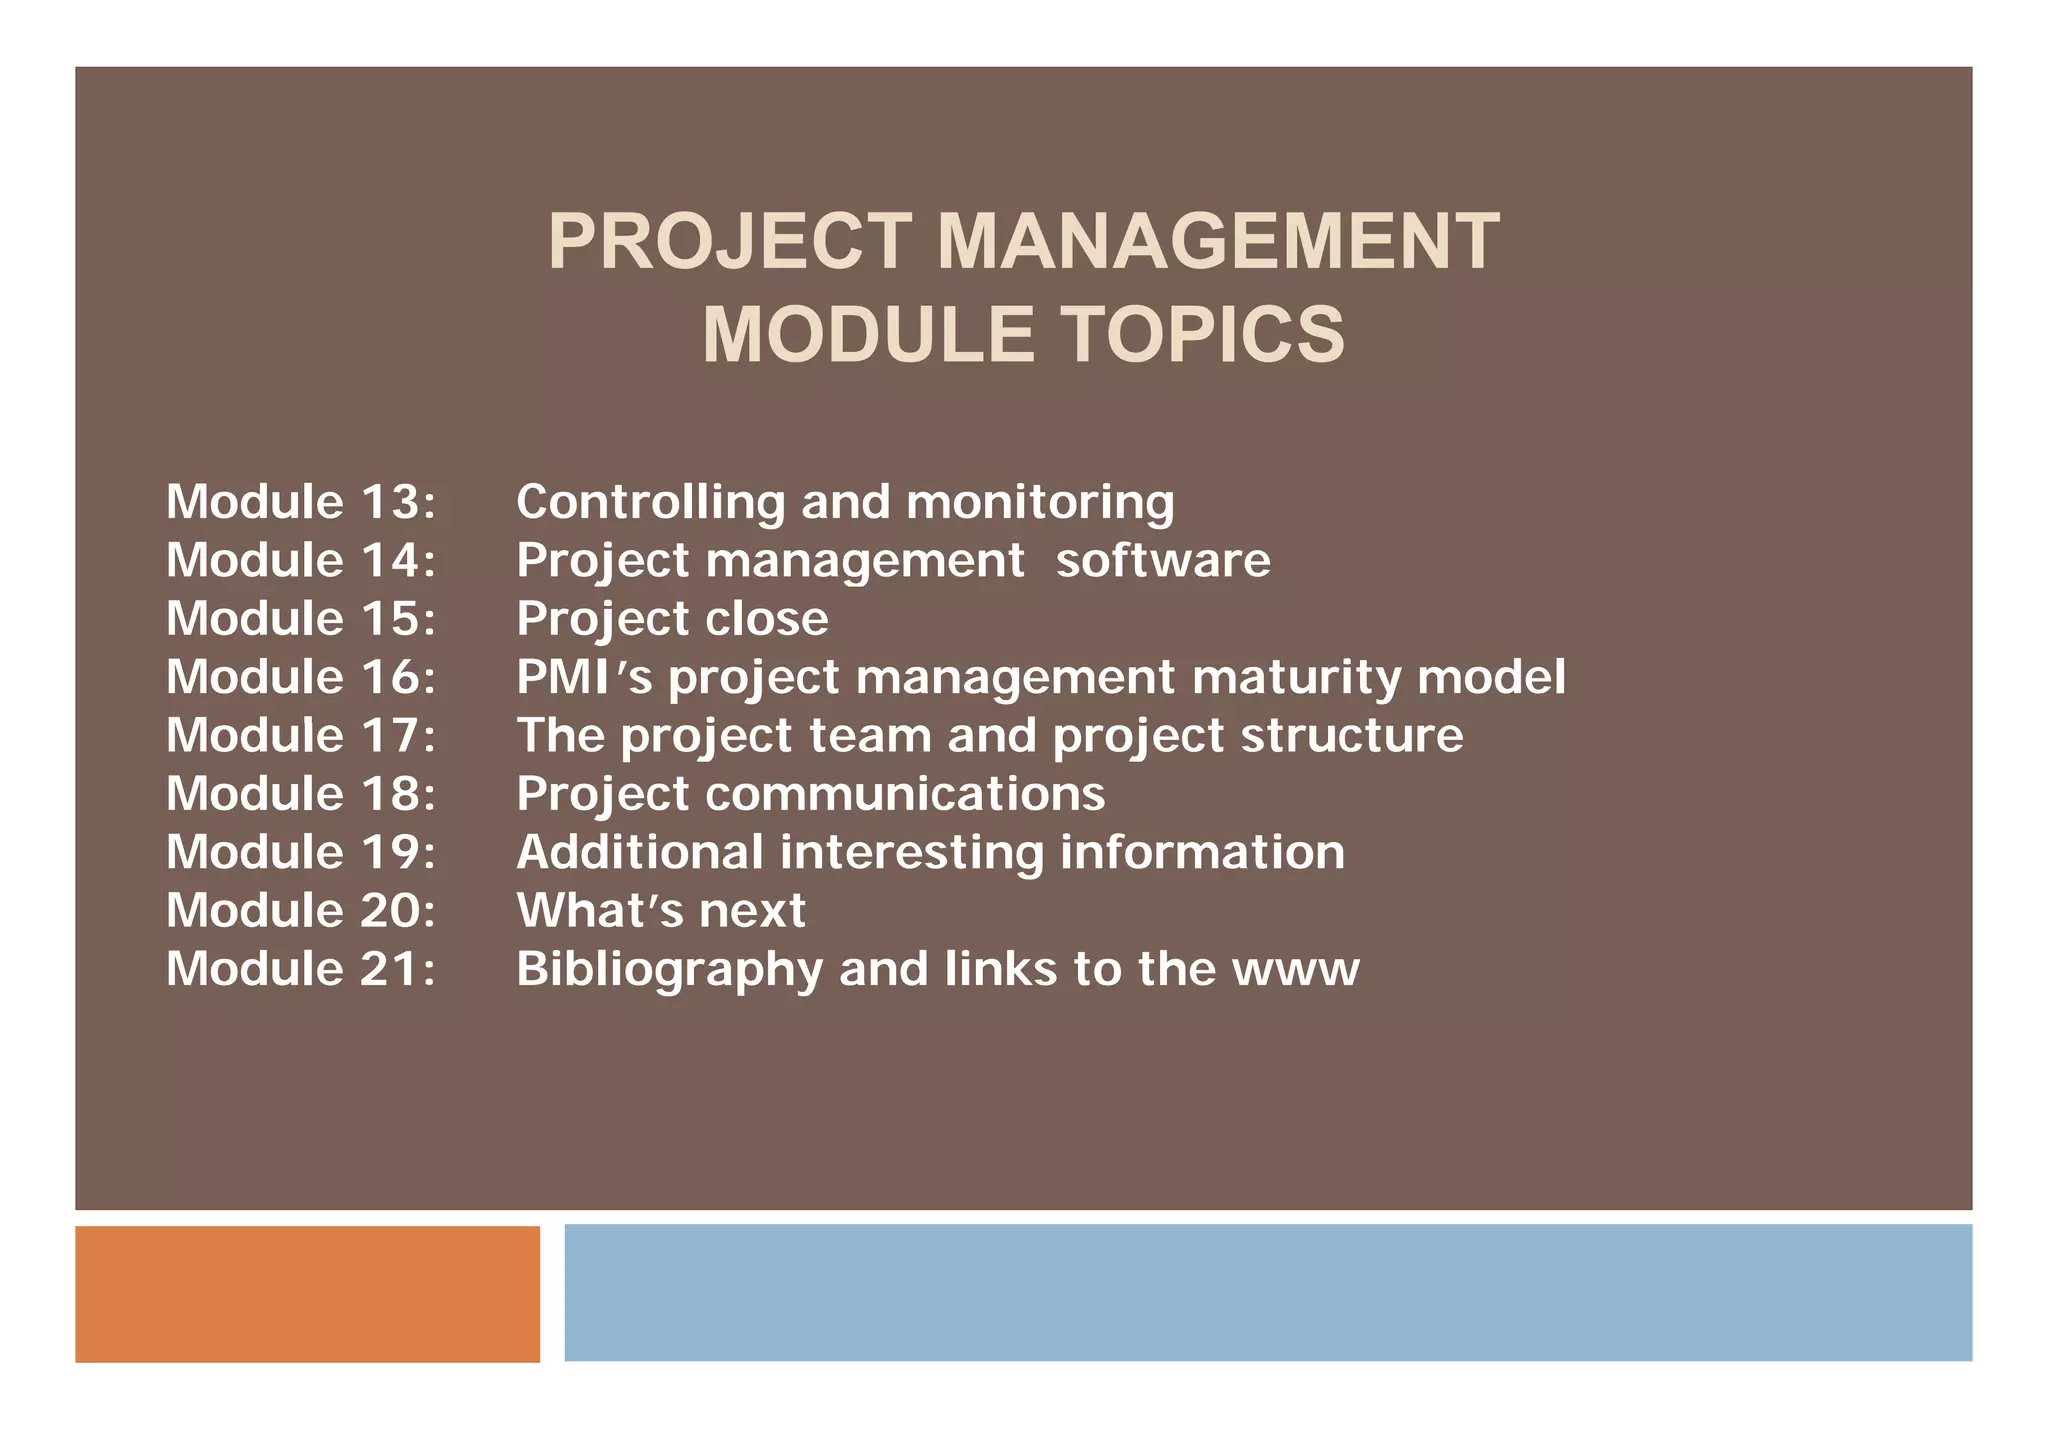
Details of various project management training modules covering essentials from defined scope to project scheduling.
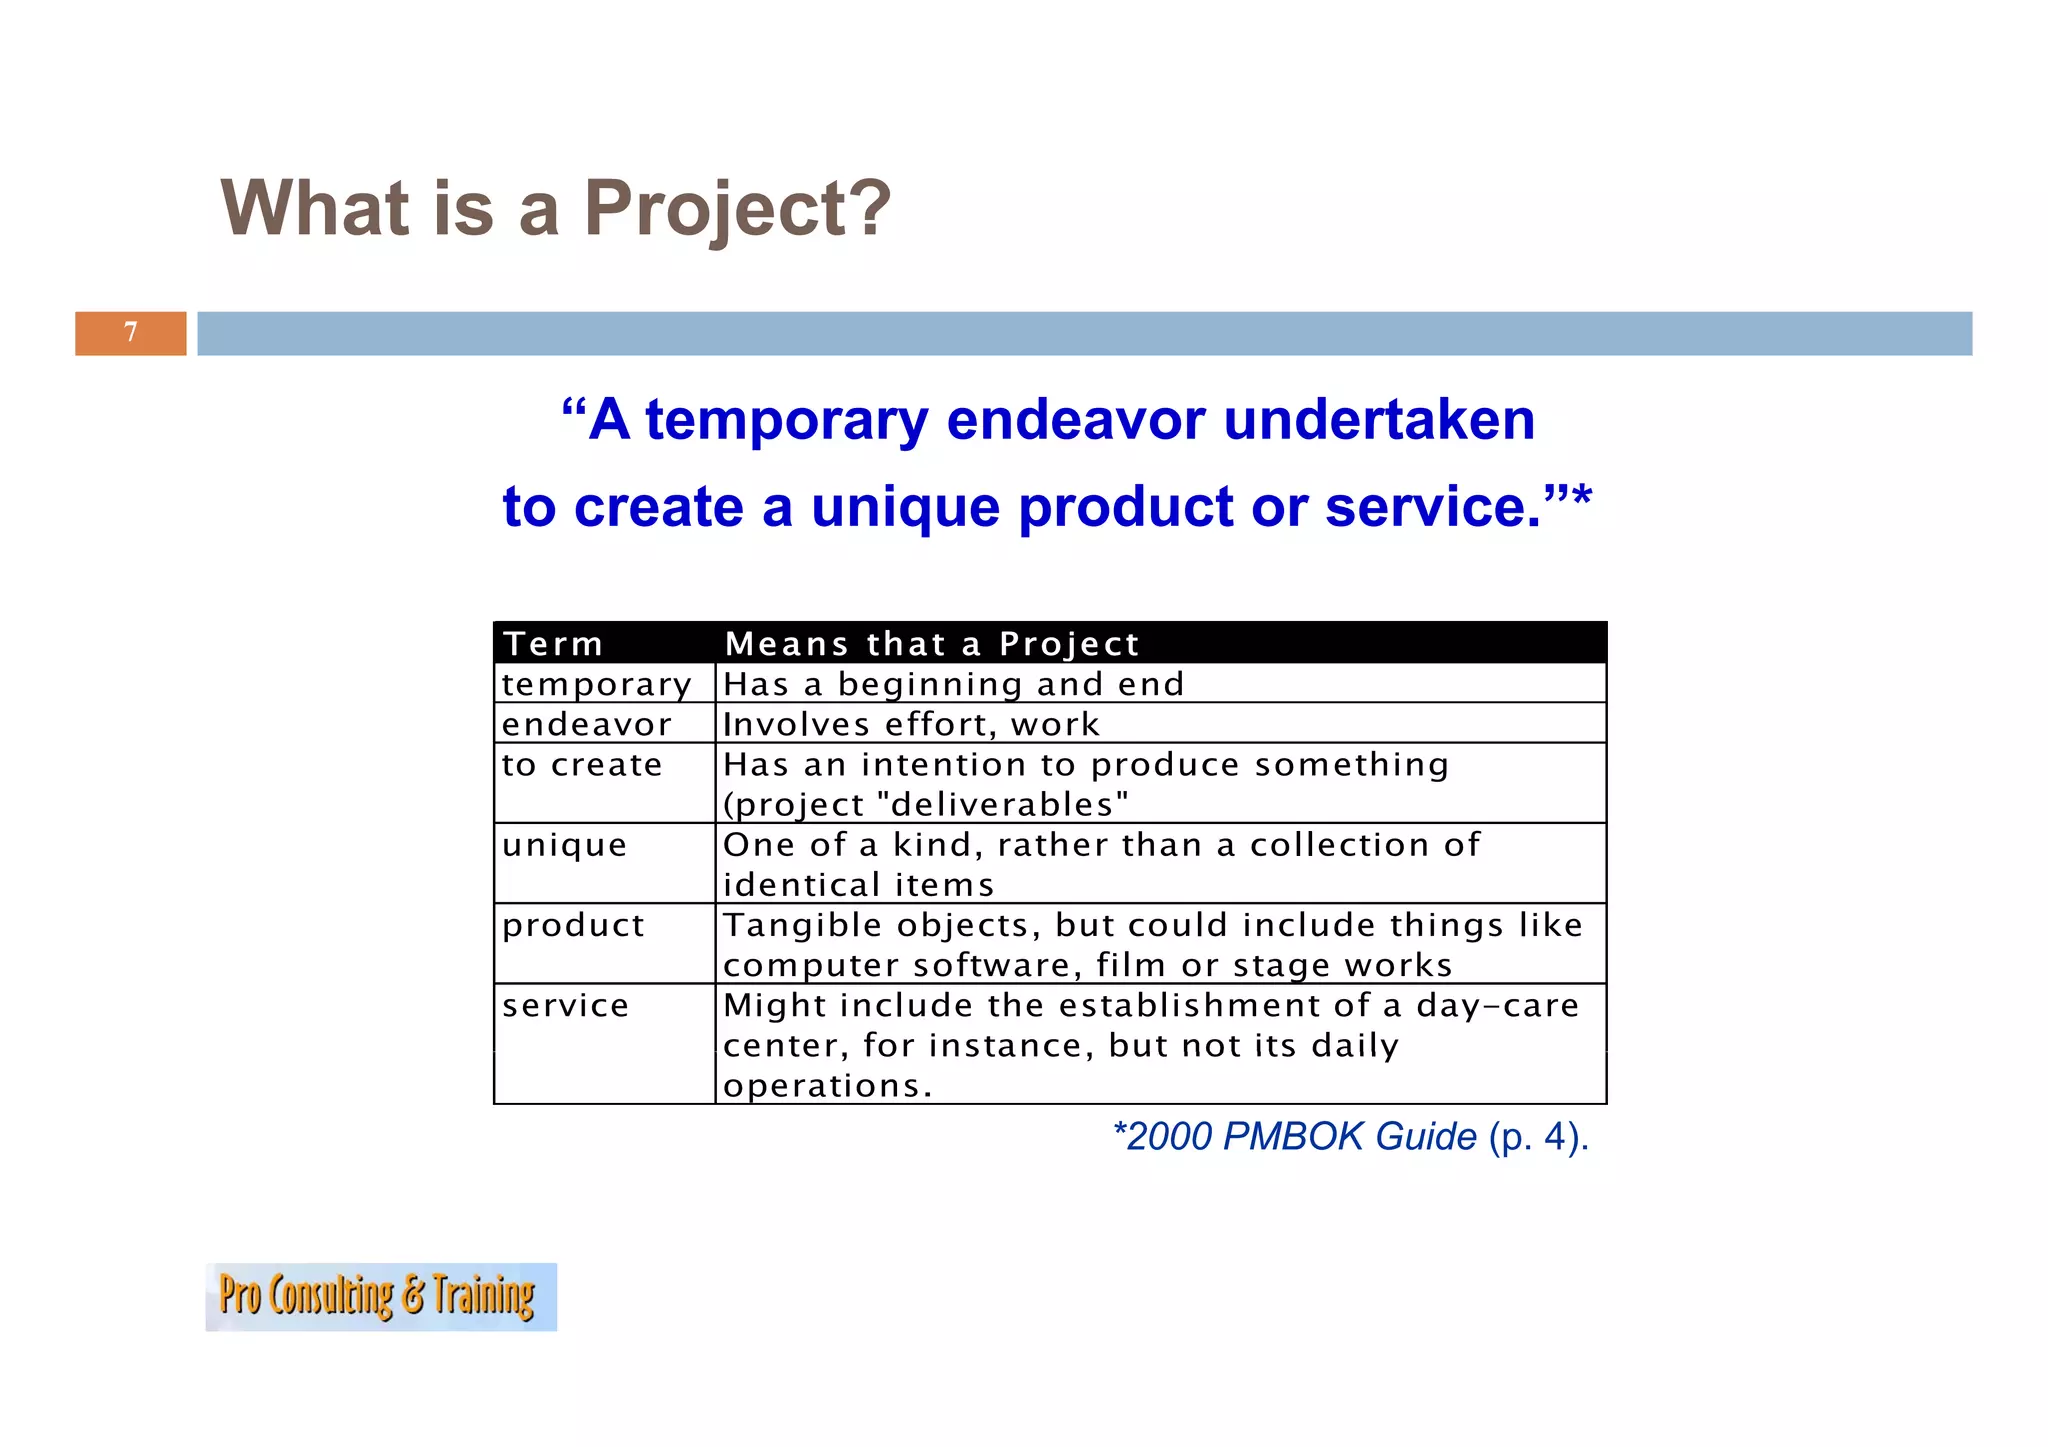
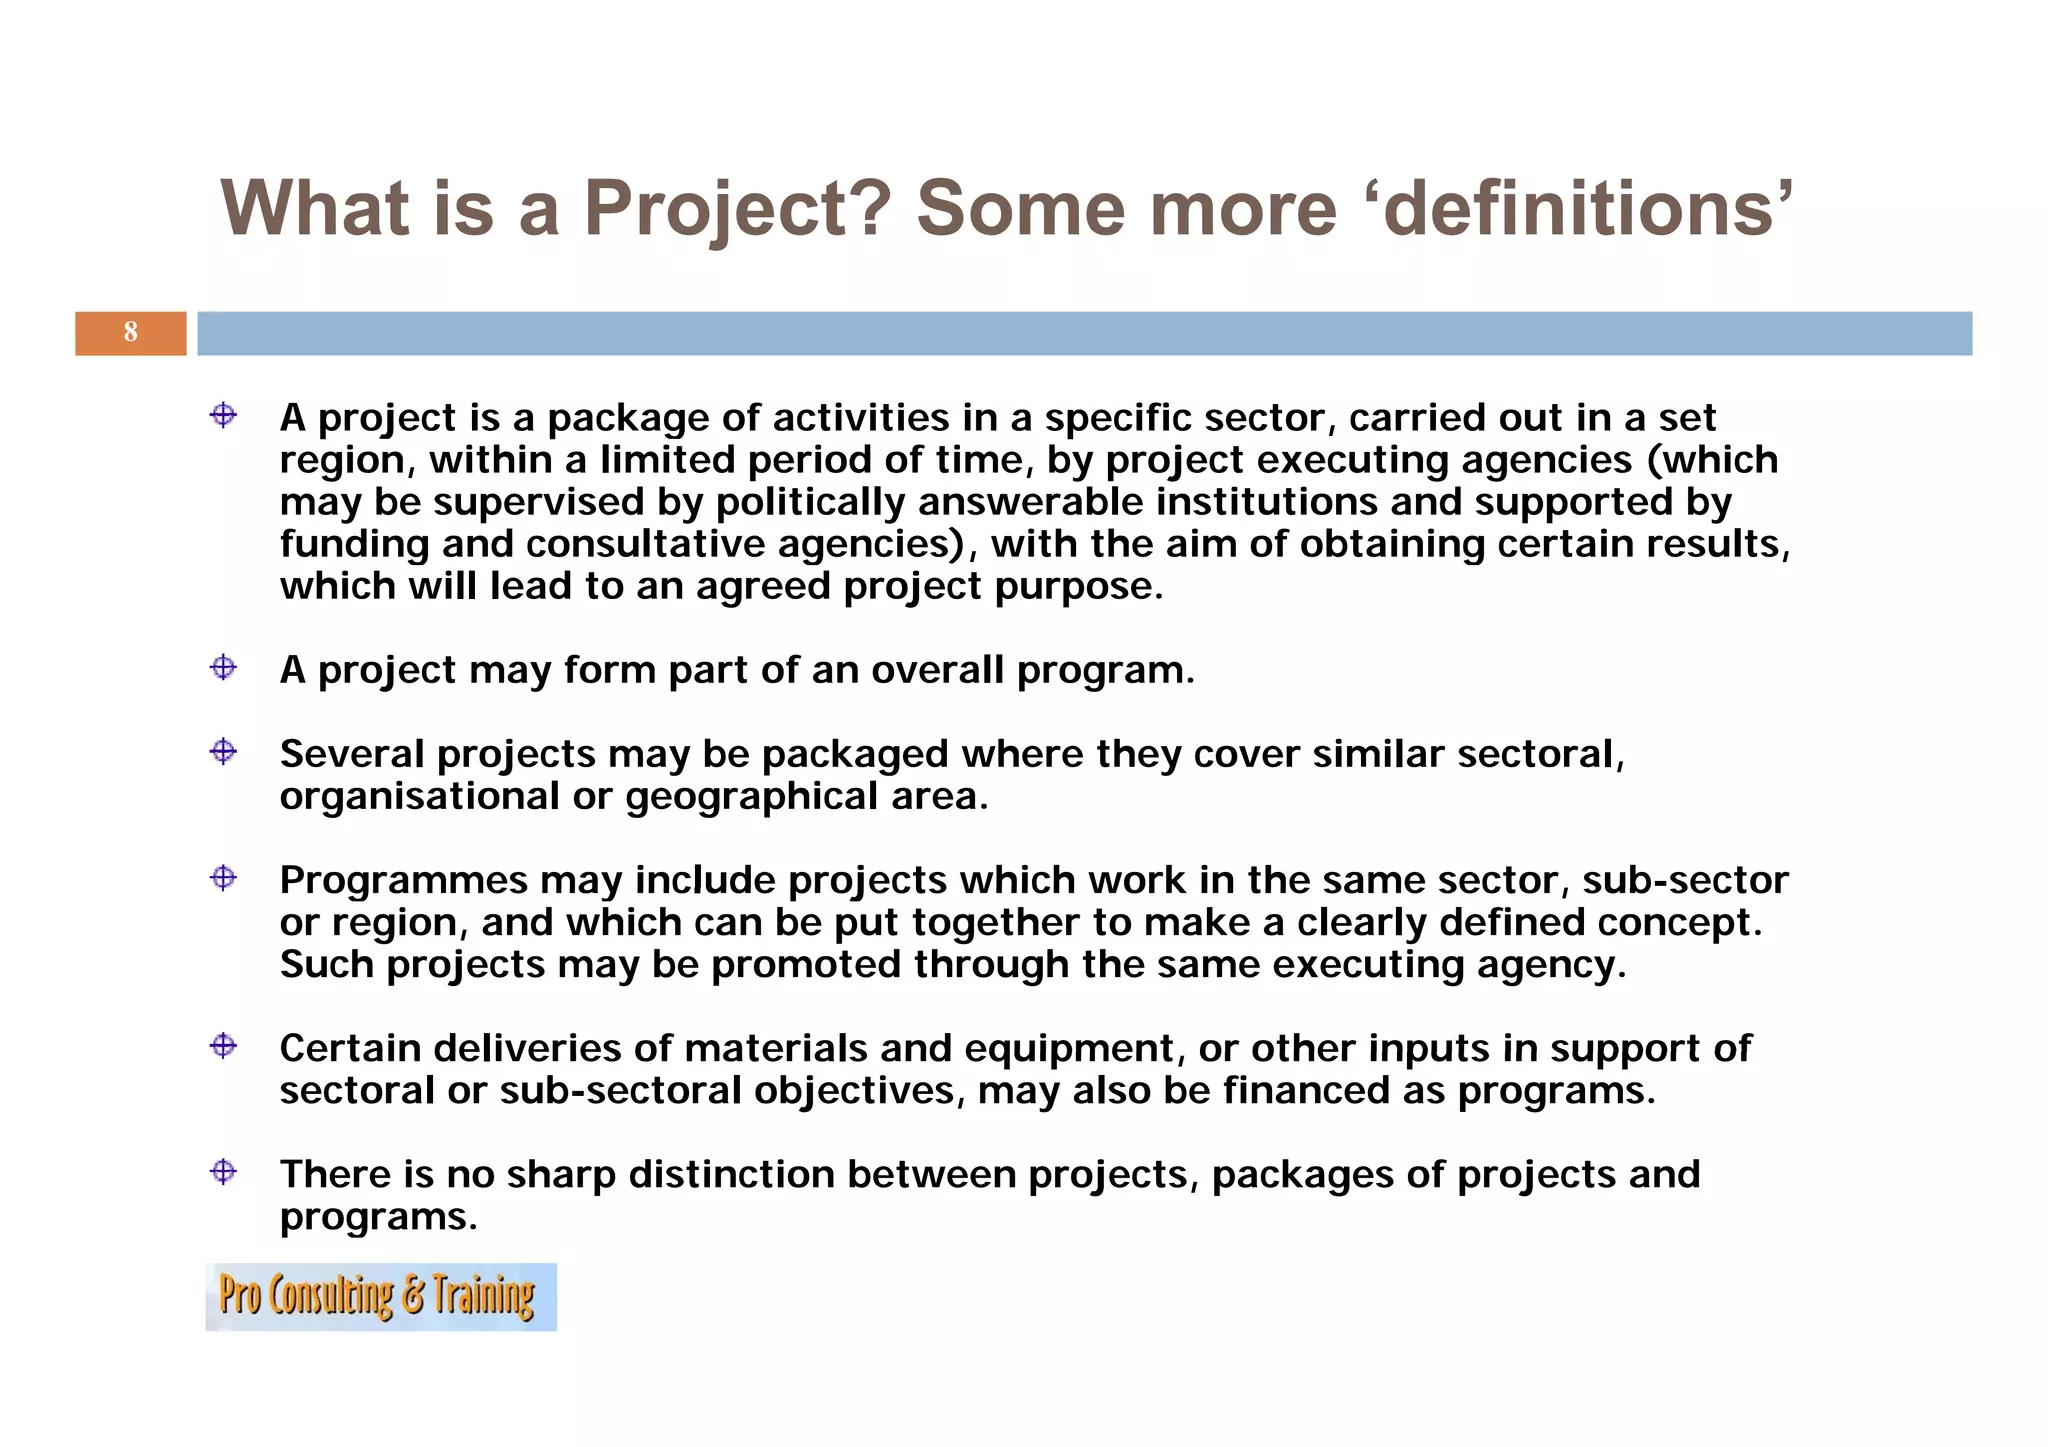
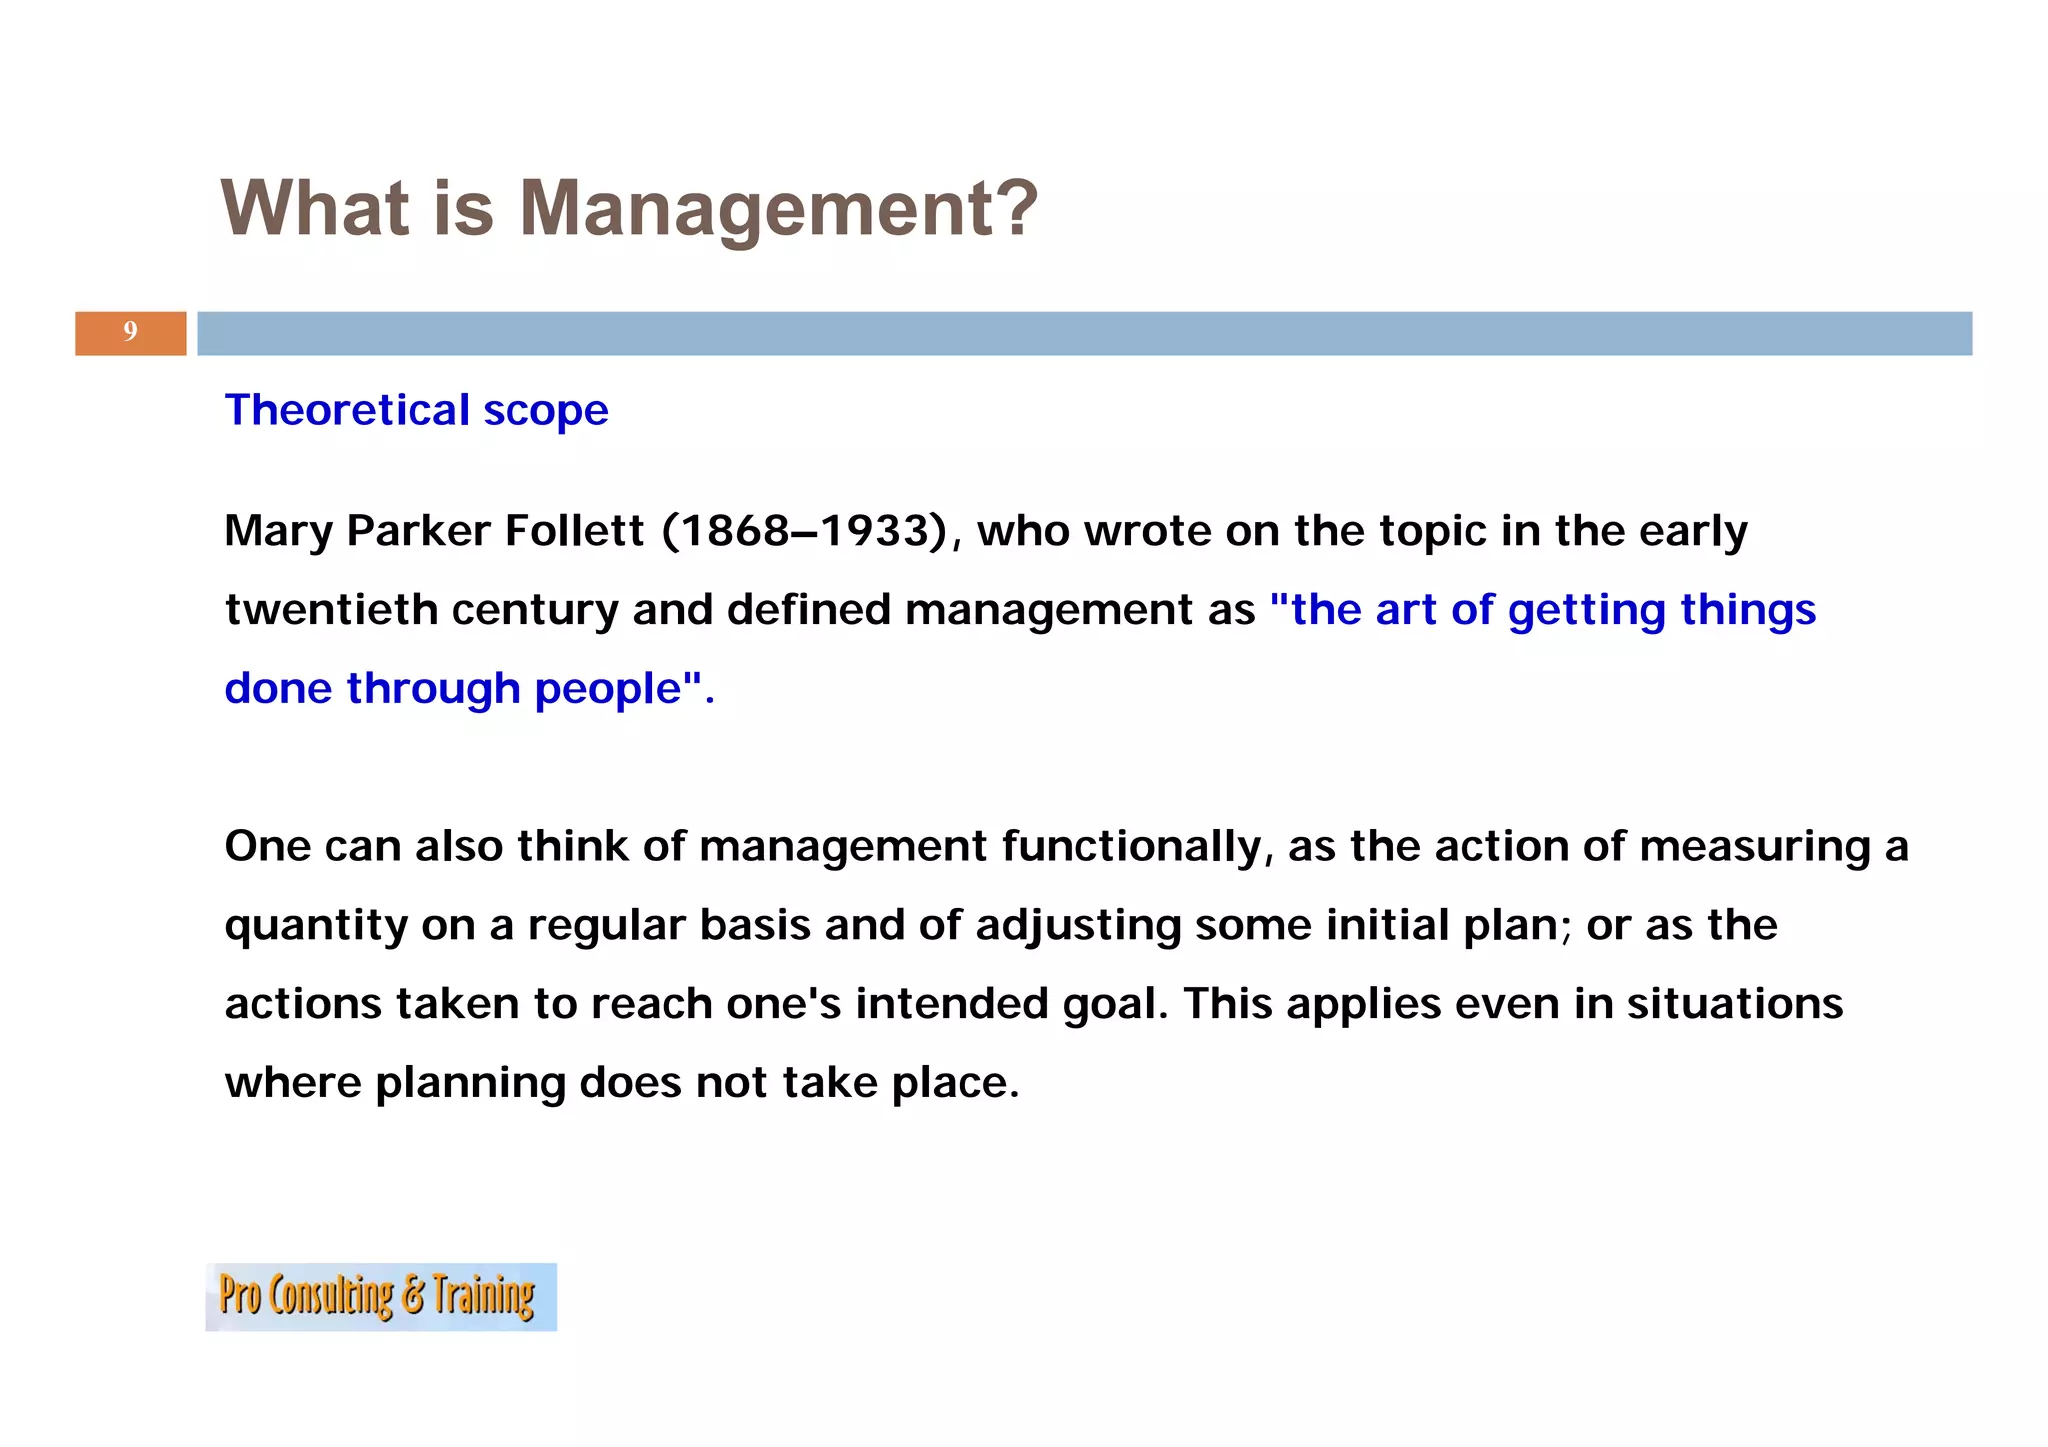
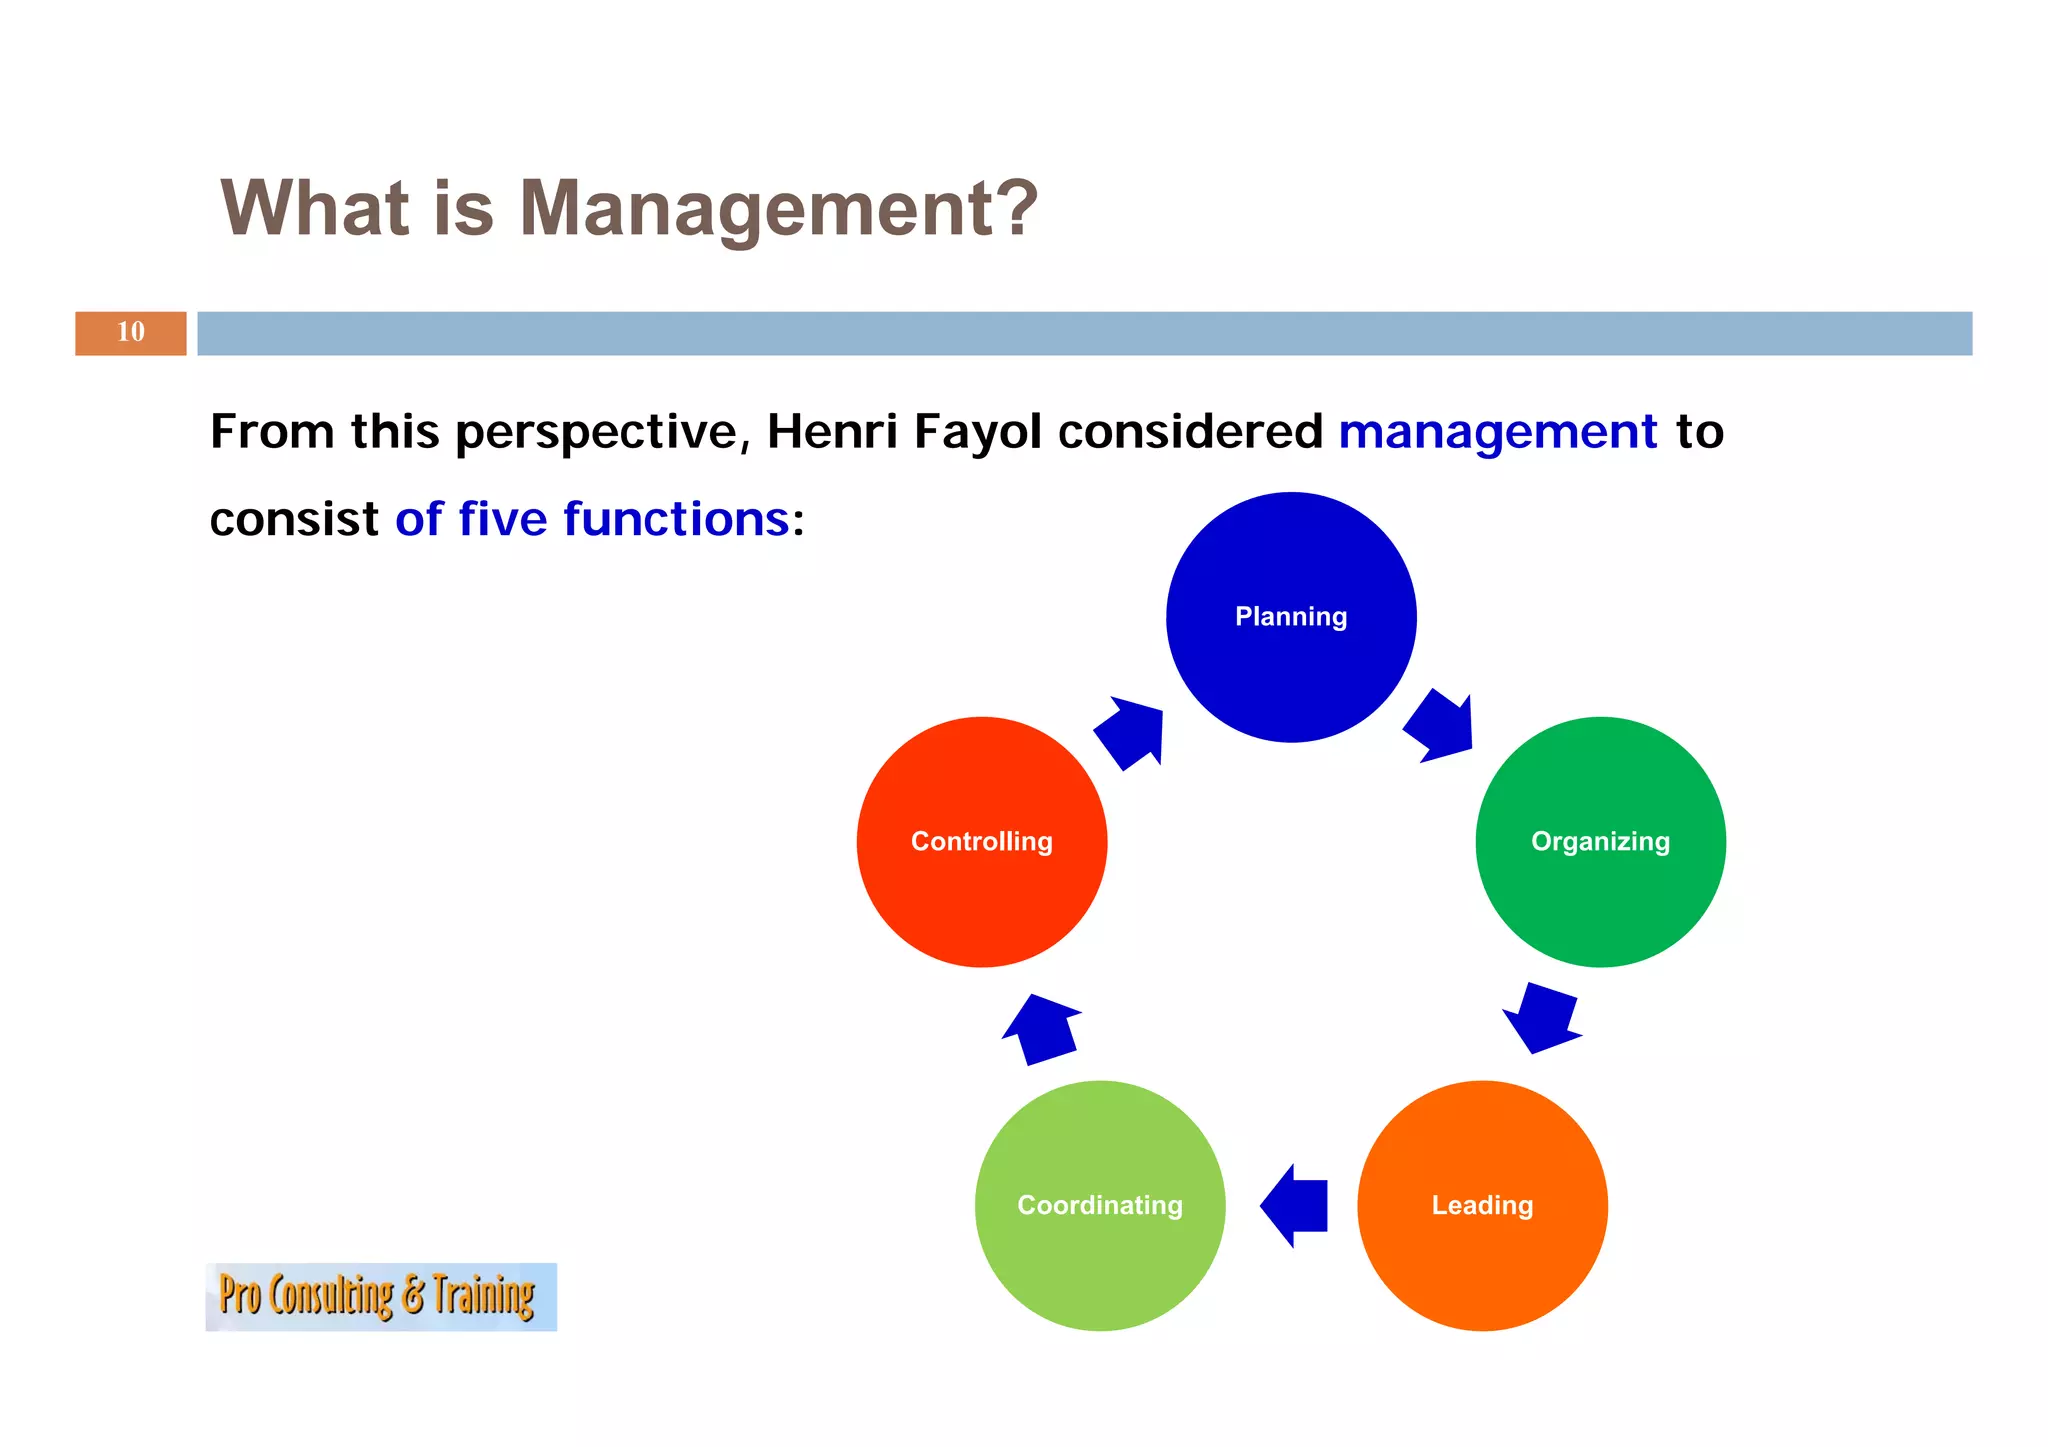
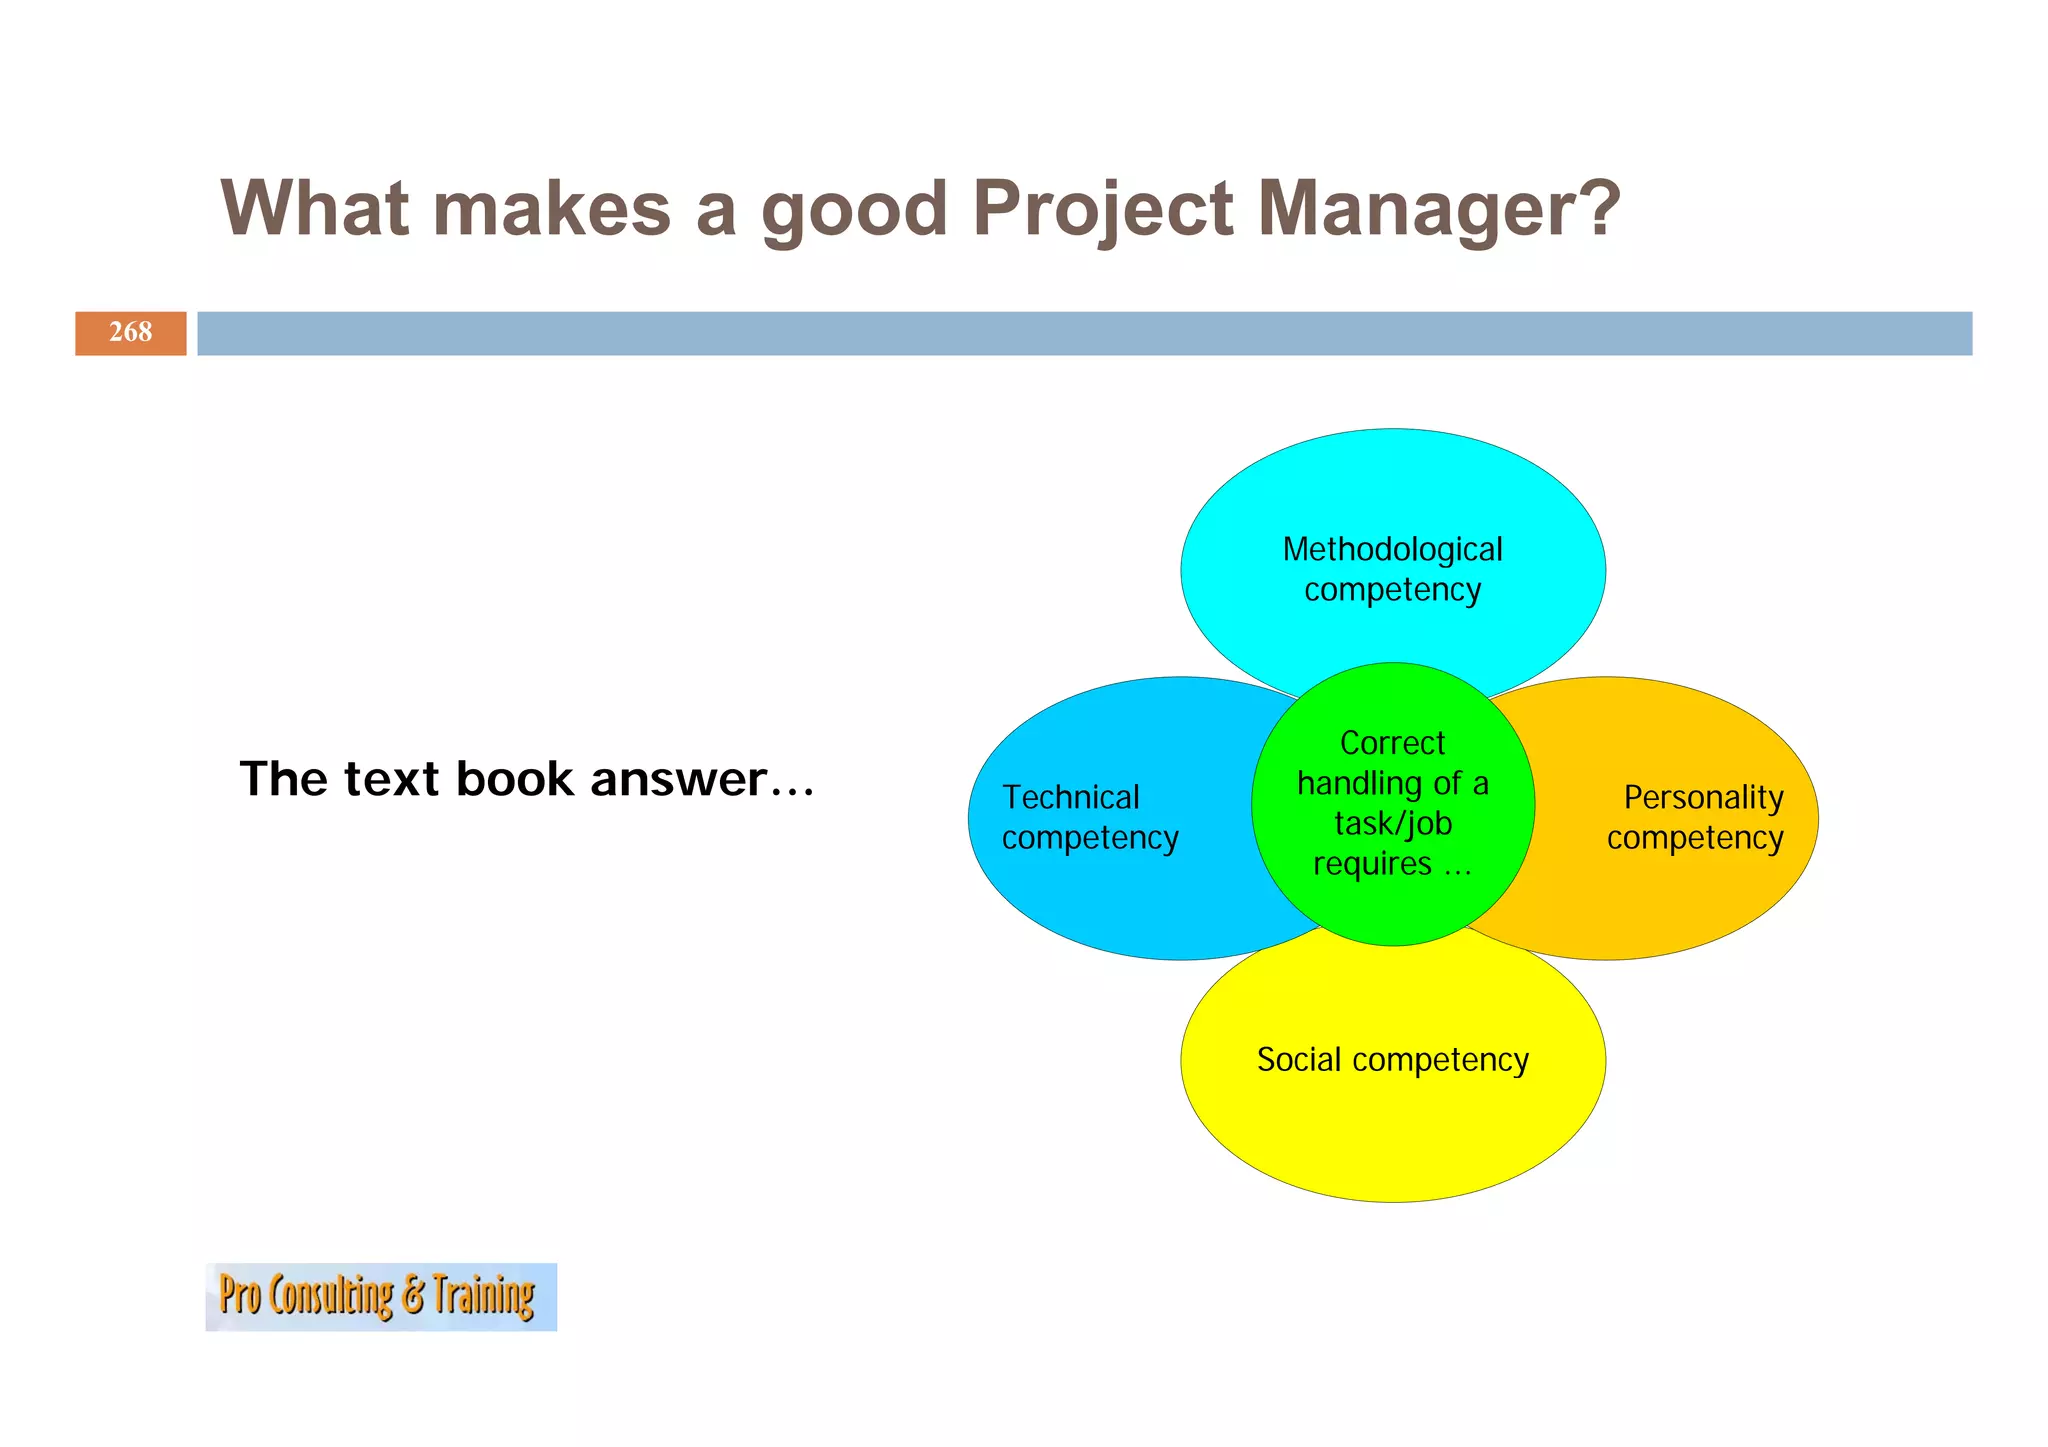
Exploration of project definitions, management roles, functions, and project types outlining key management theories.
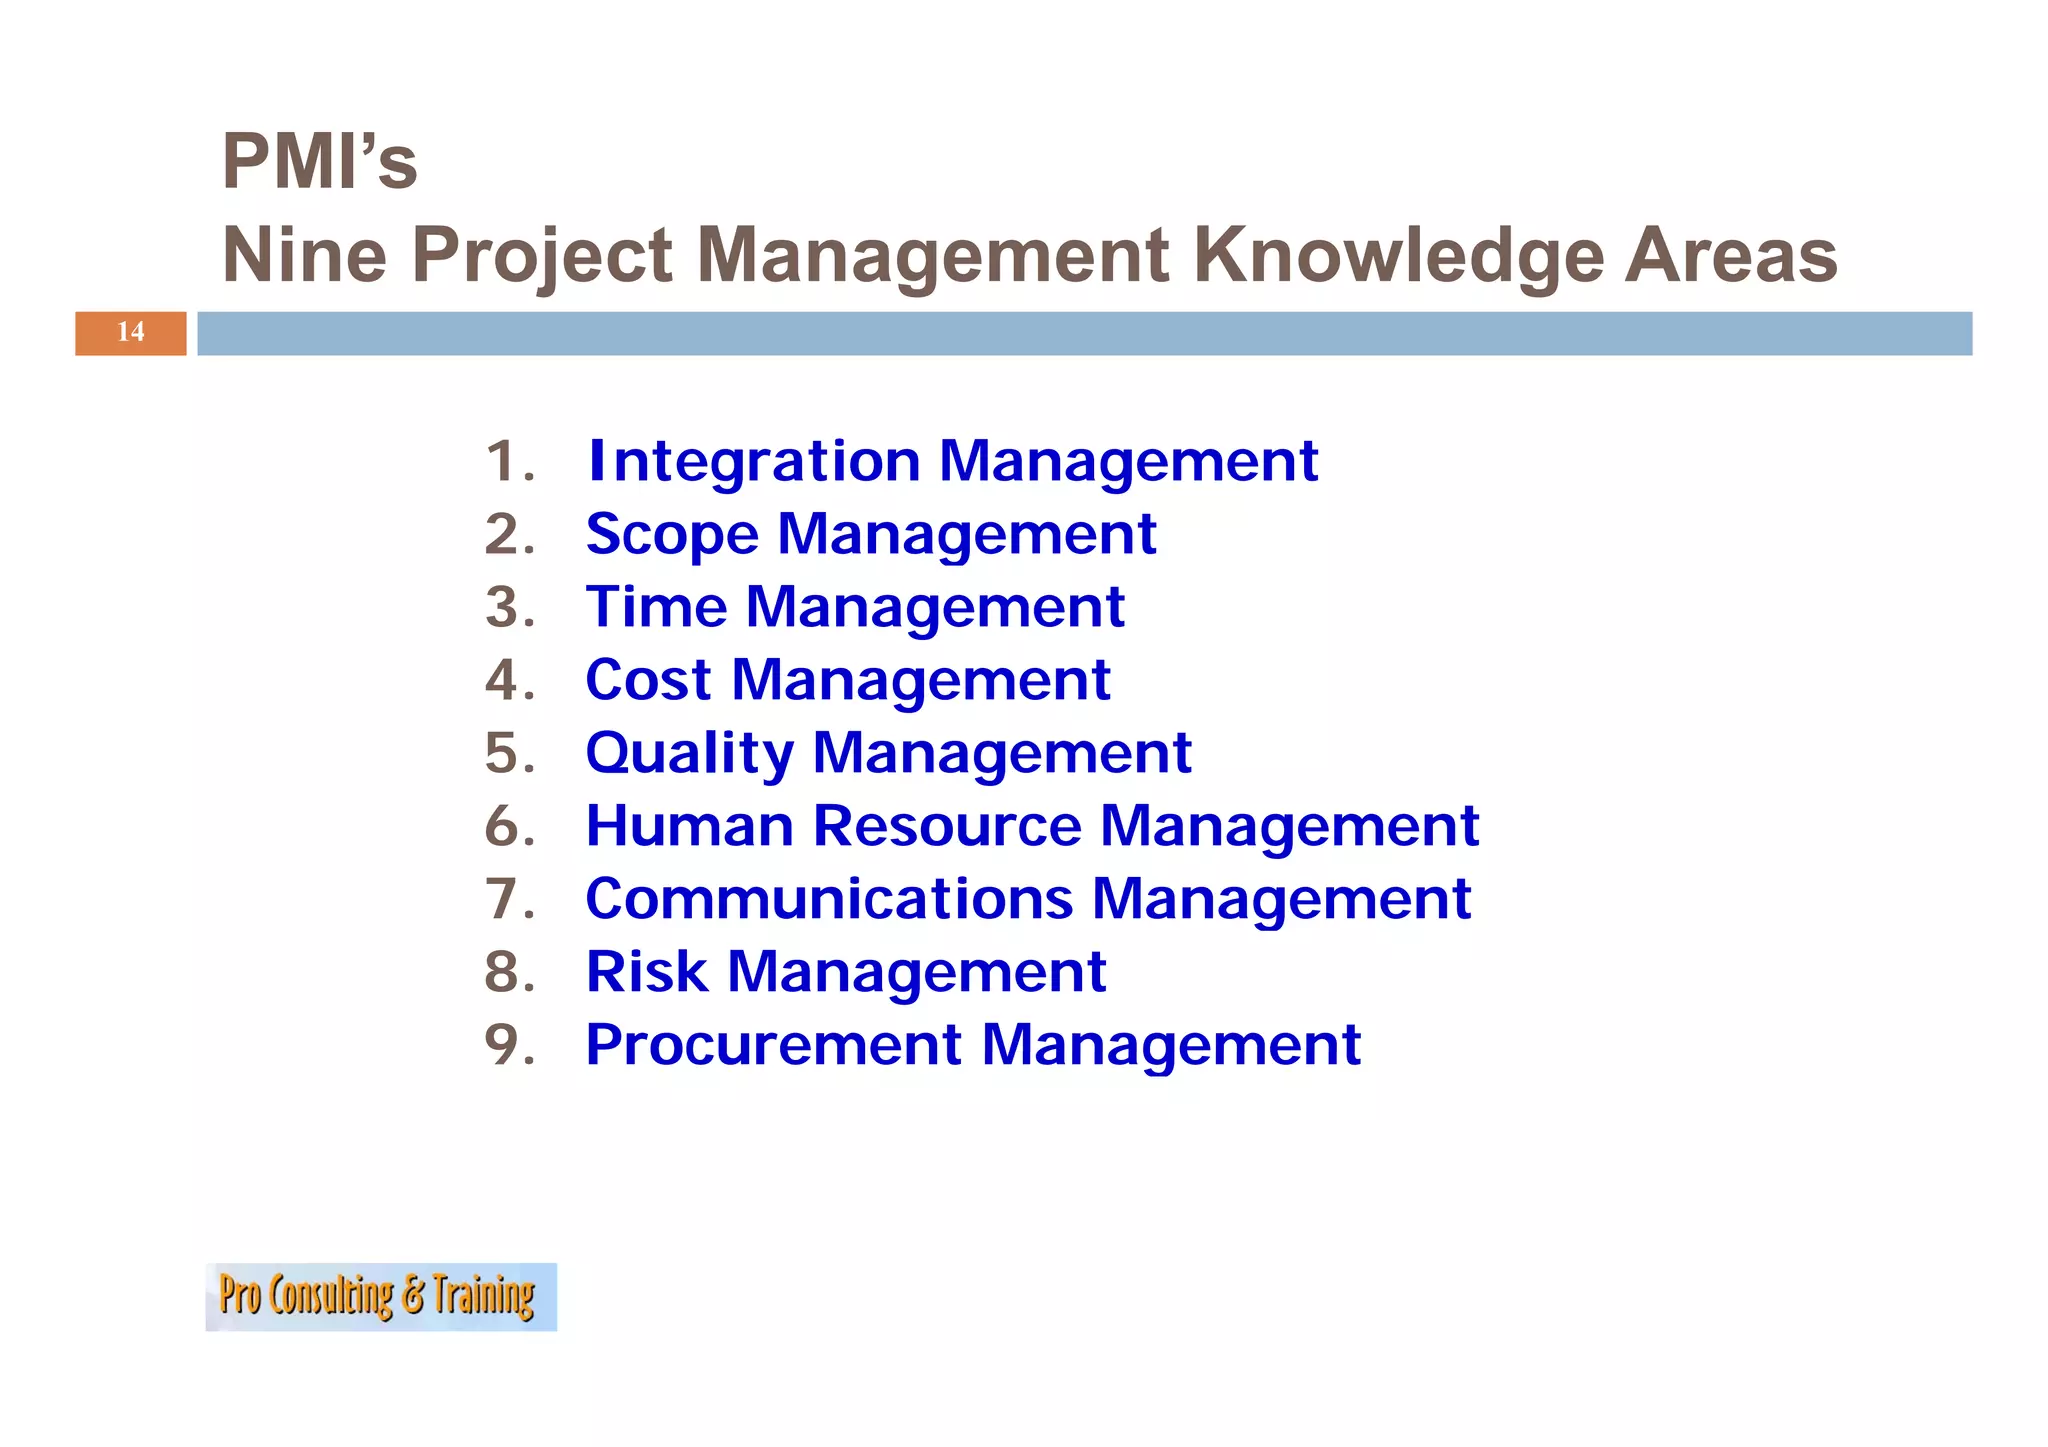
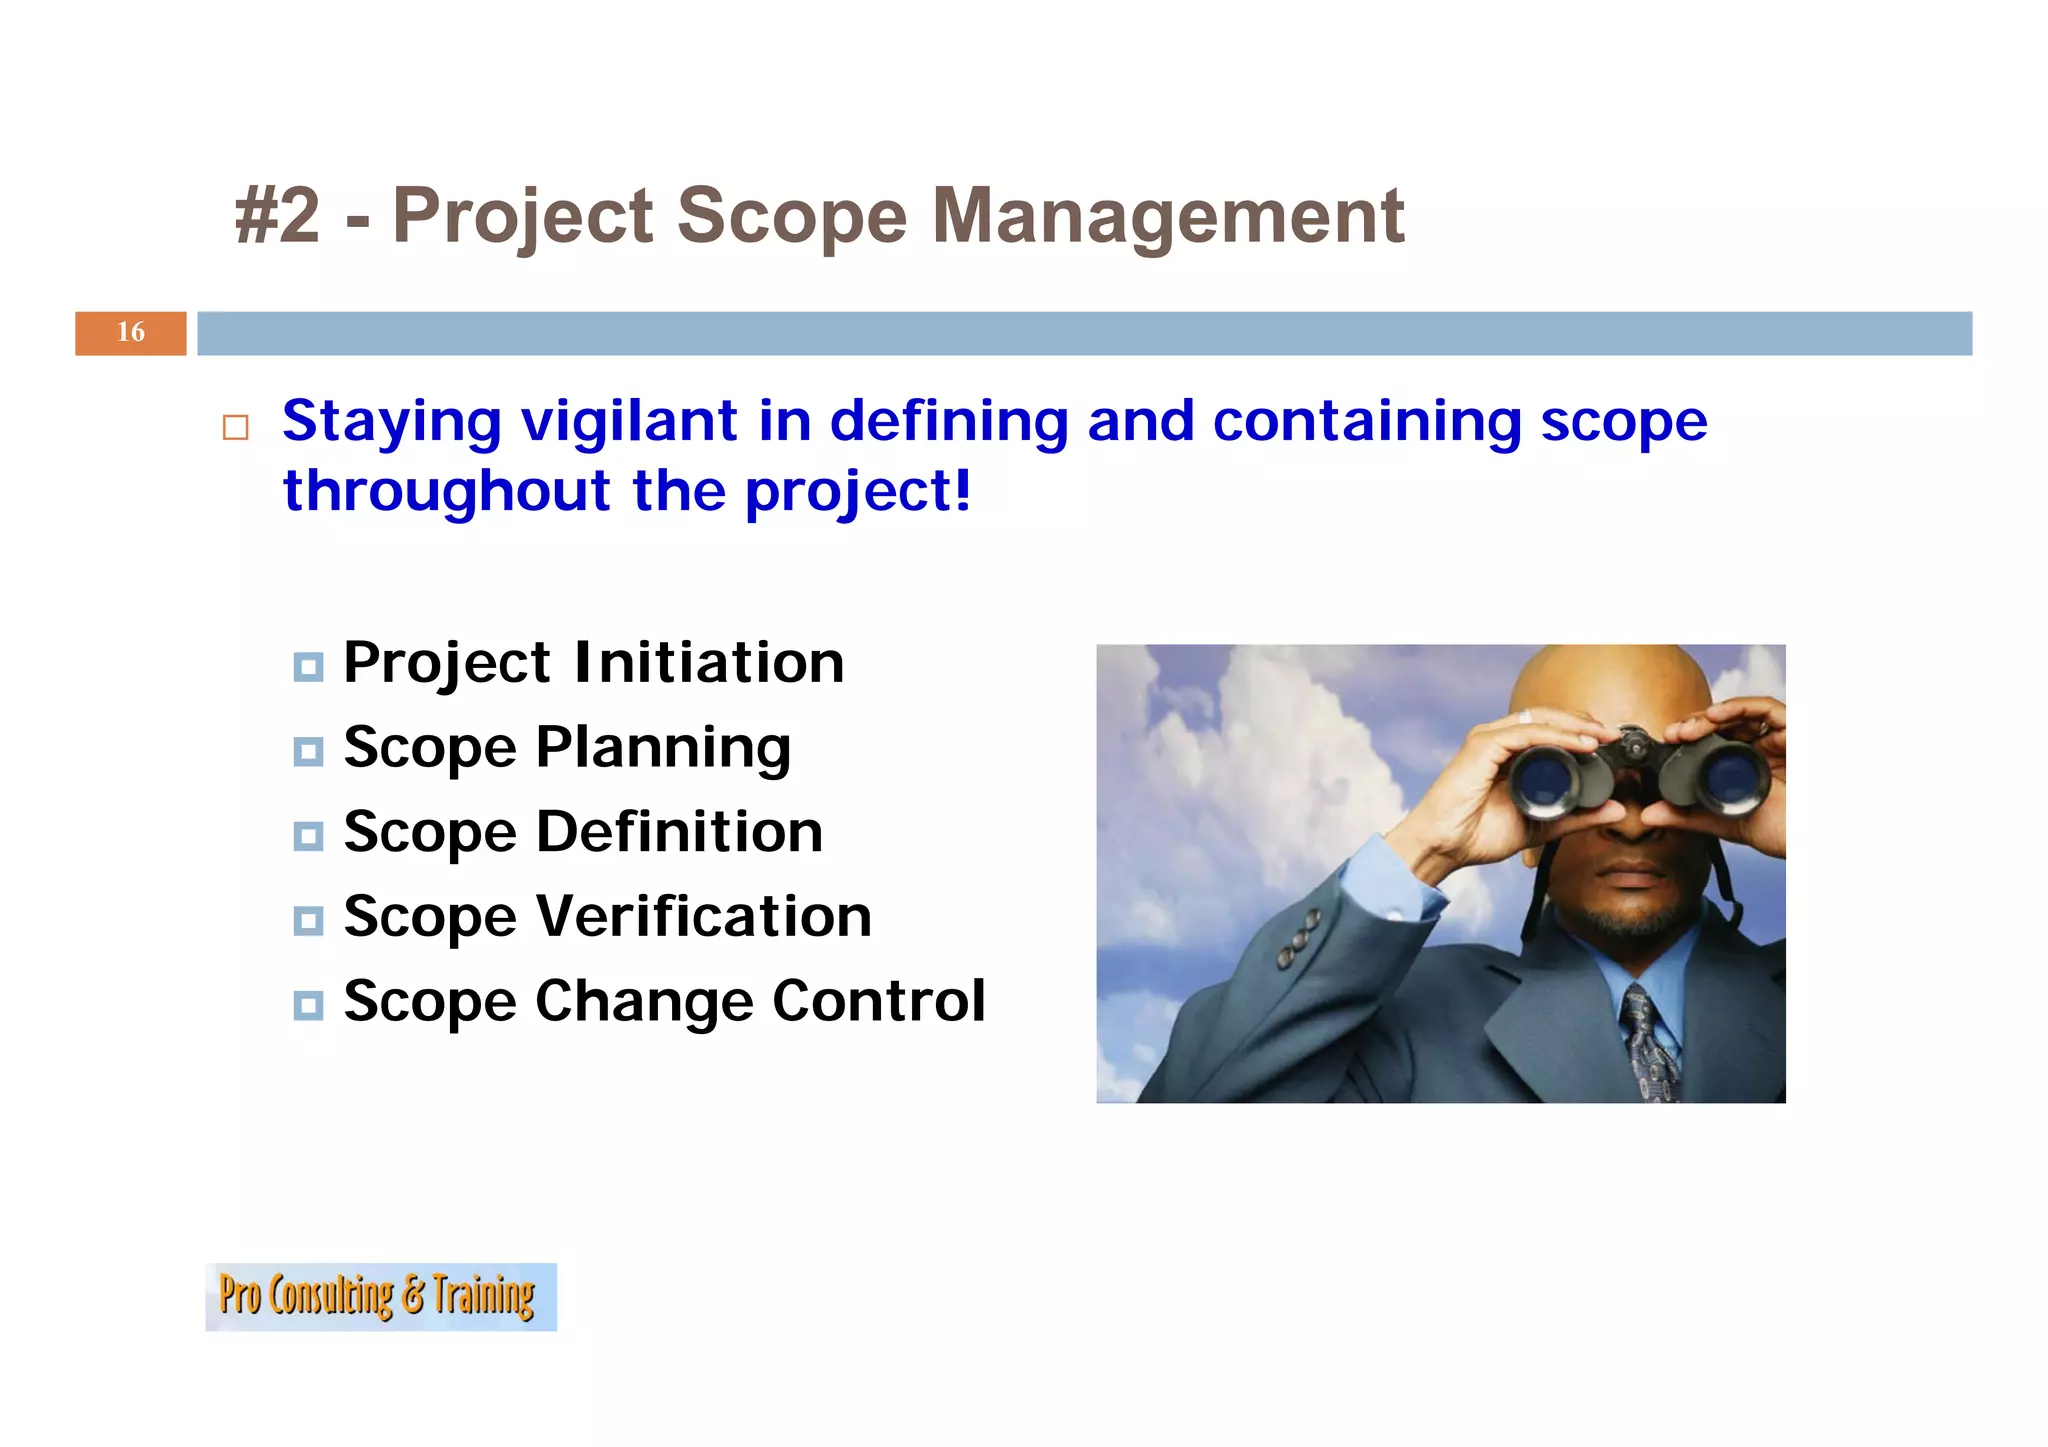
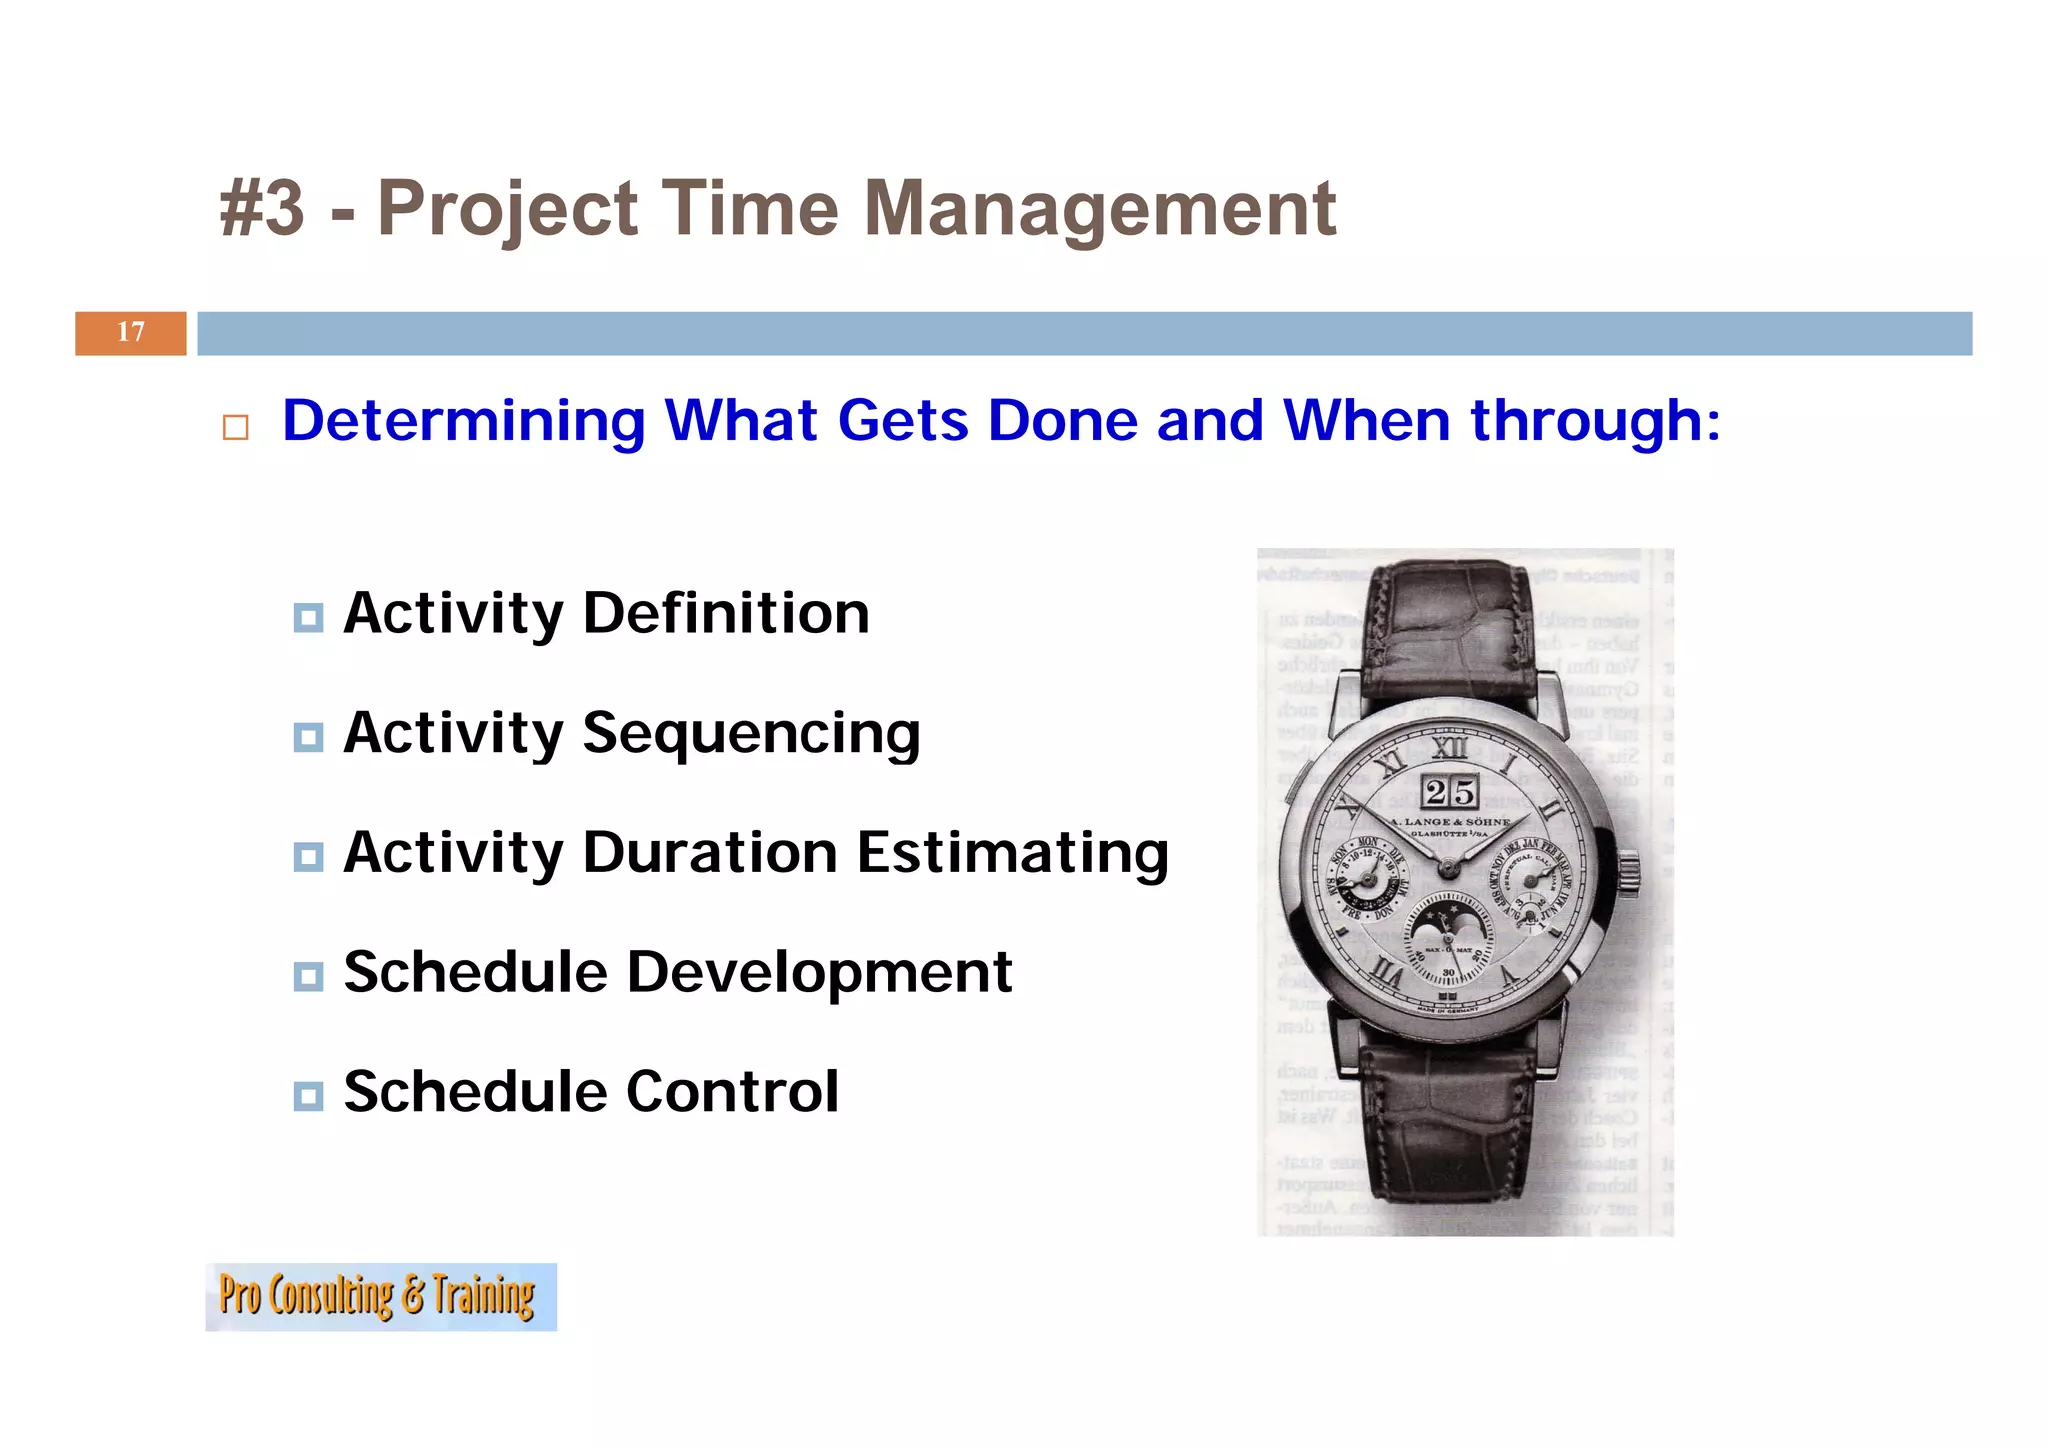
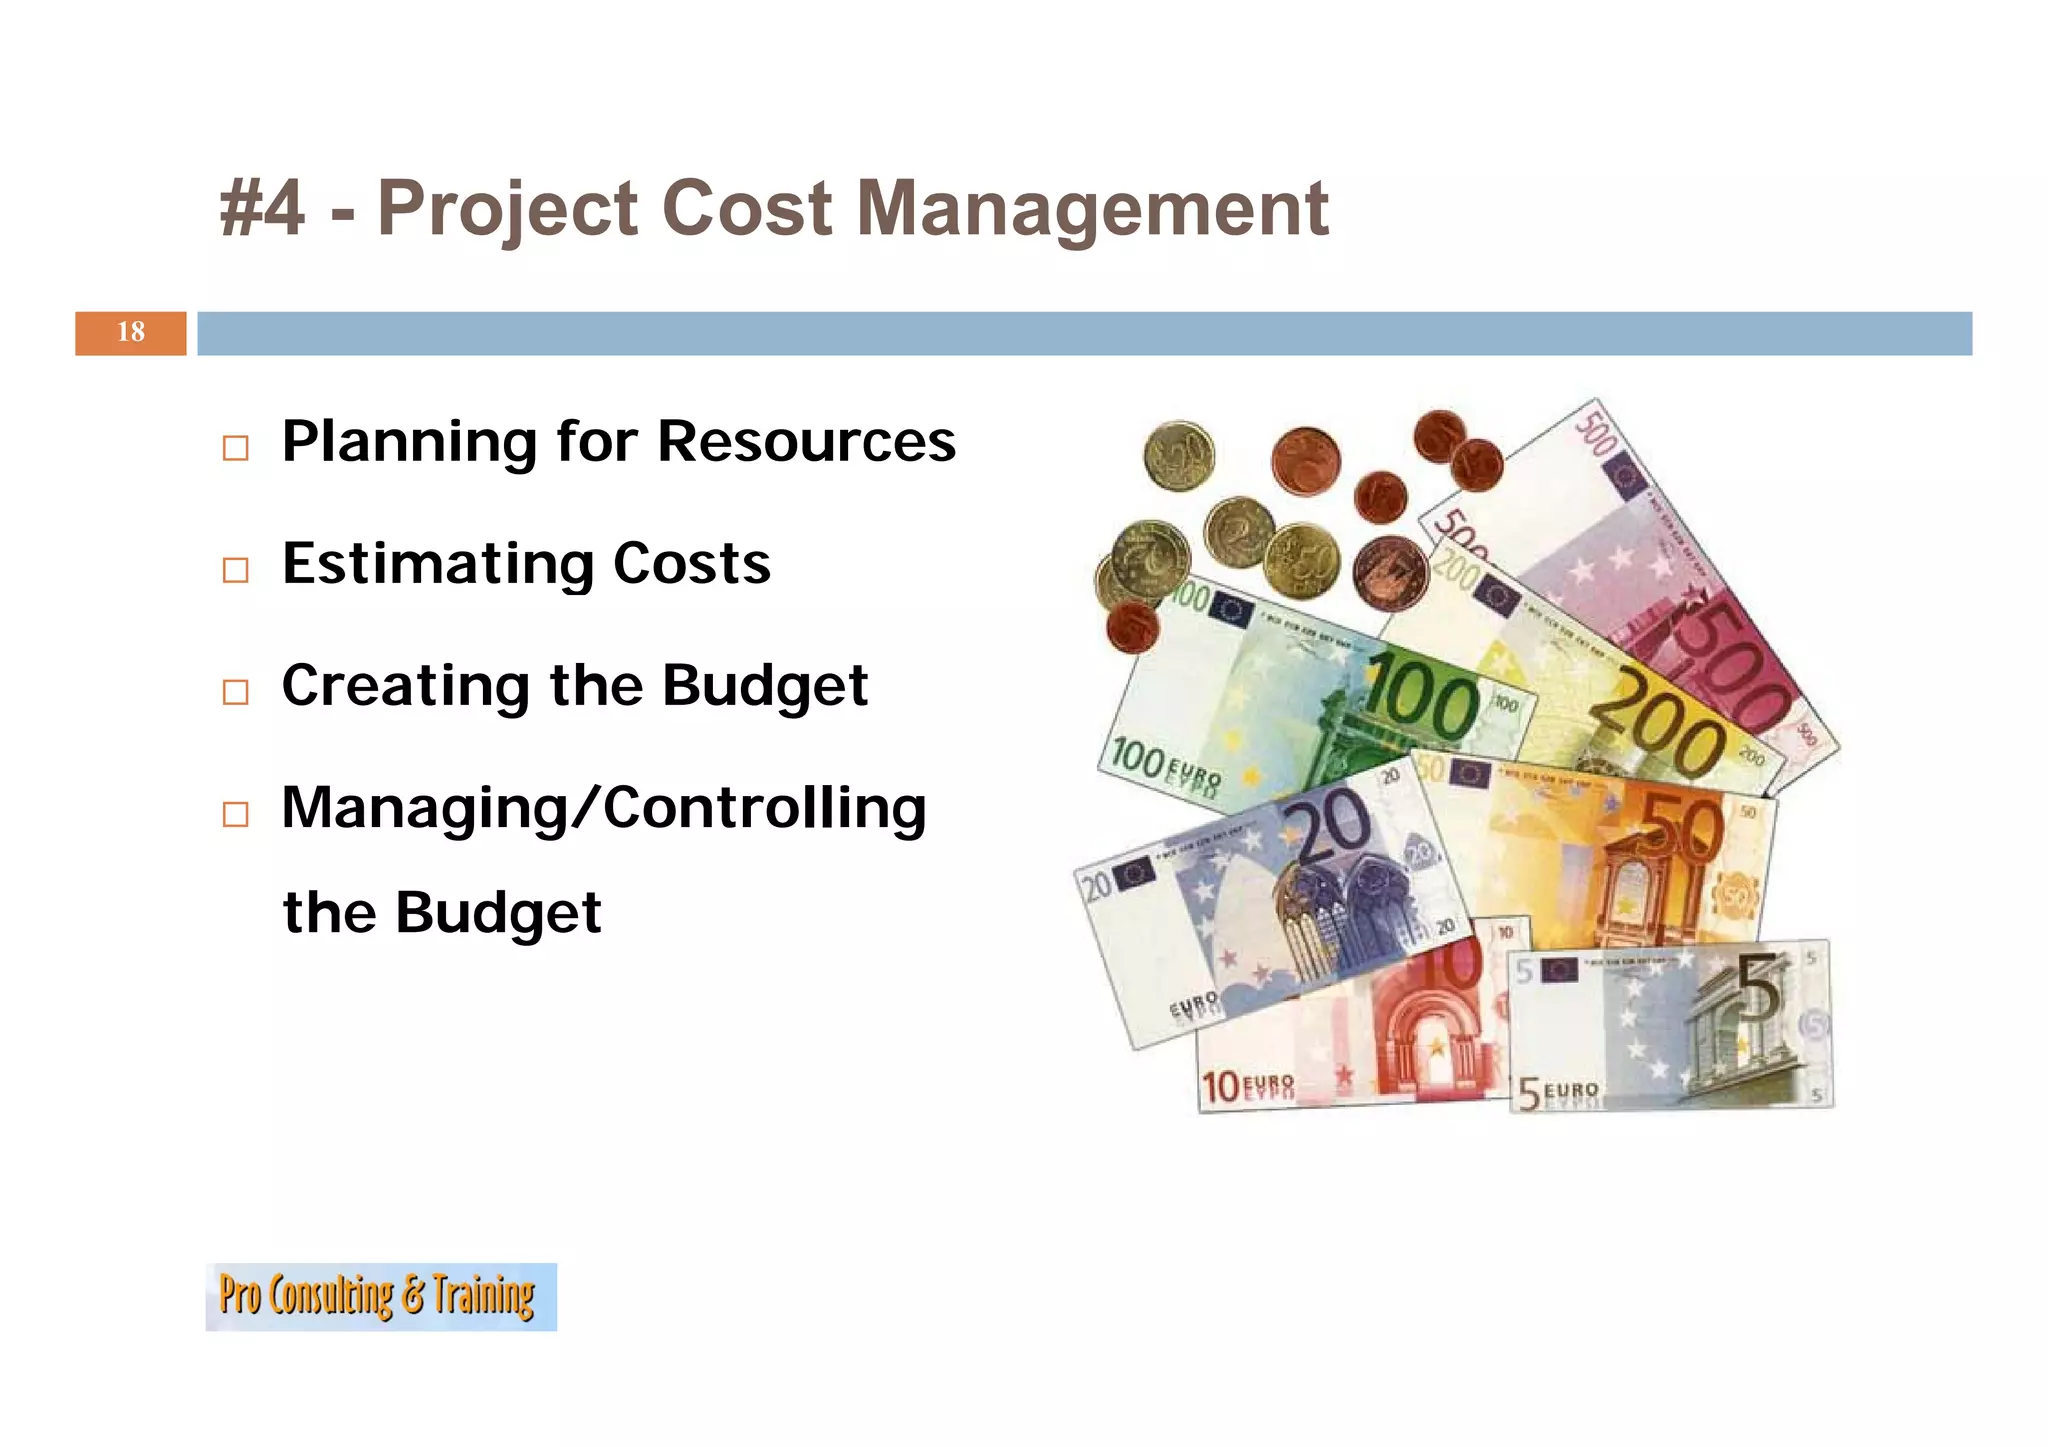
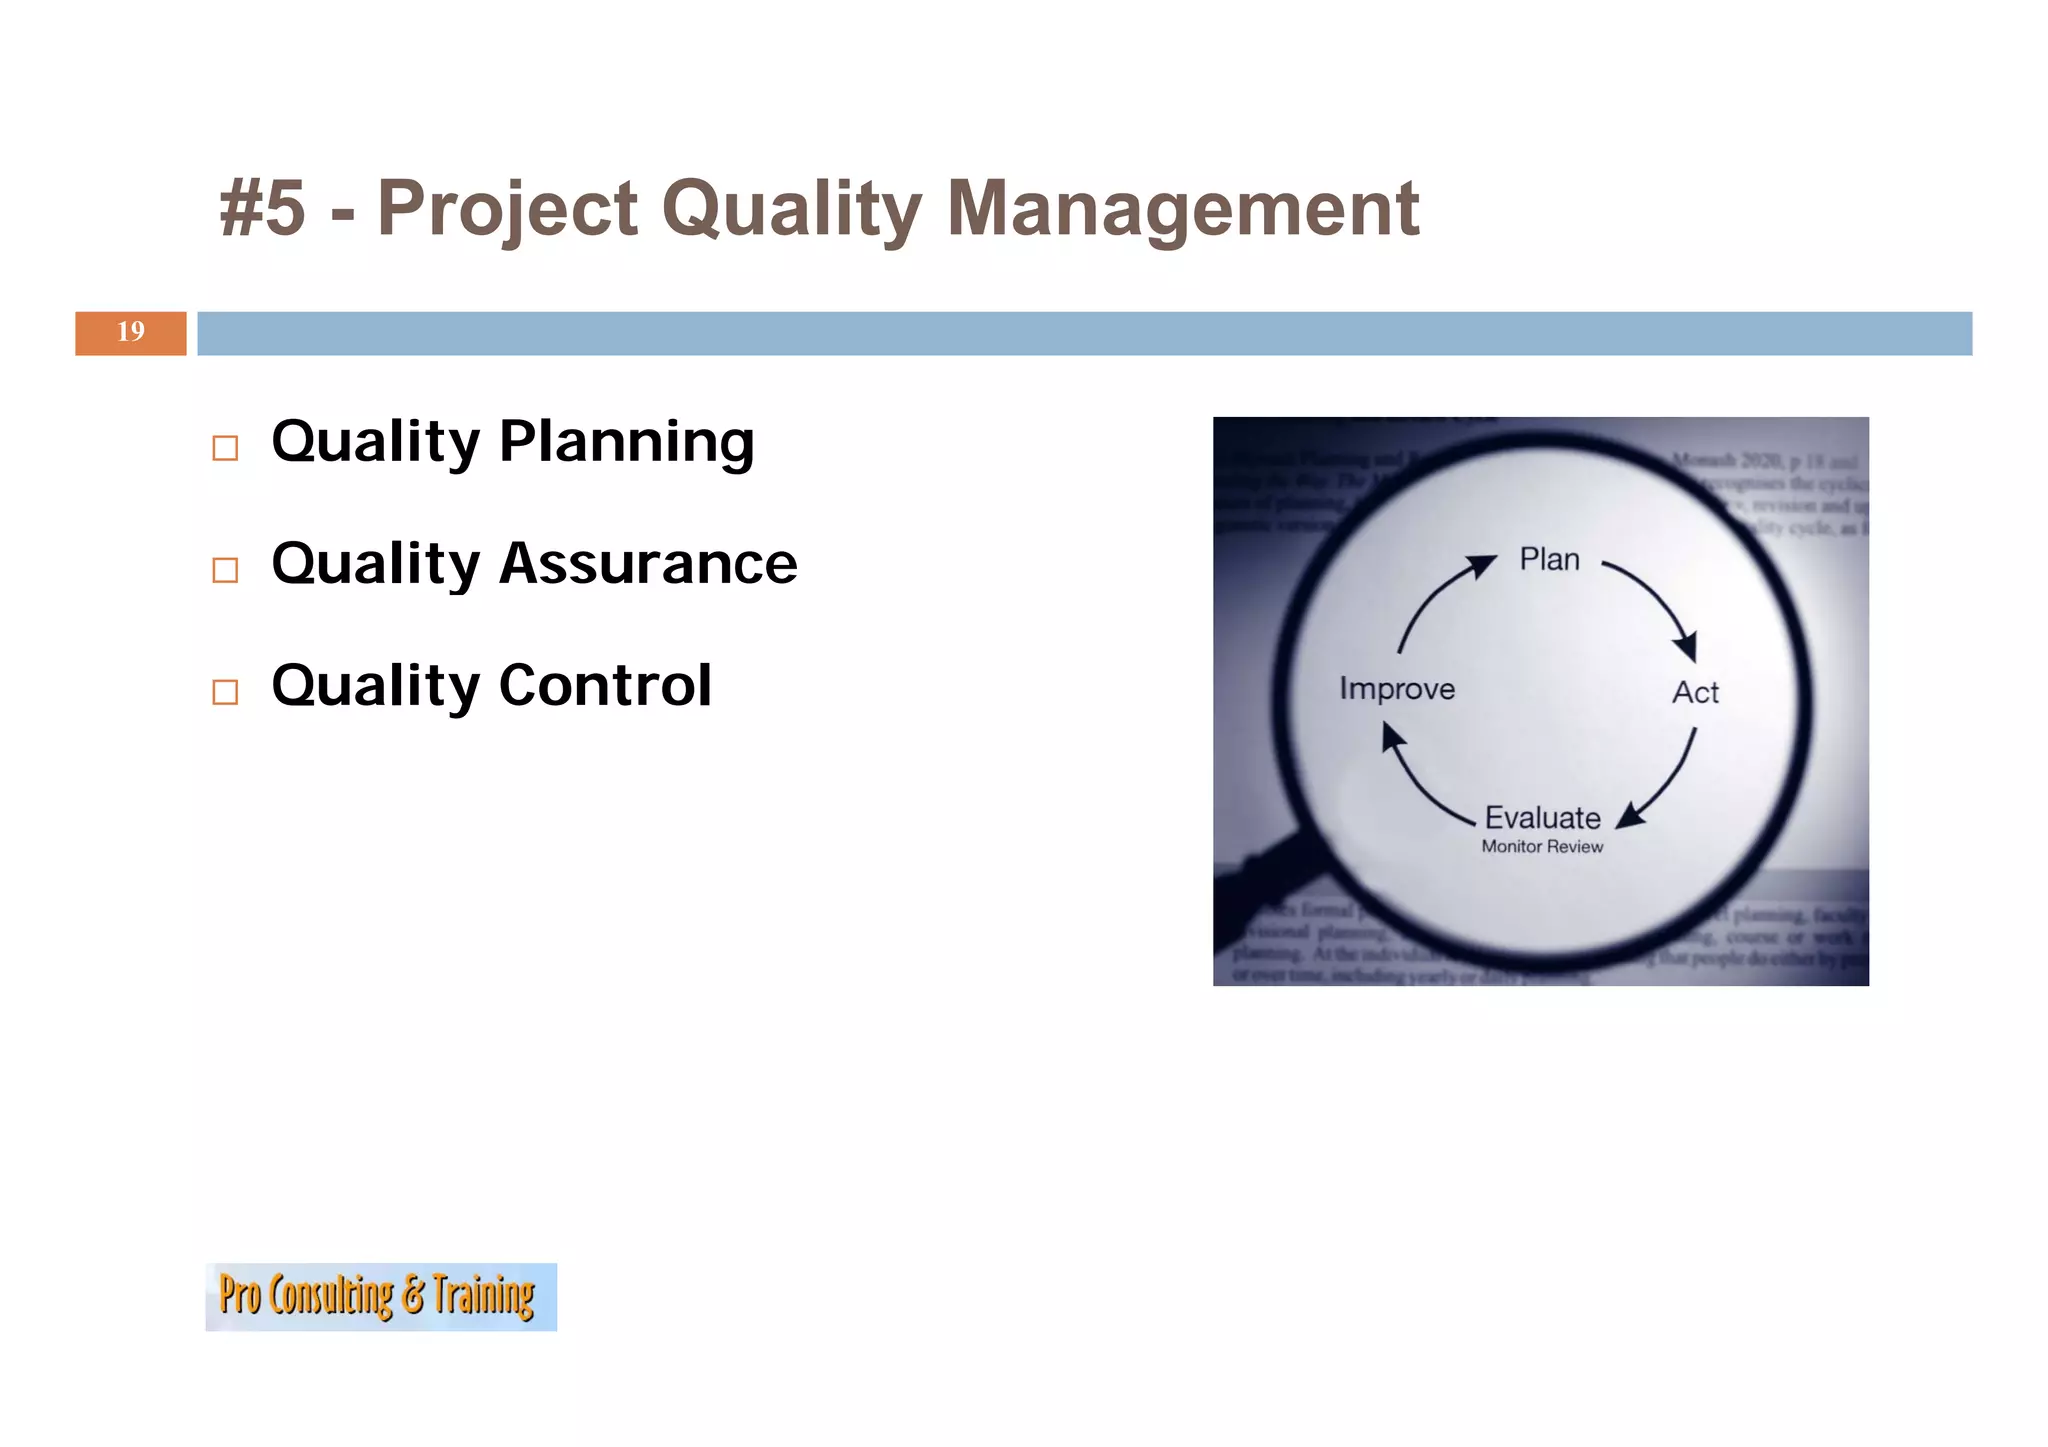
Nine essential knowledge areas in project management as defined by the Project Management Institute.
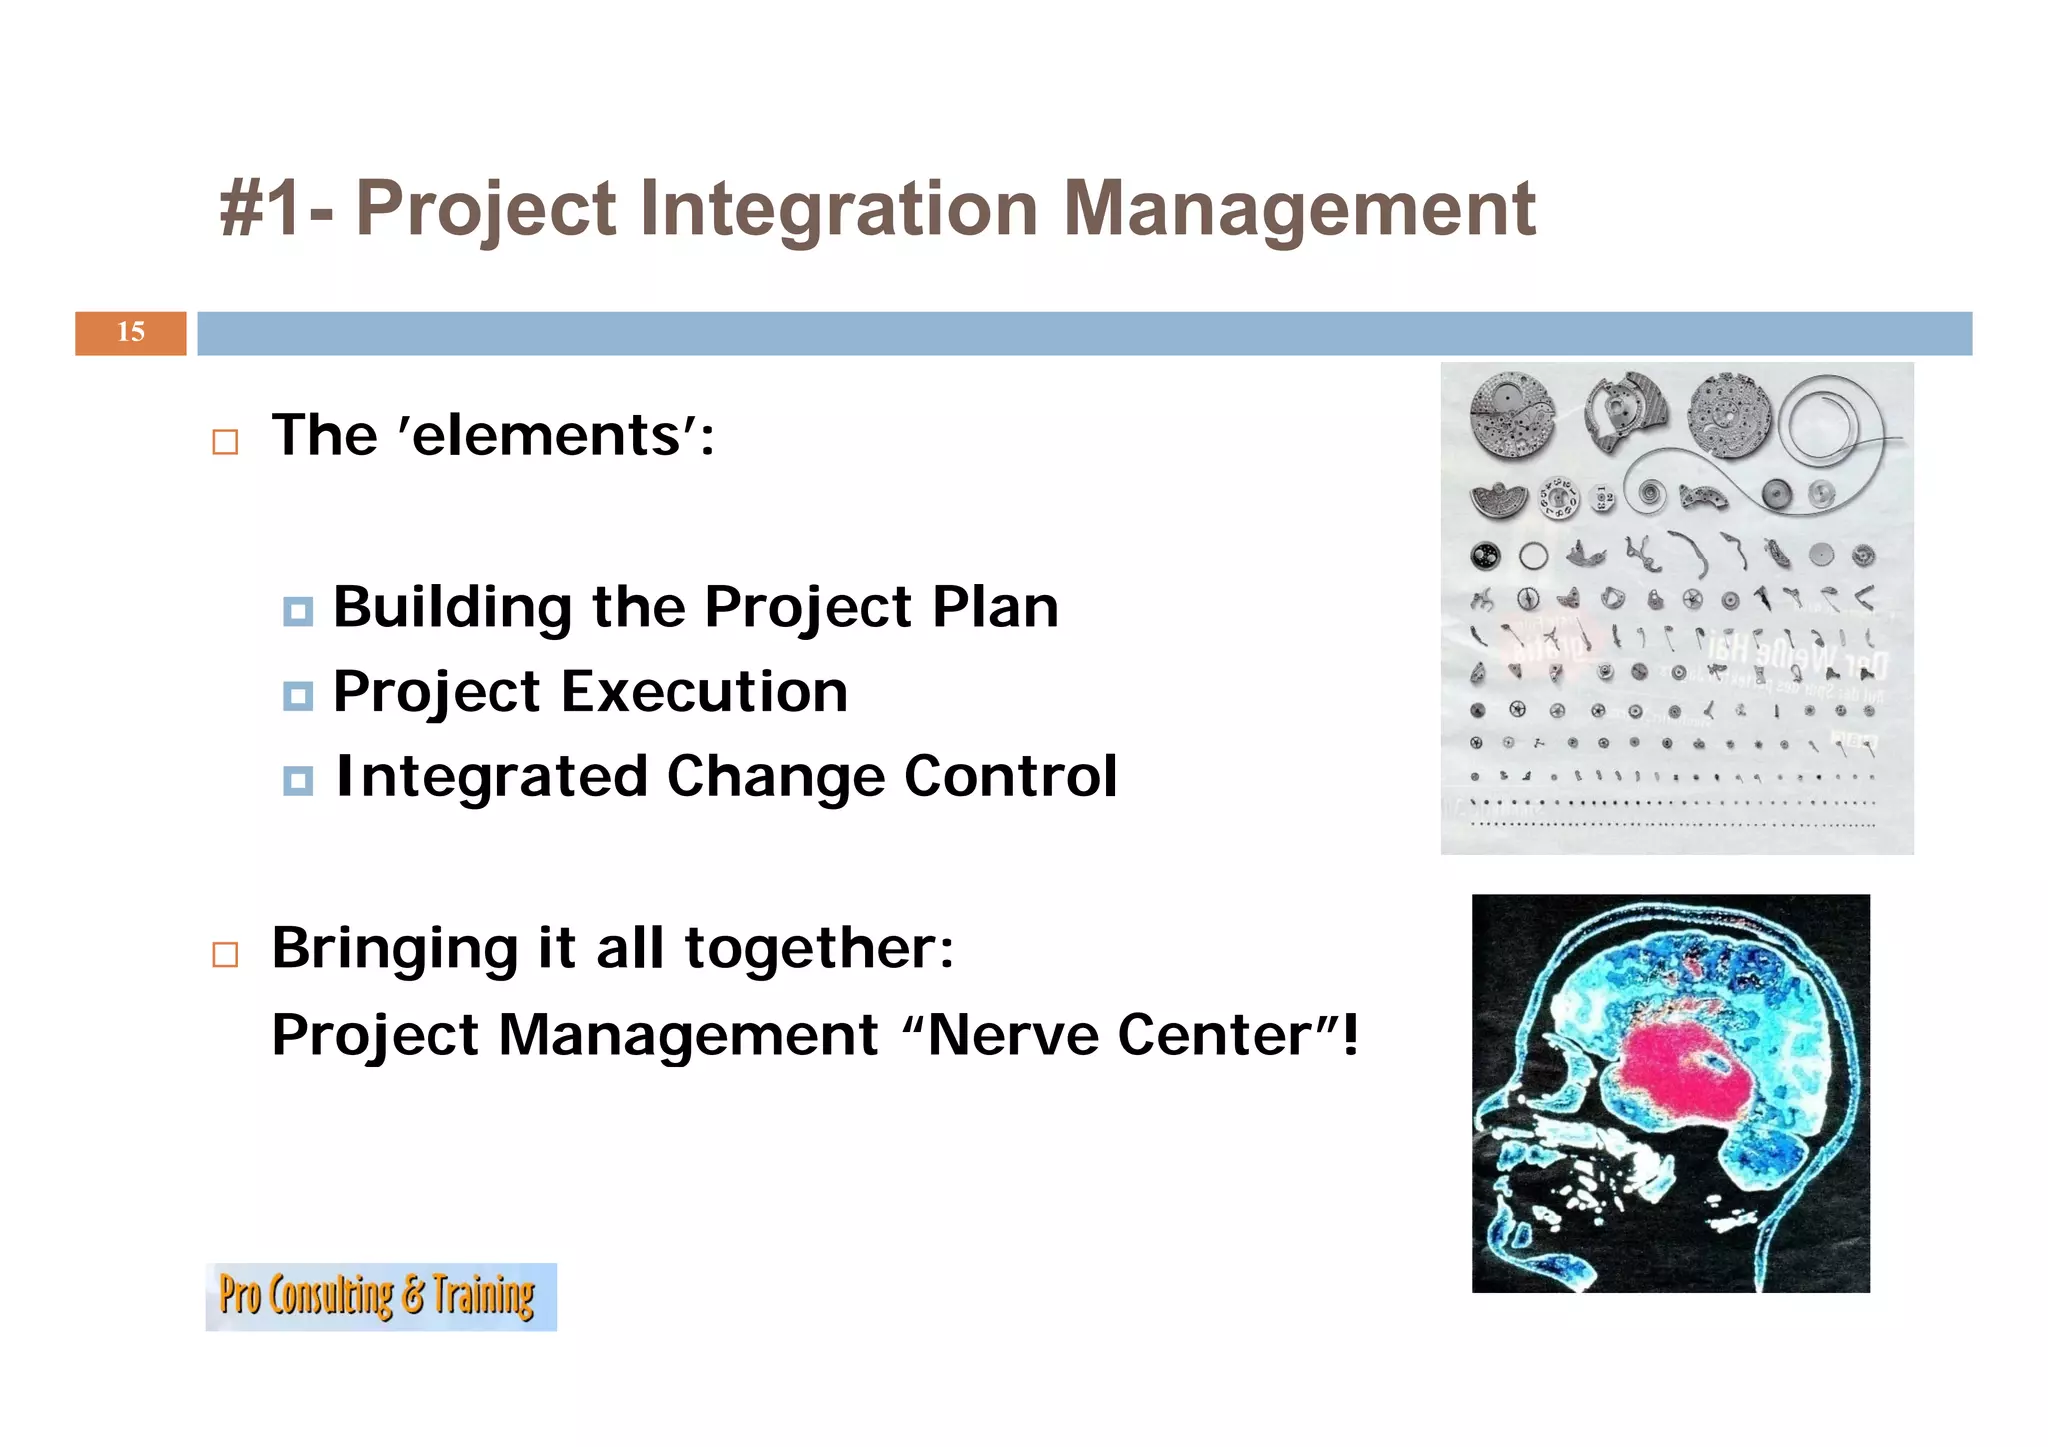
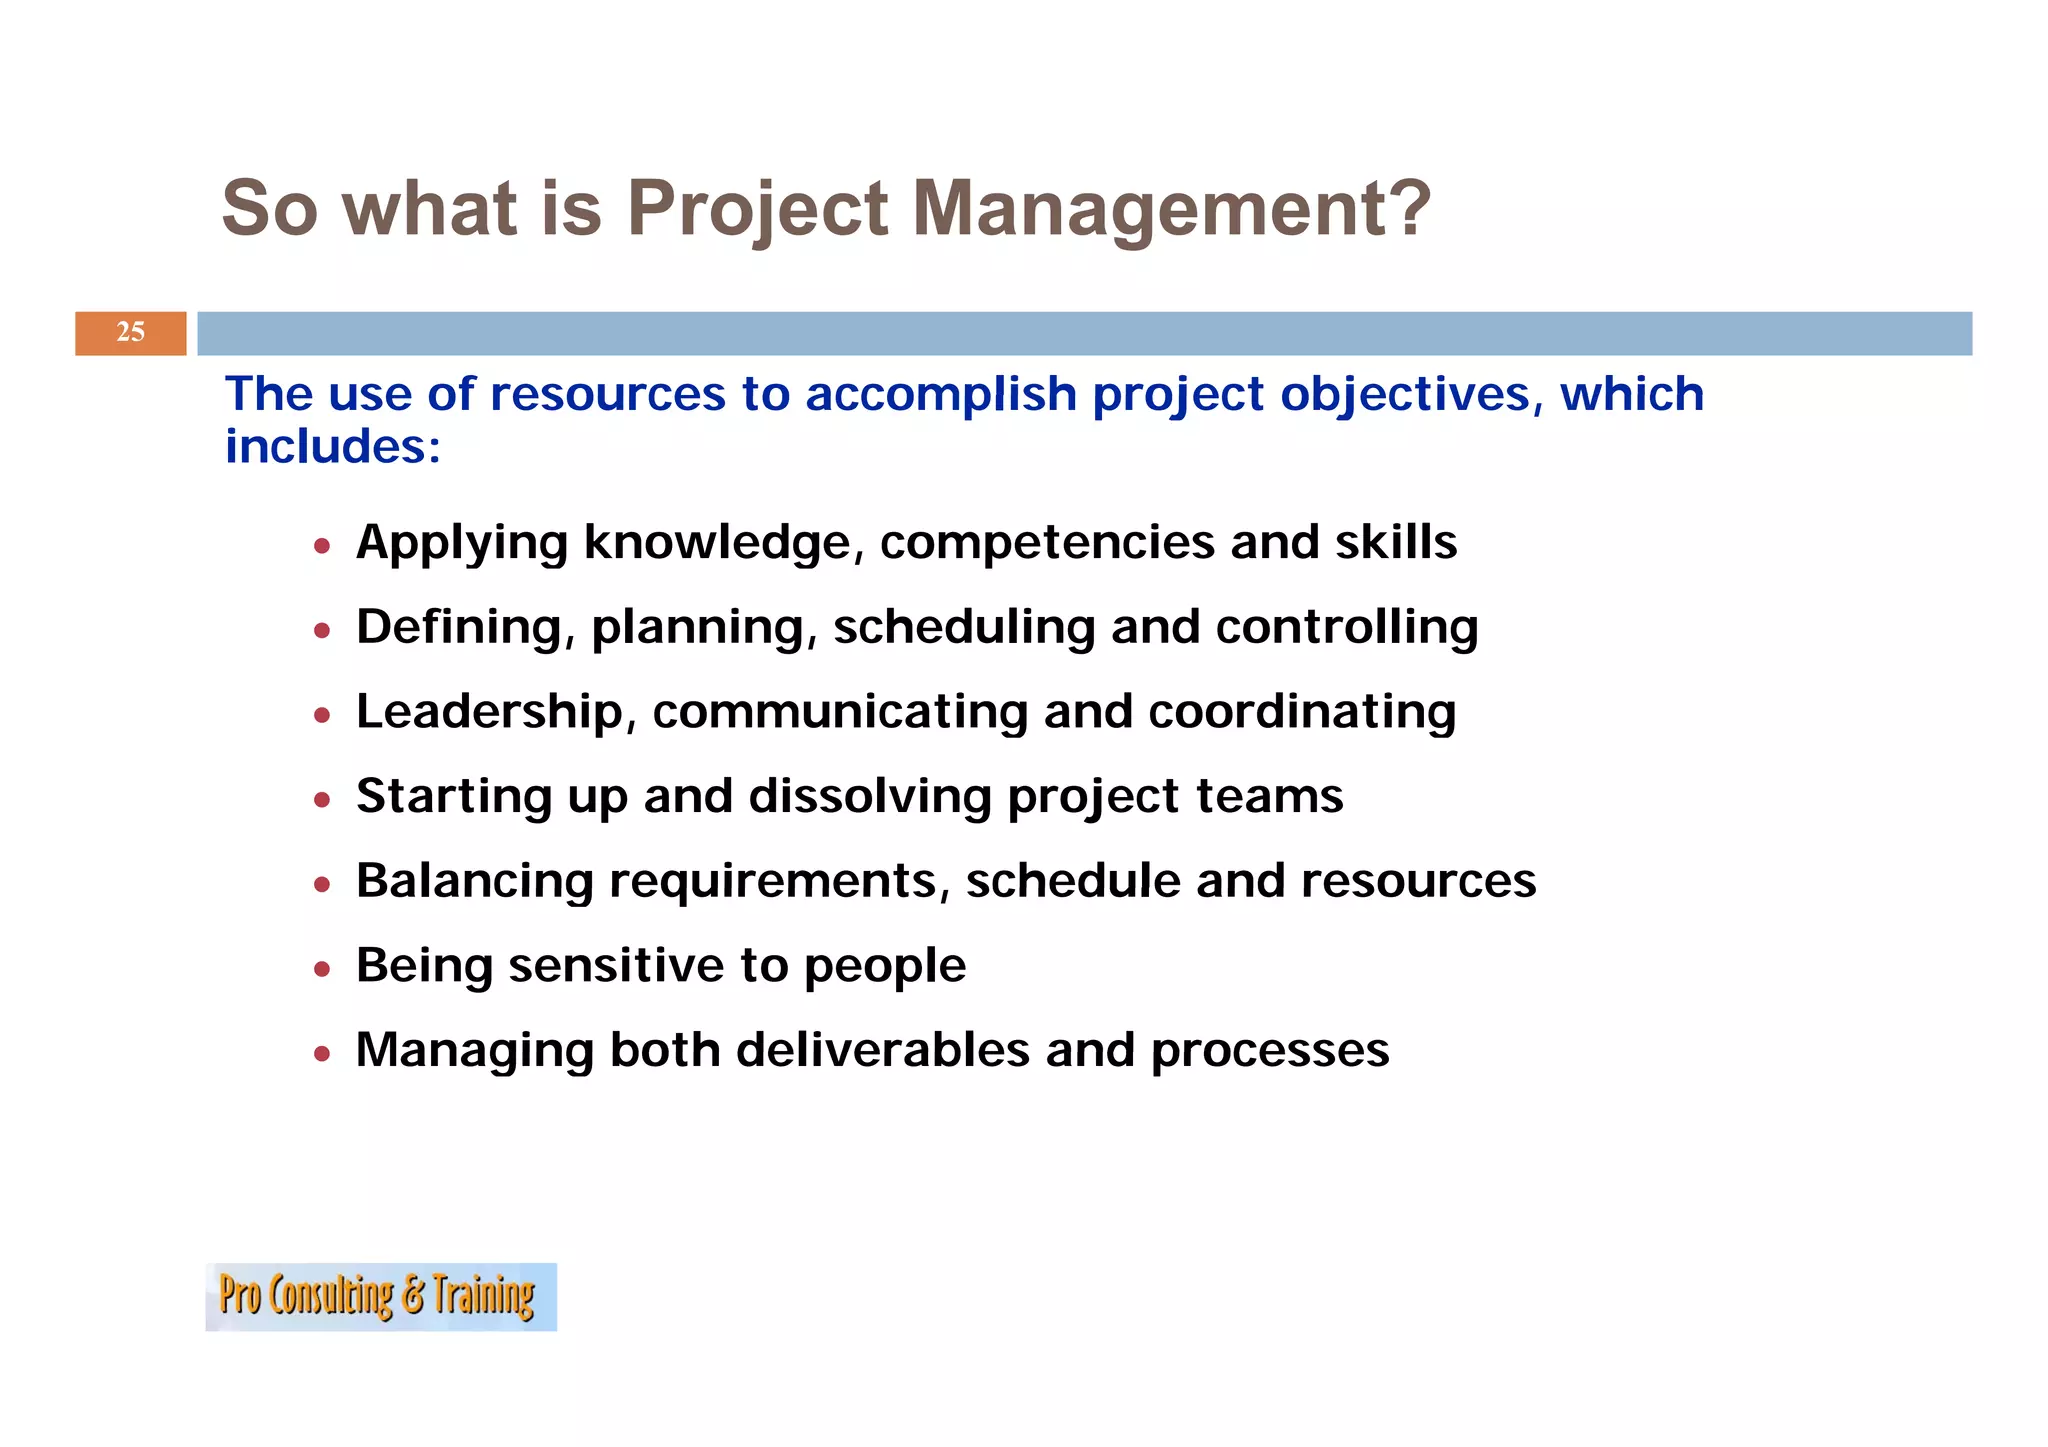
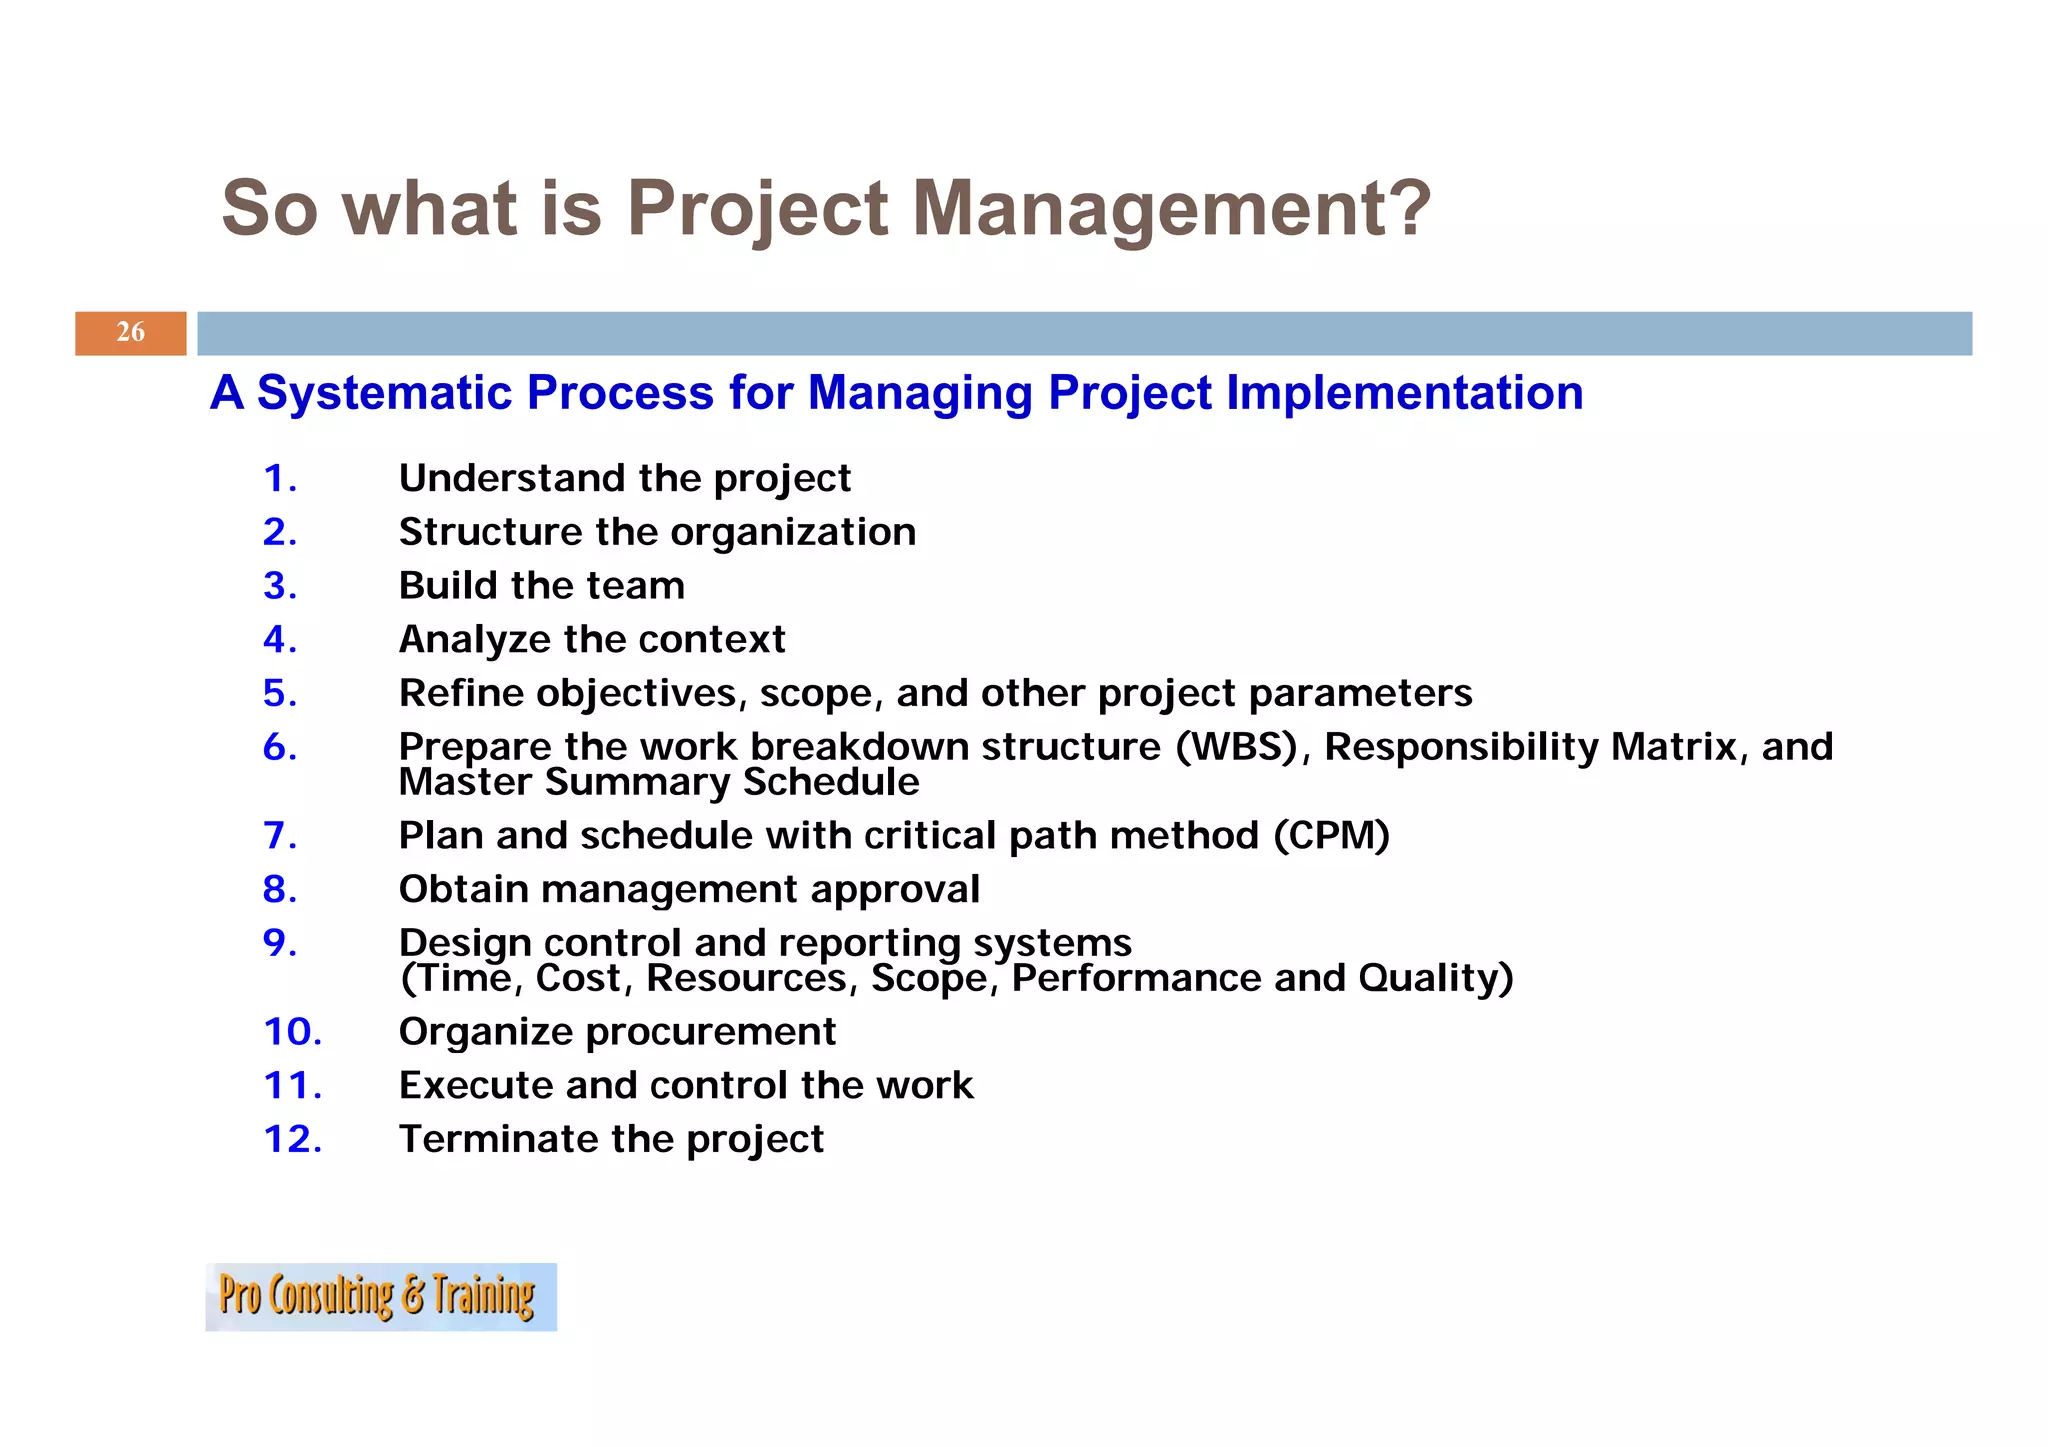
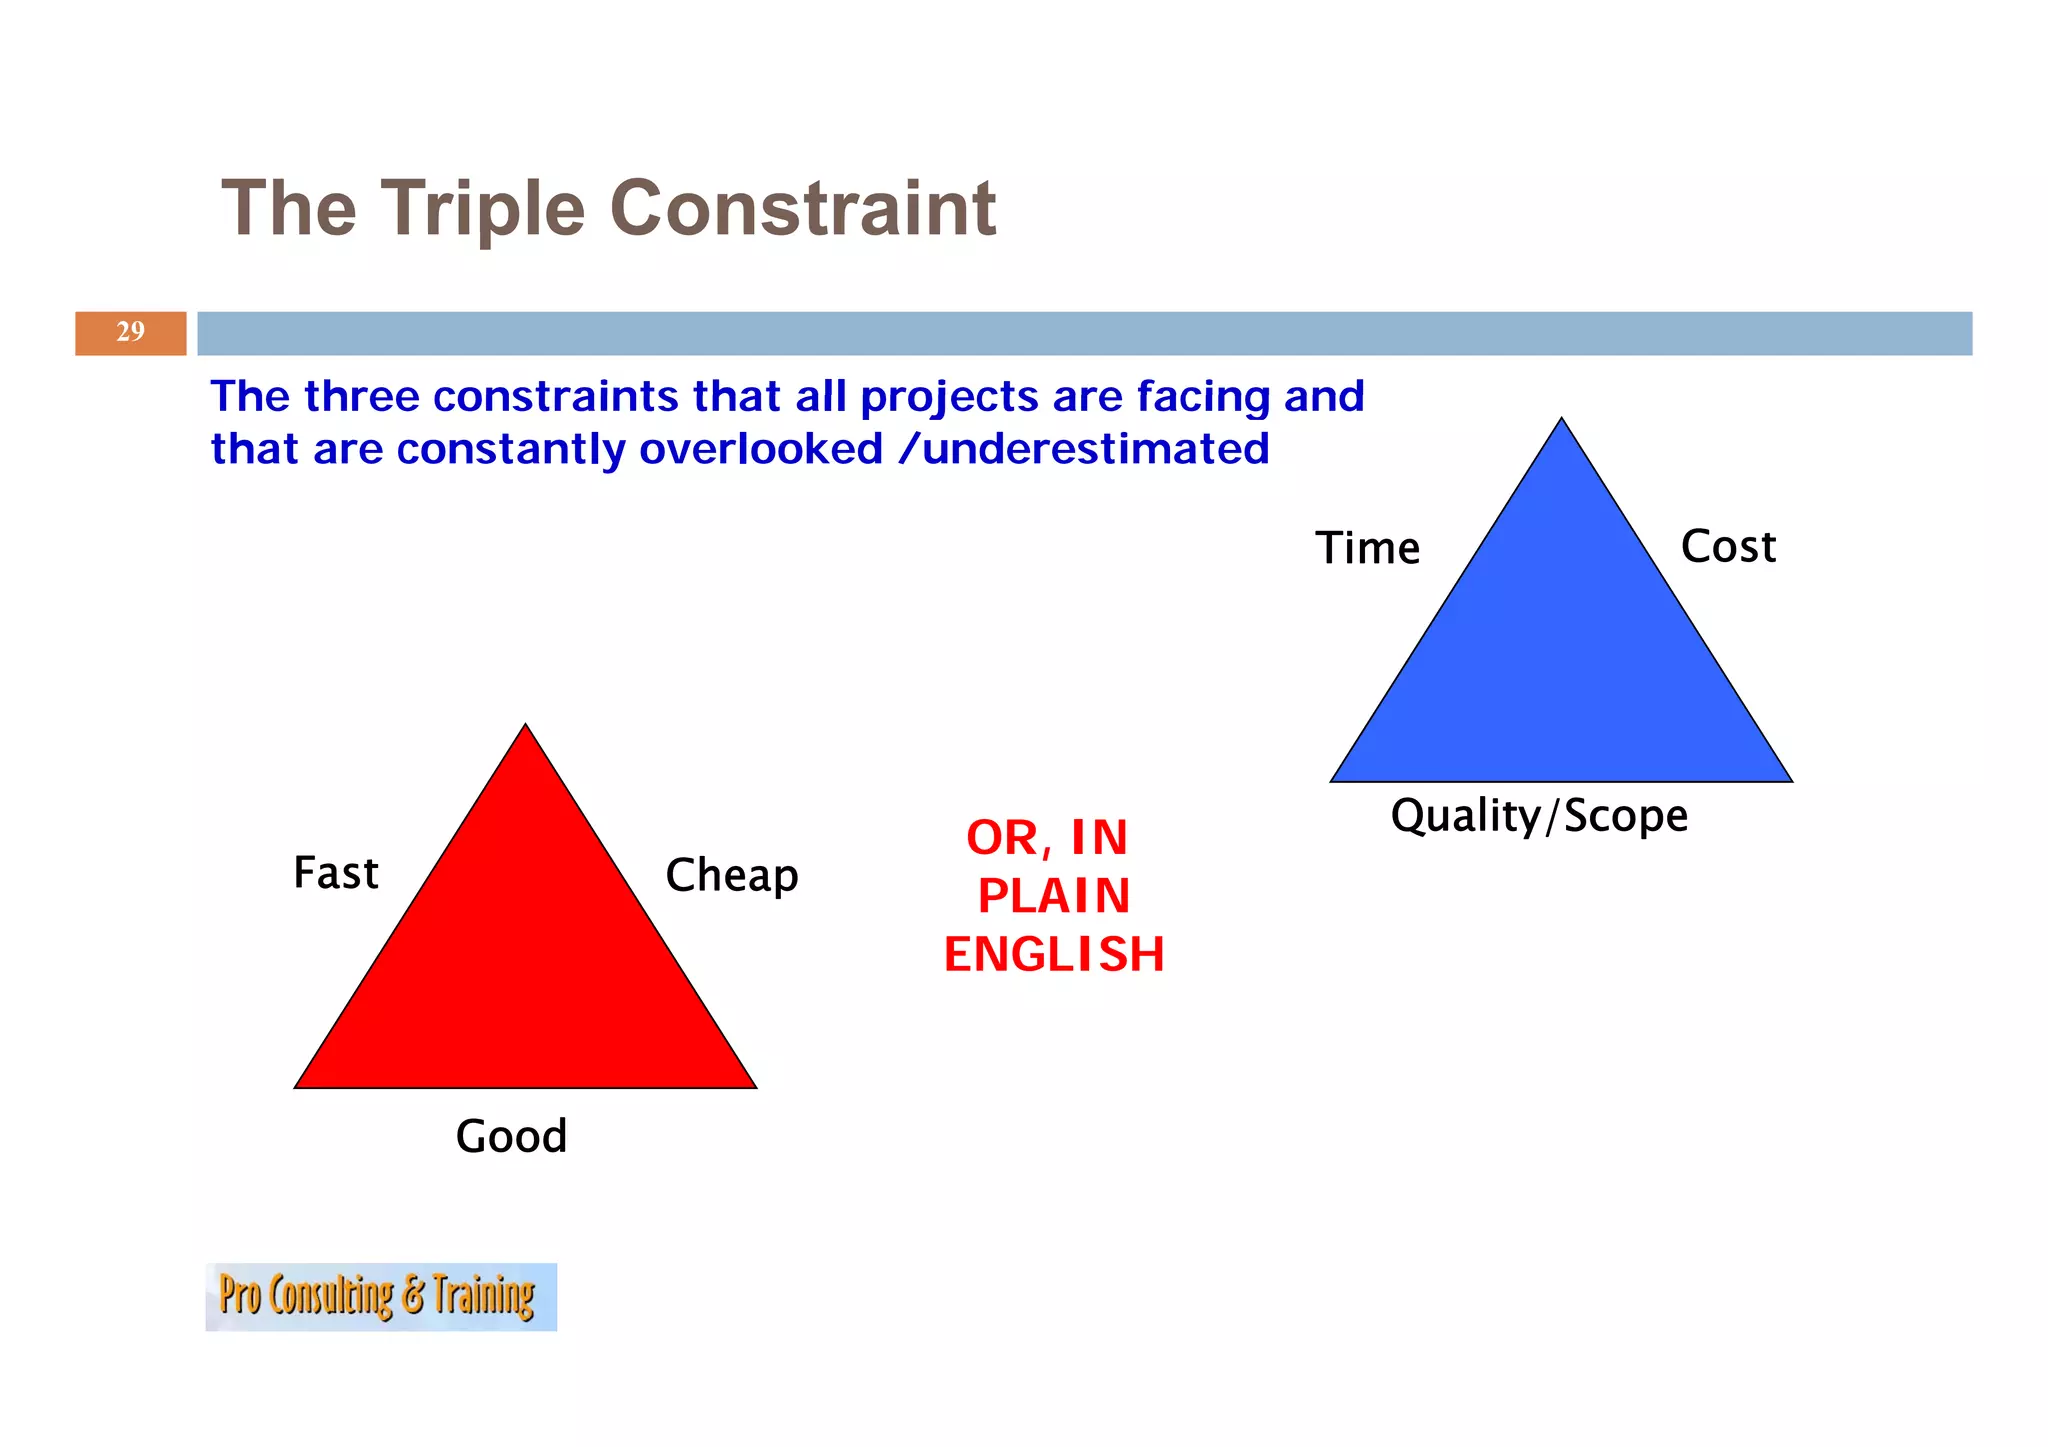
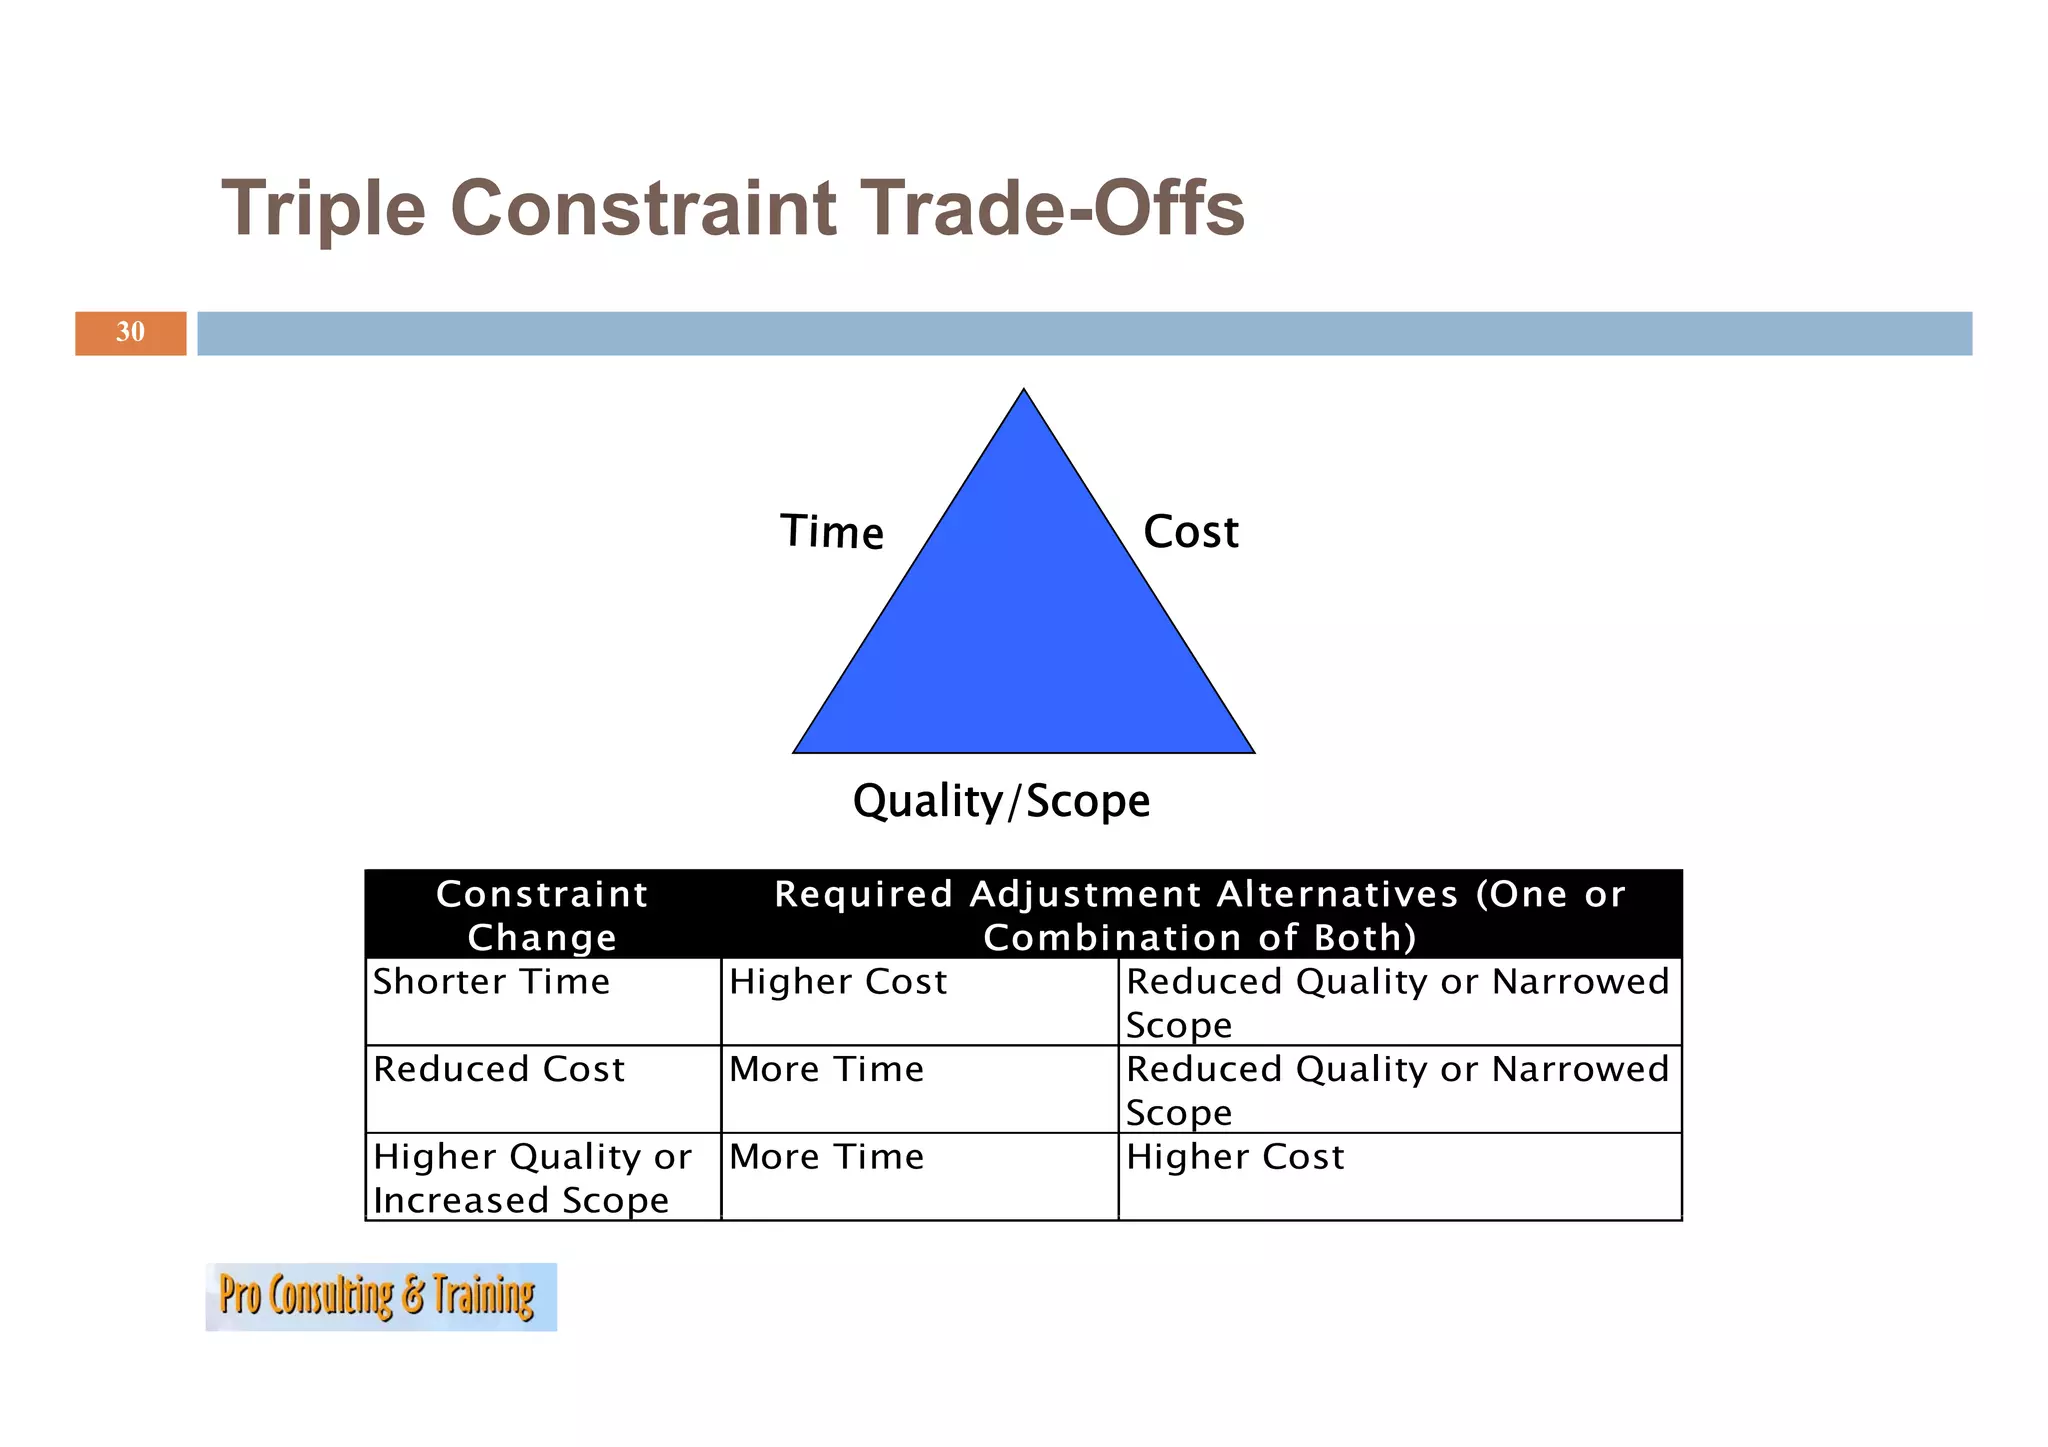
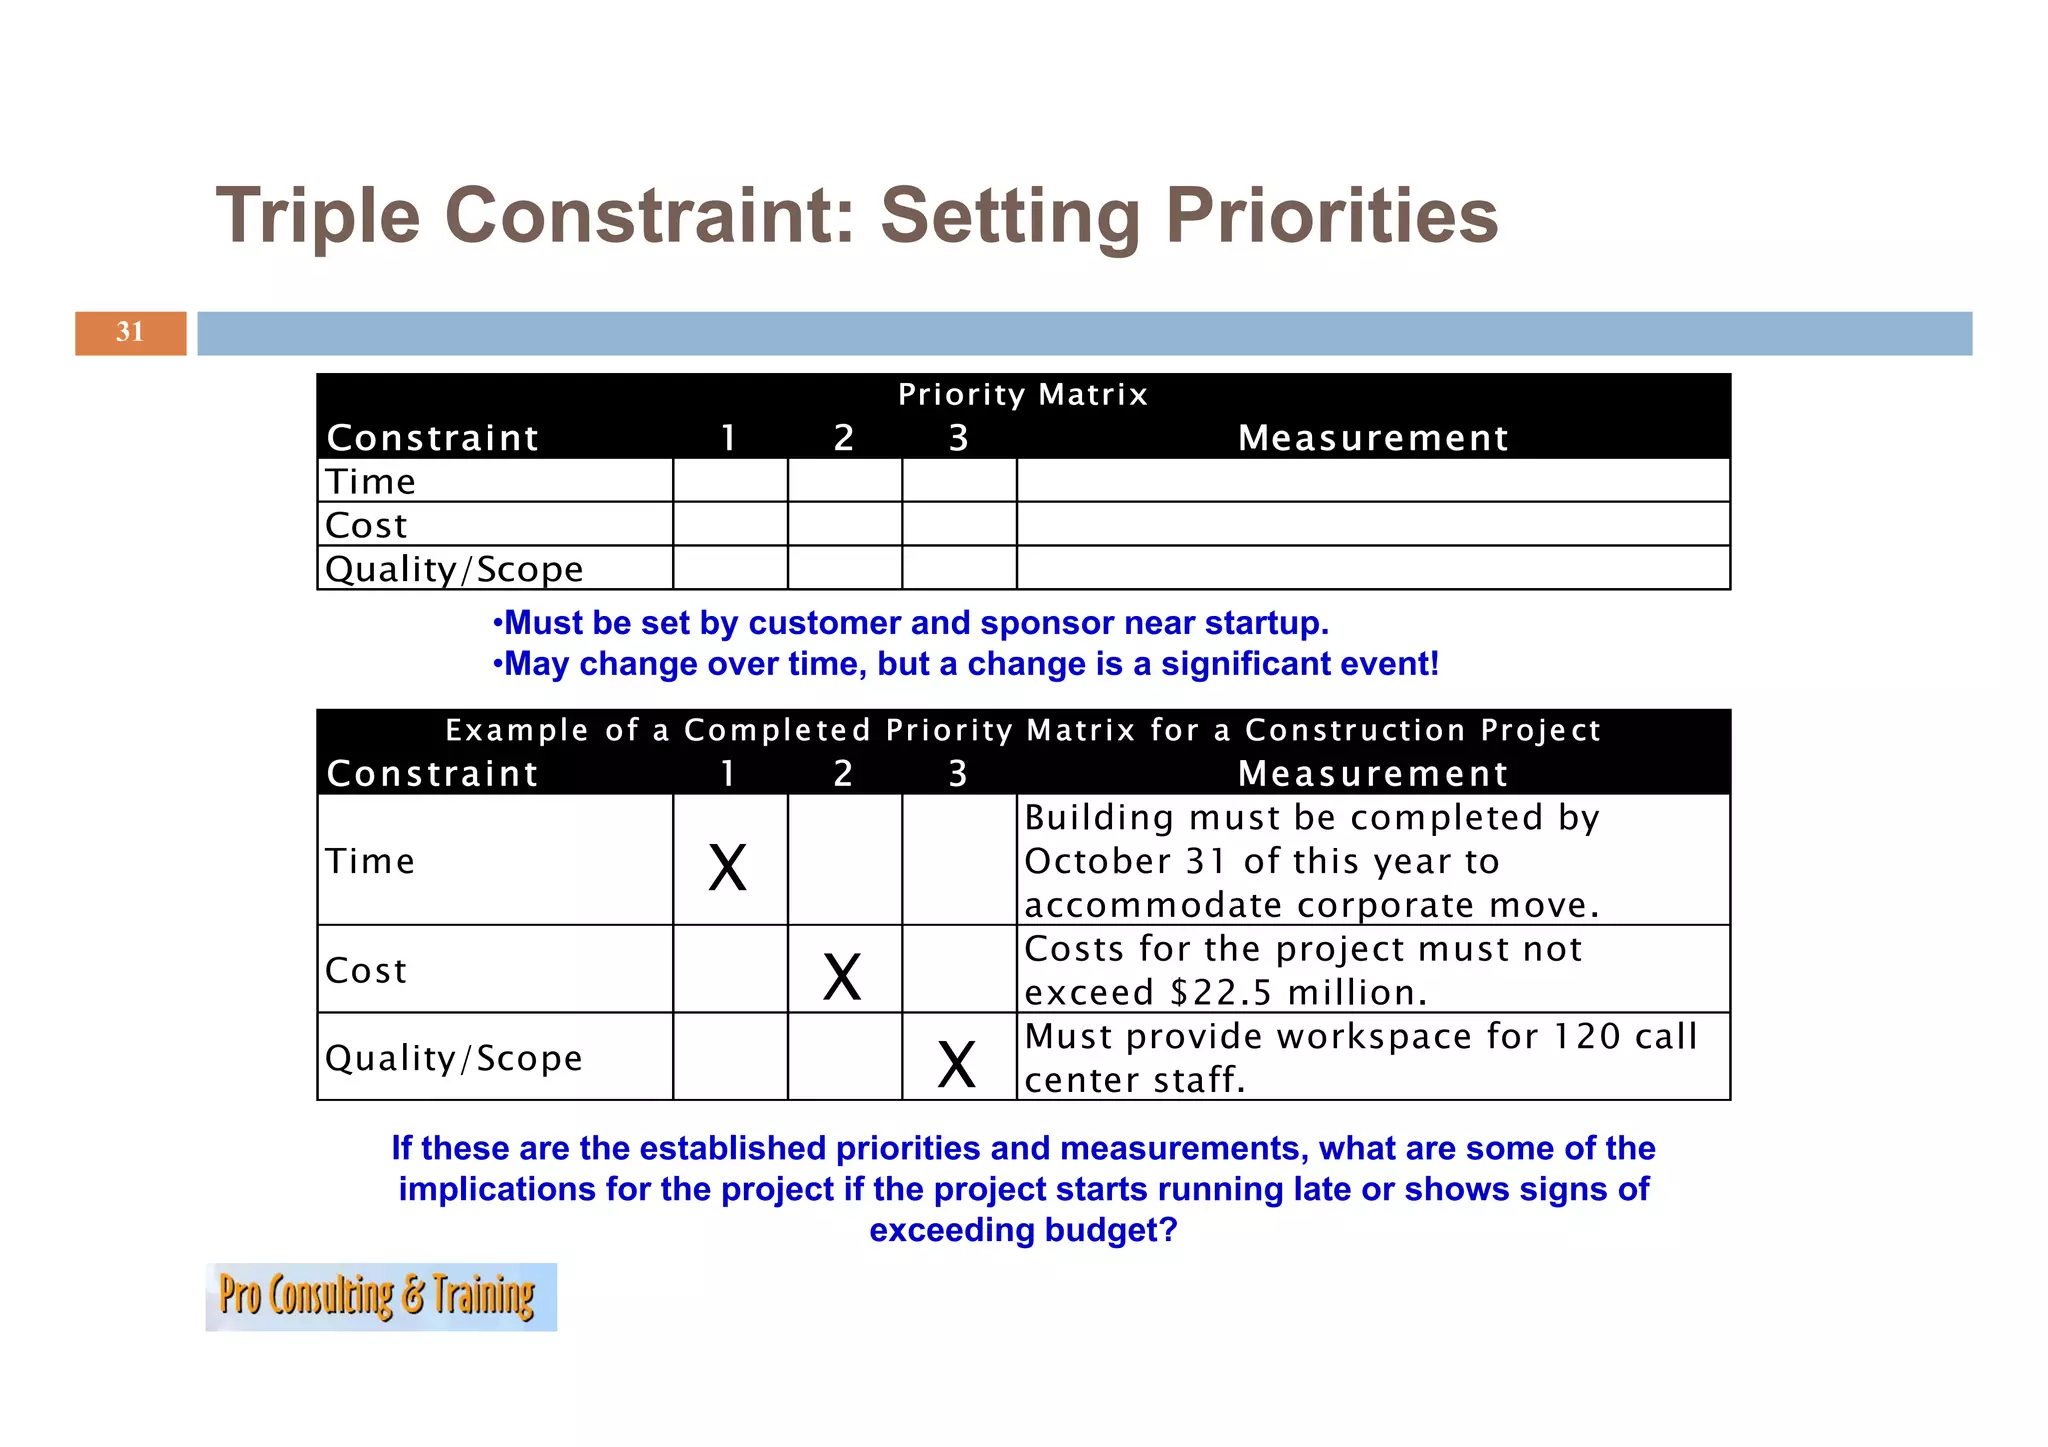
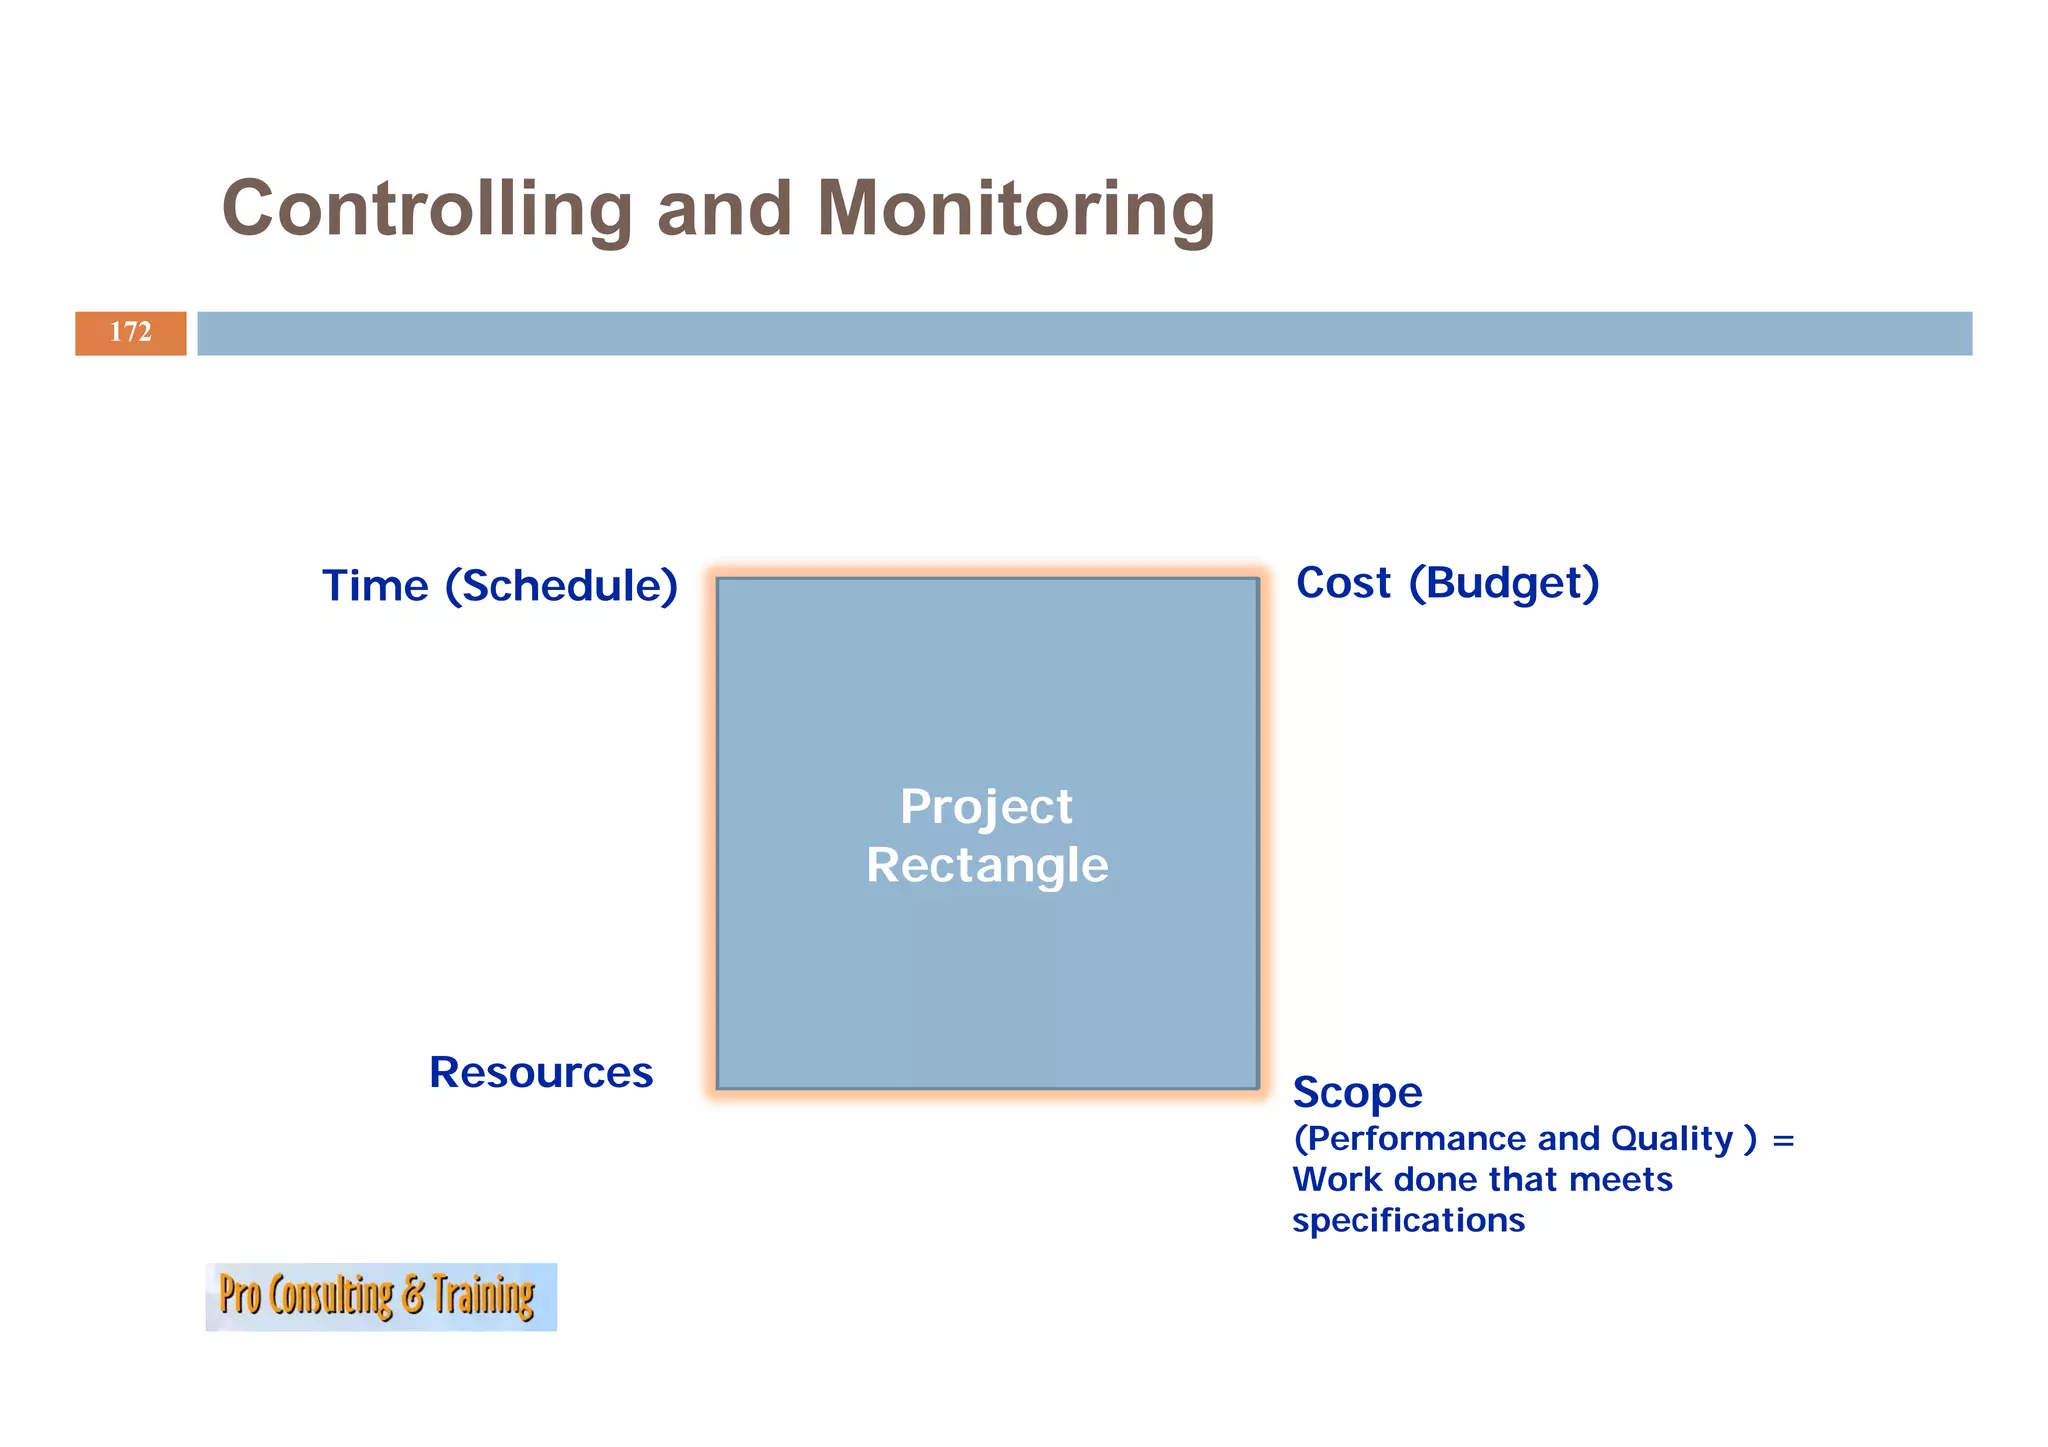
In-depth breakdown of PMI’s knowledge areas such as integration, scope, time, cost, quality, human resources, communications, risk, and procurement. Definition and systematic processes of project management addressing resources and tasks. Focus on the triple constraints: time, cost, and quality/scope, and their trade-offs in project management.
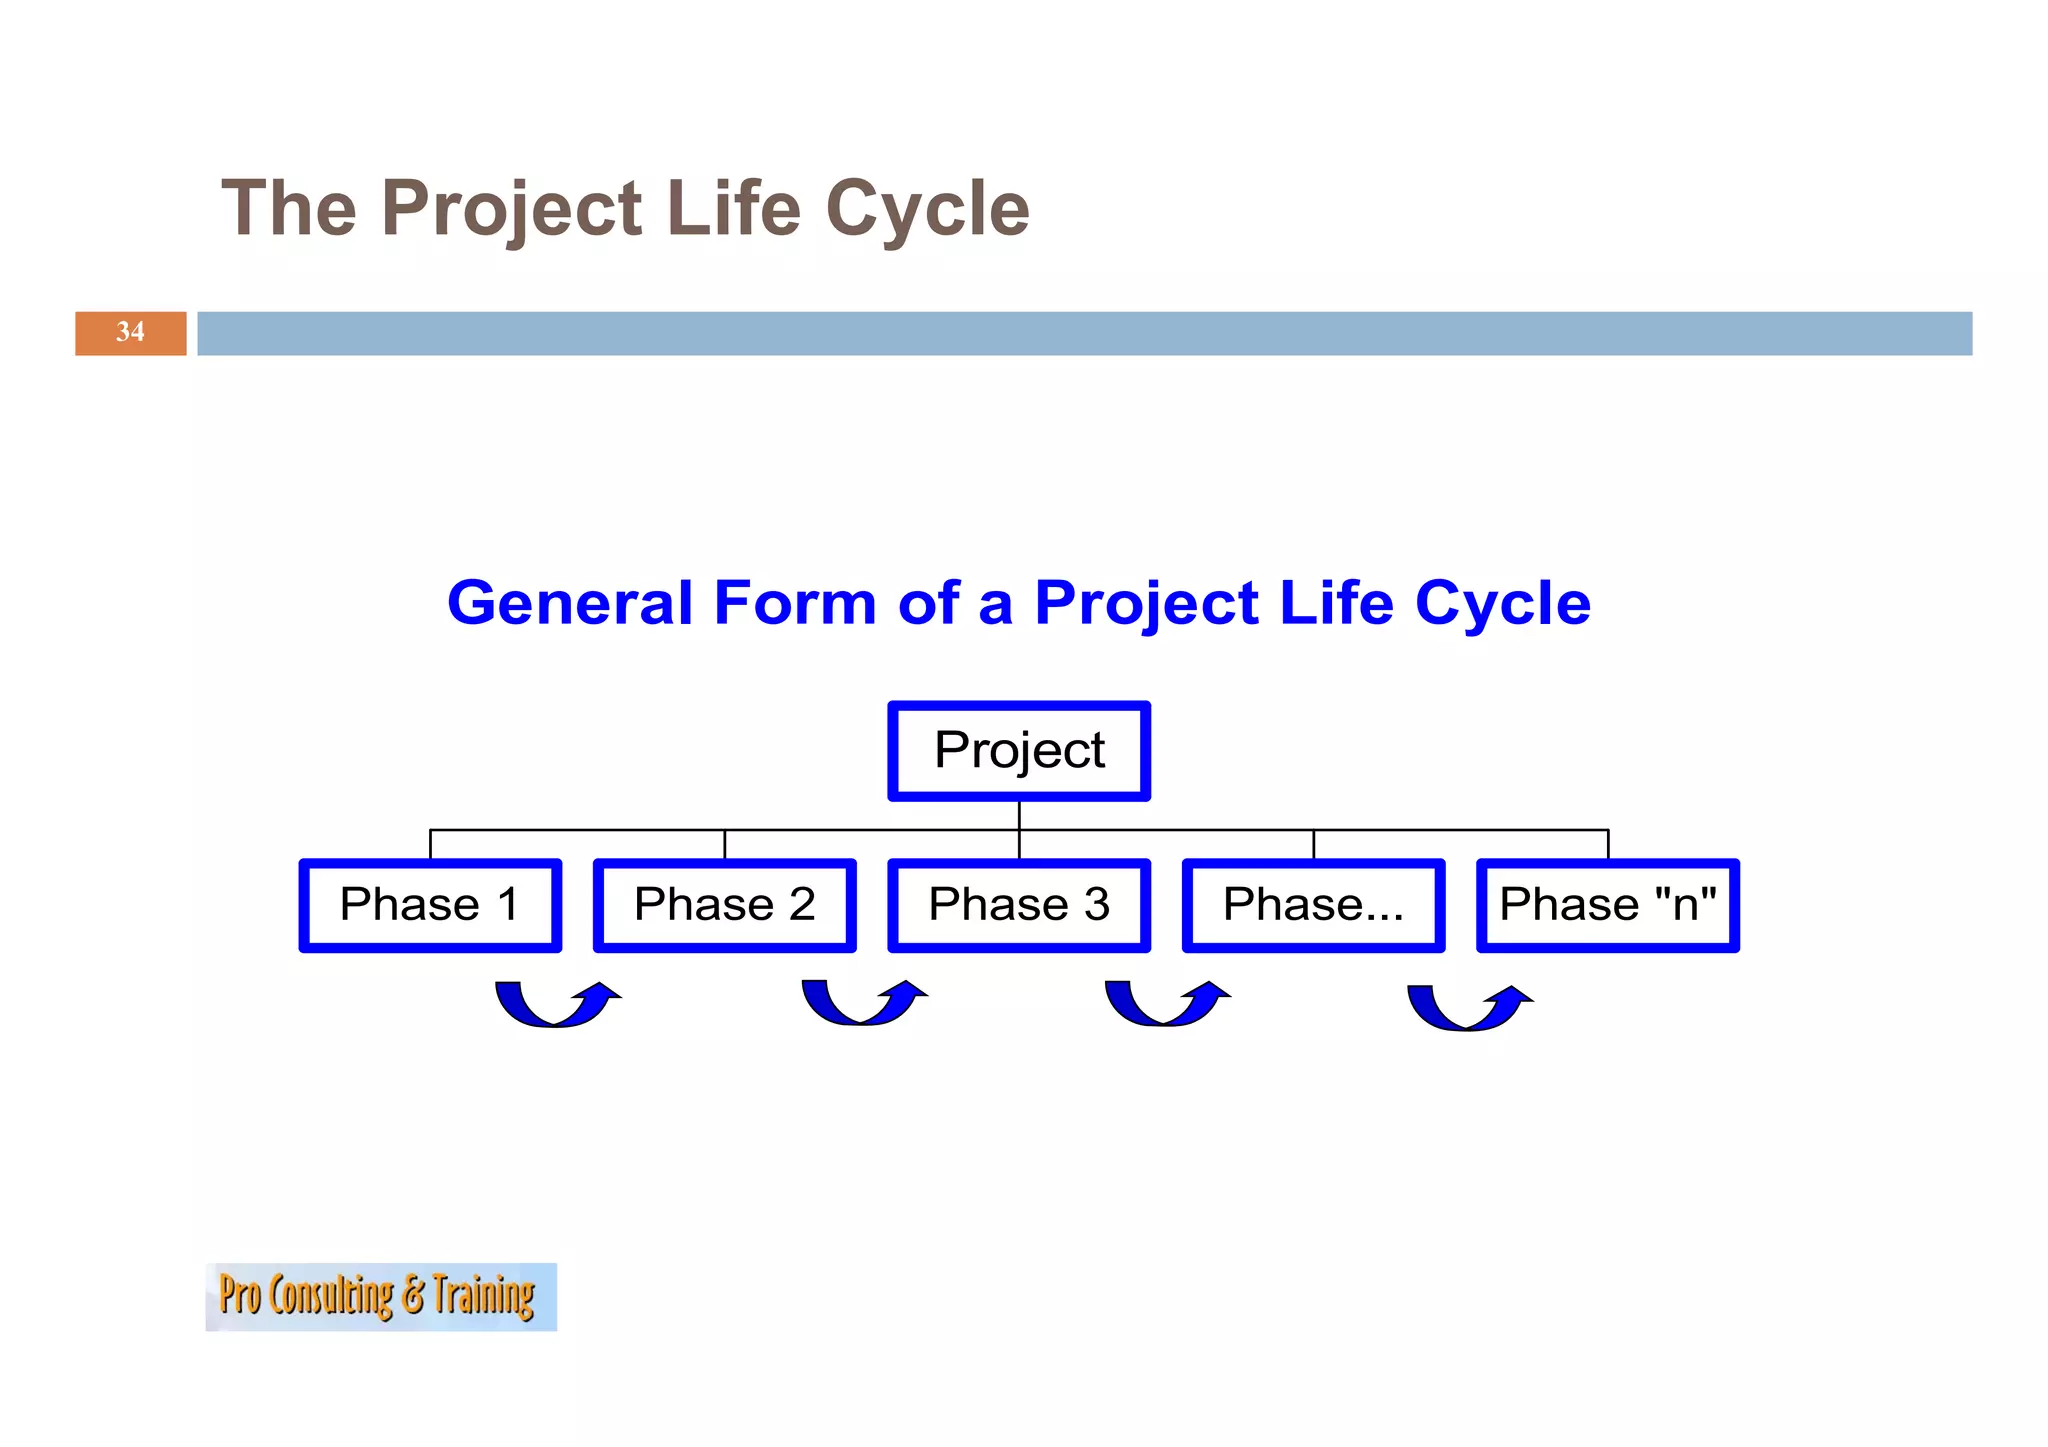
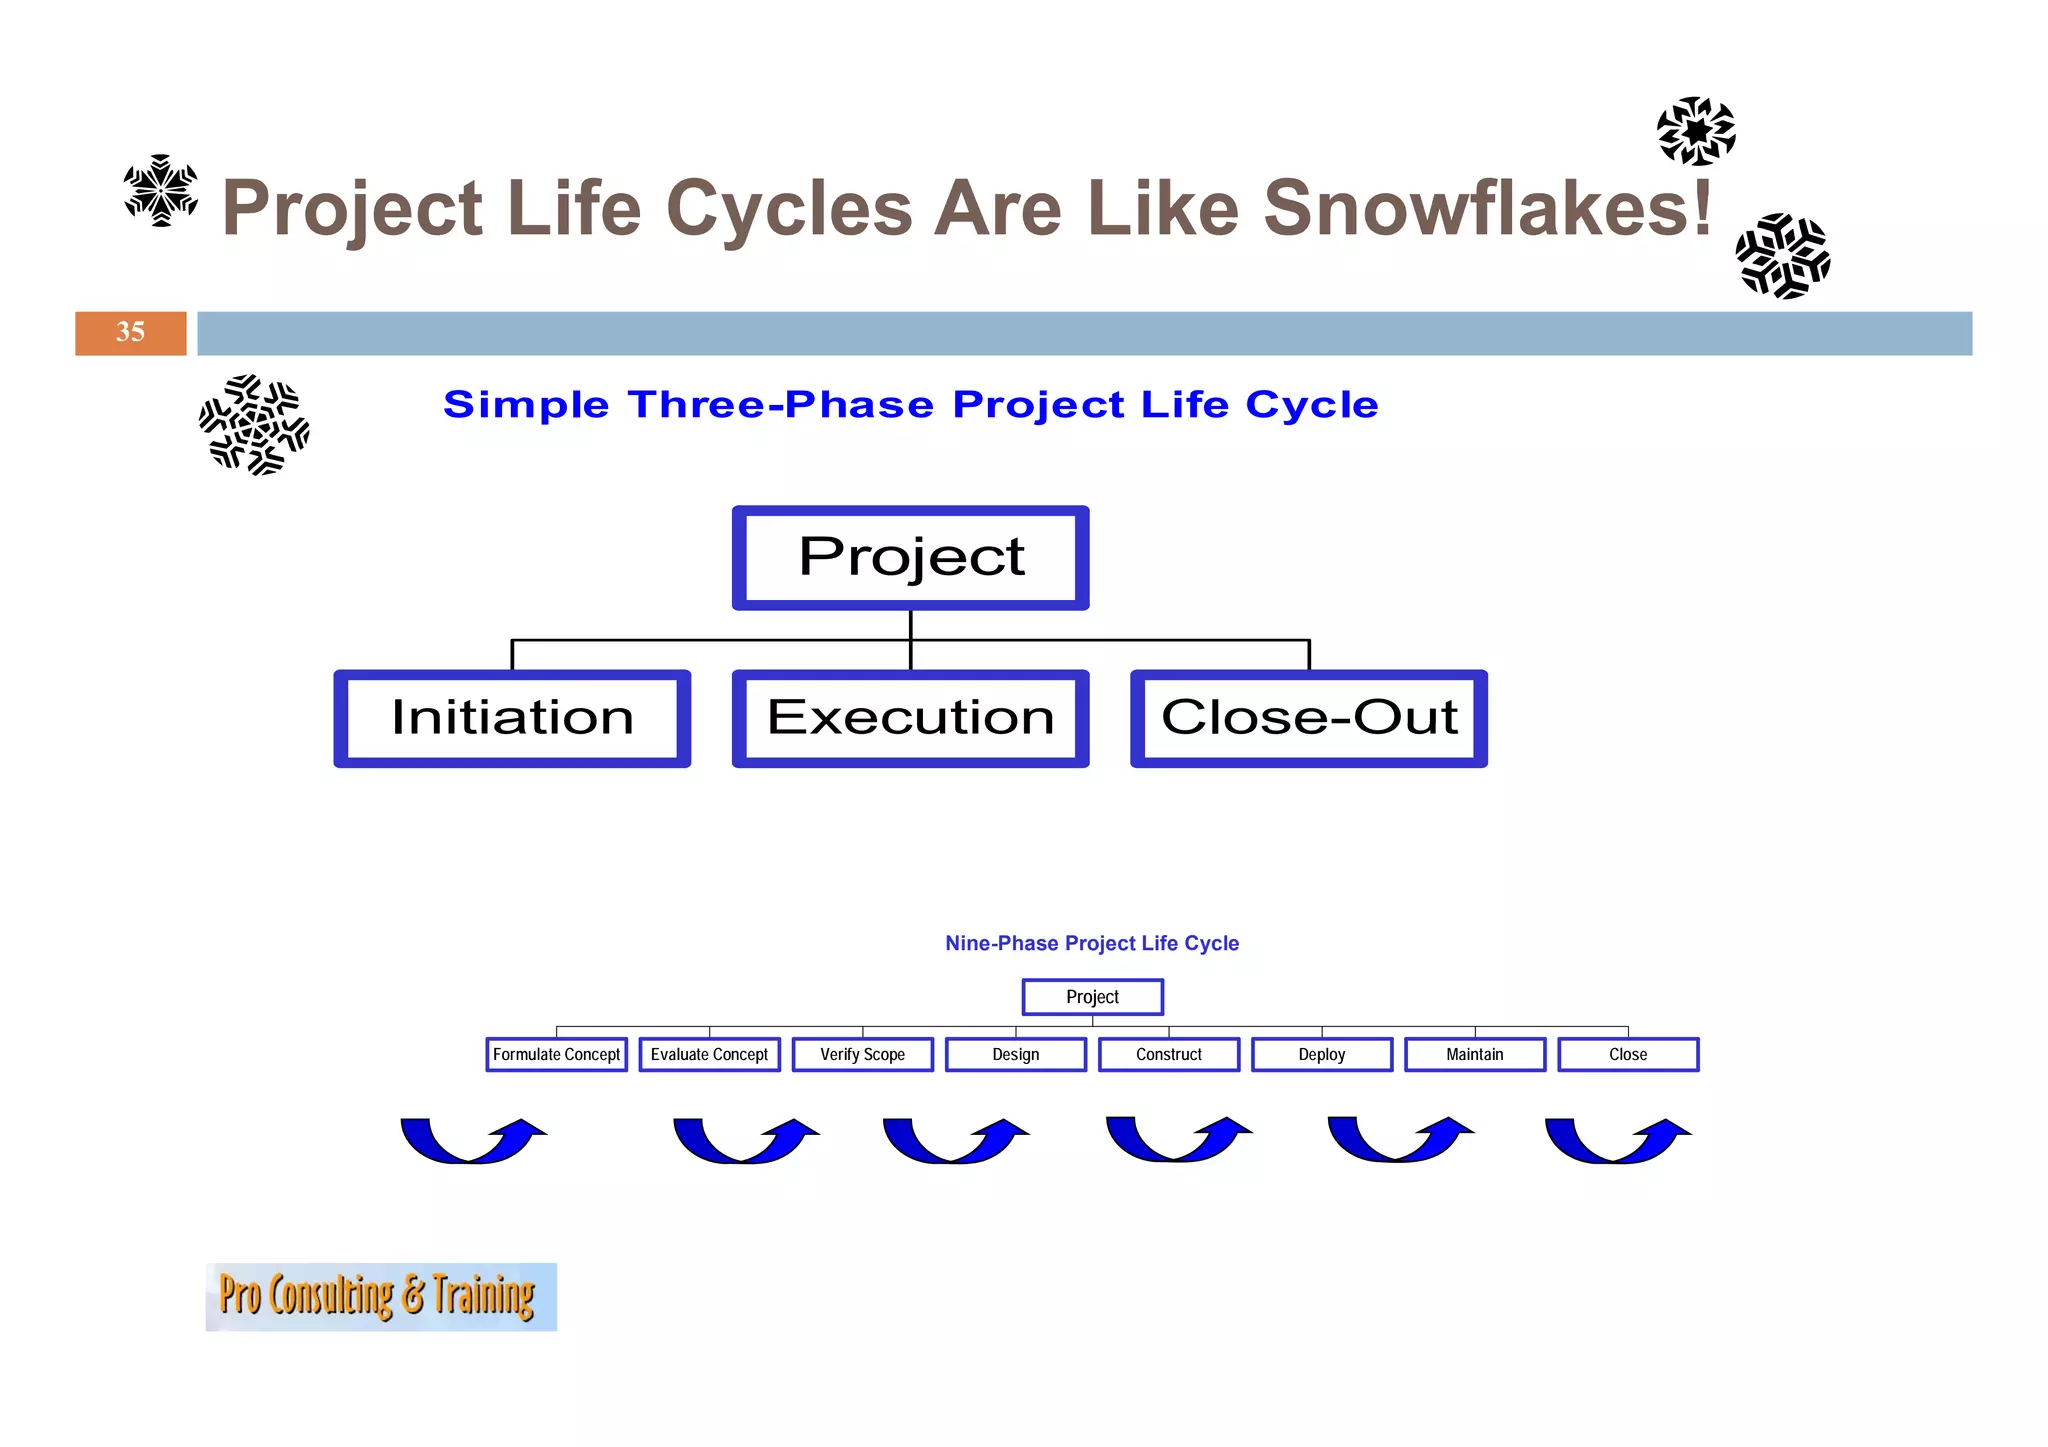
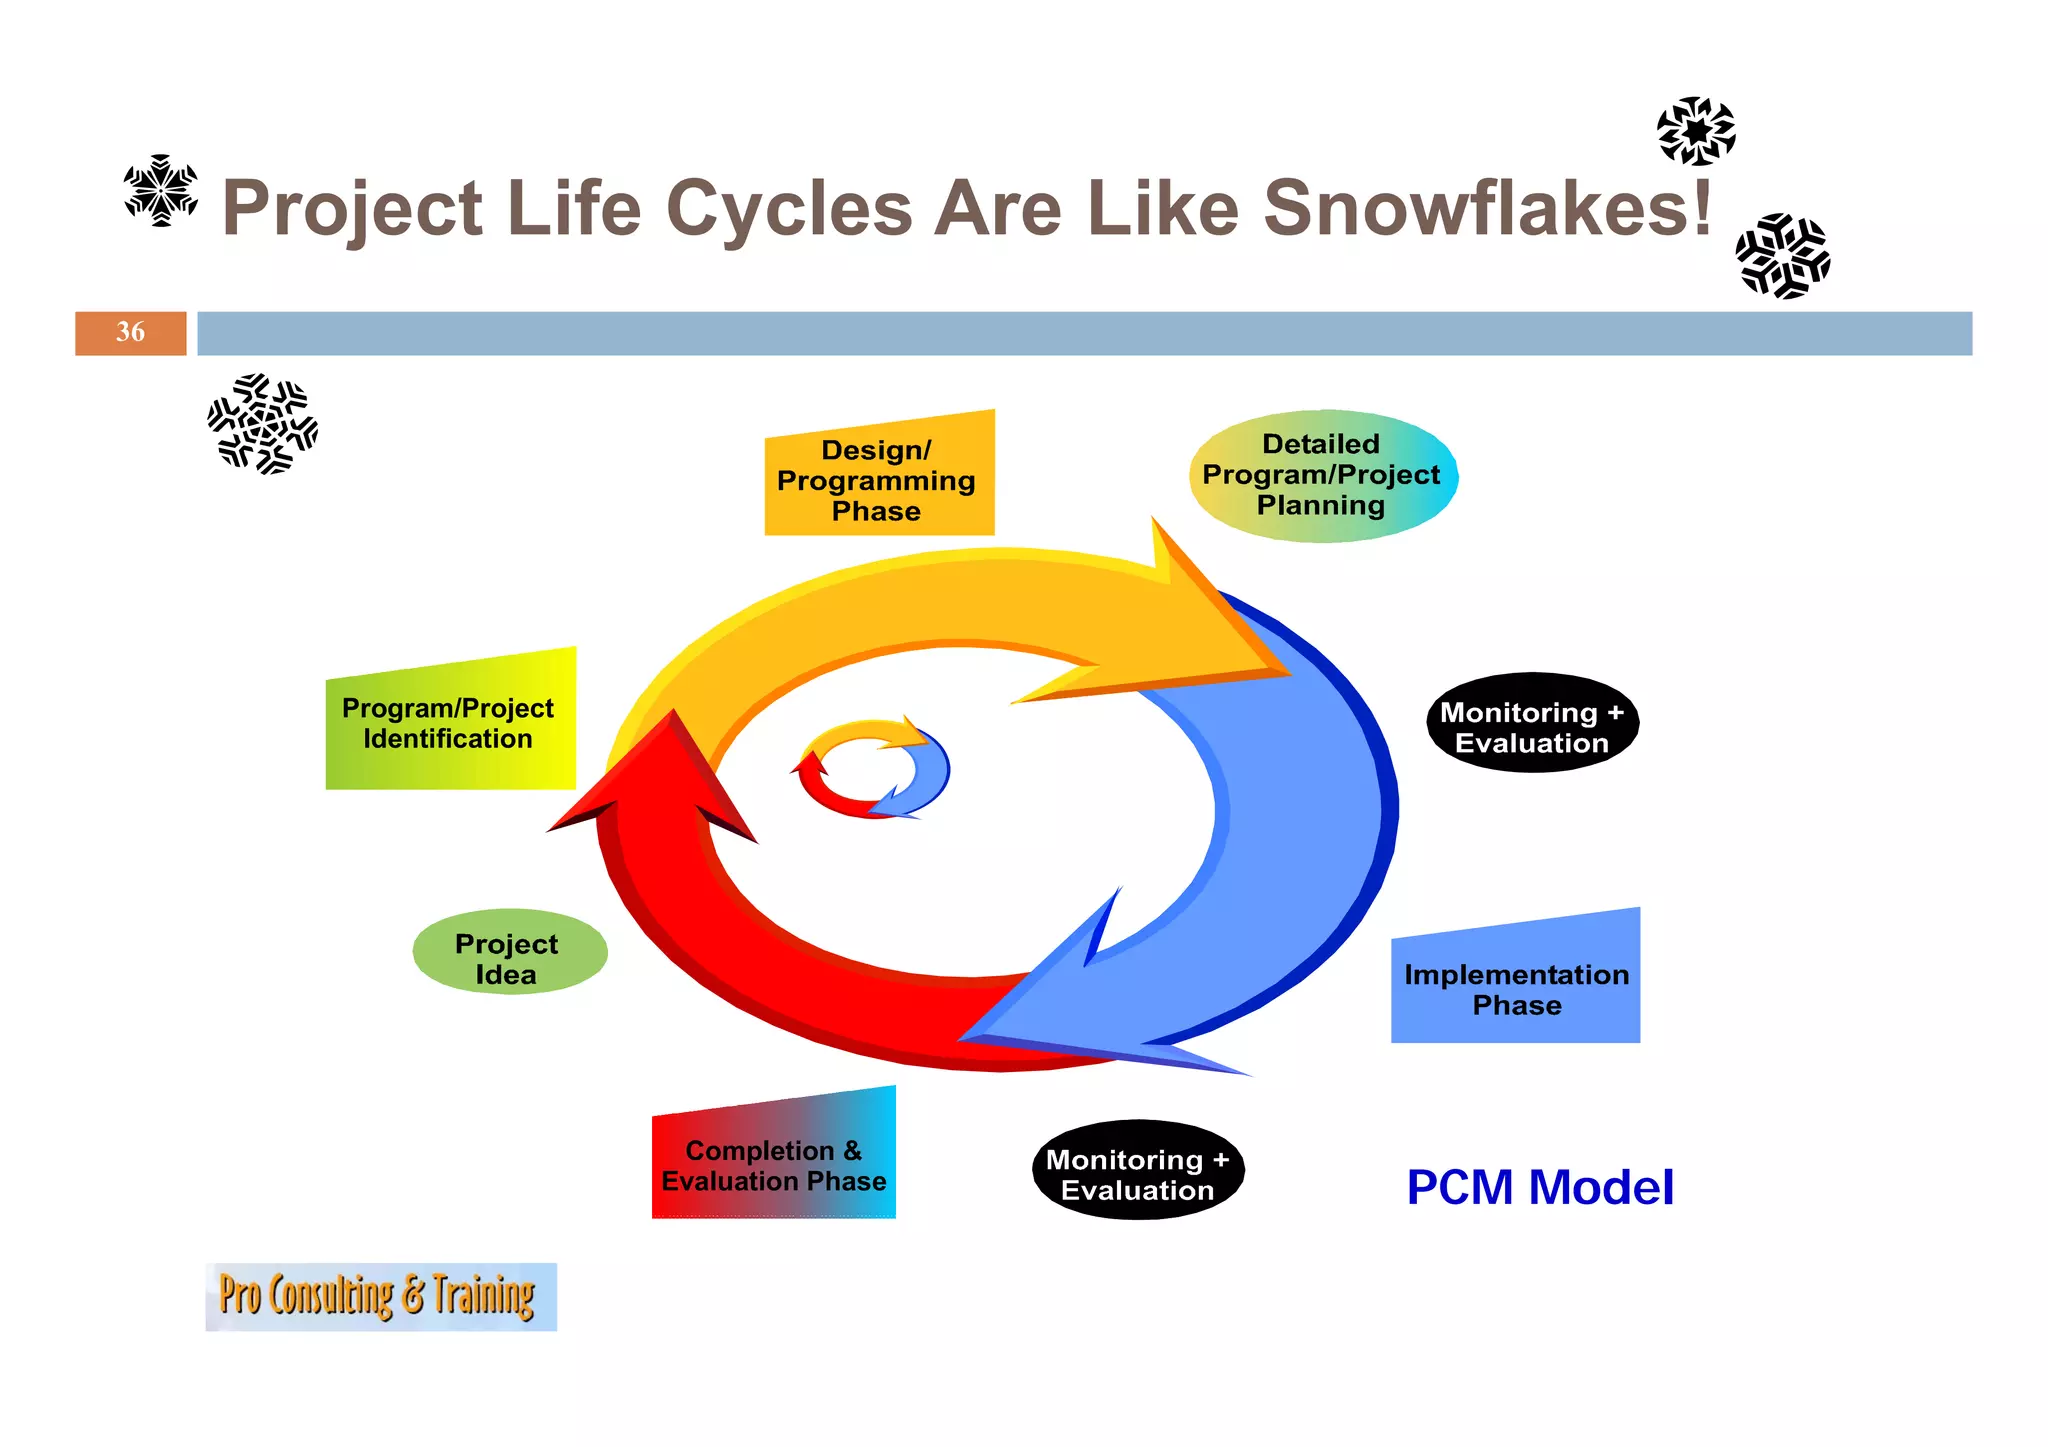
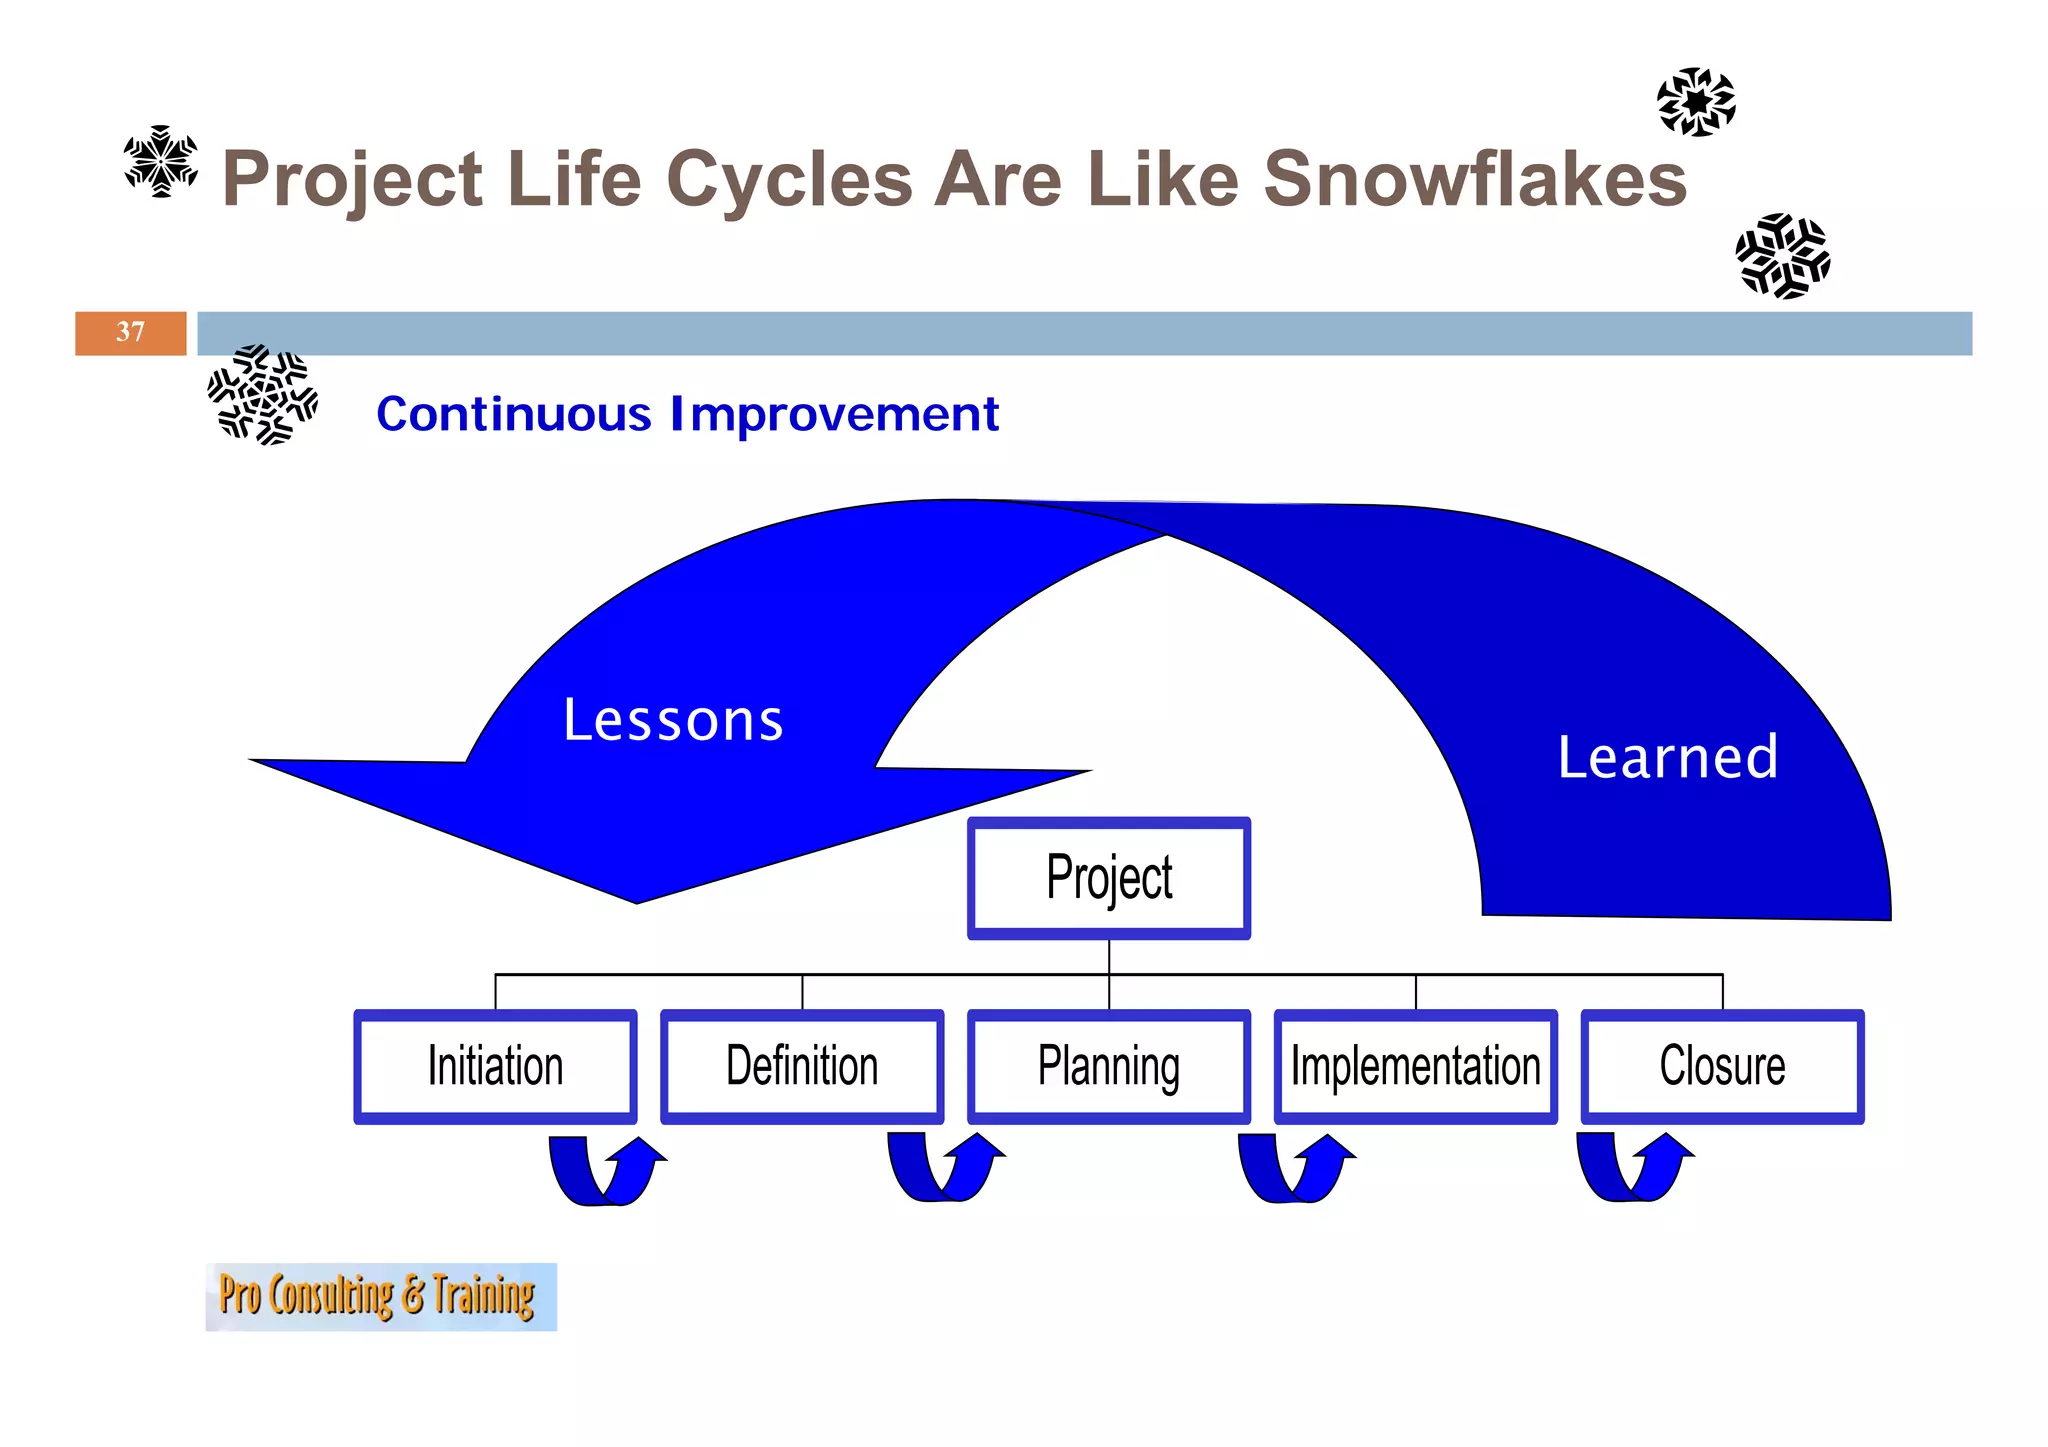
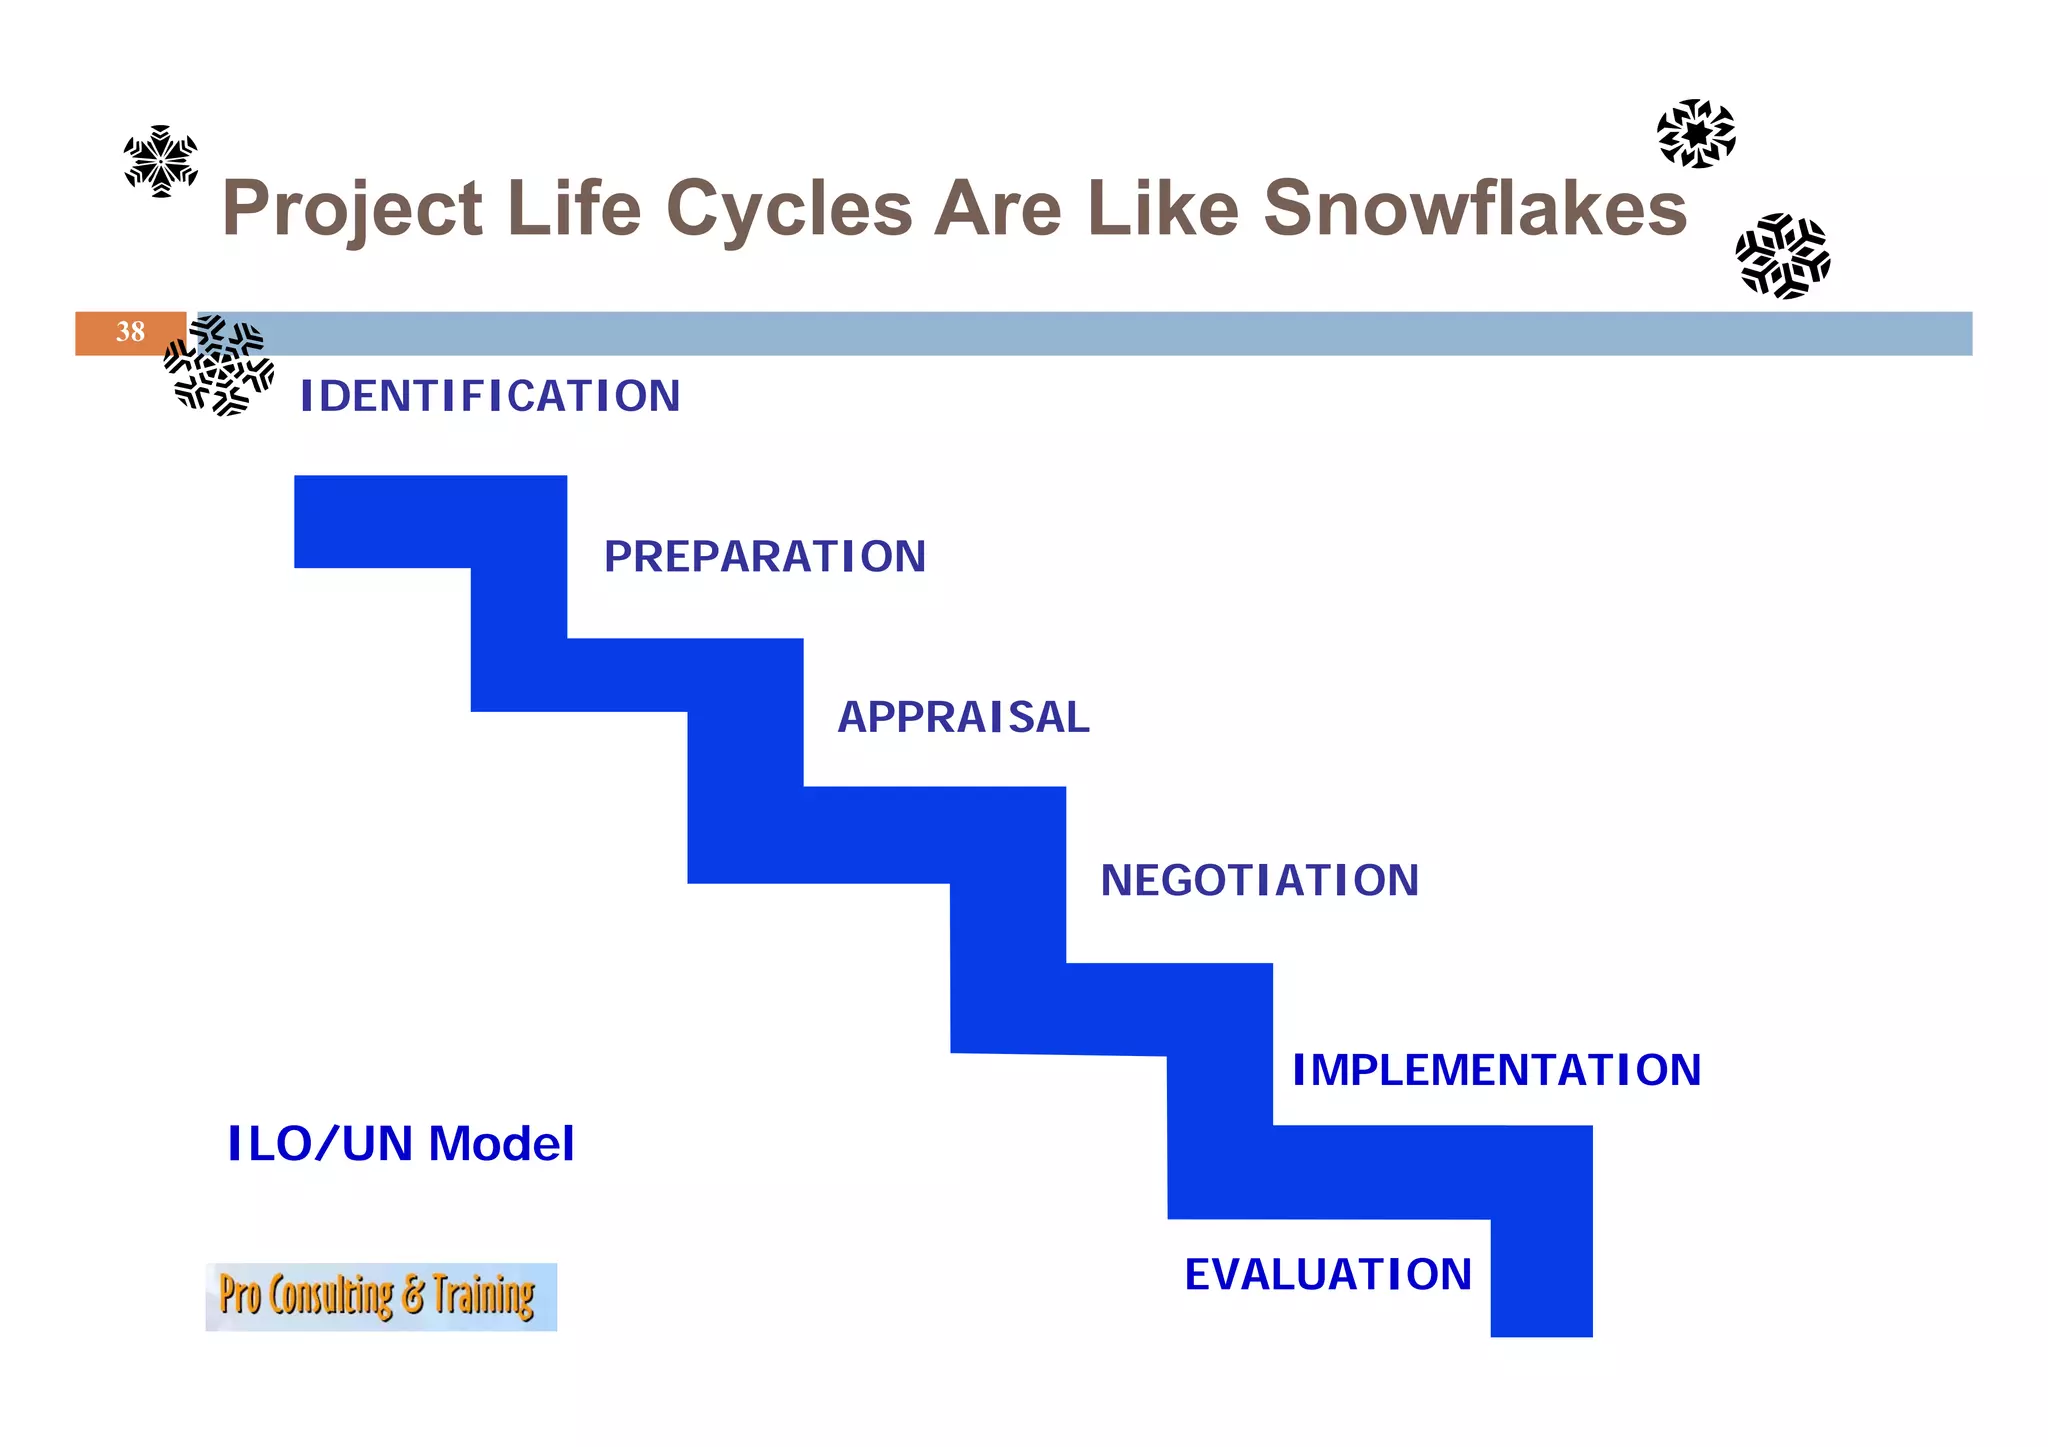
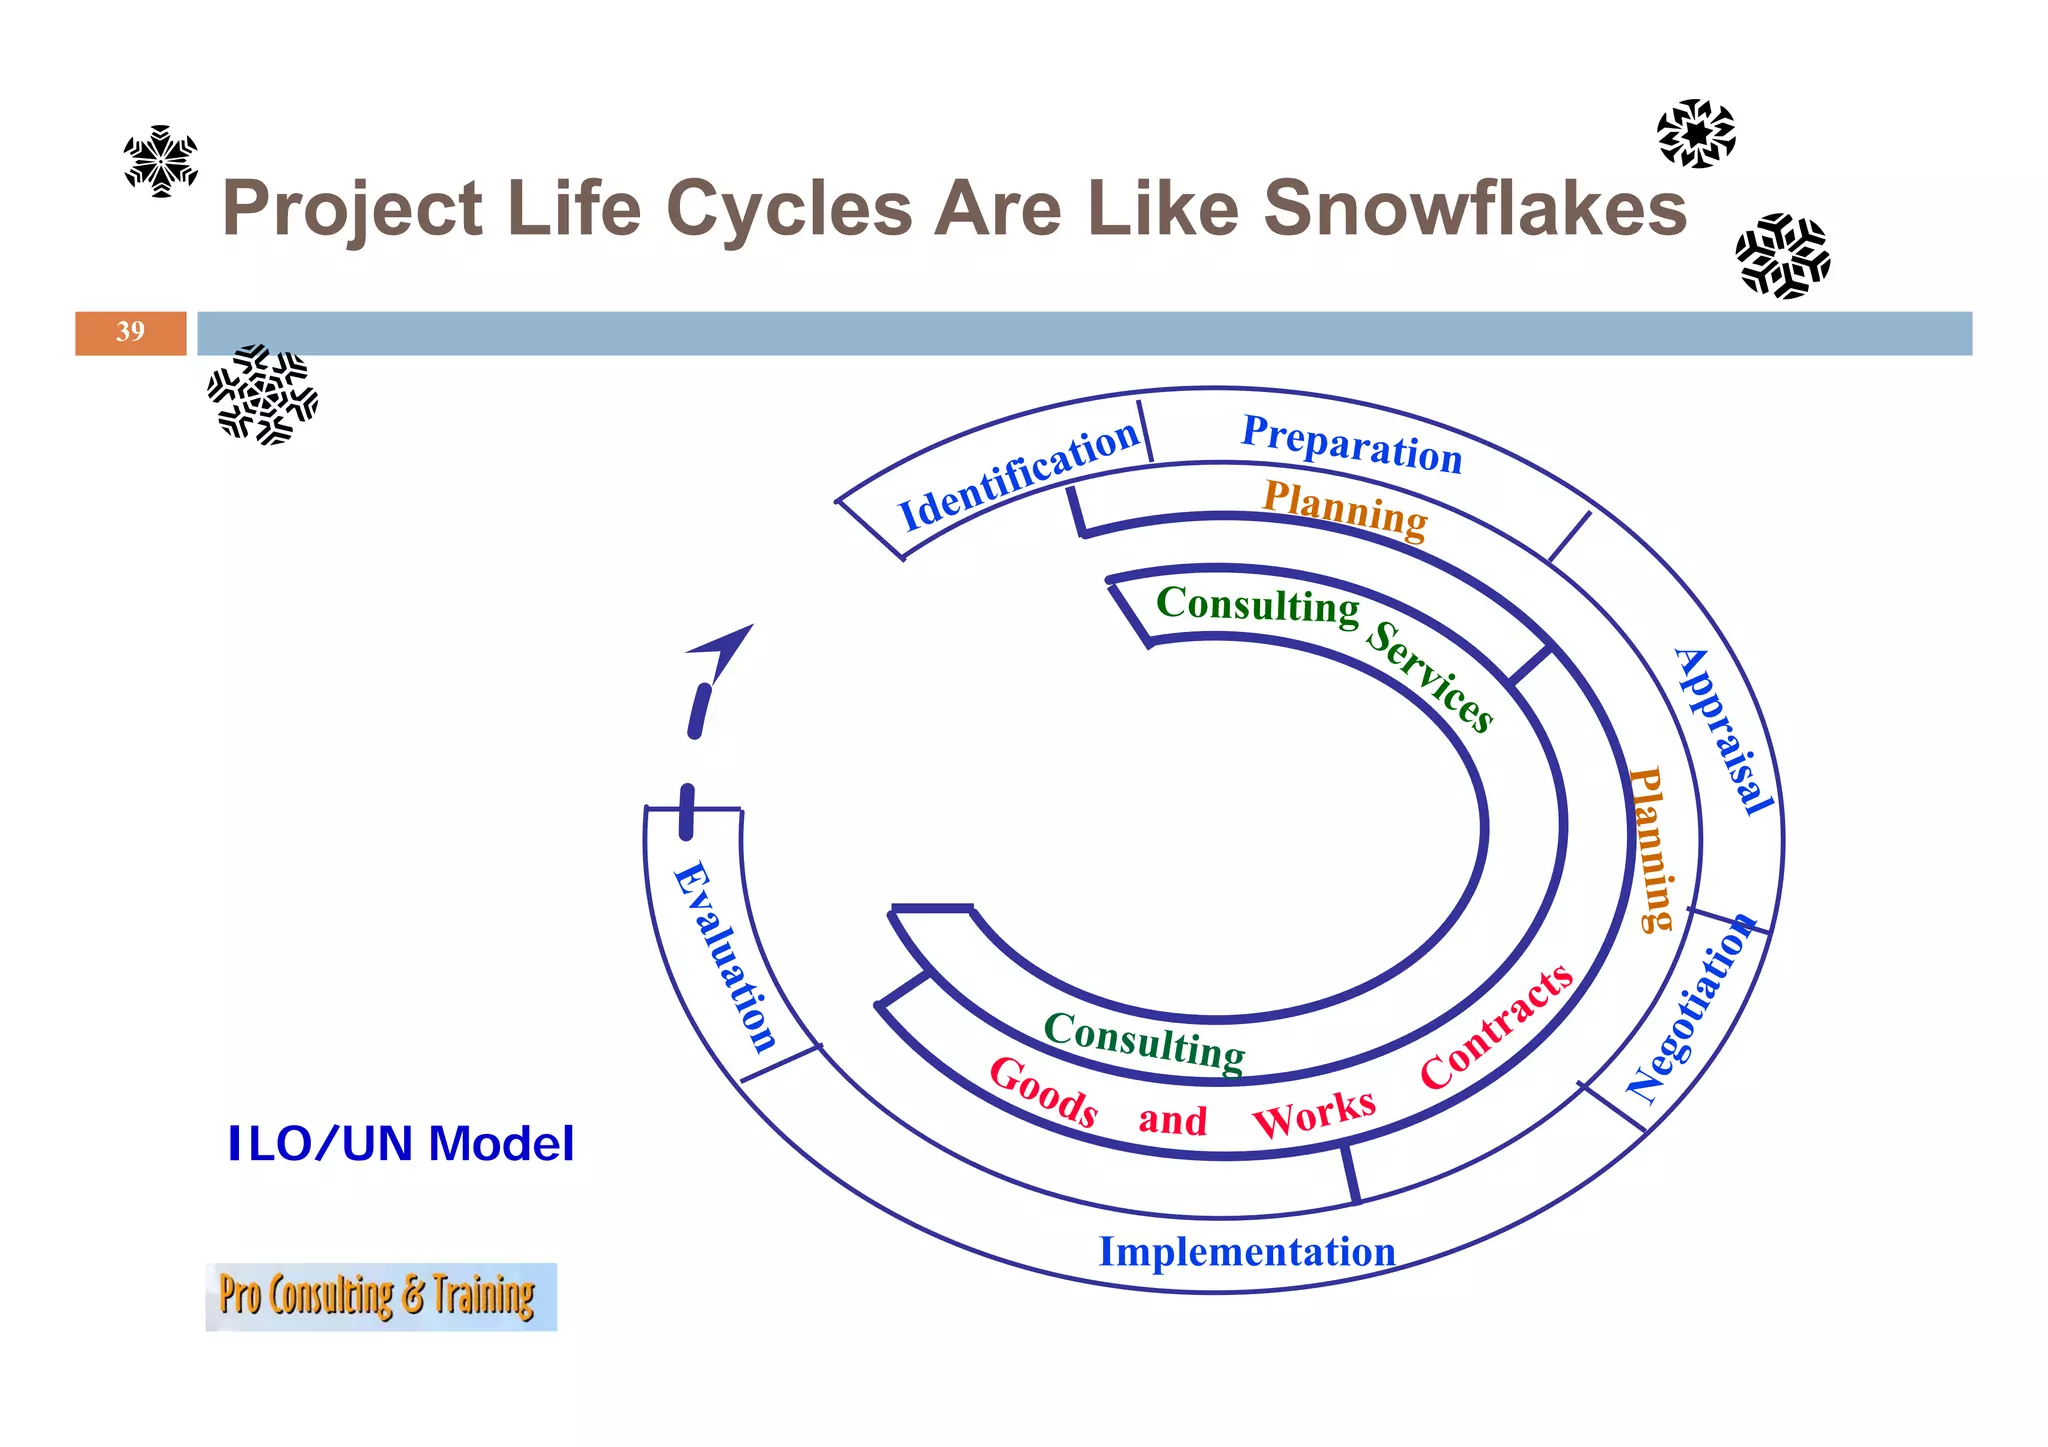
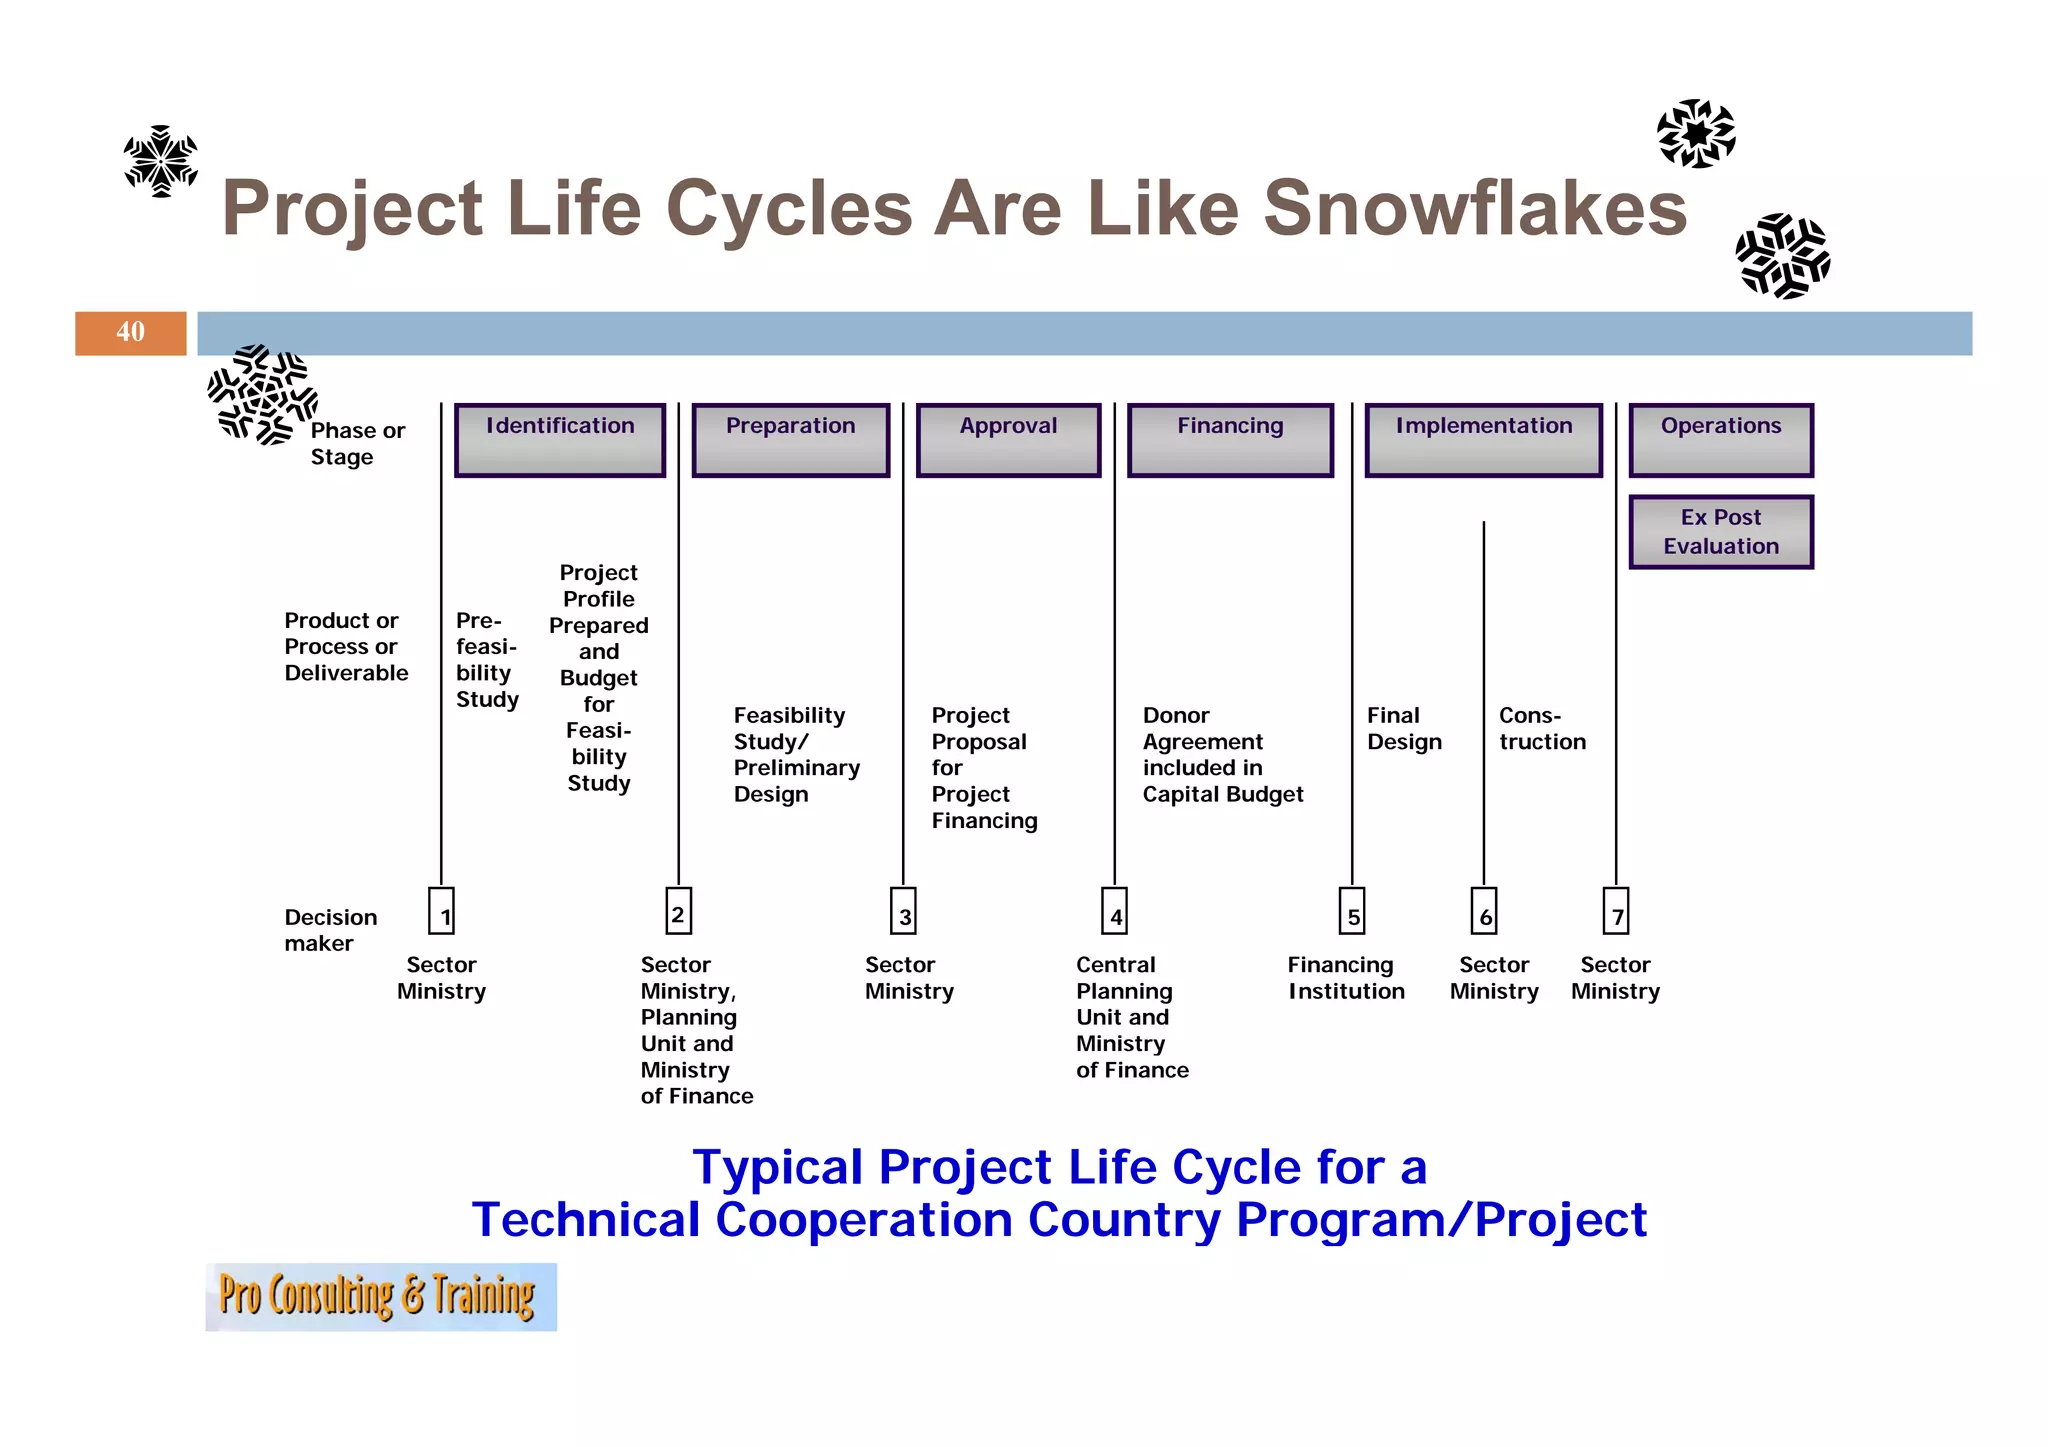
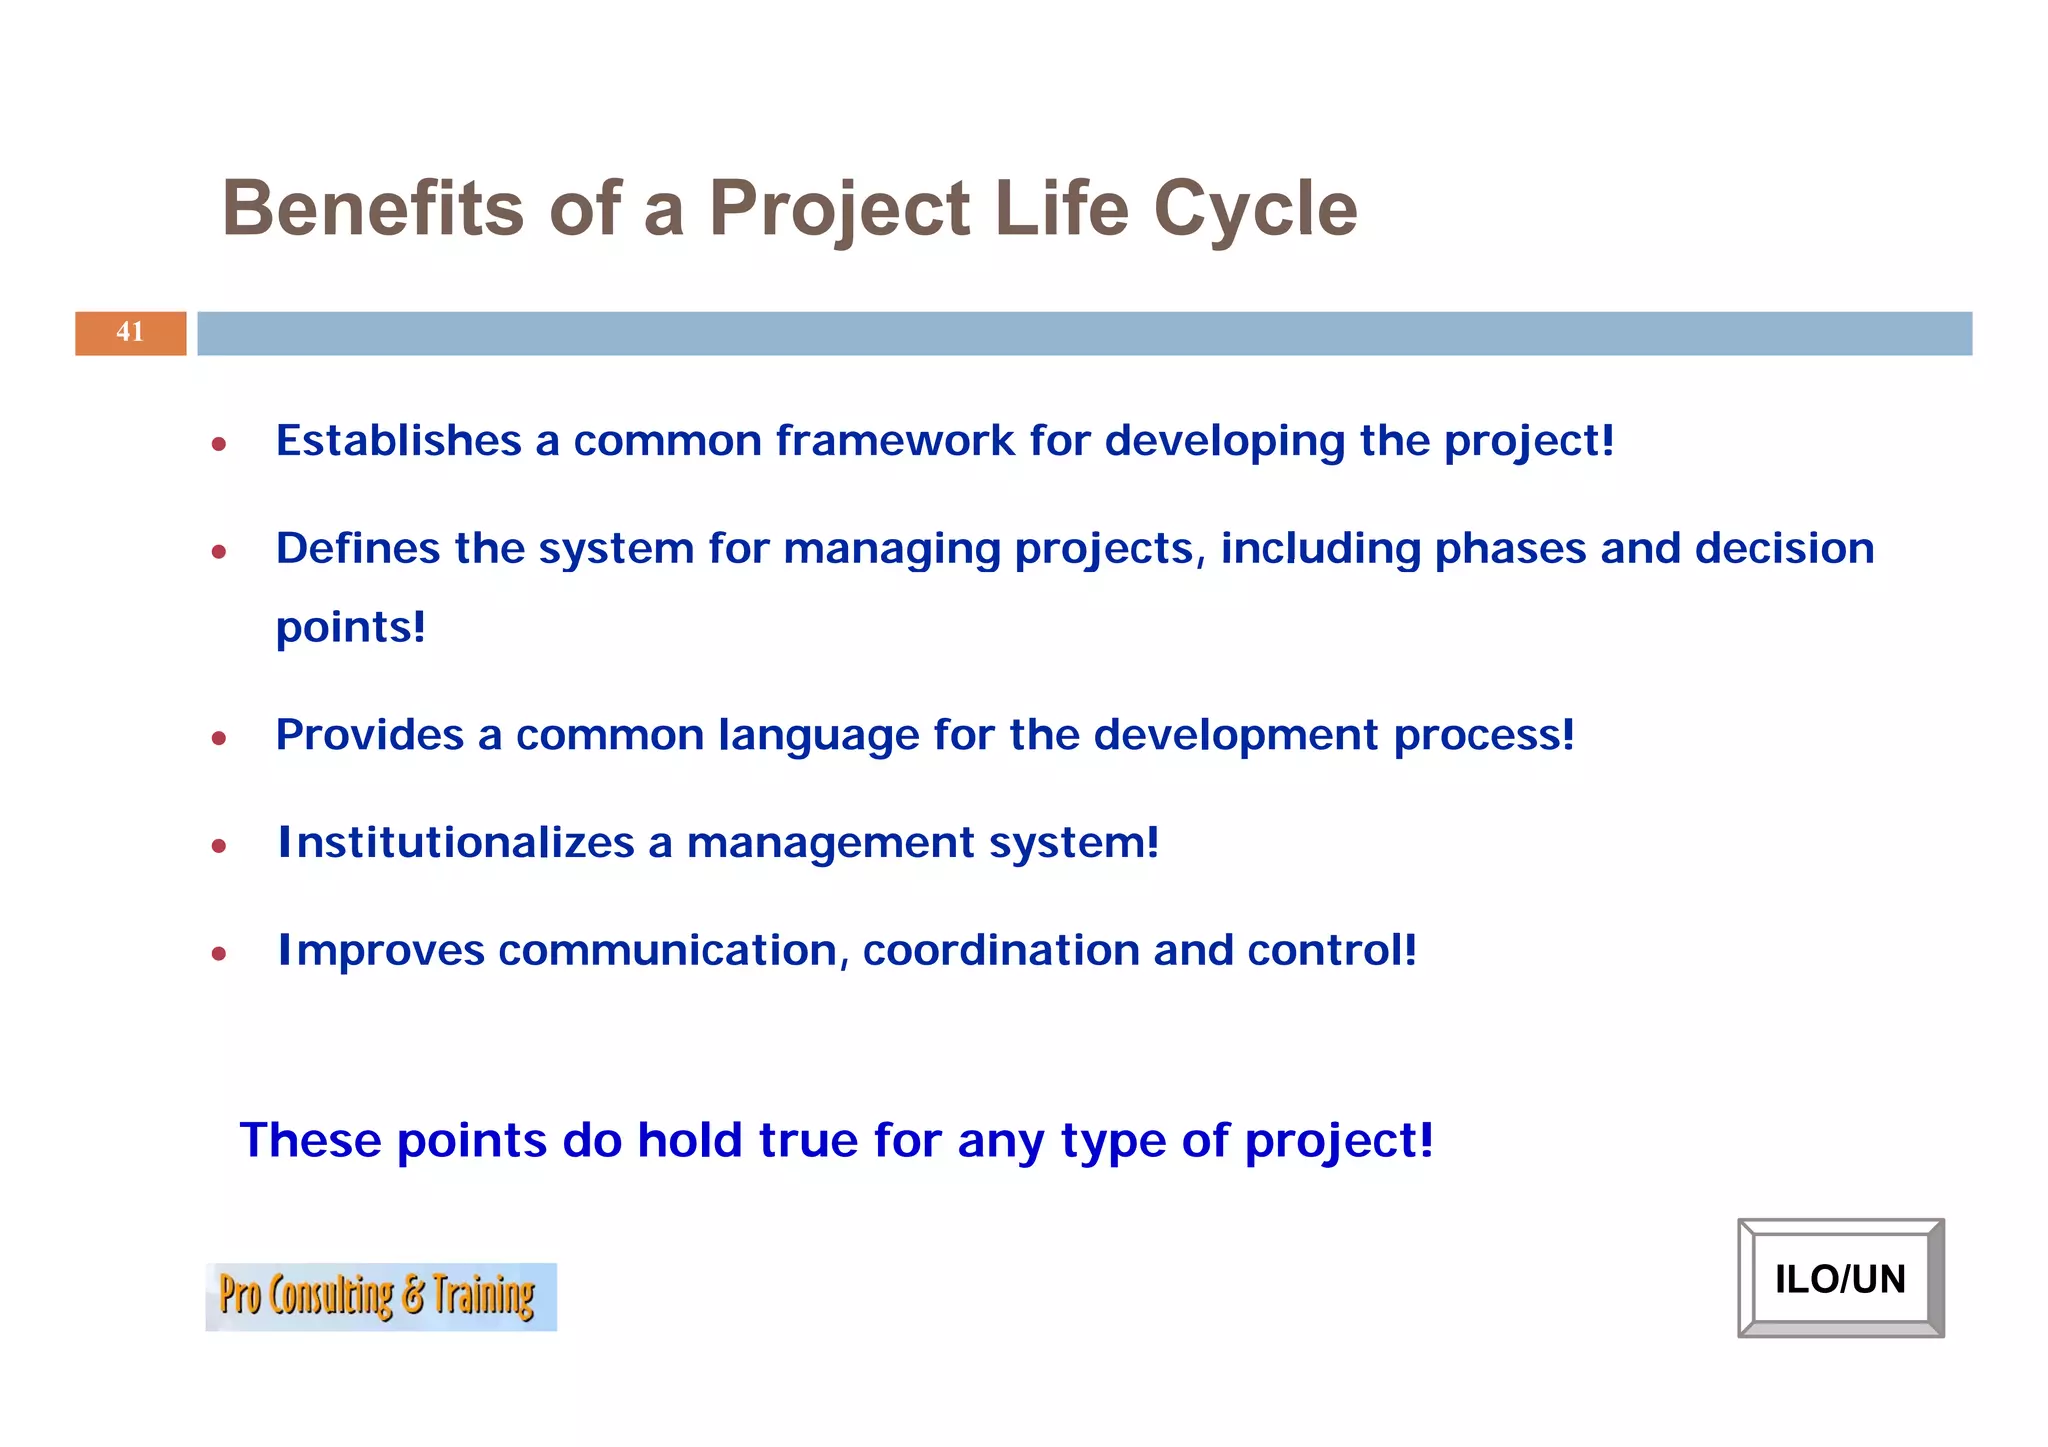
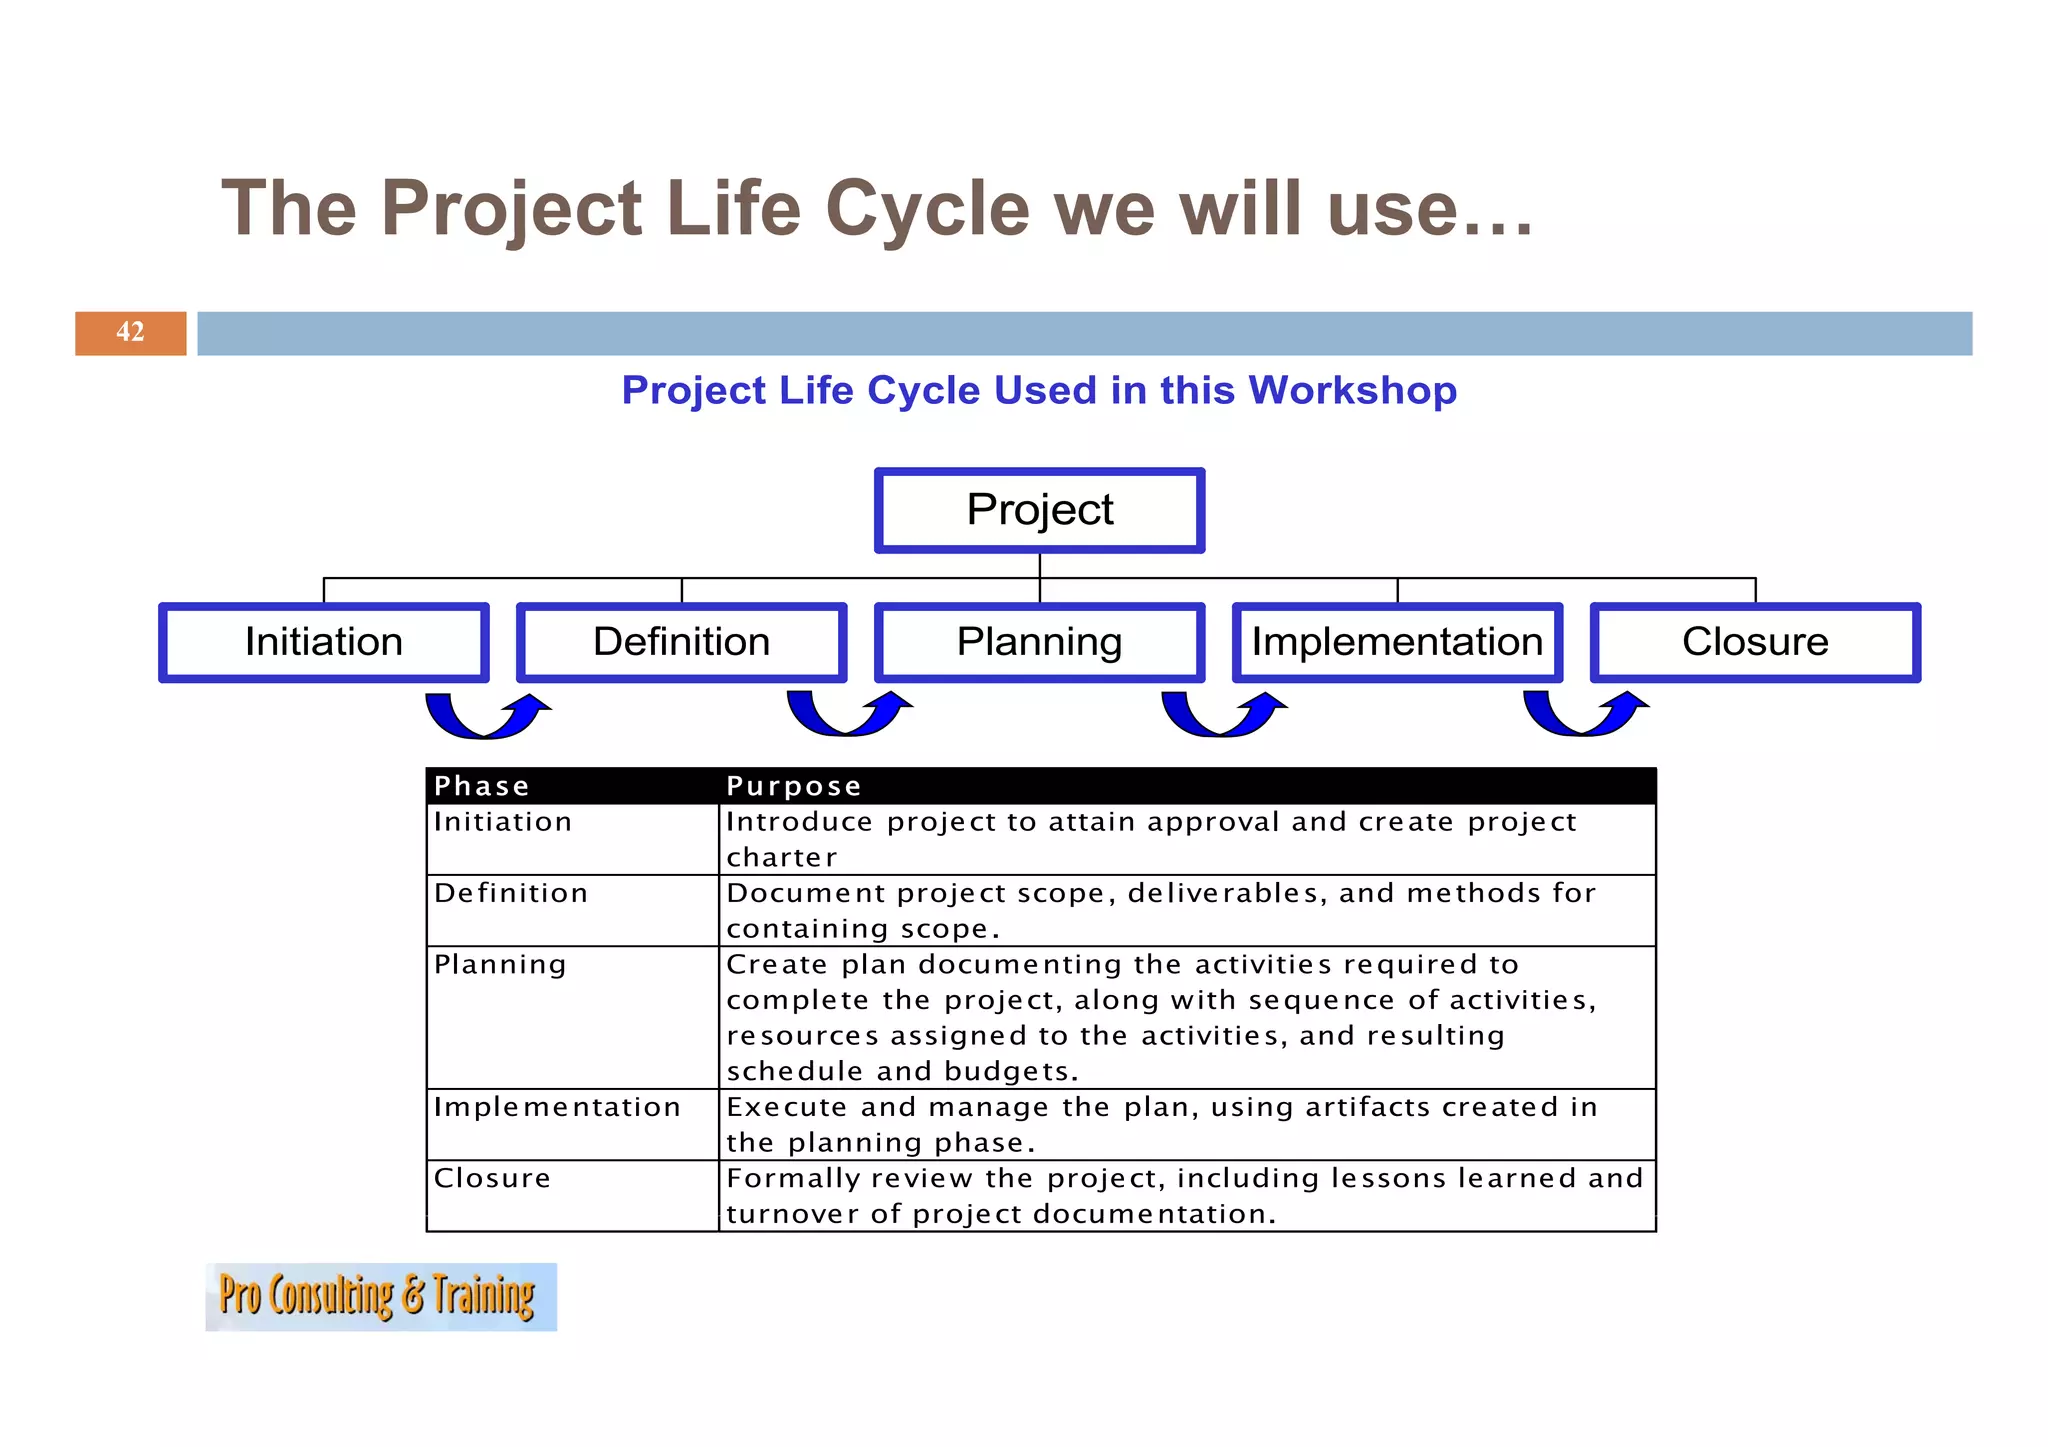
Introduction to the project life cycle phases emphasizing the importance of structured project management.
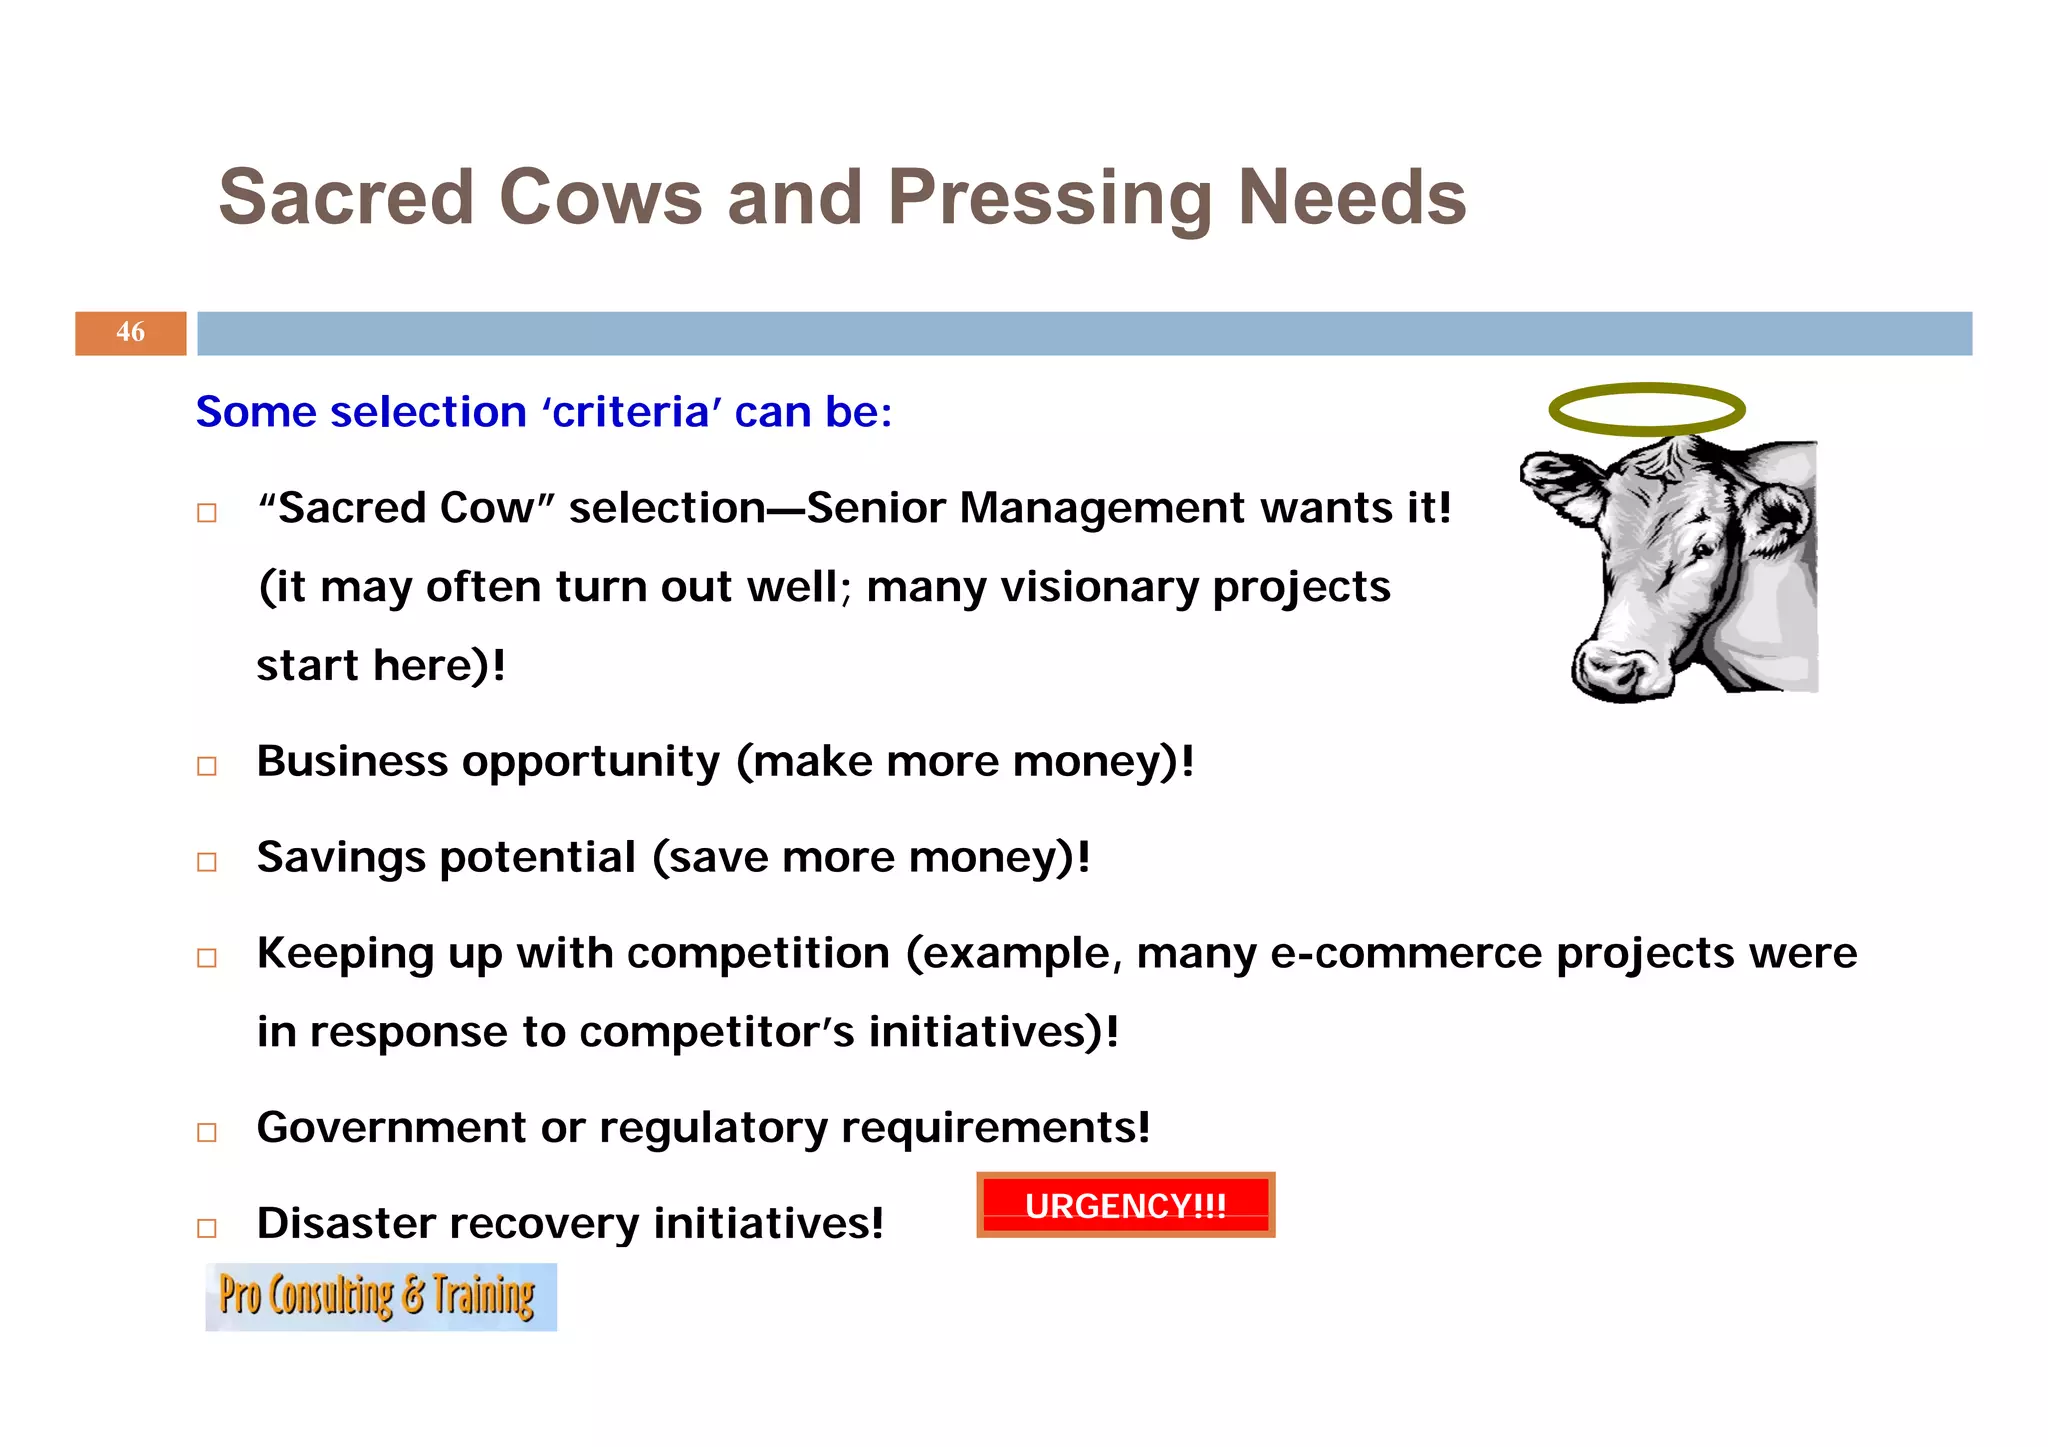
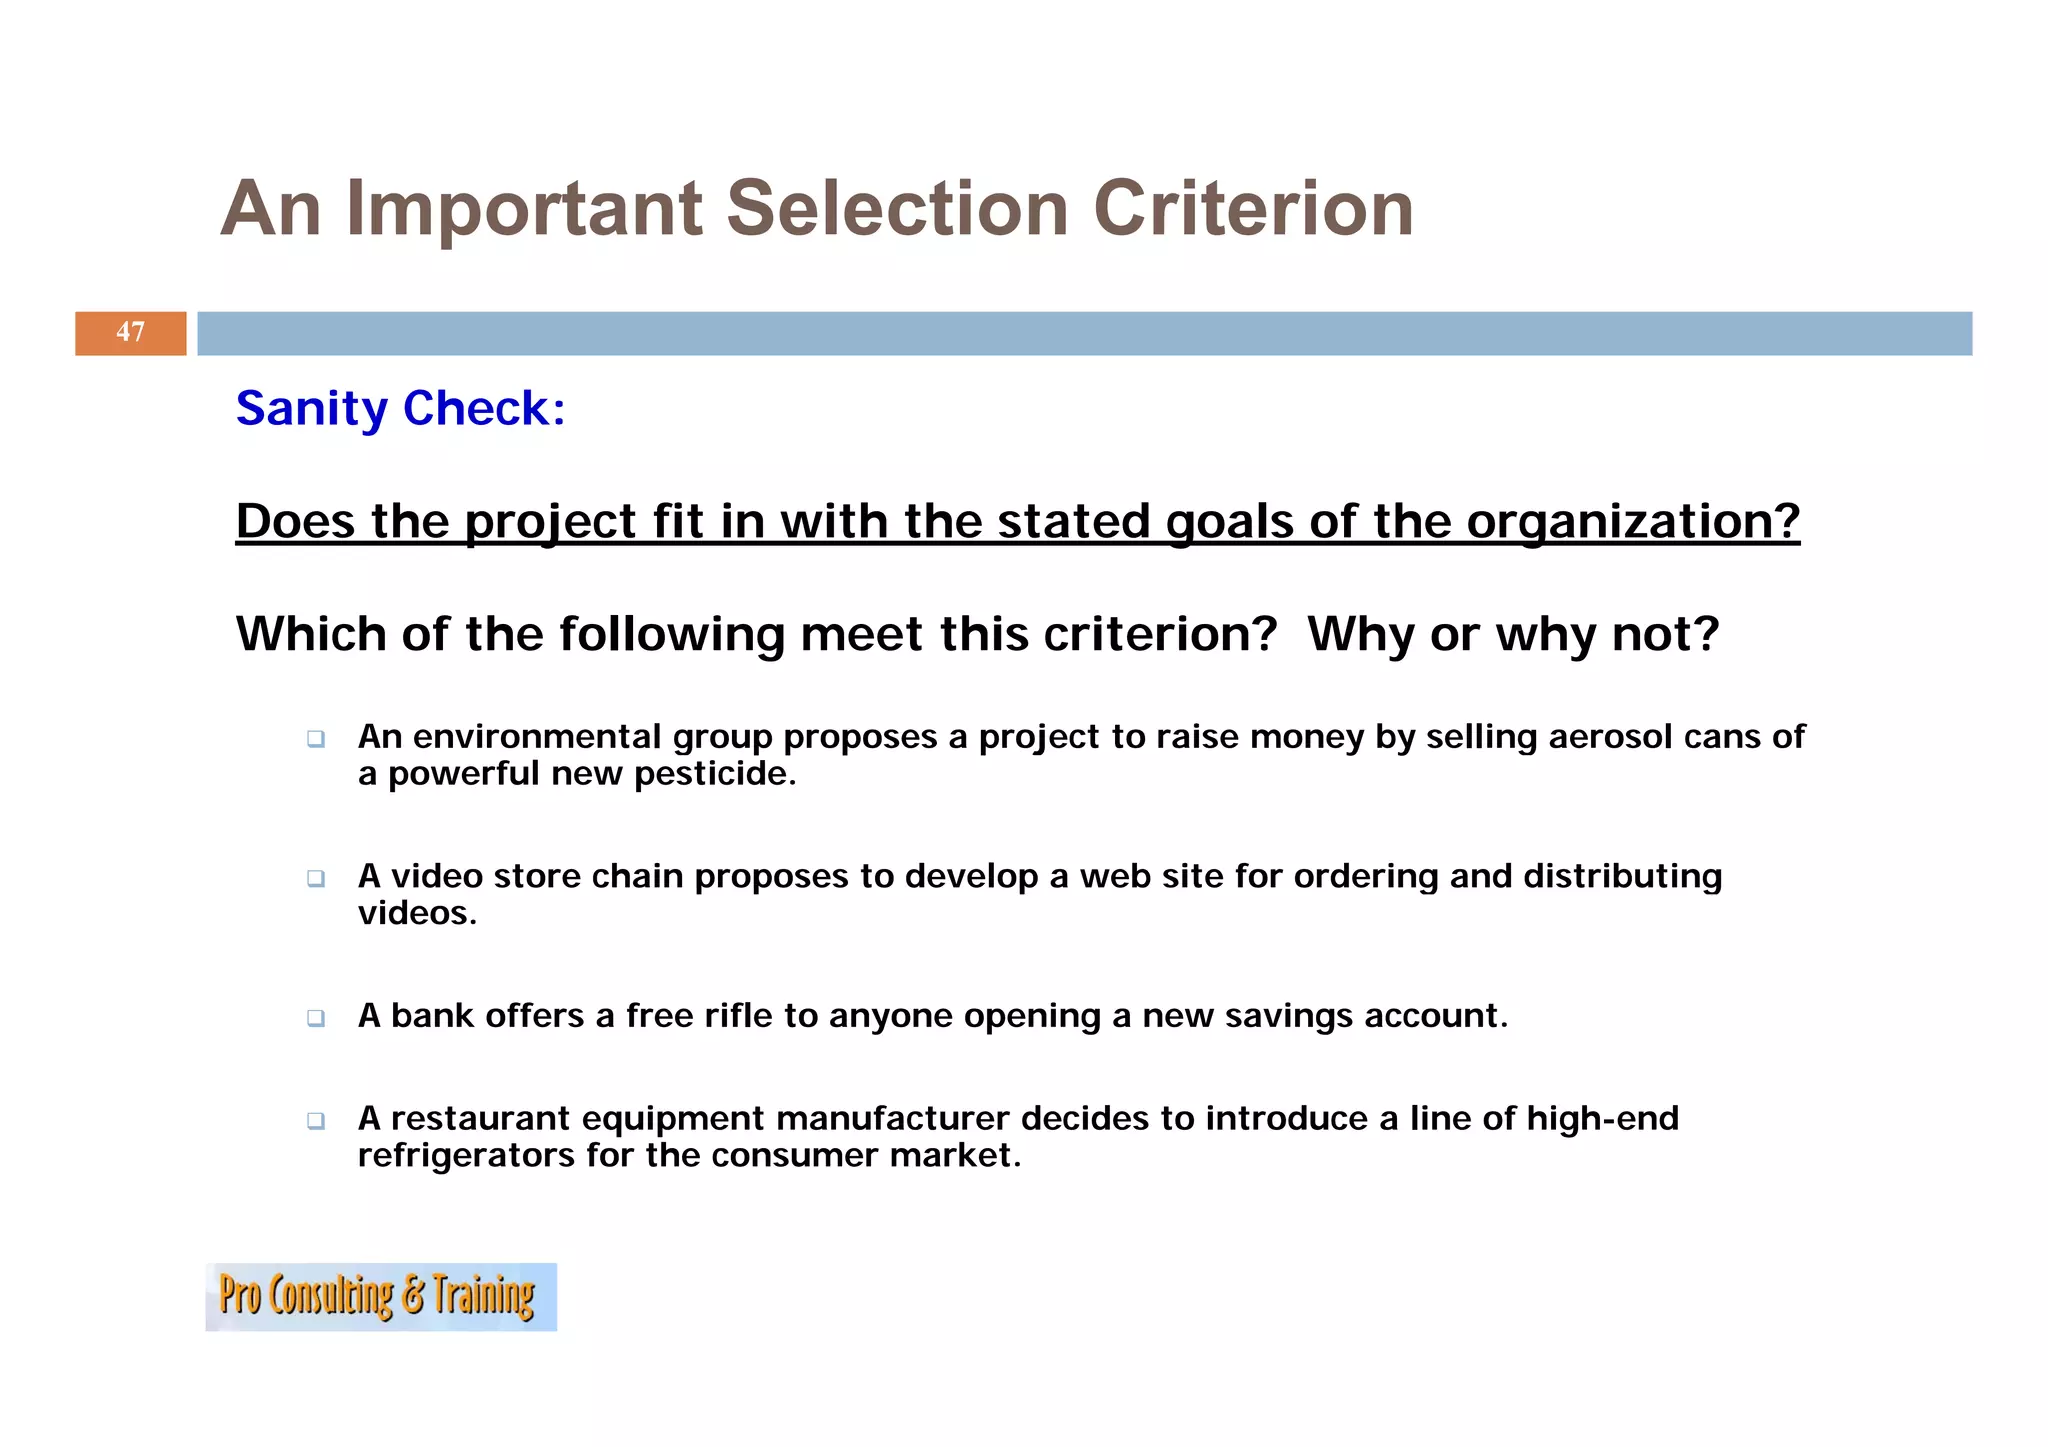
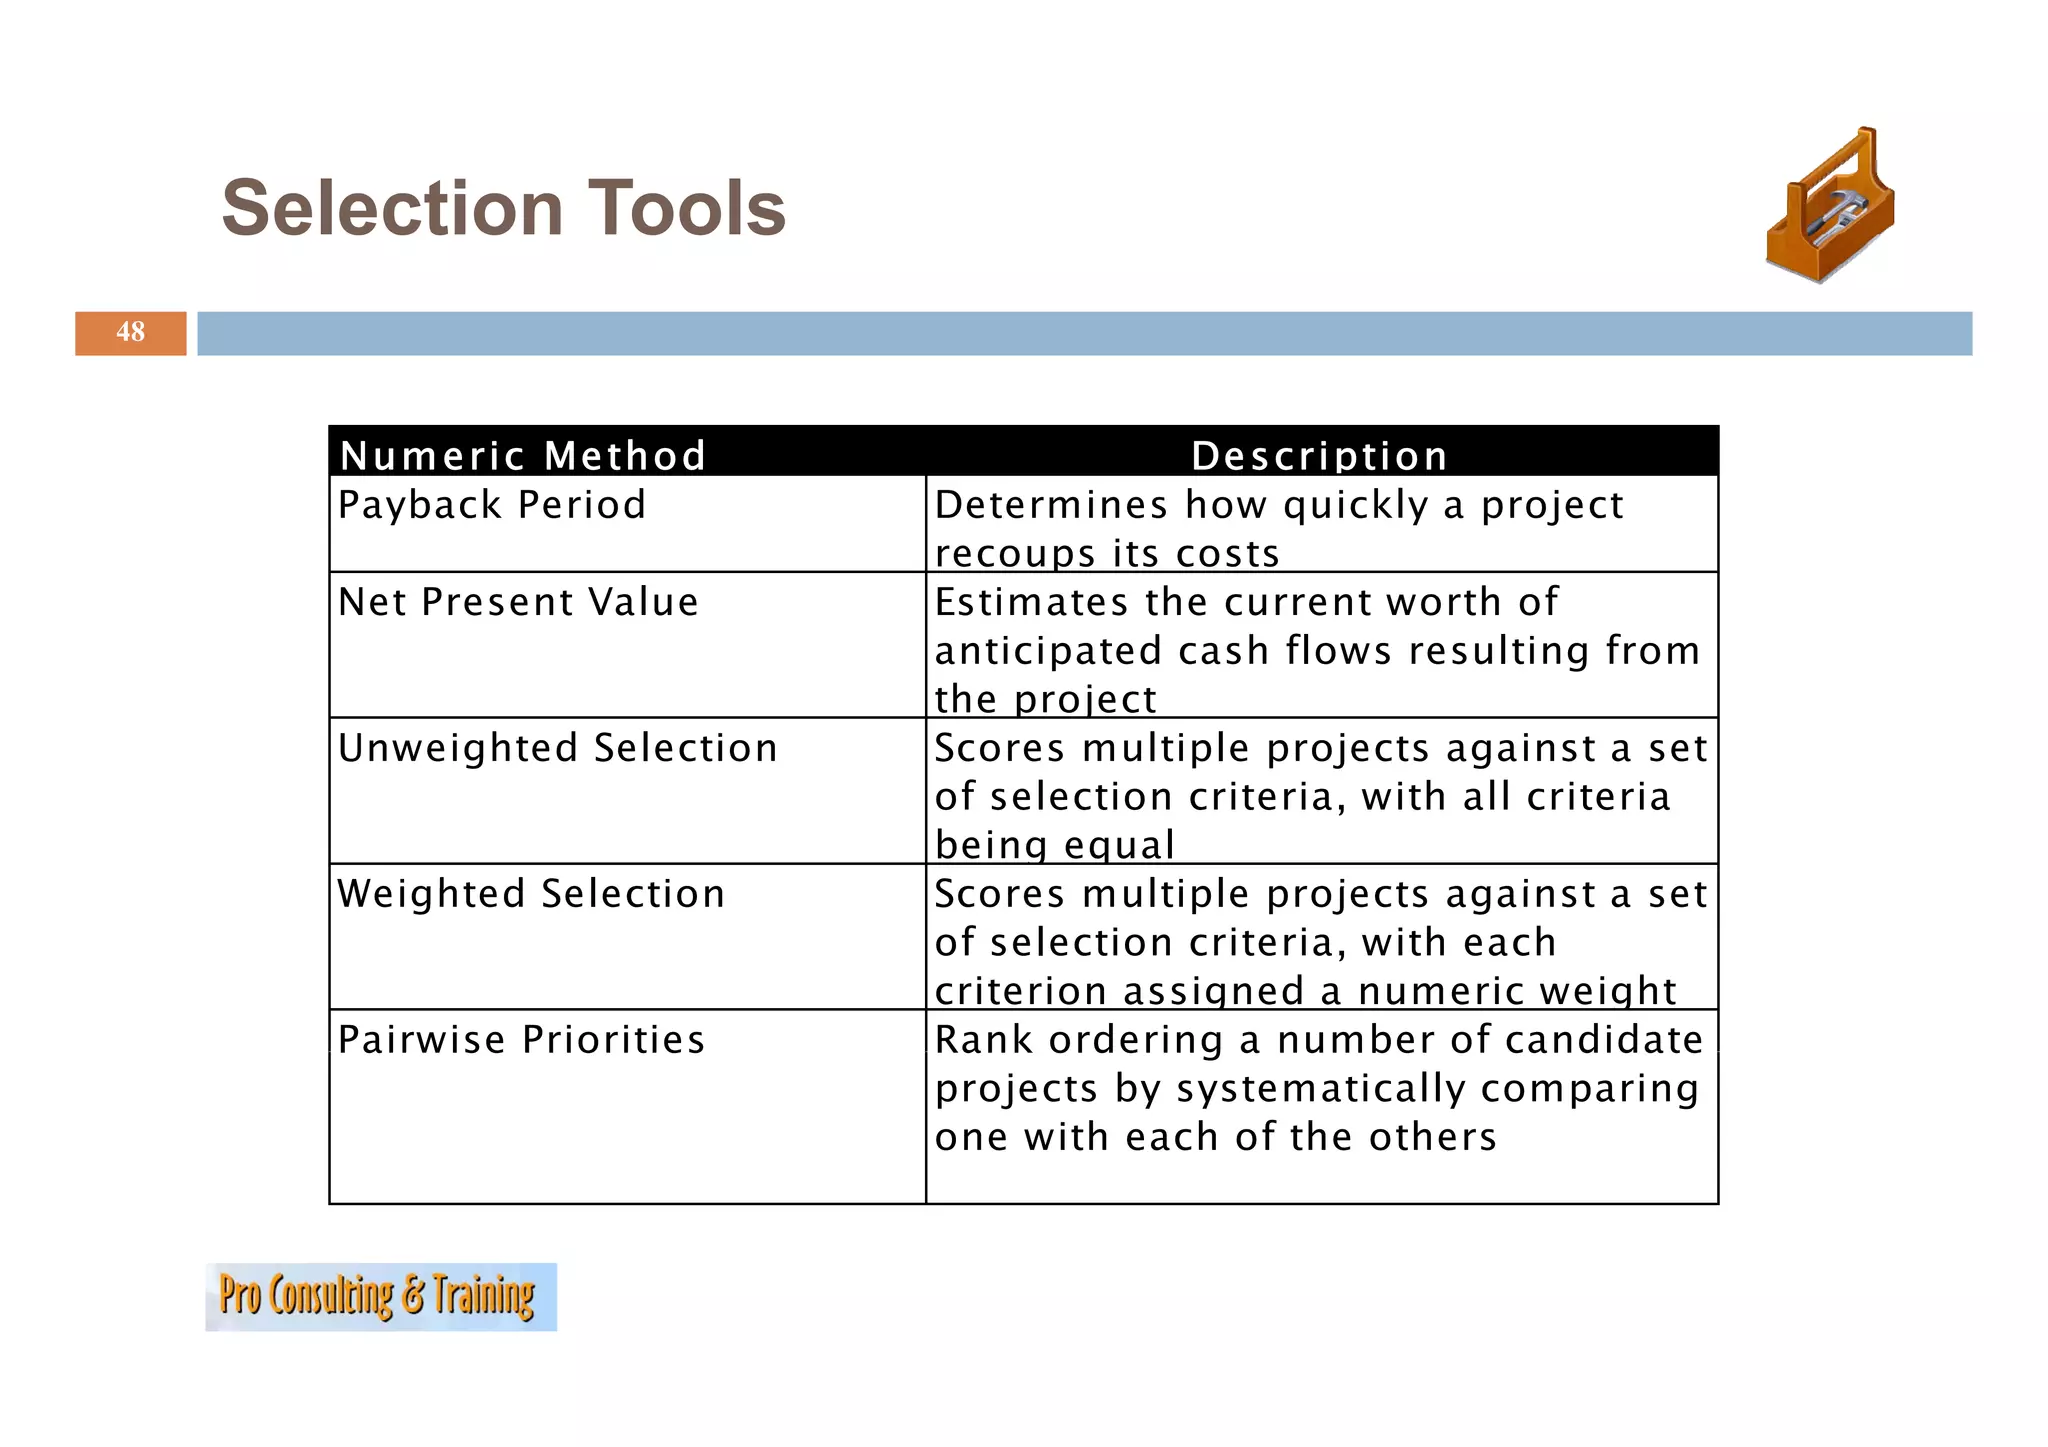
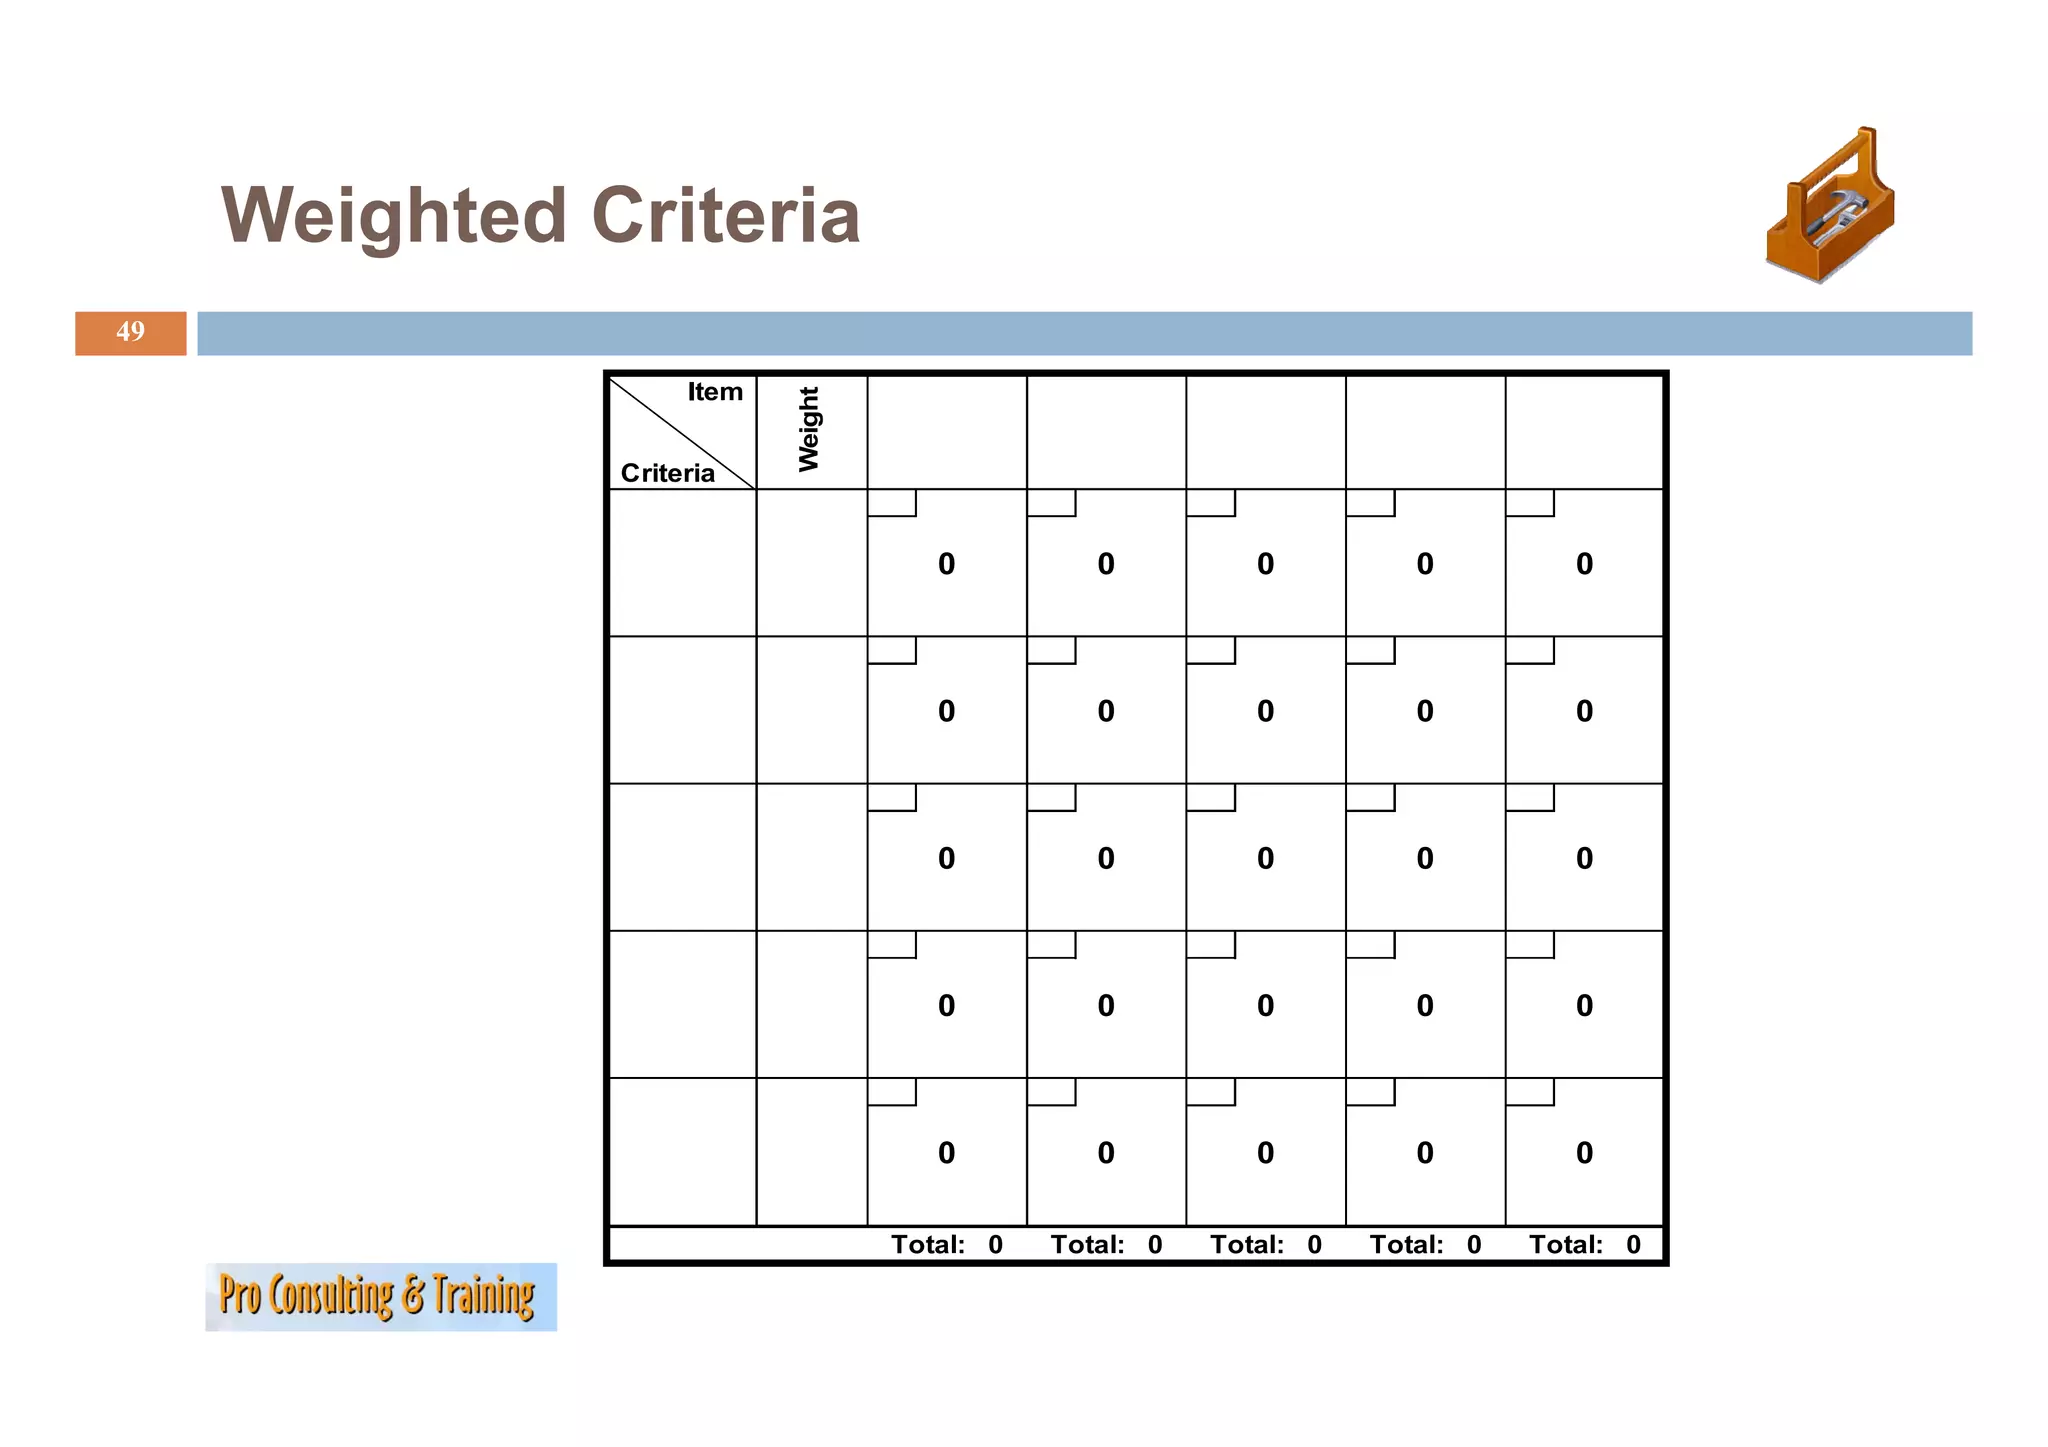
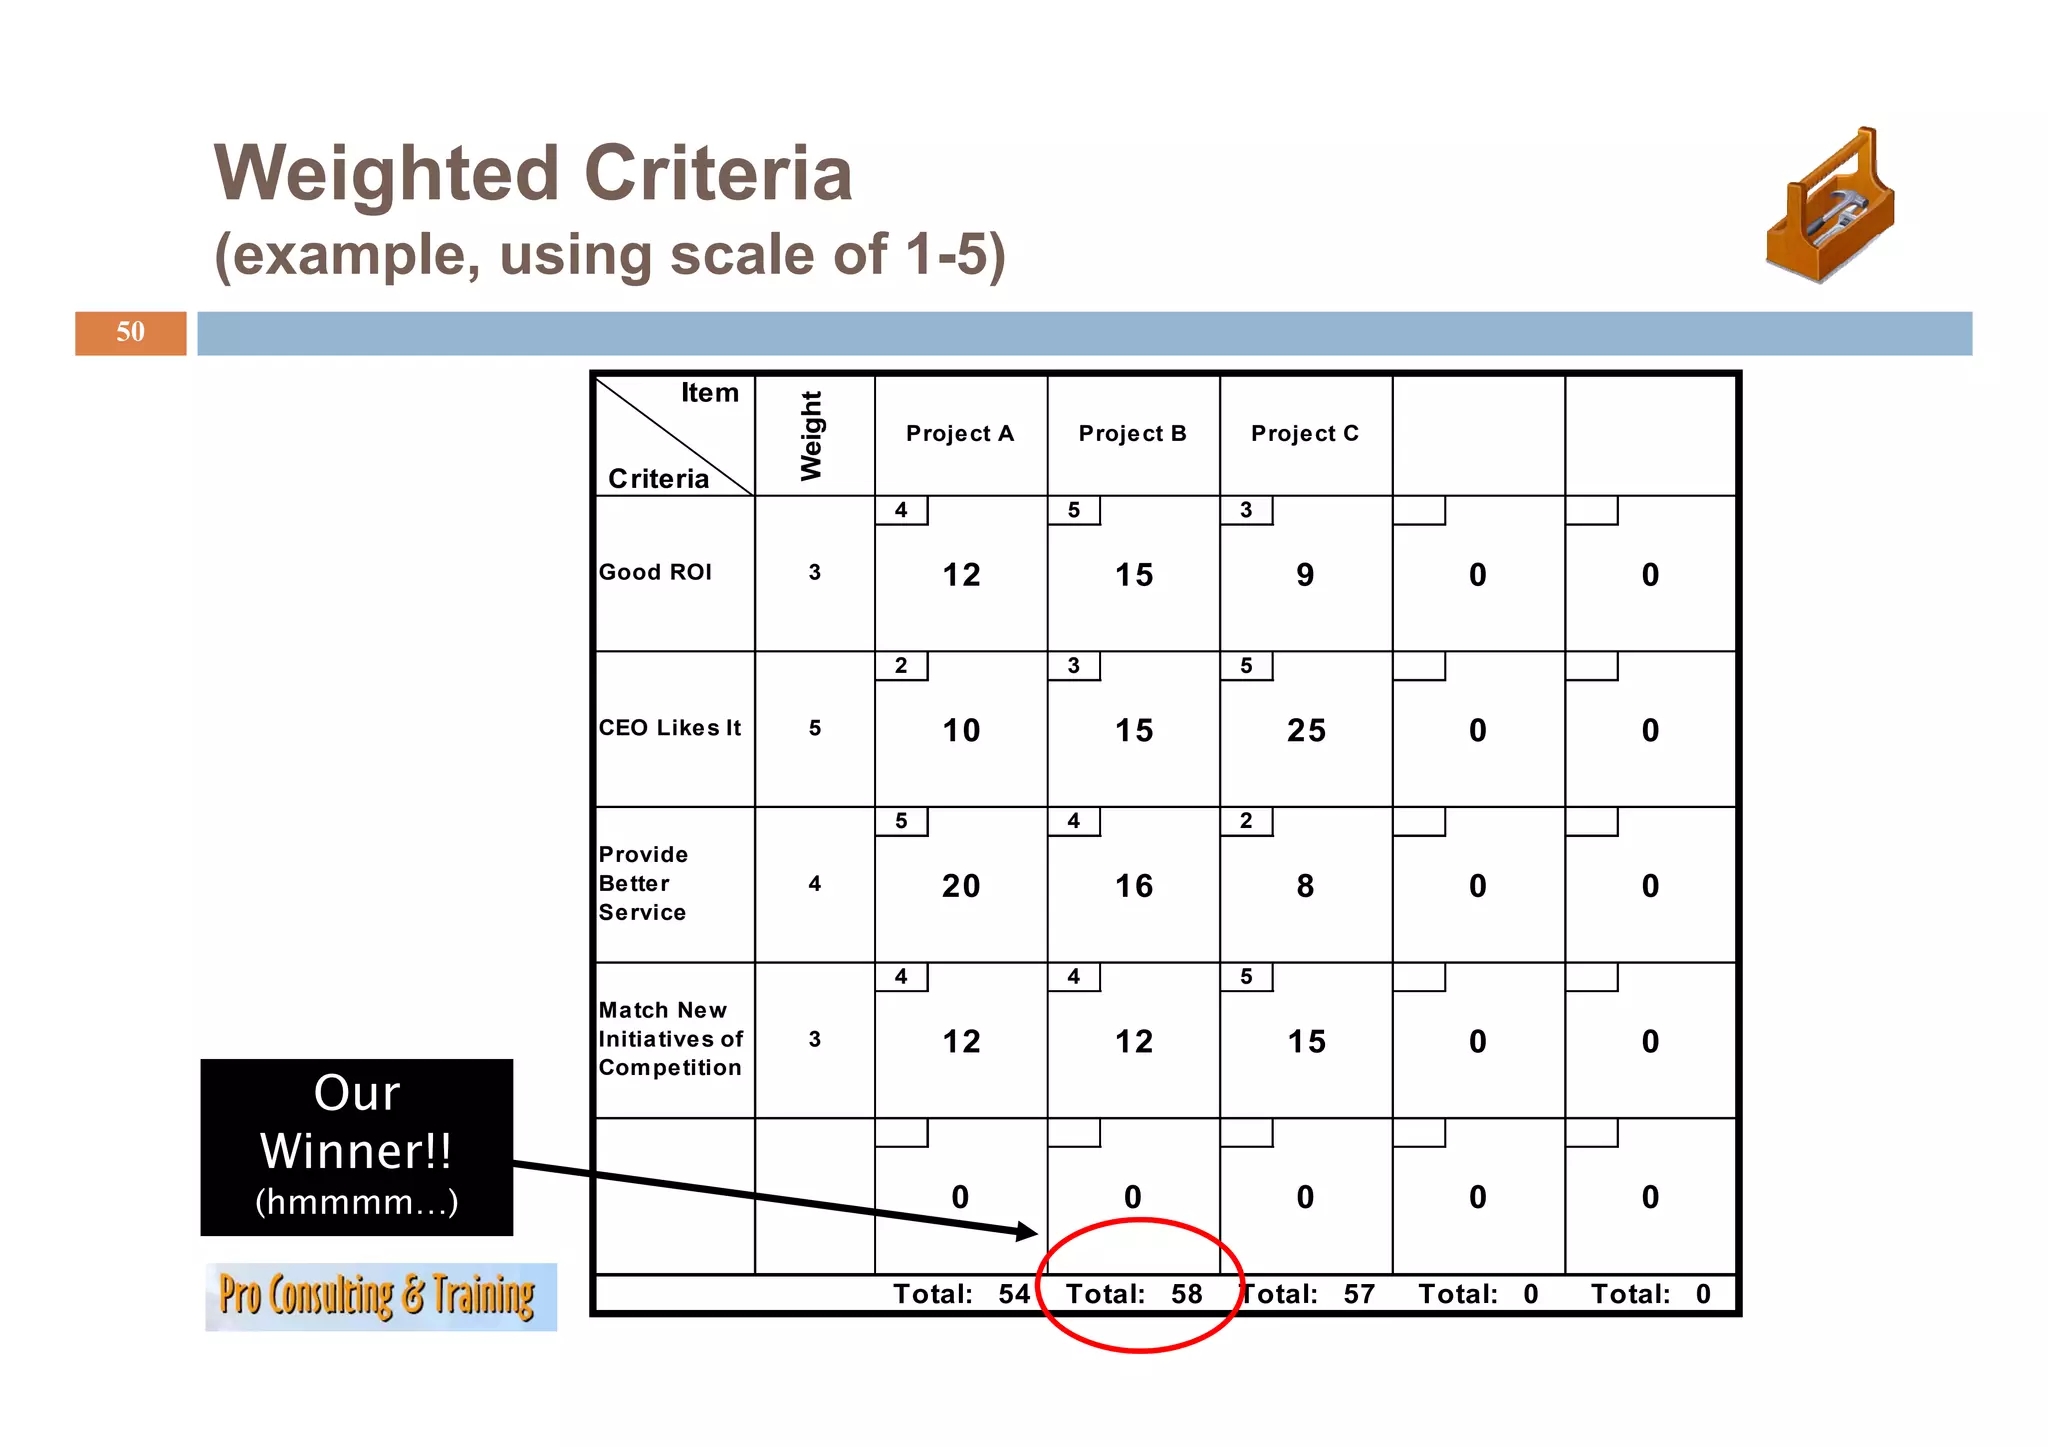
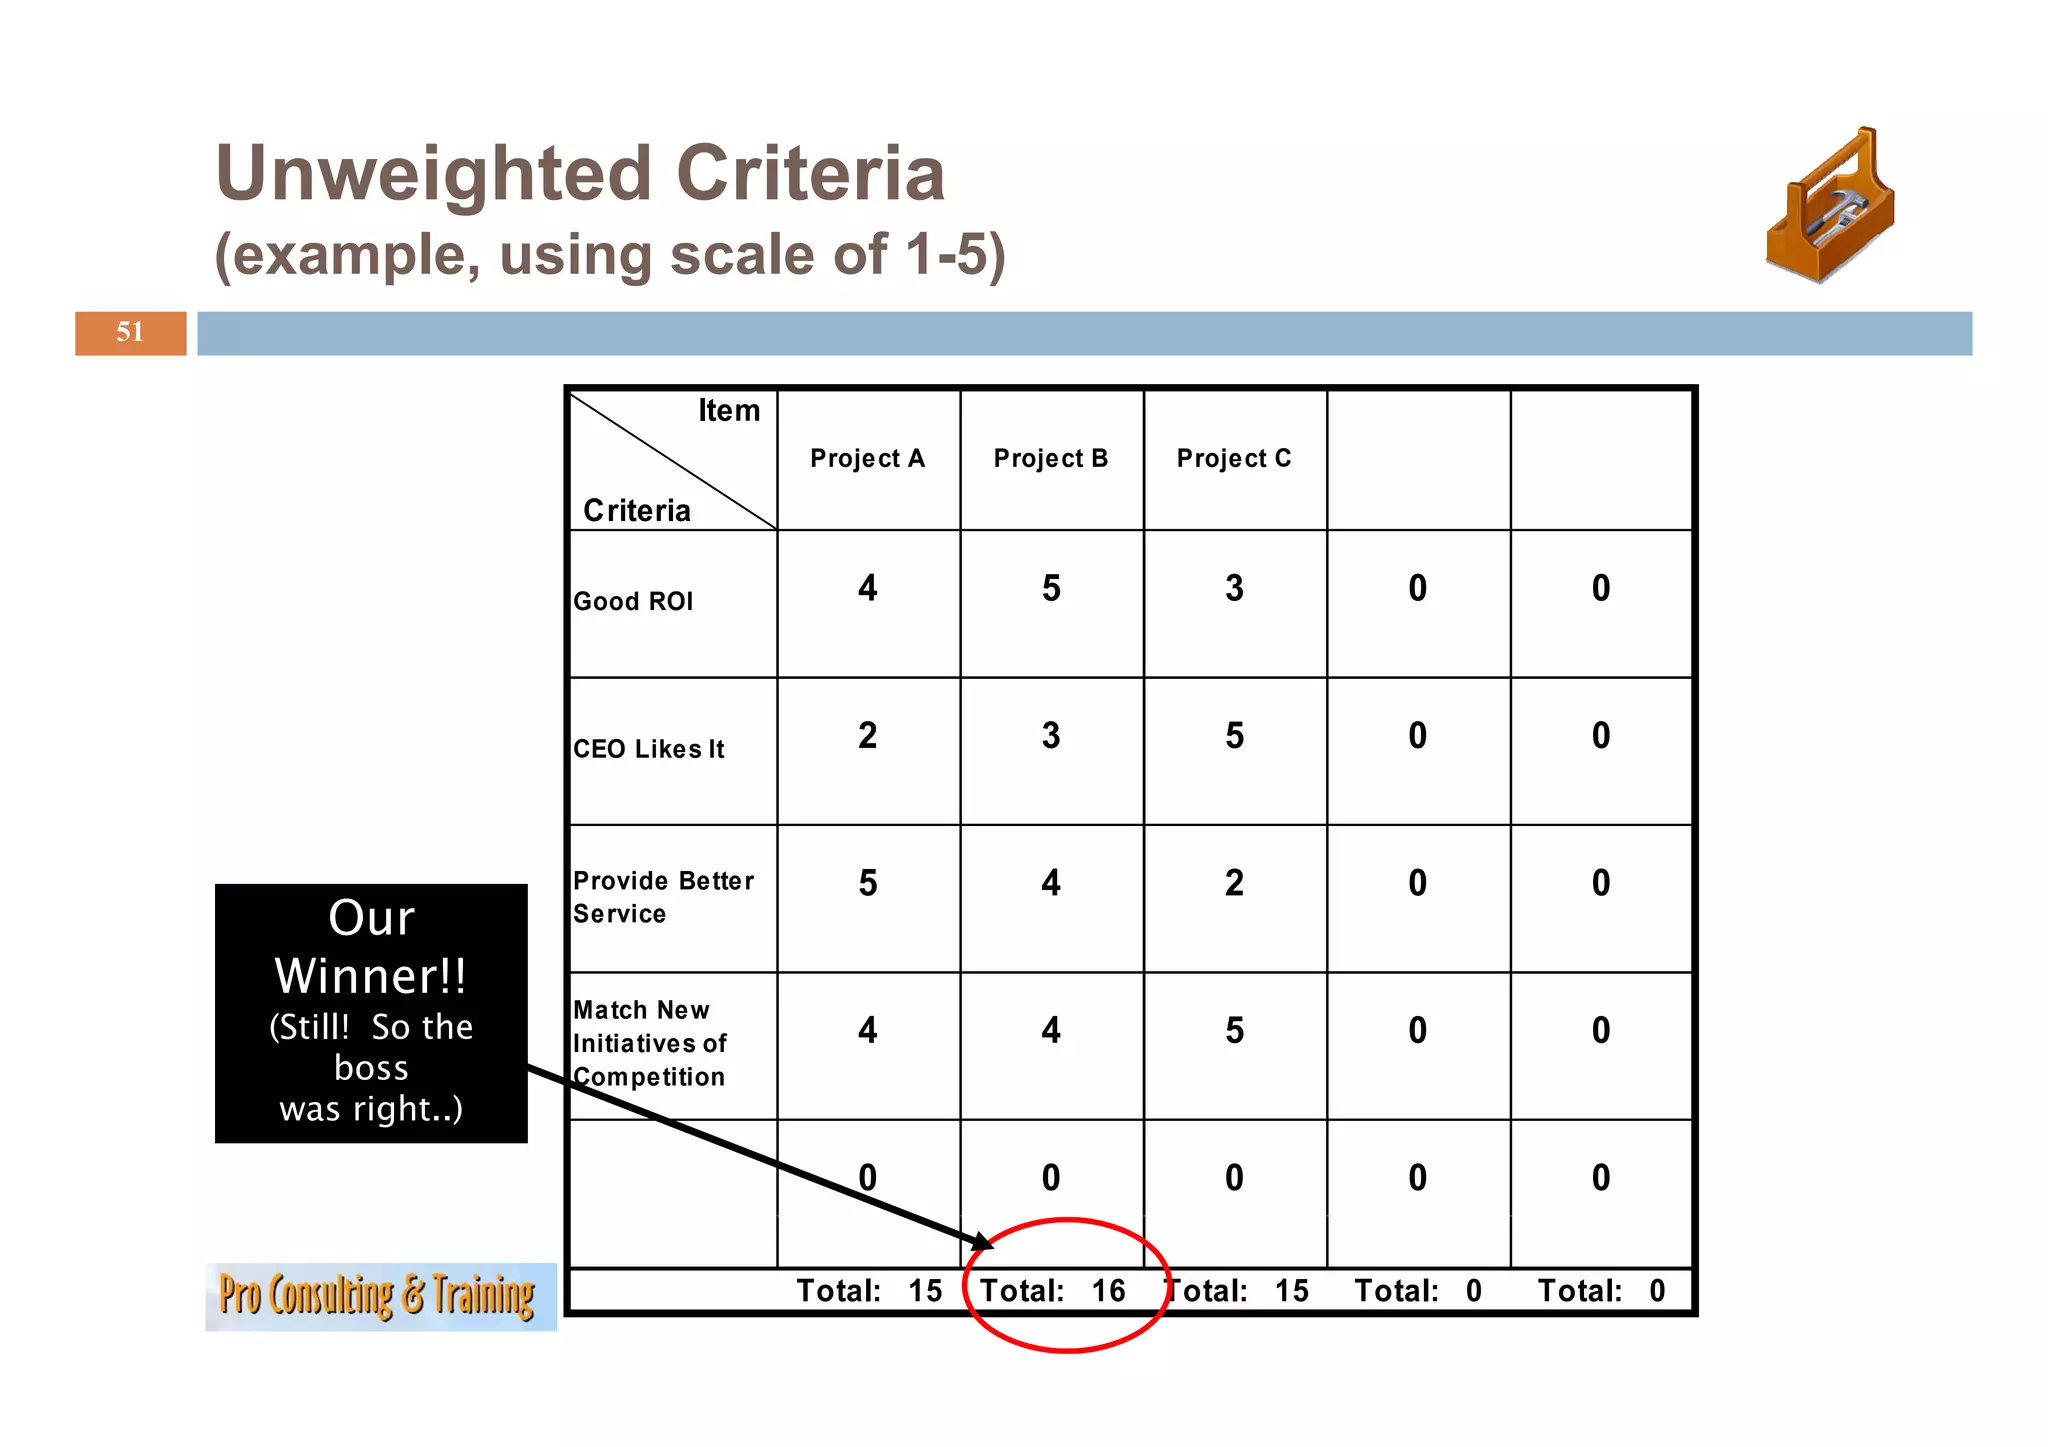
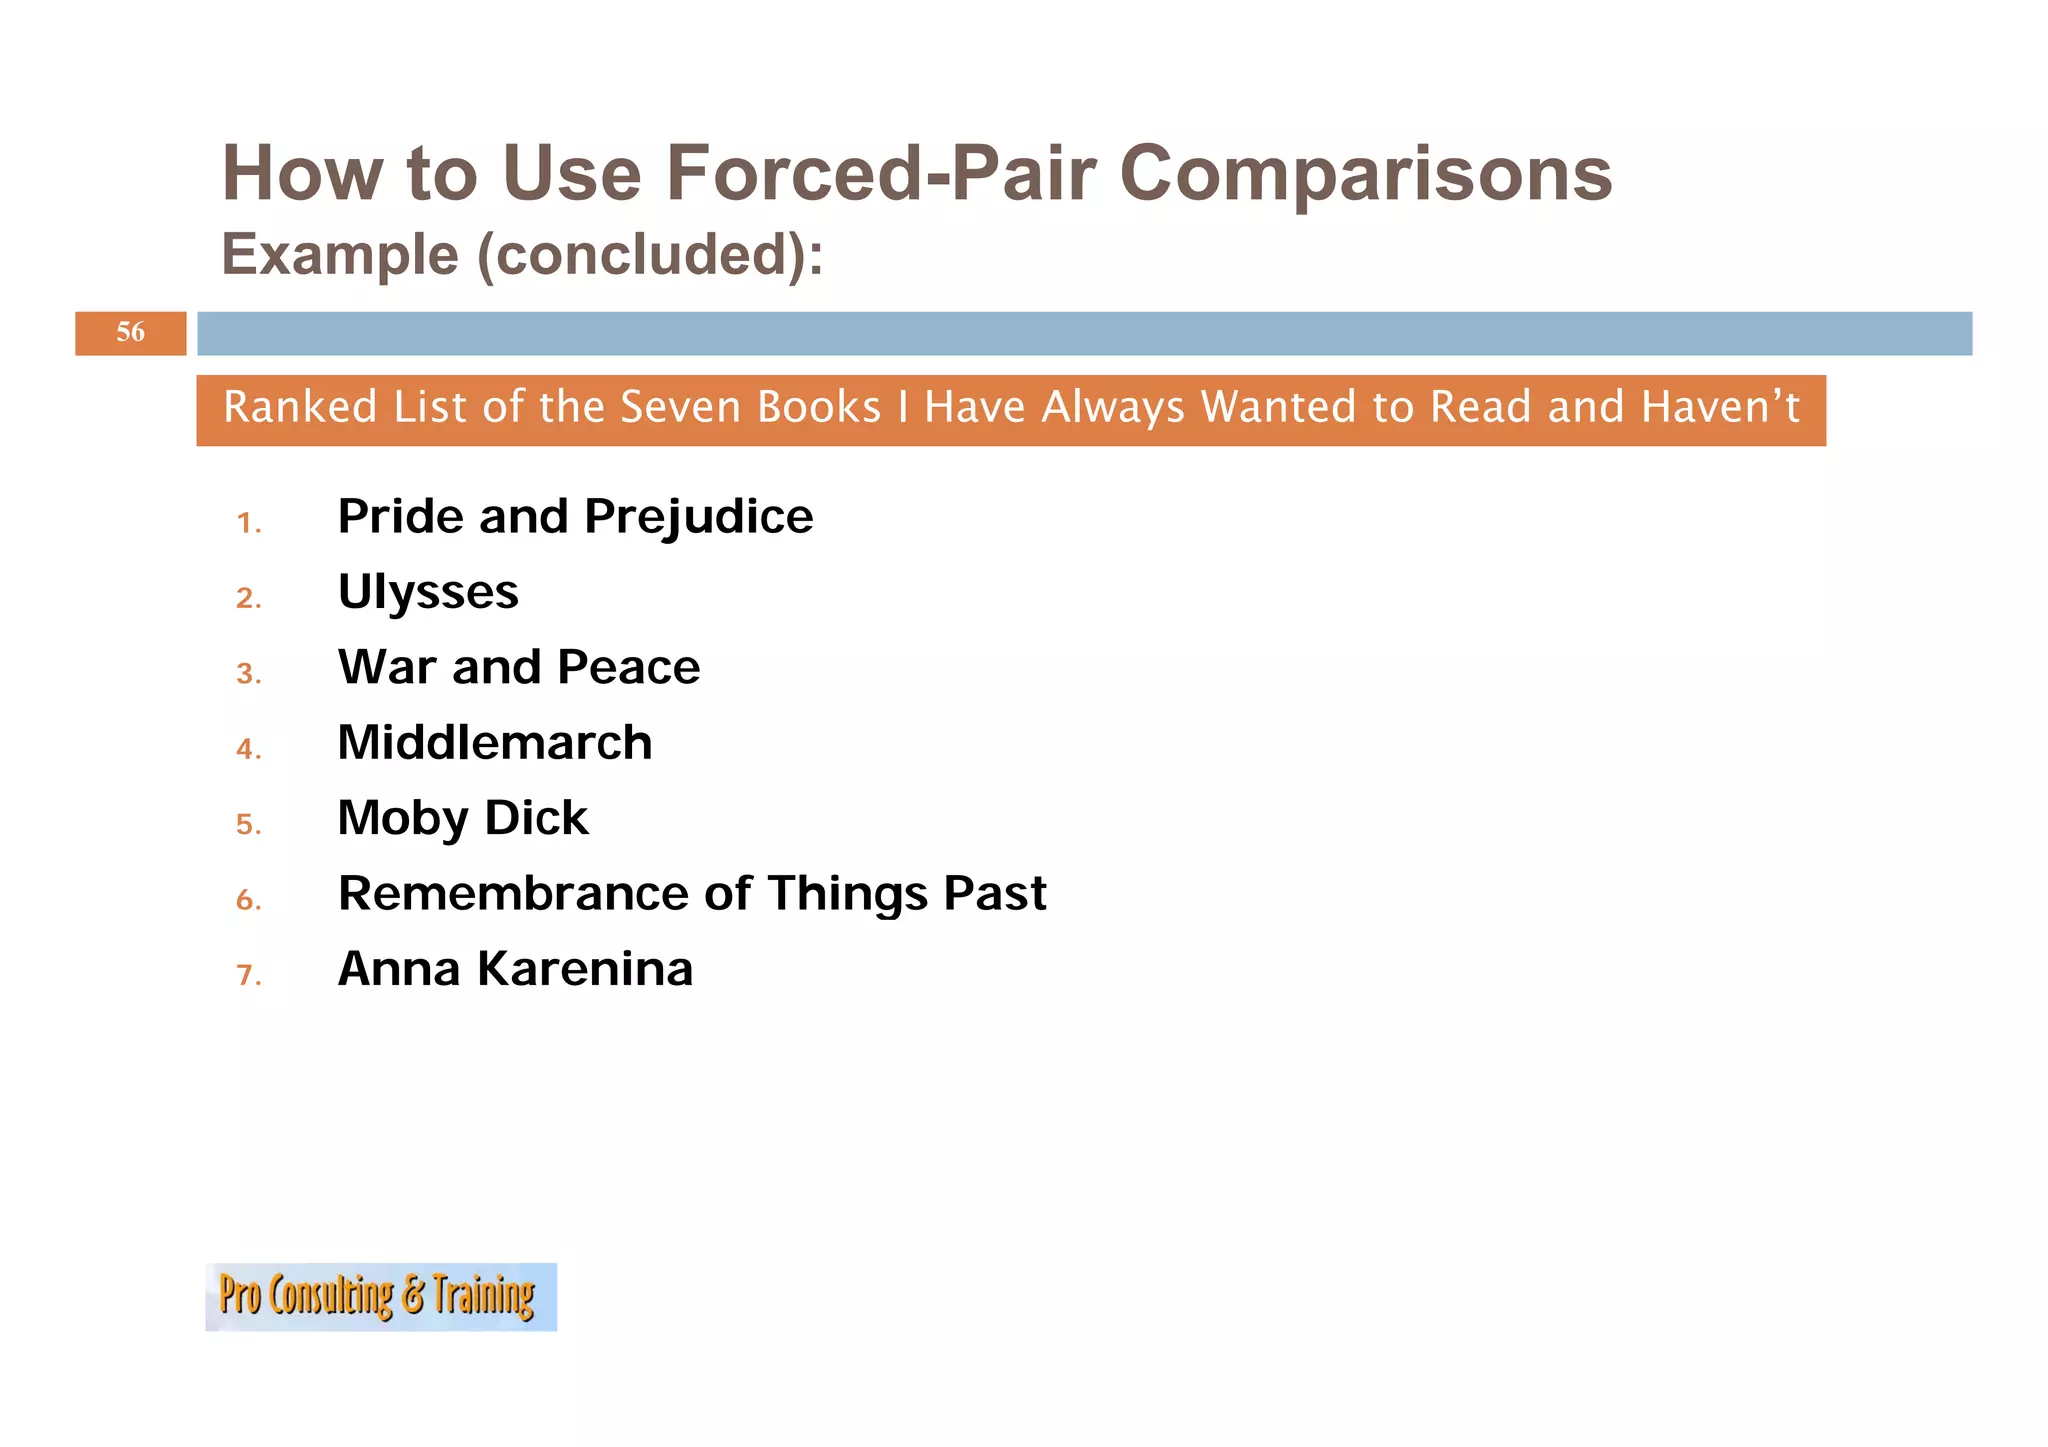
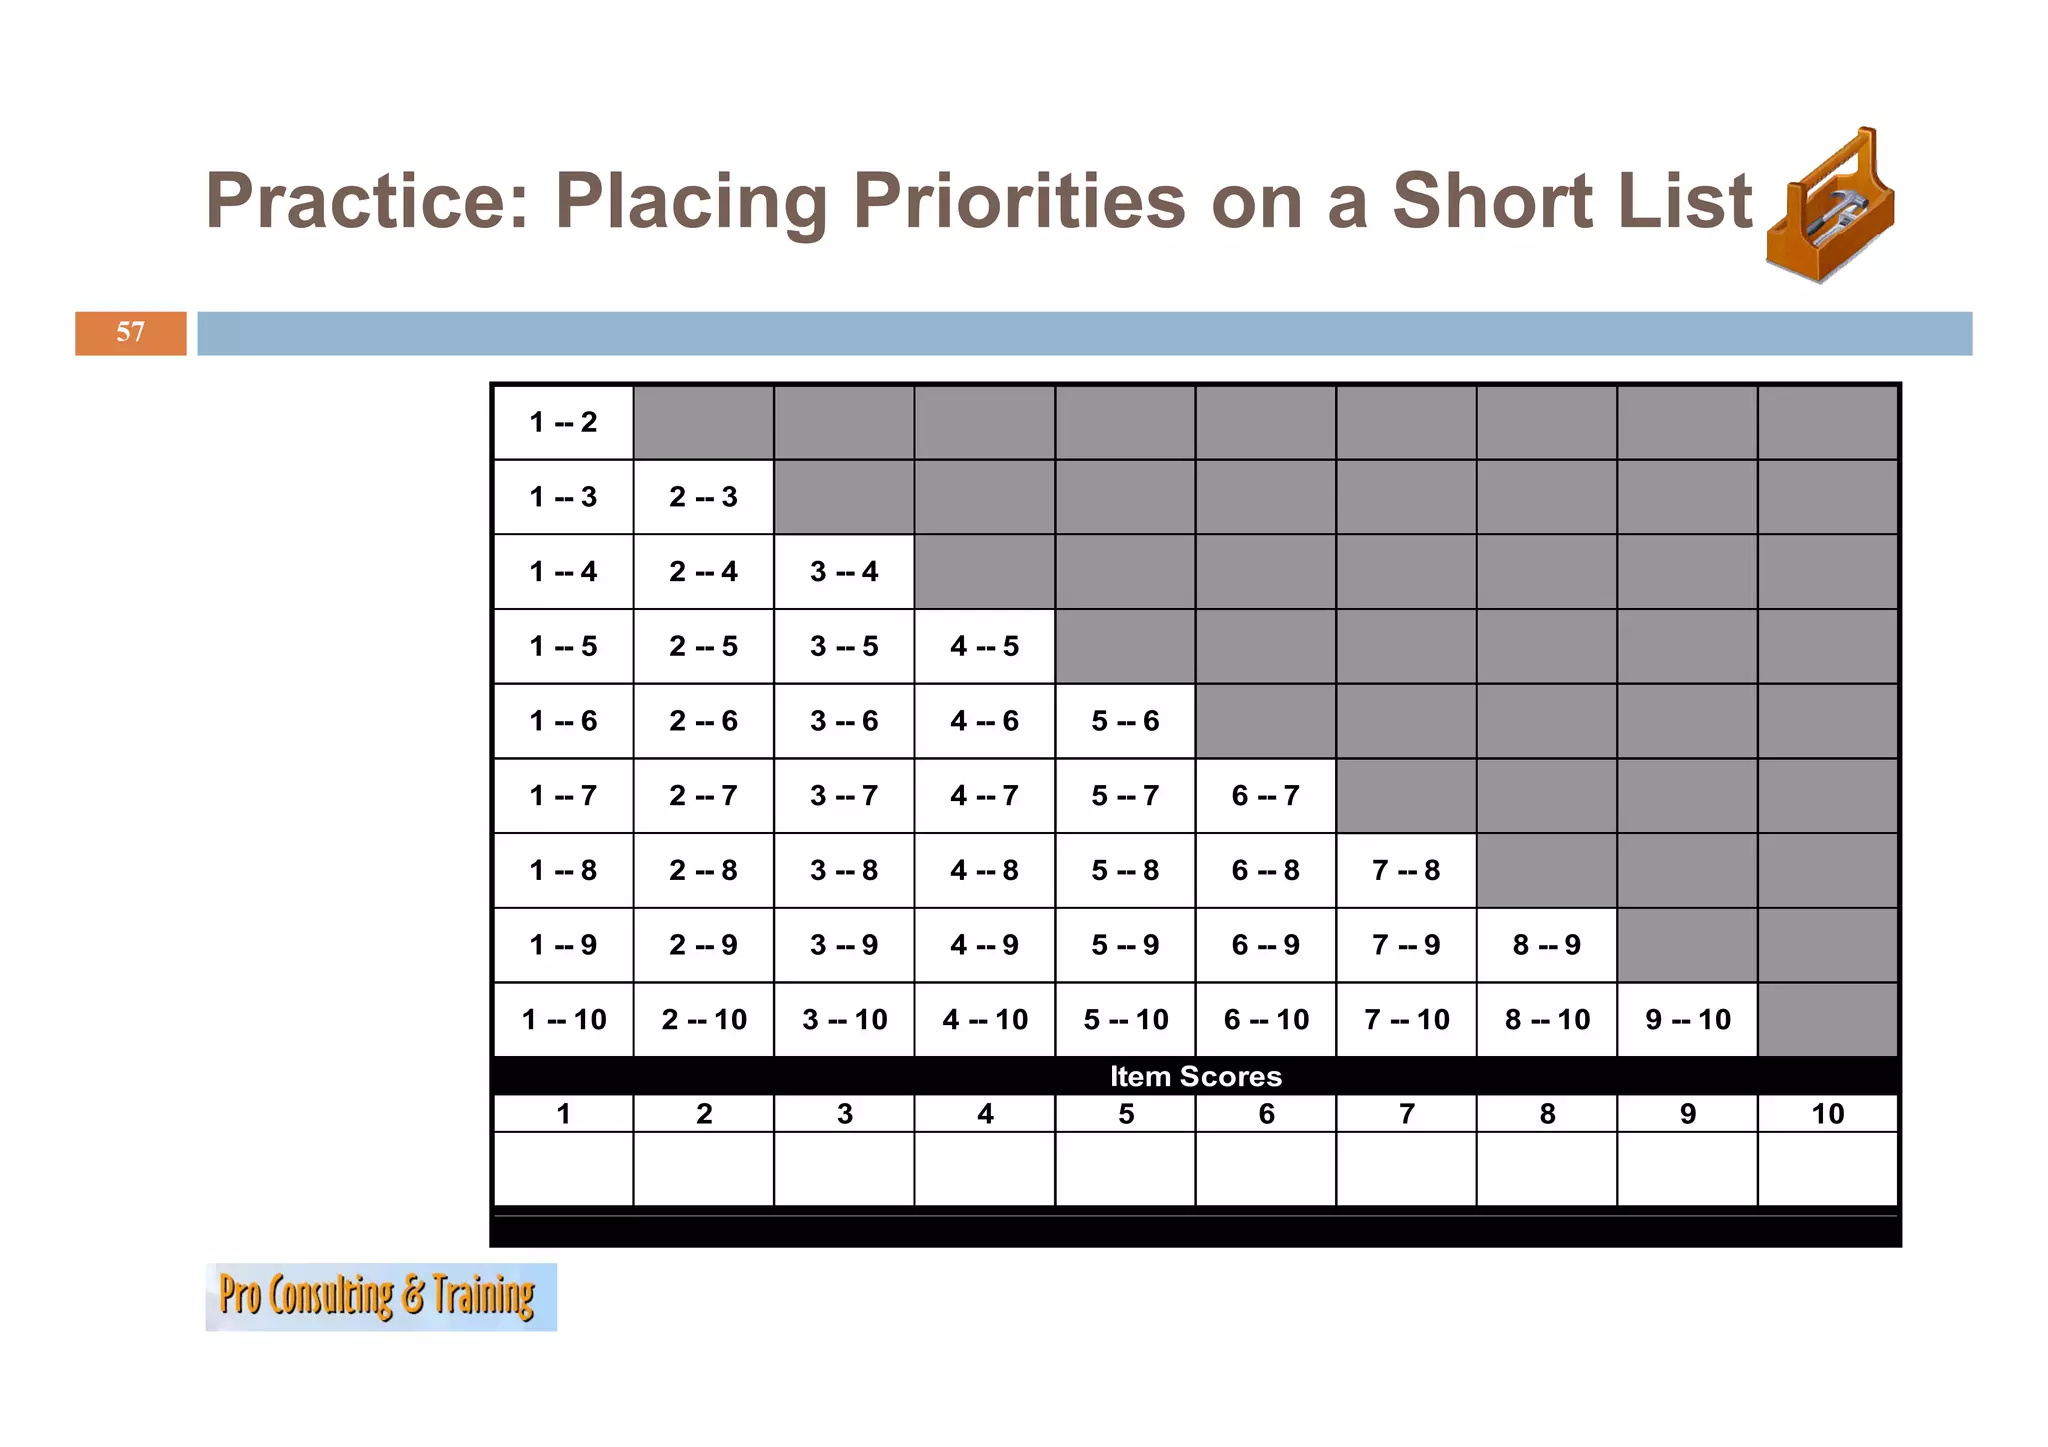
Discussion on various project selection criteria and tools for evaluating potential projects.
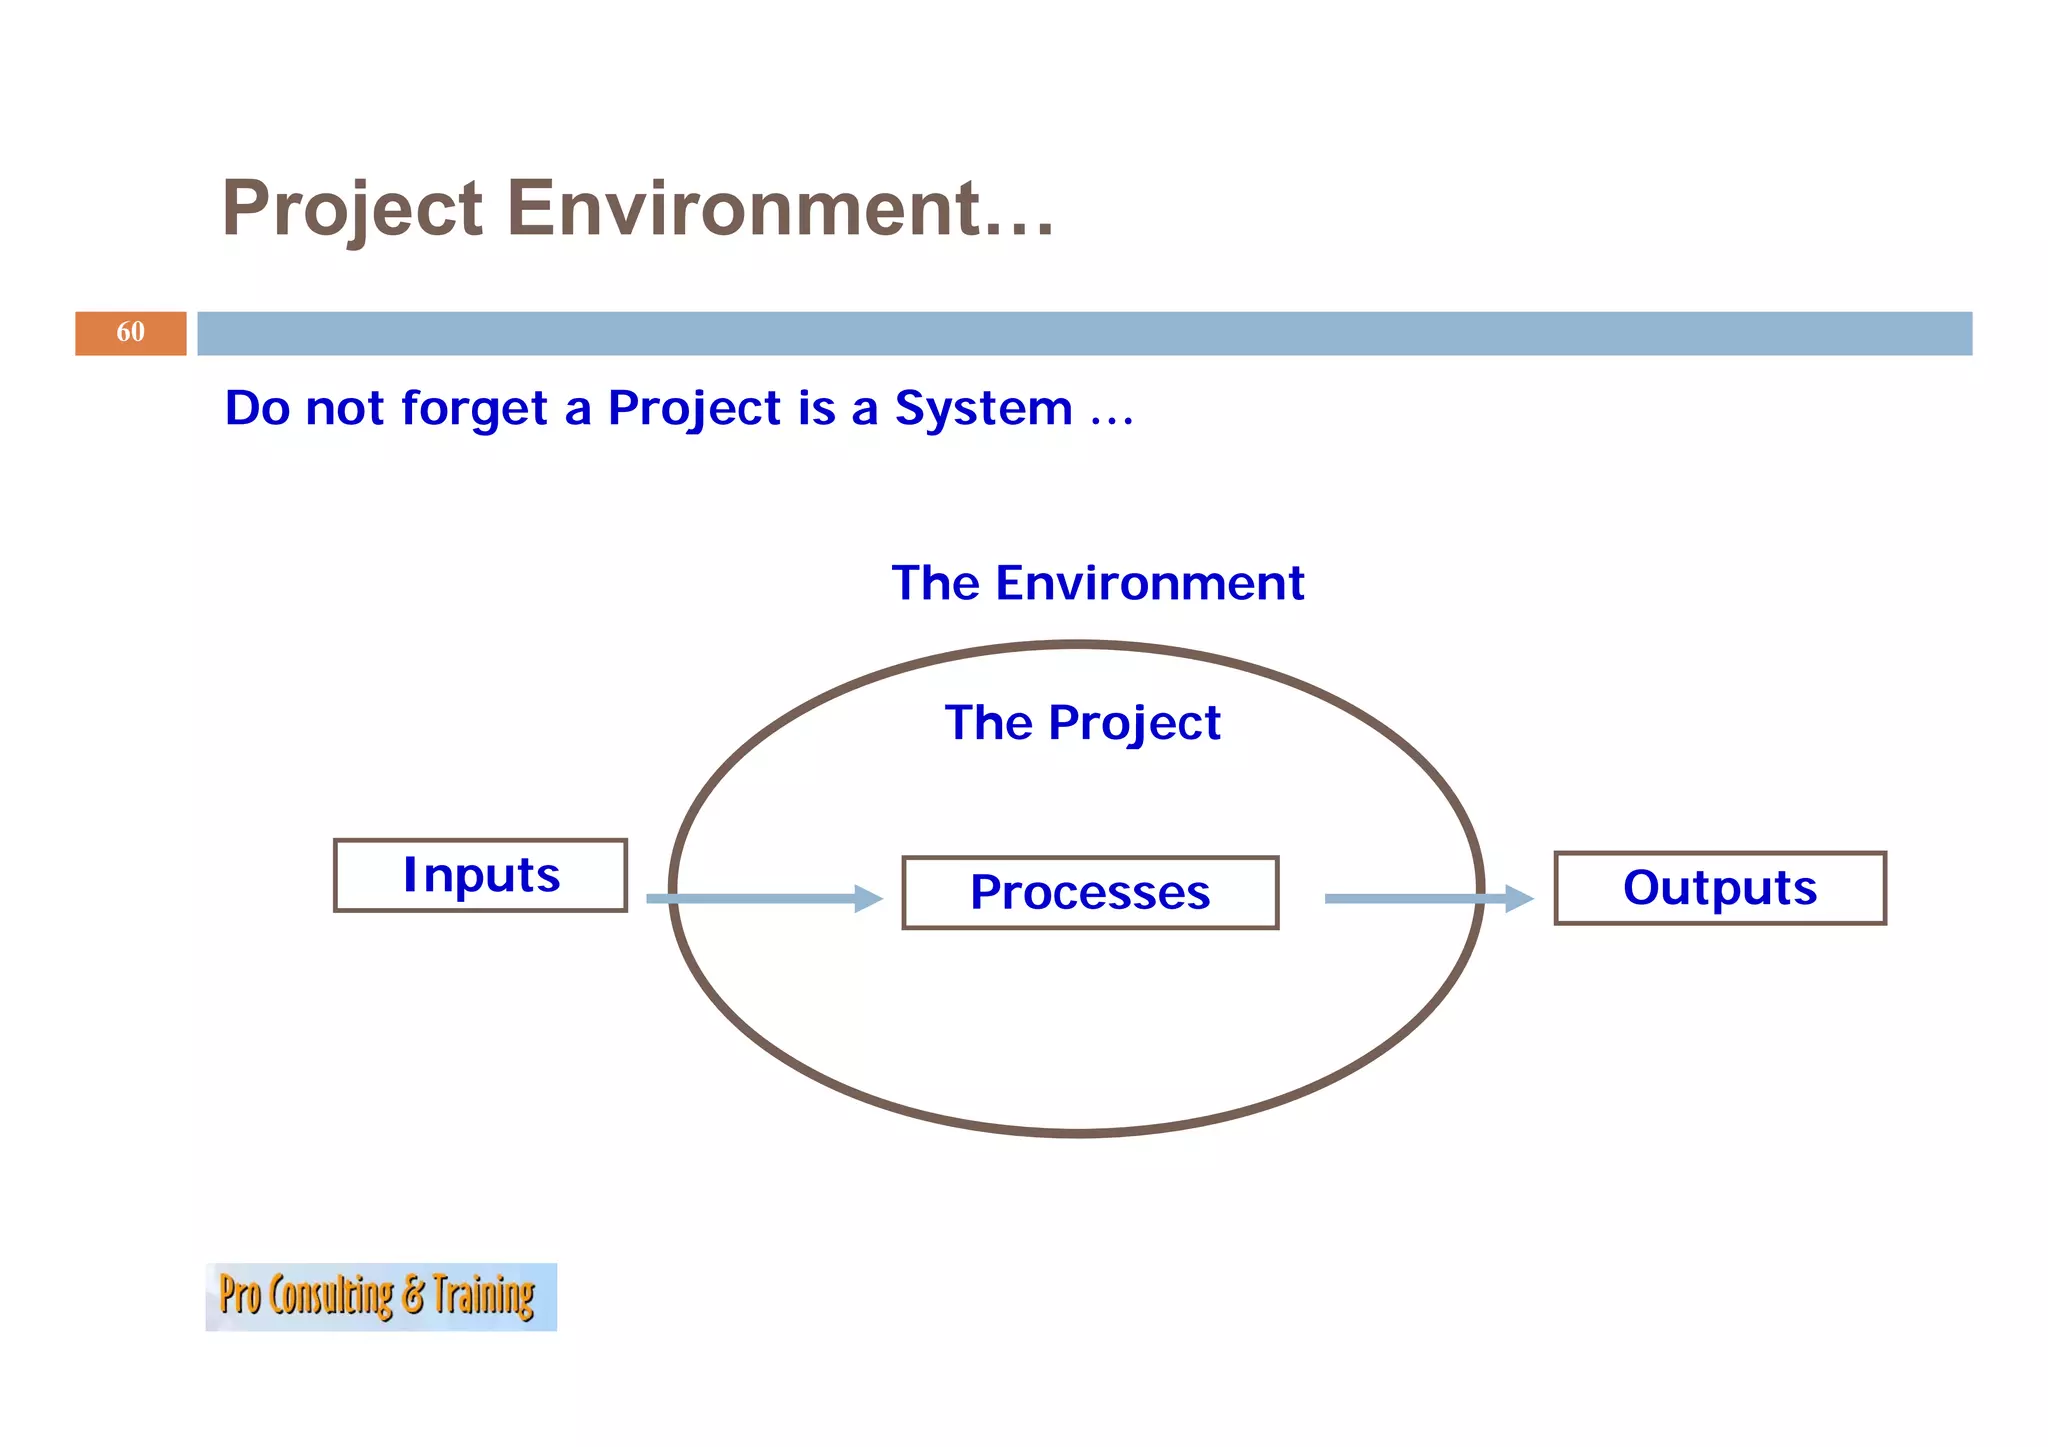
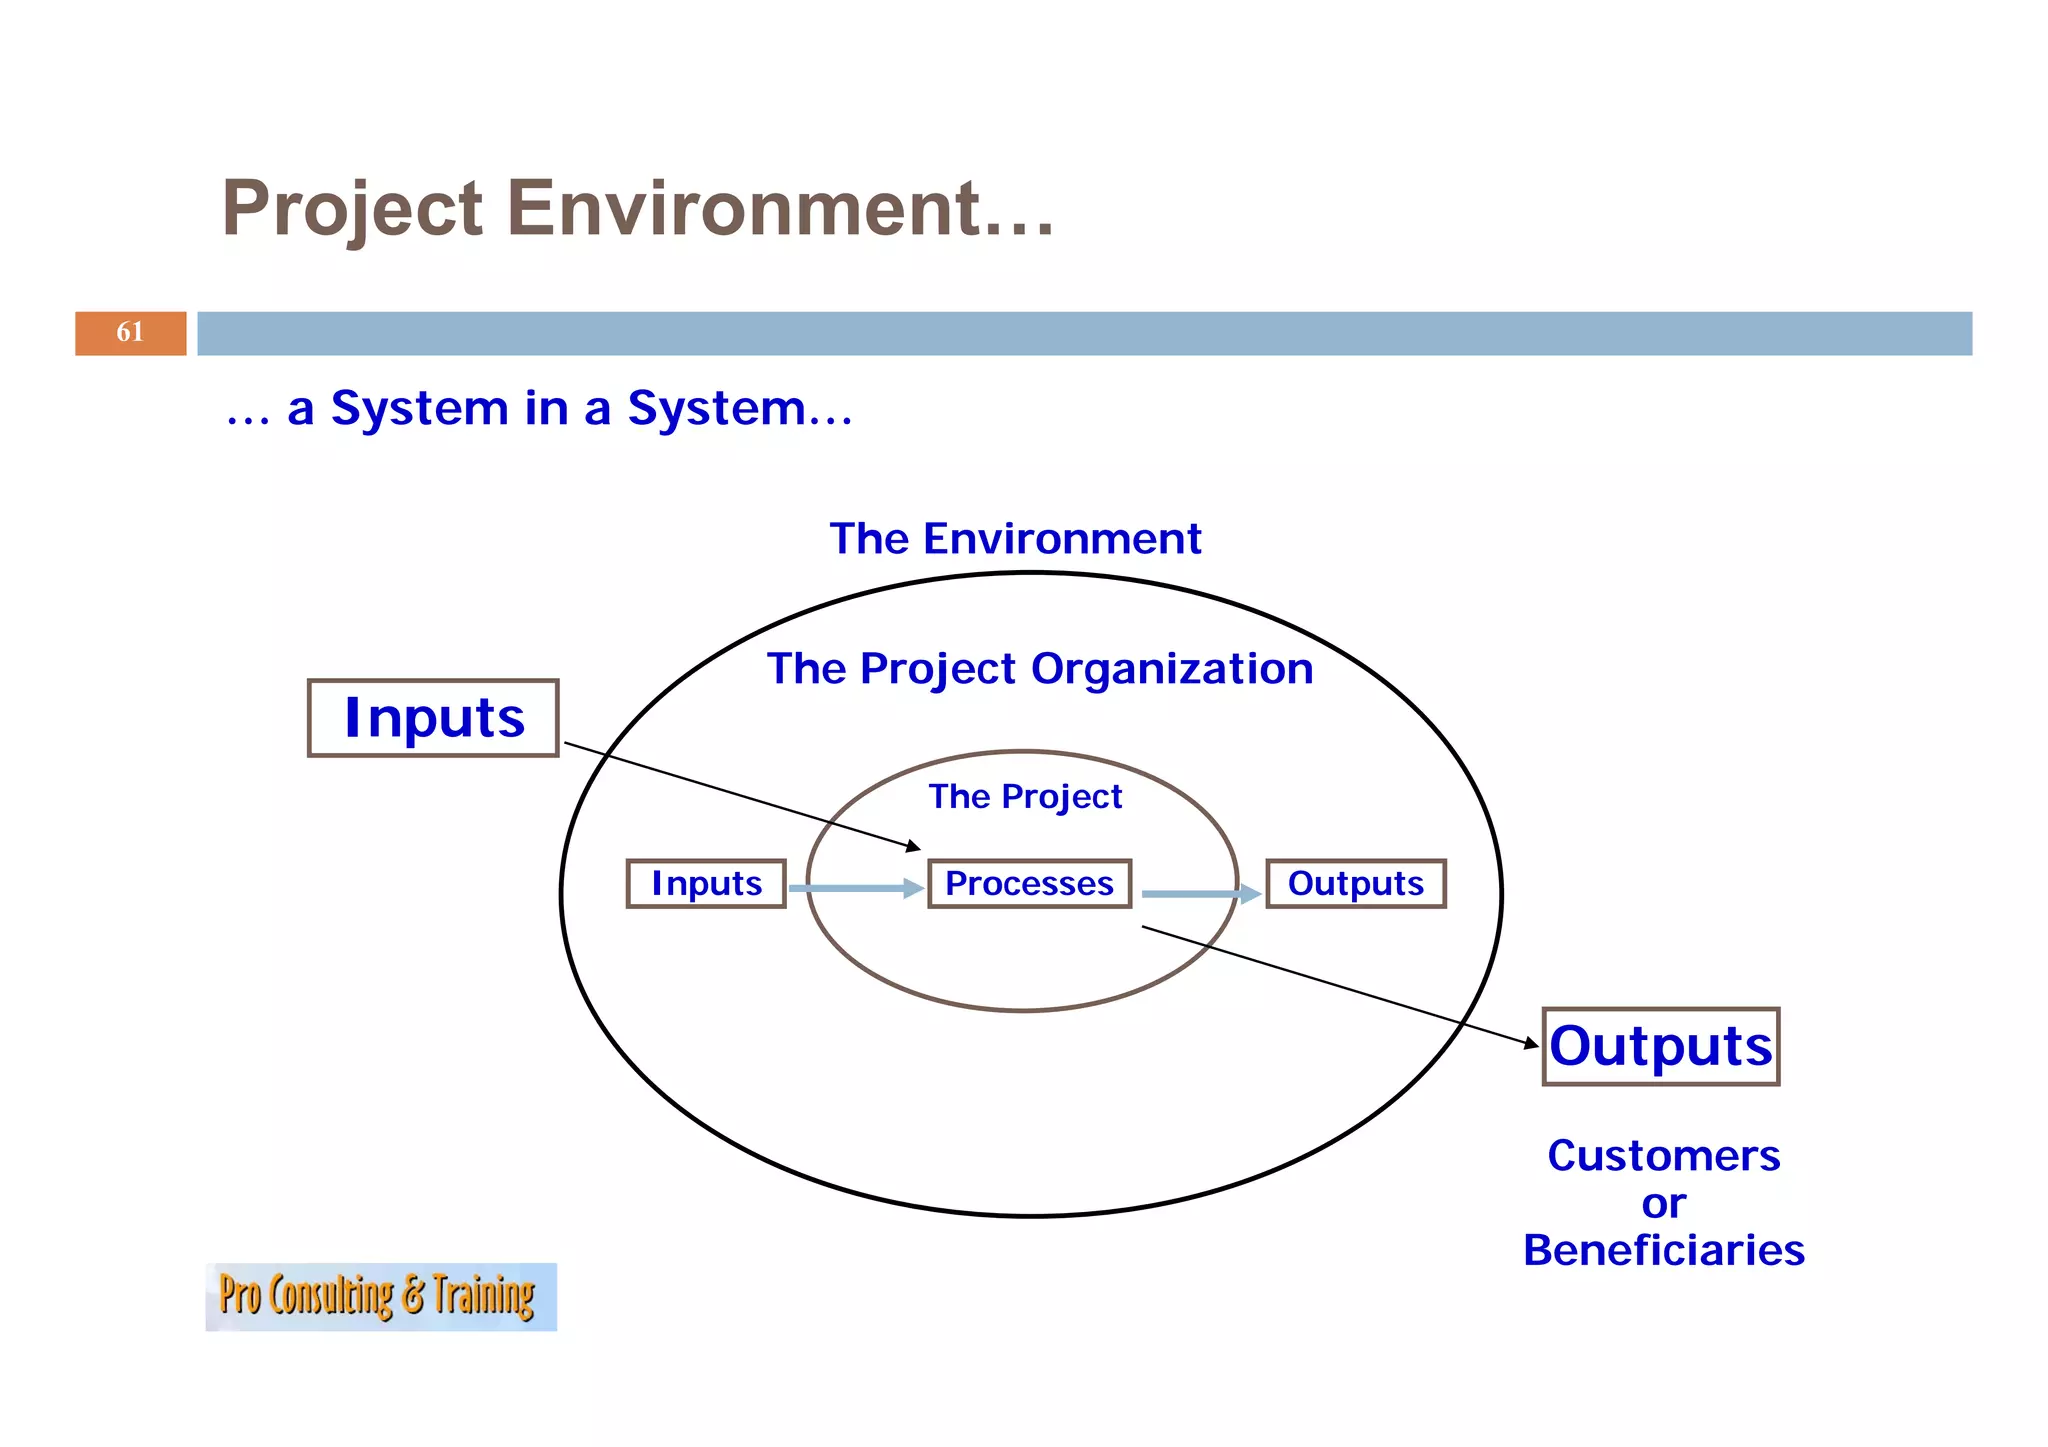
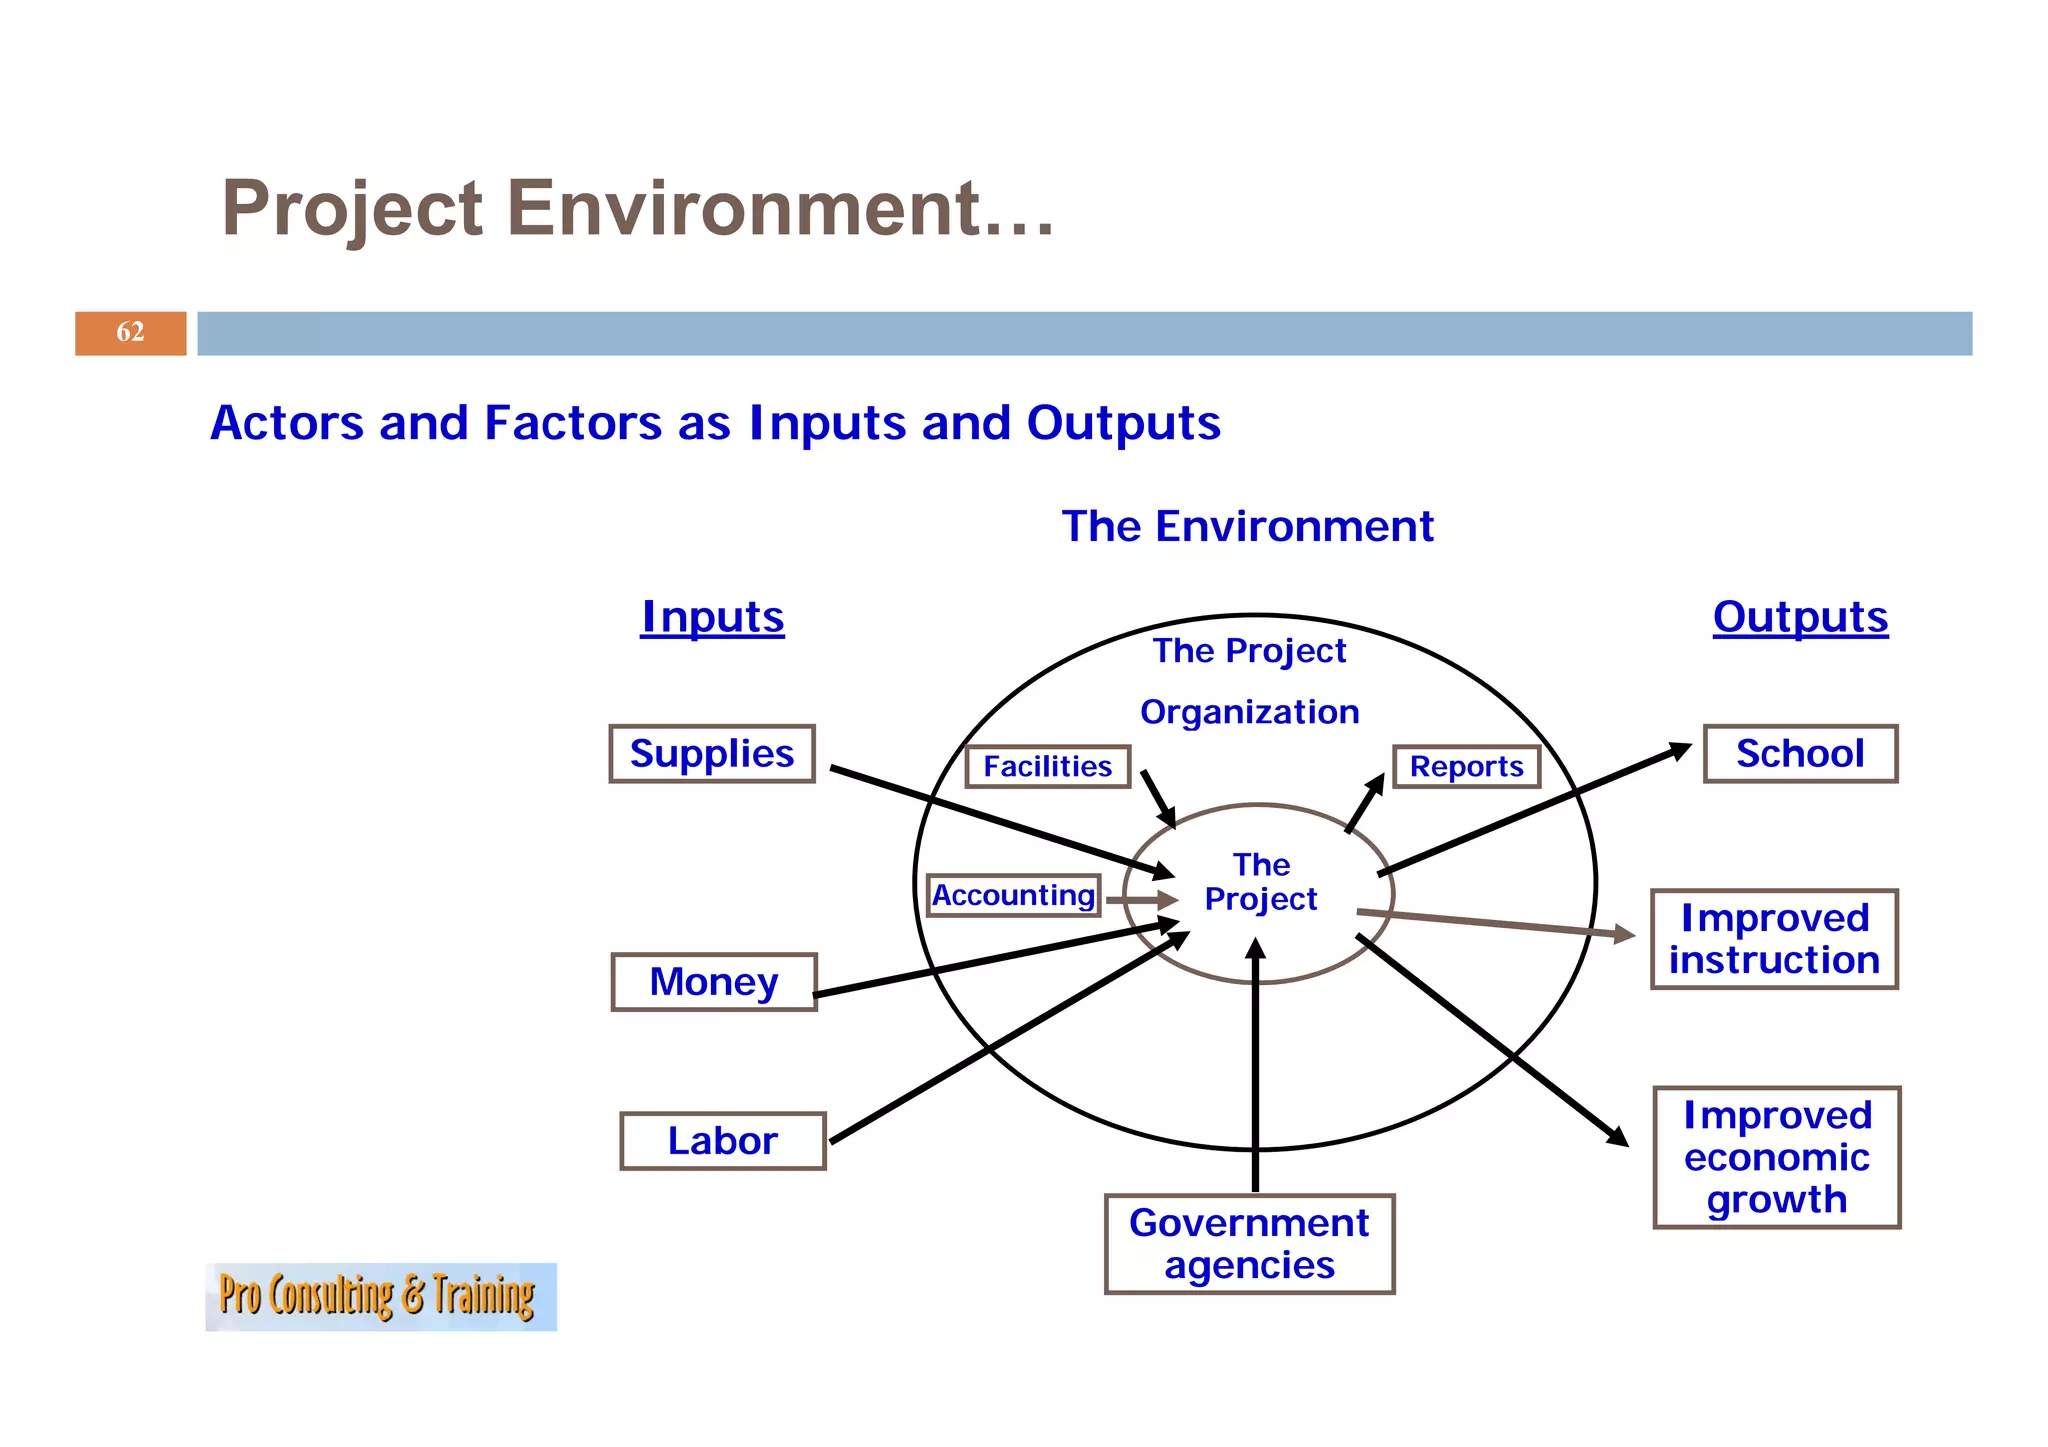
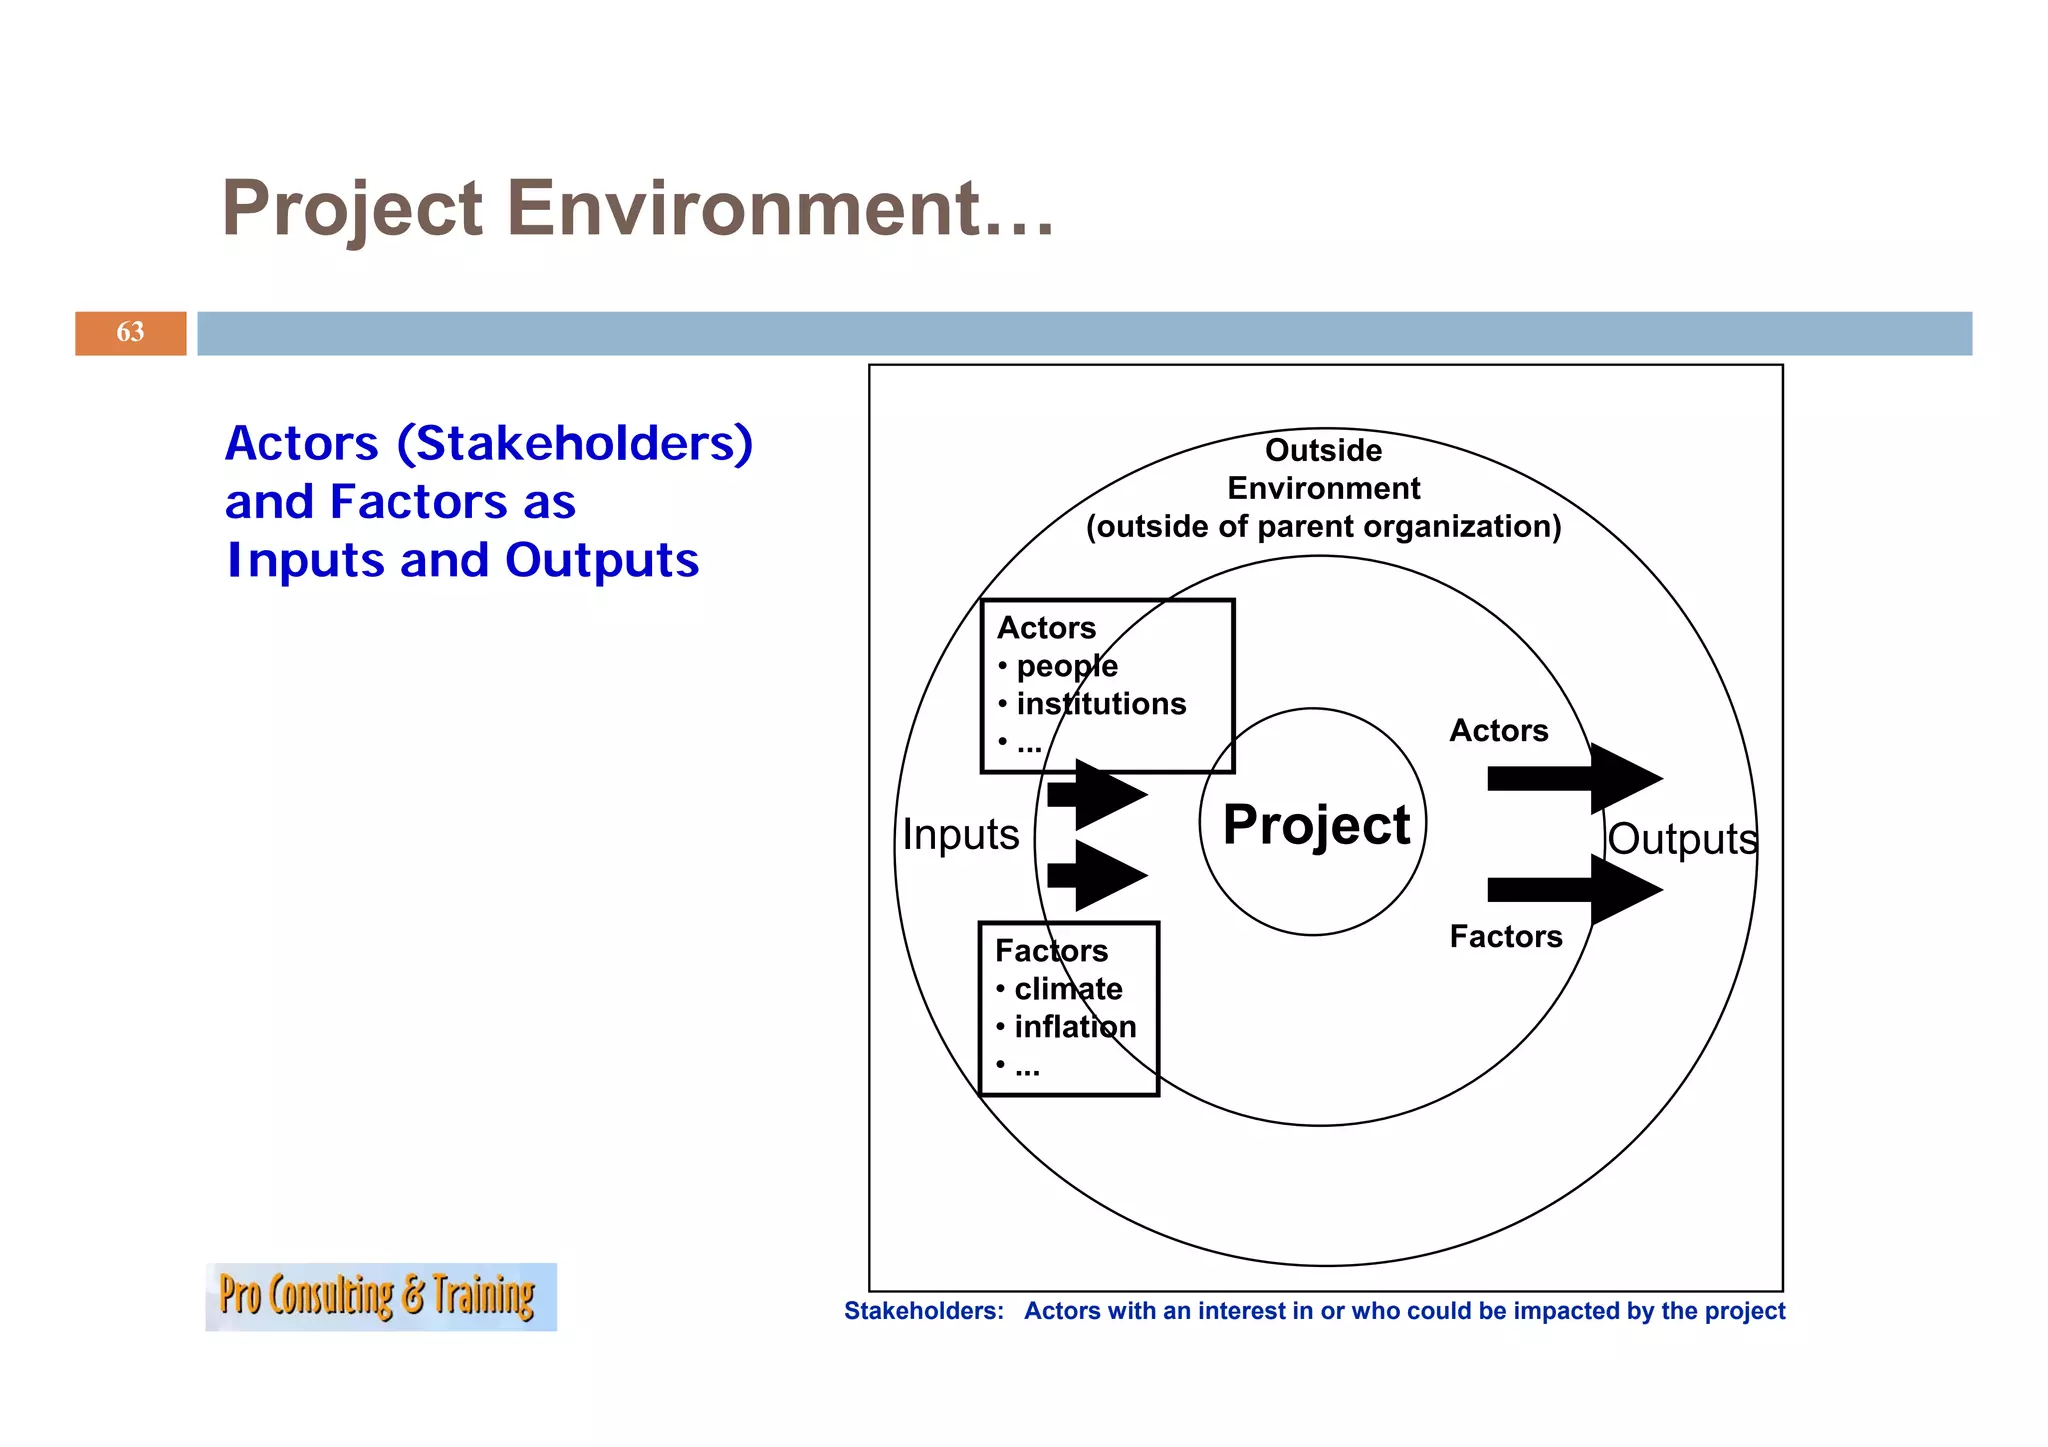
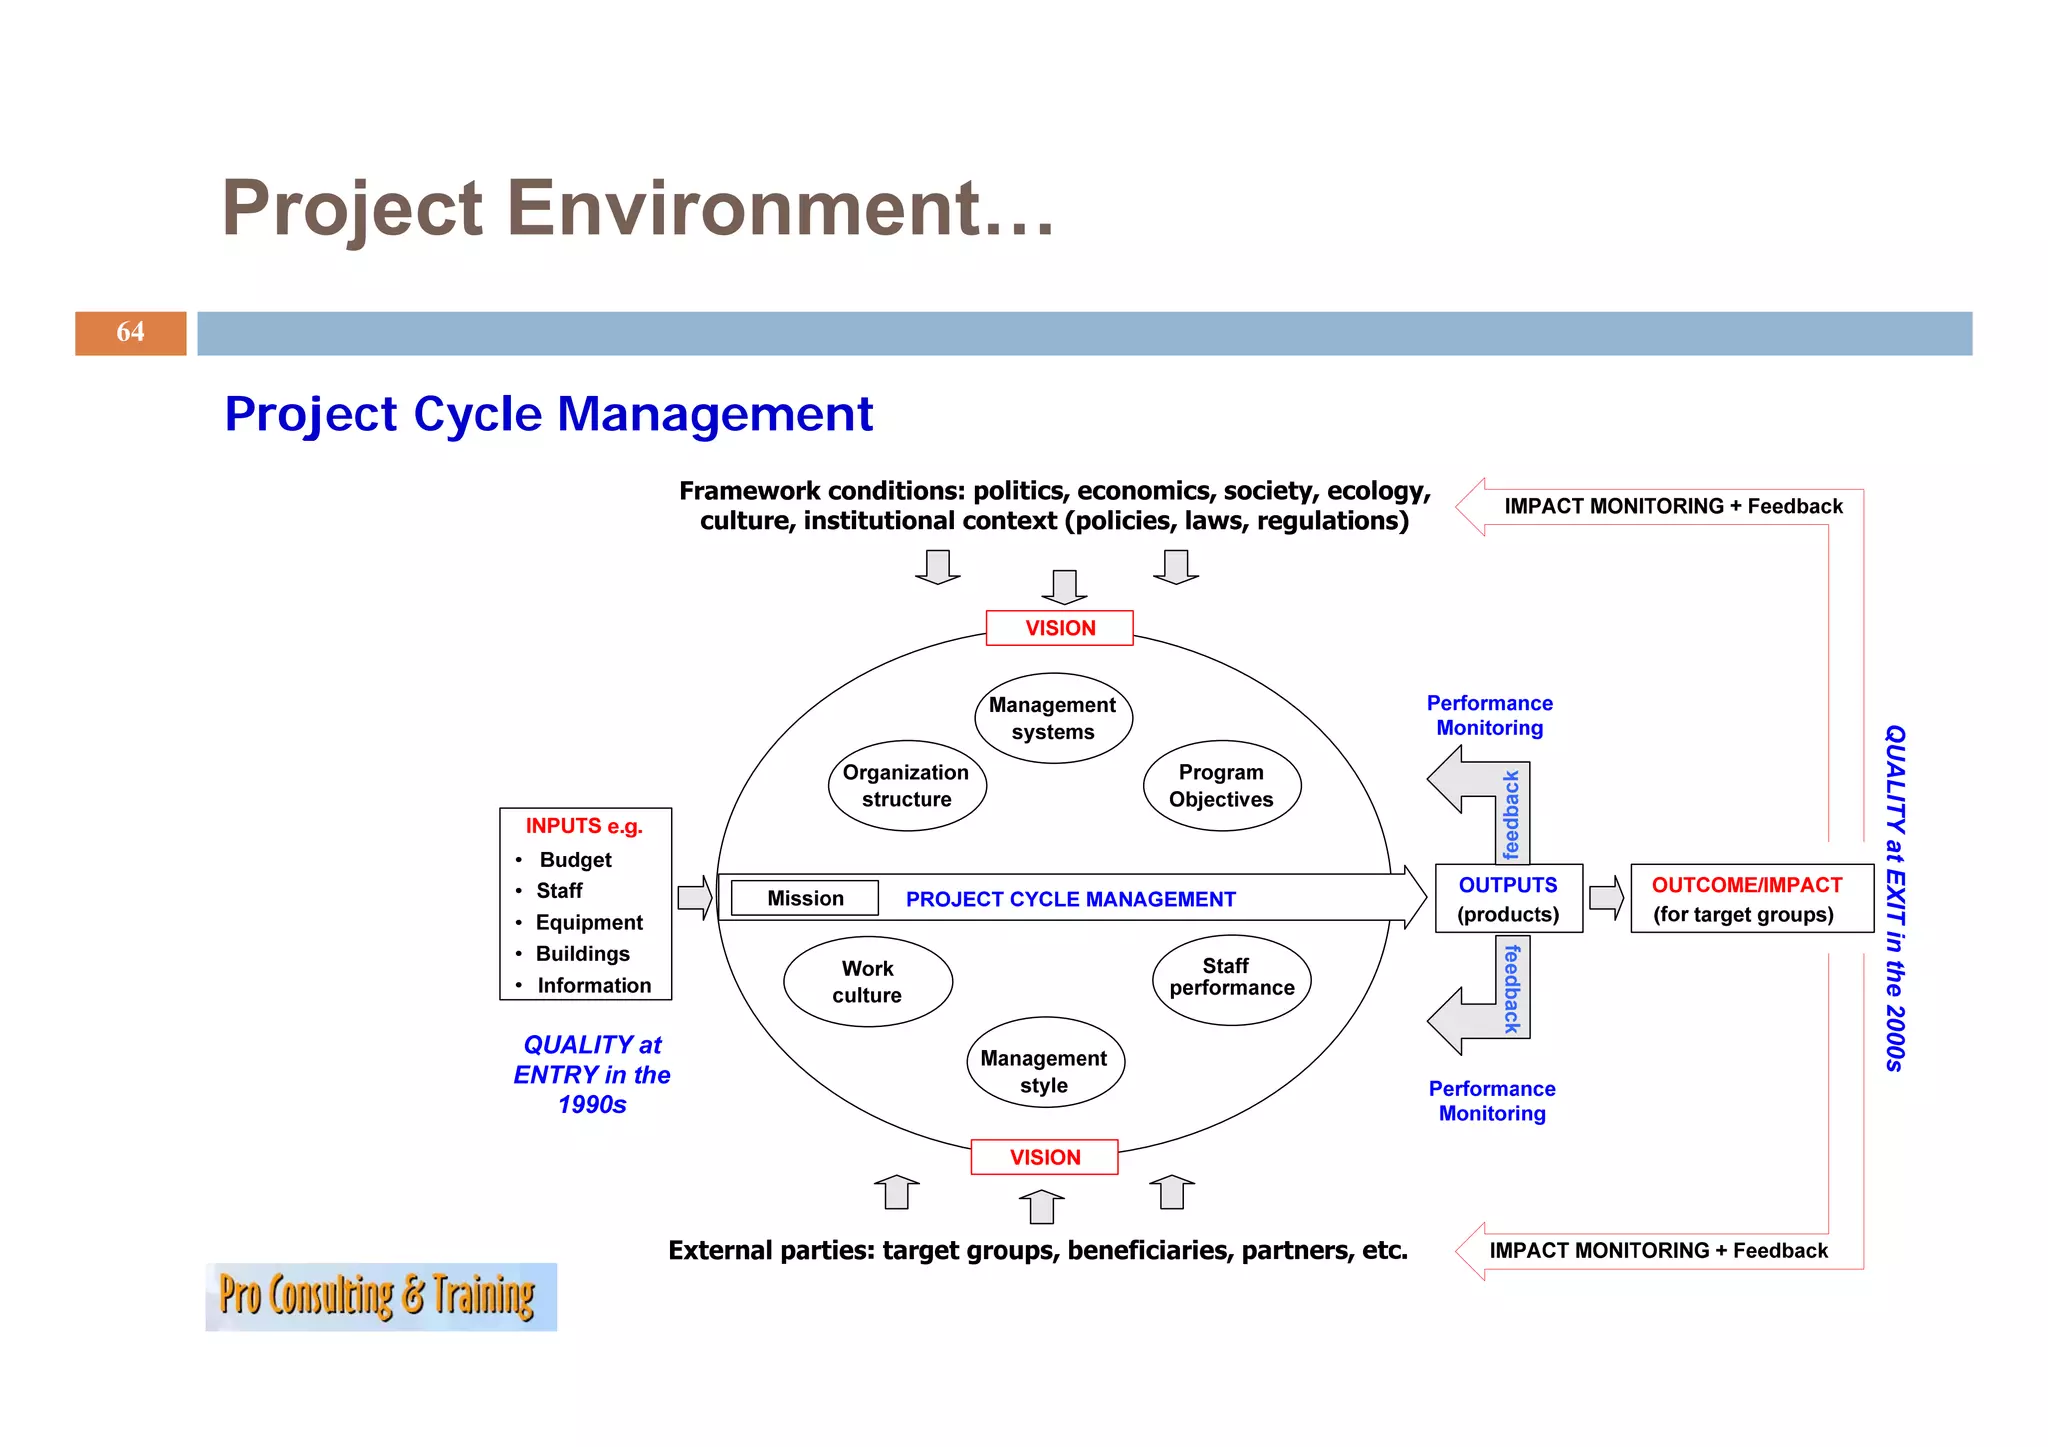
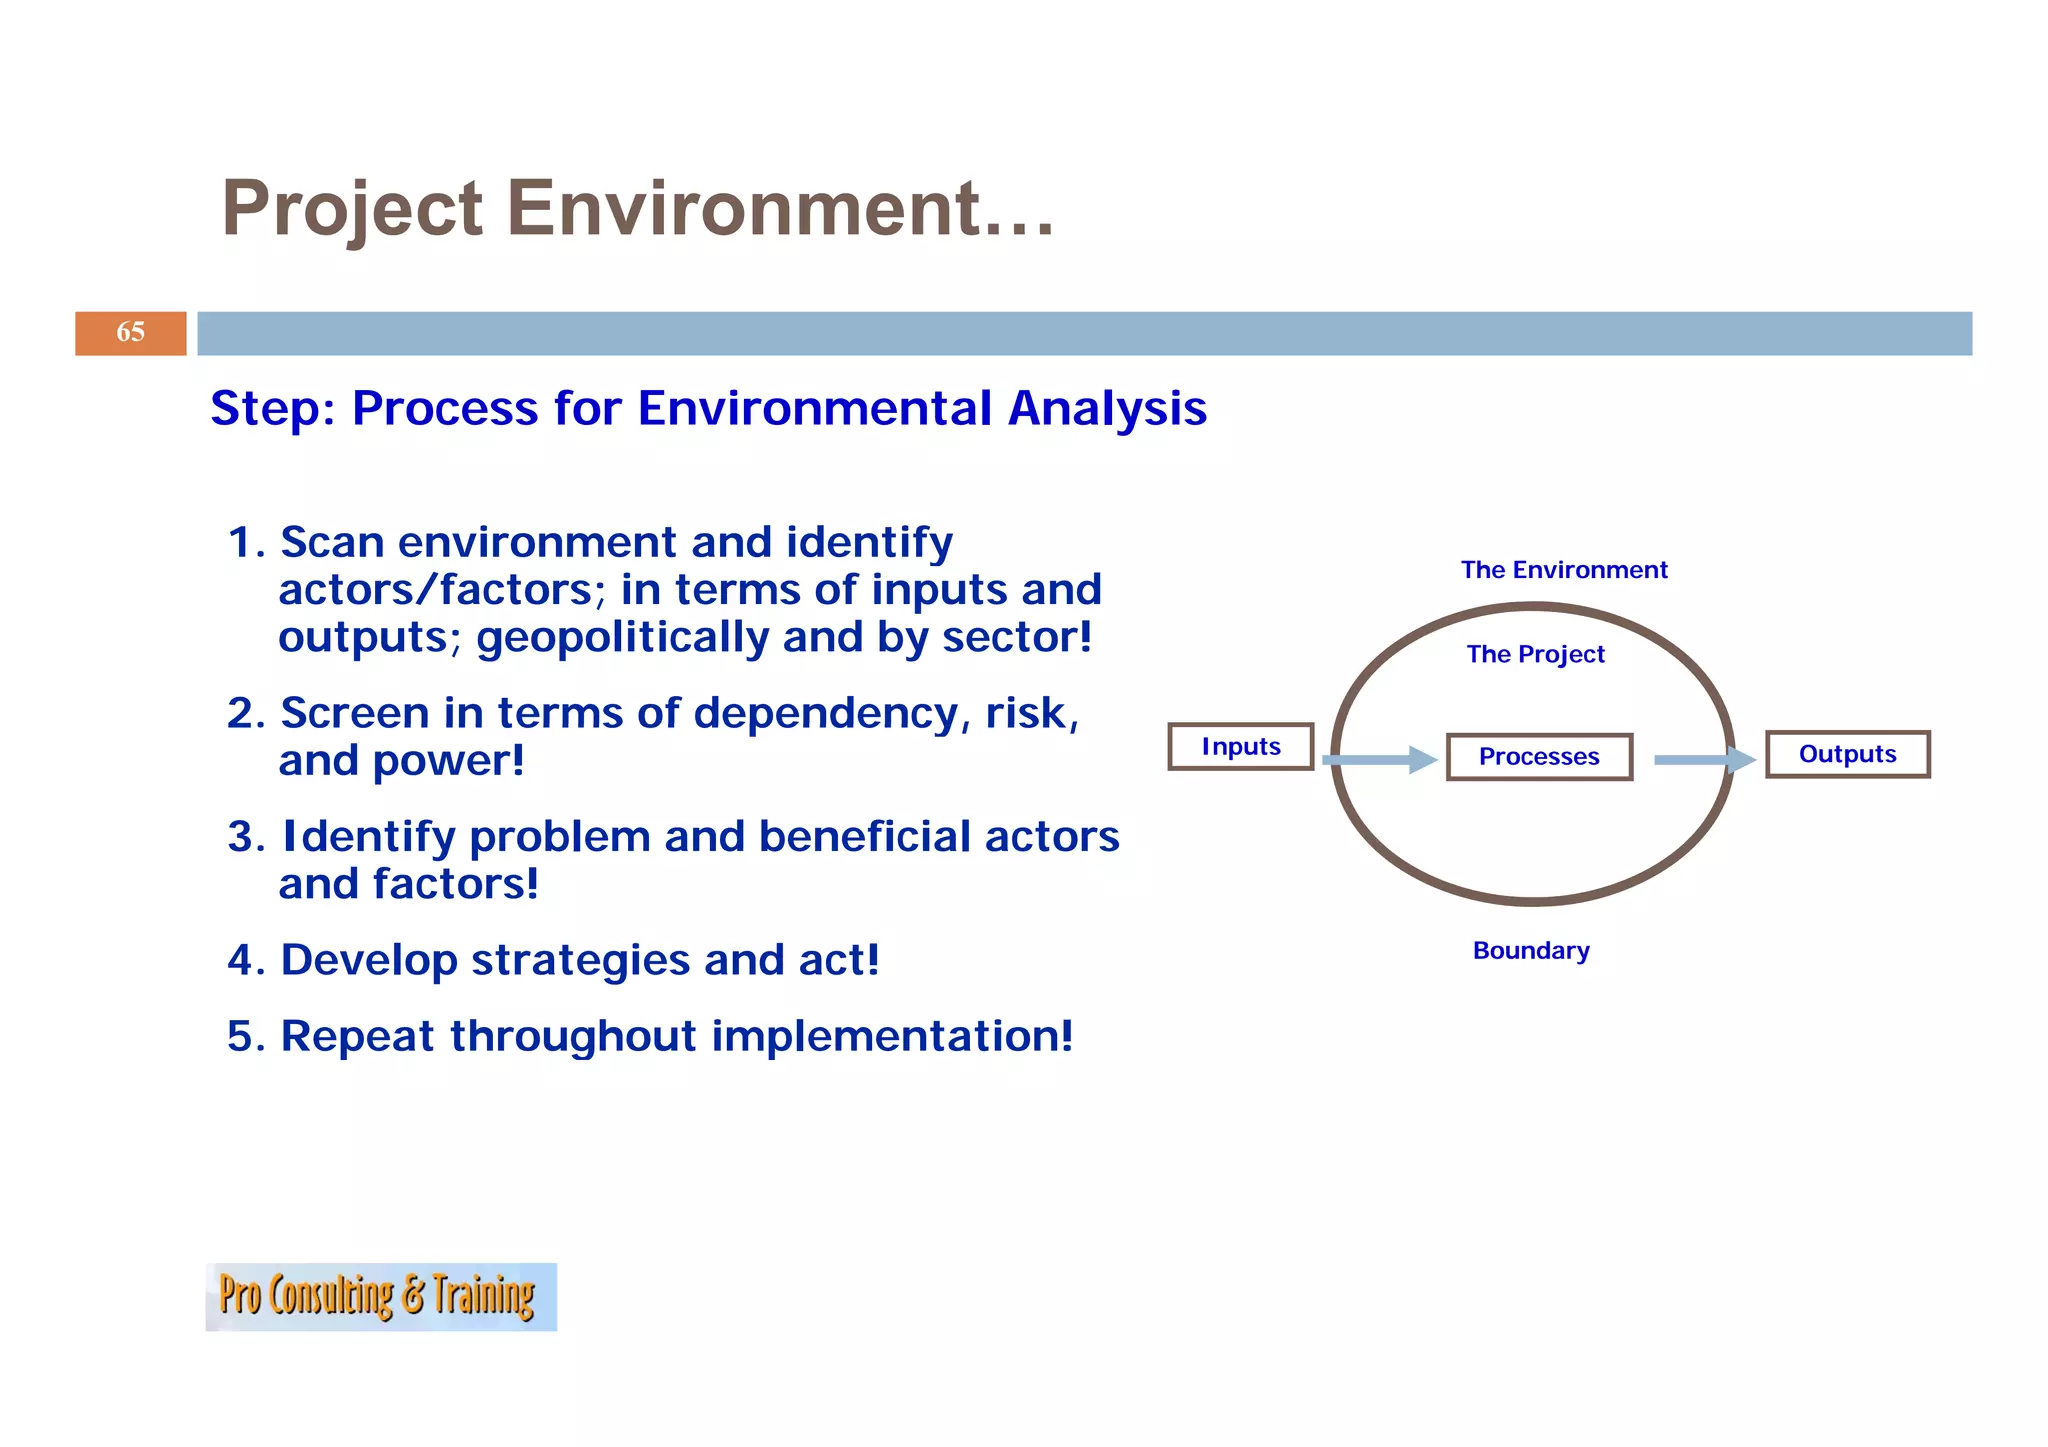
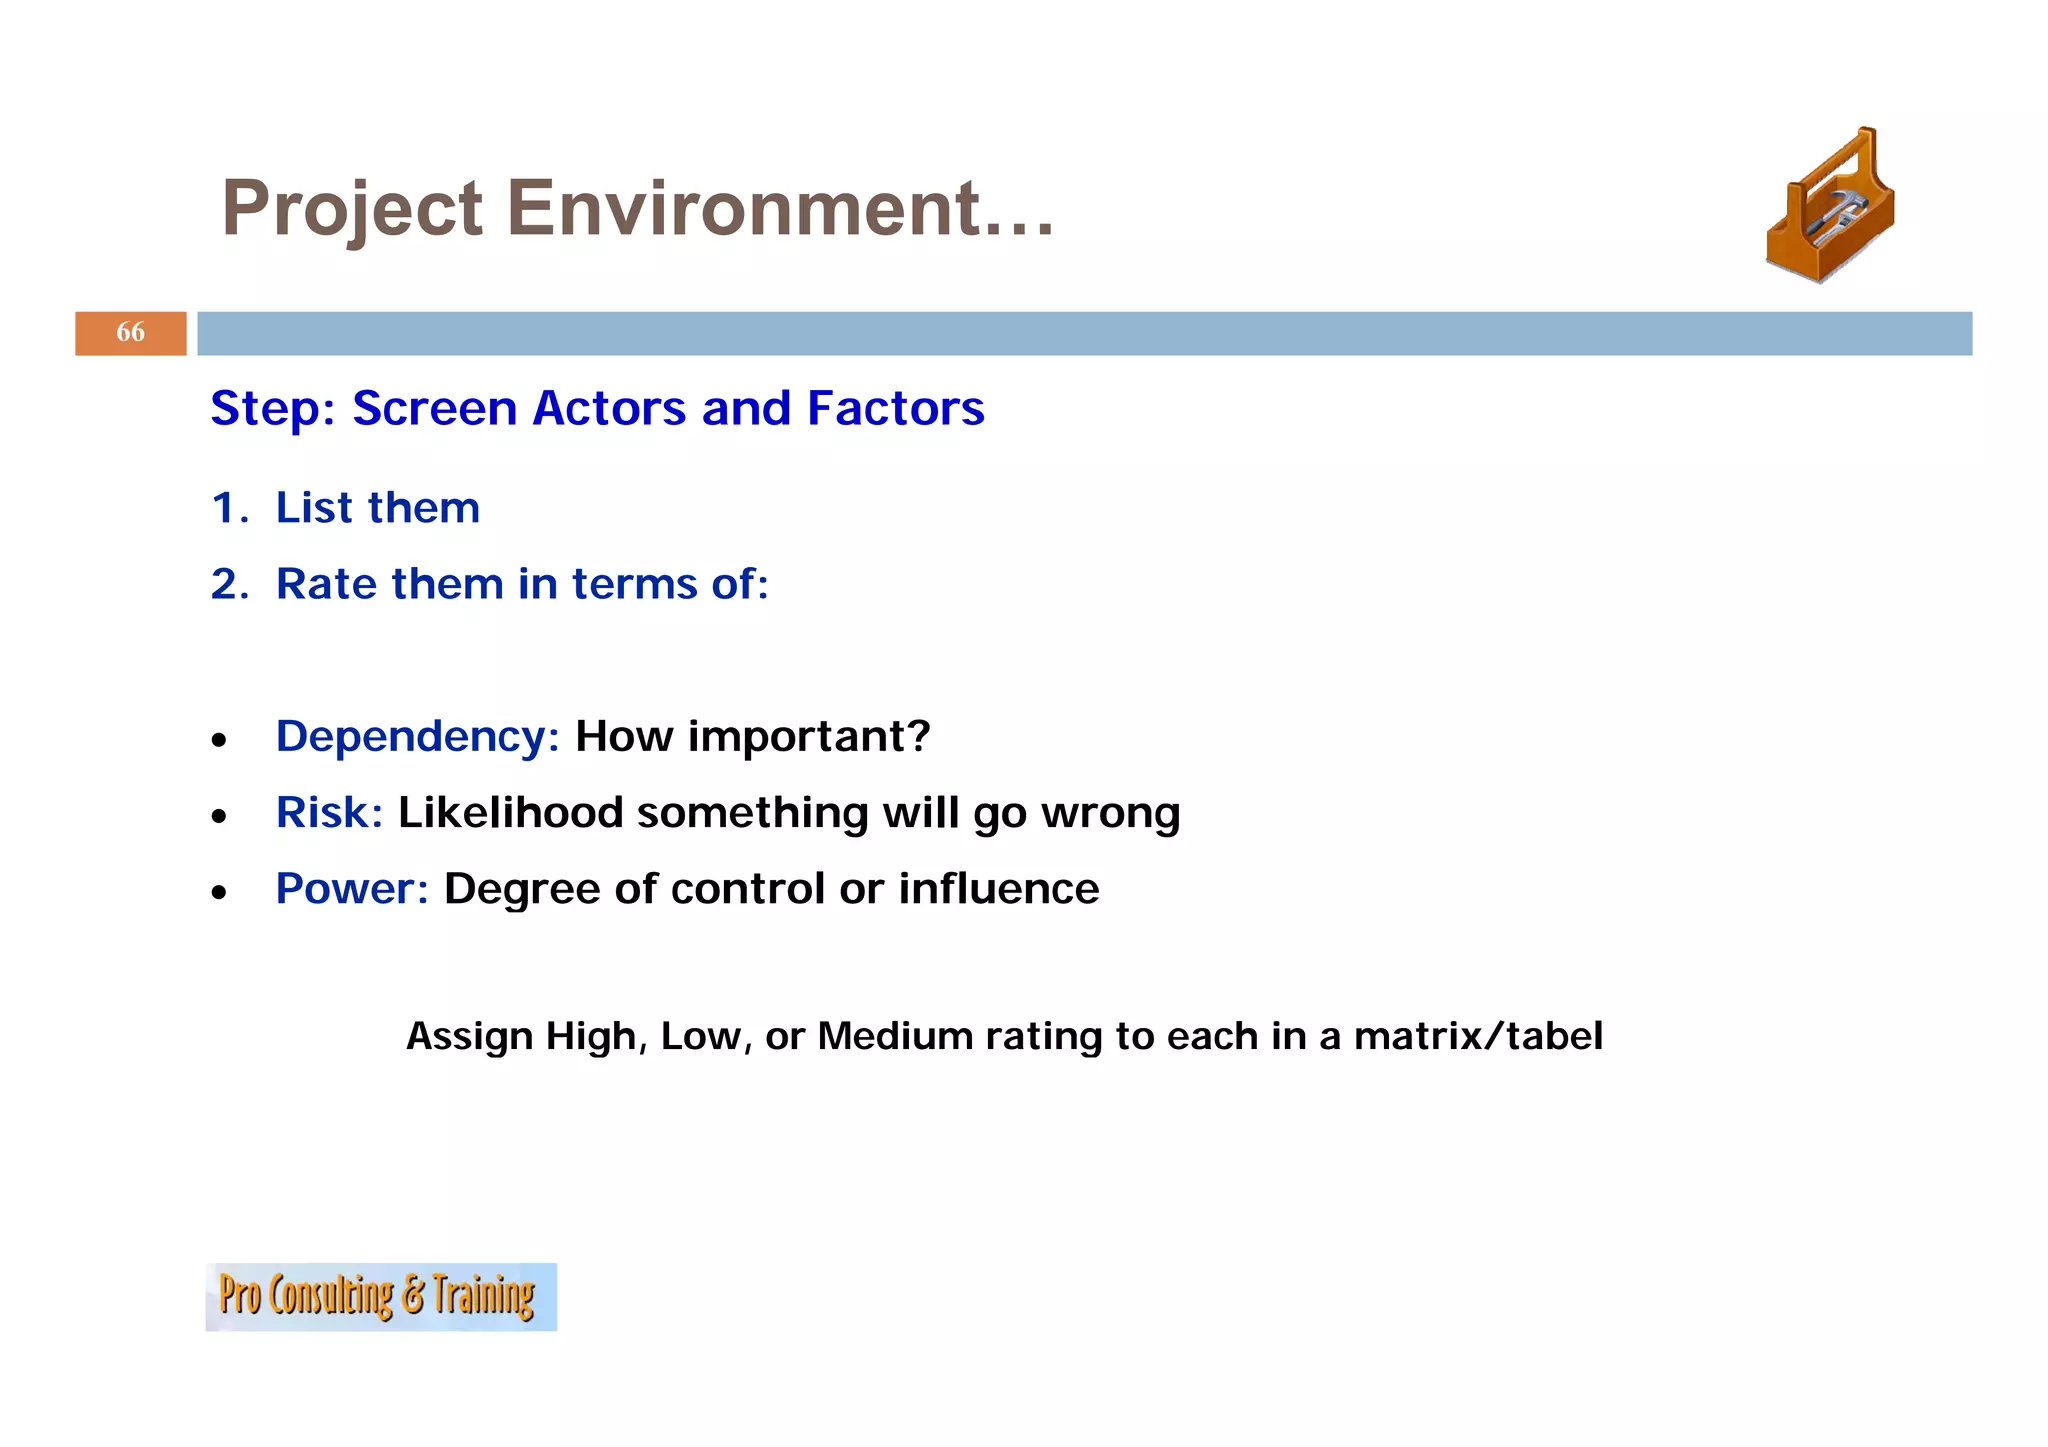
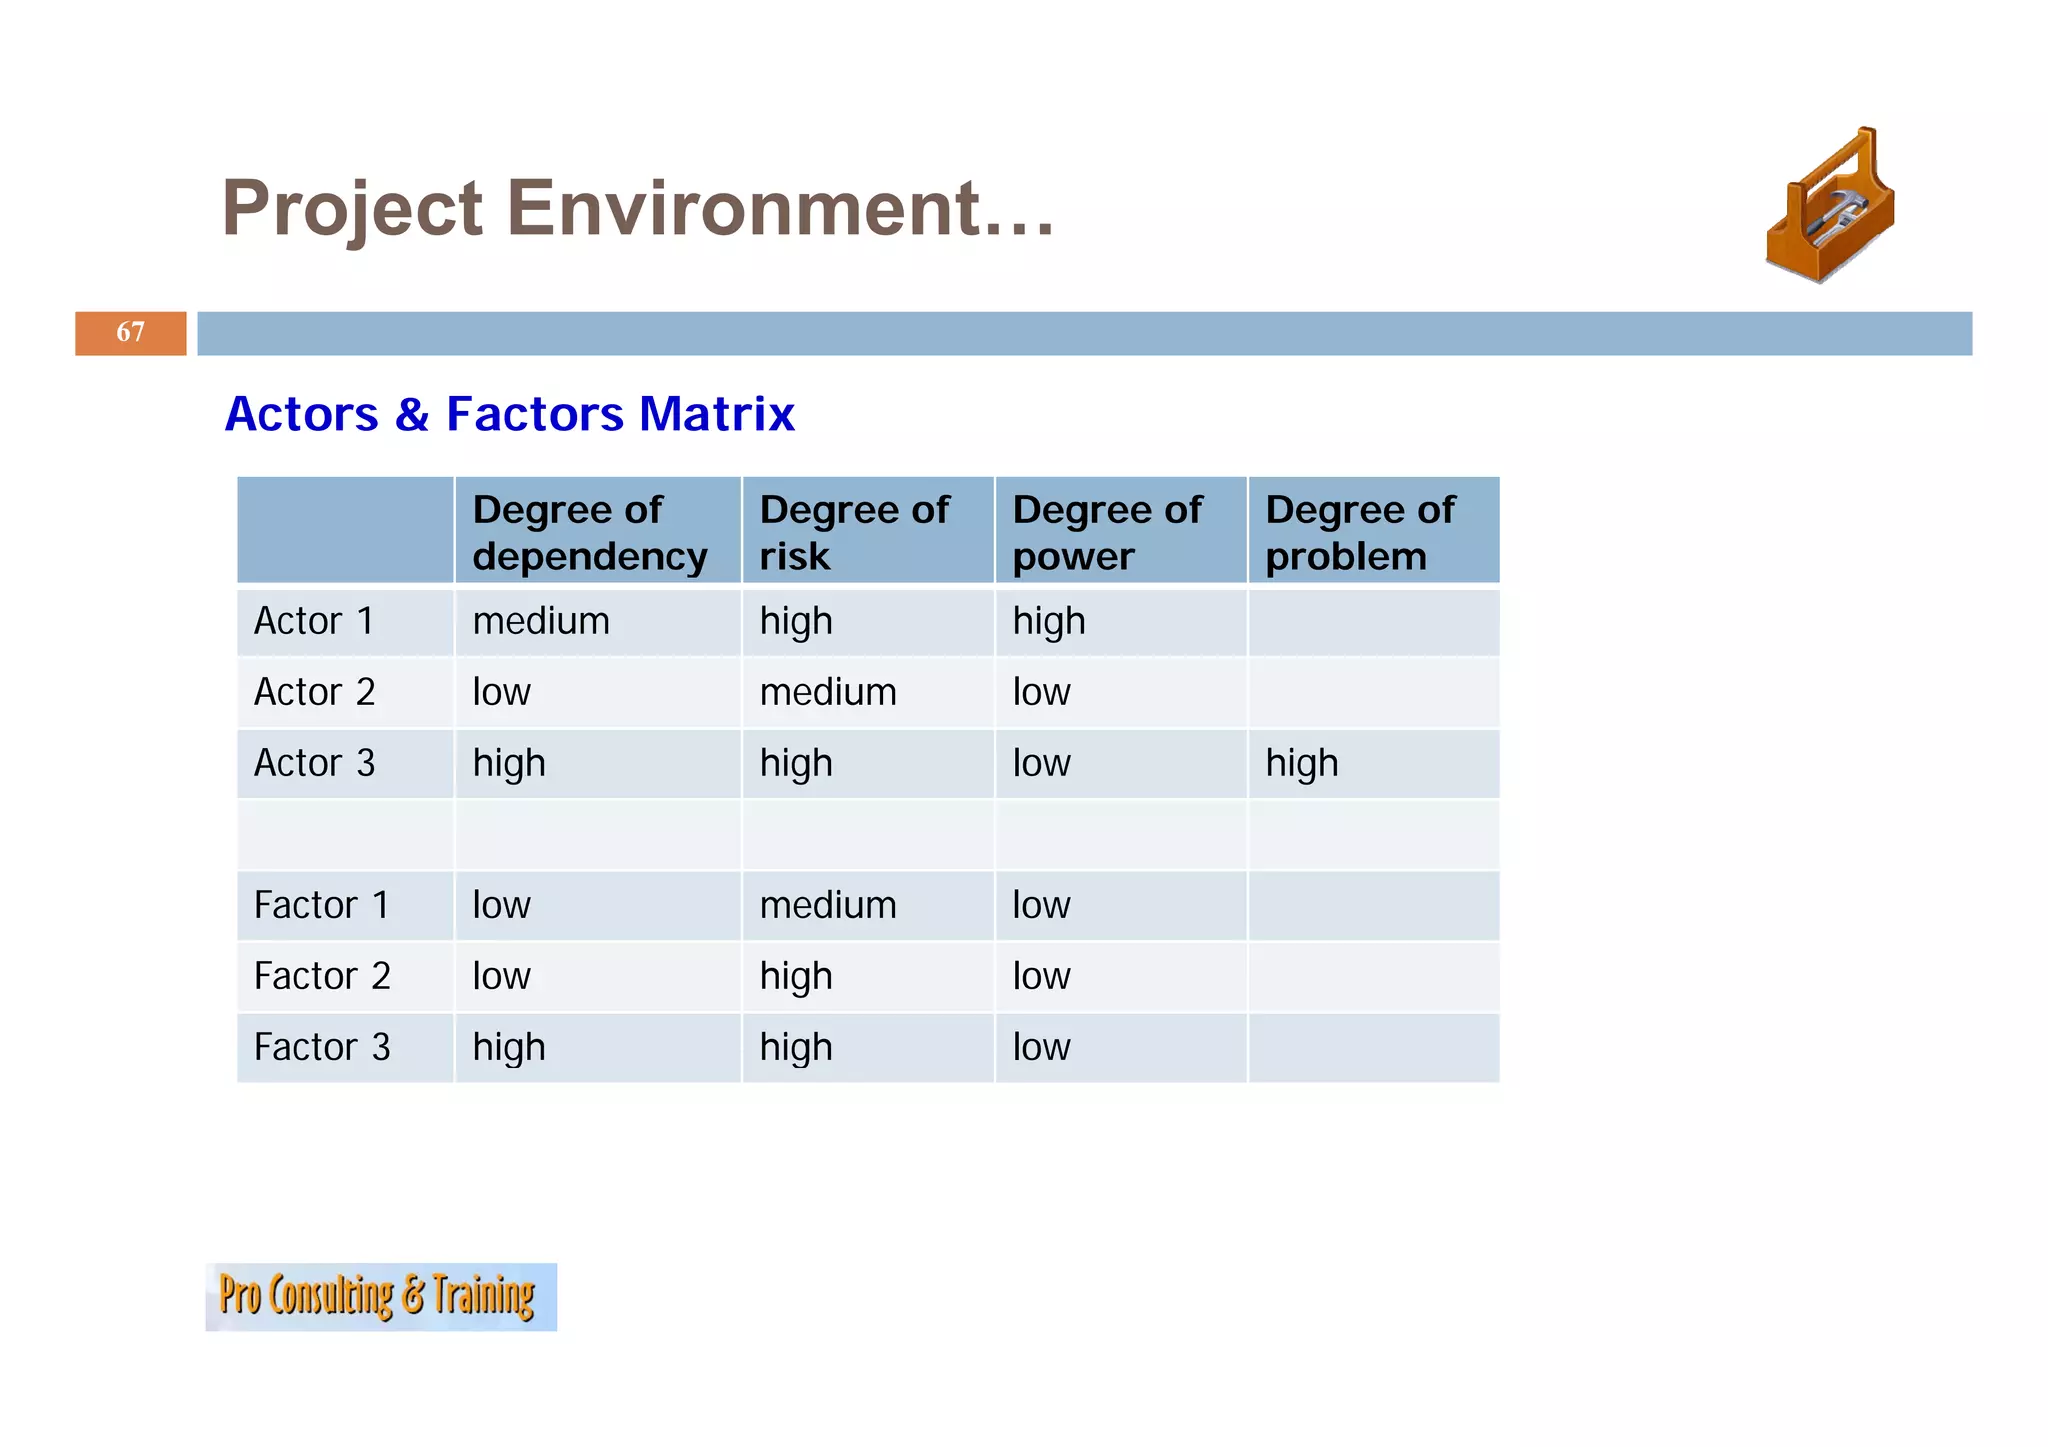
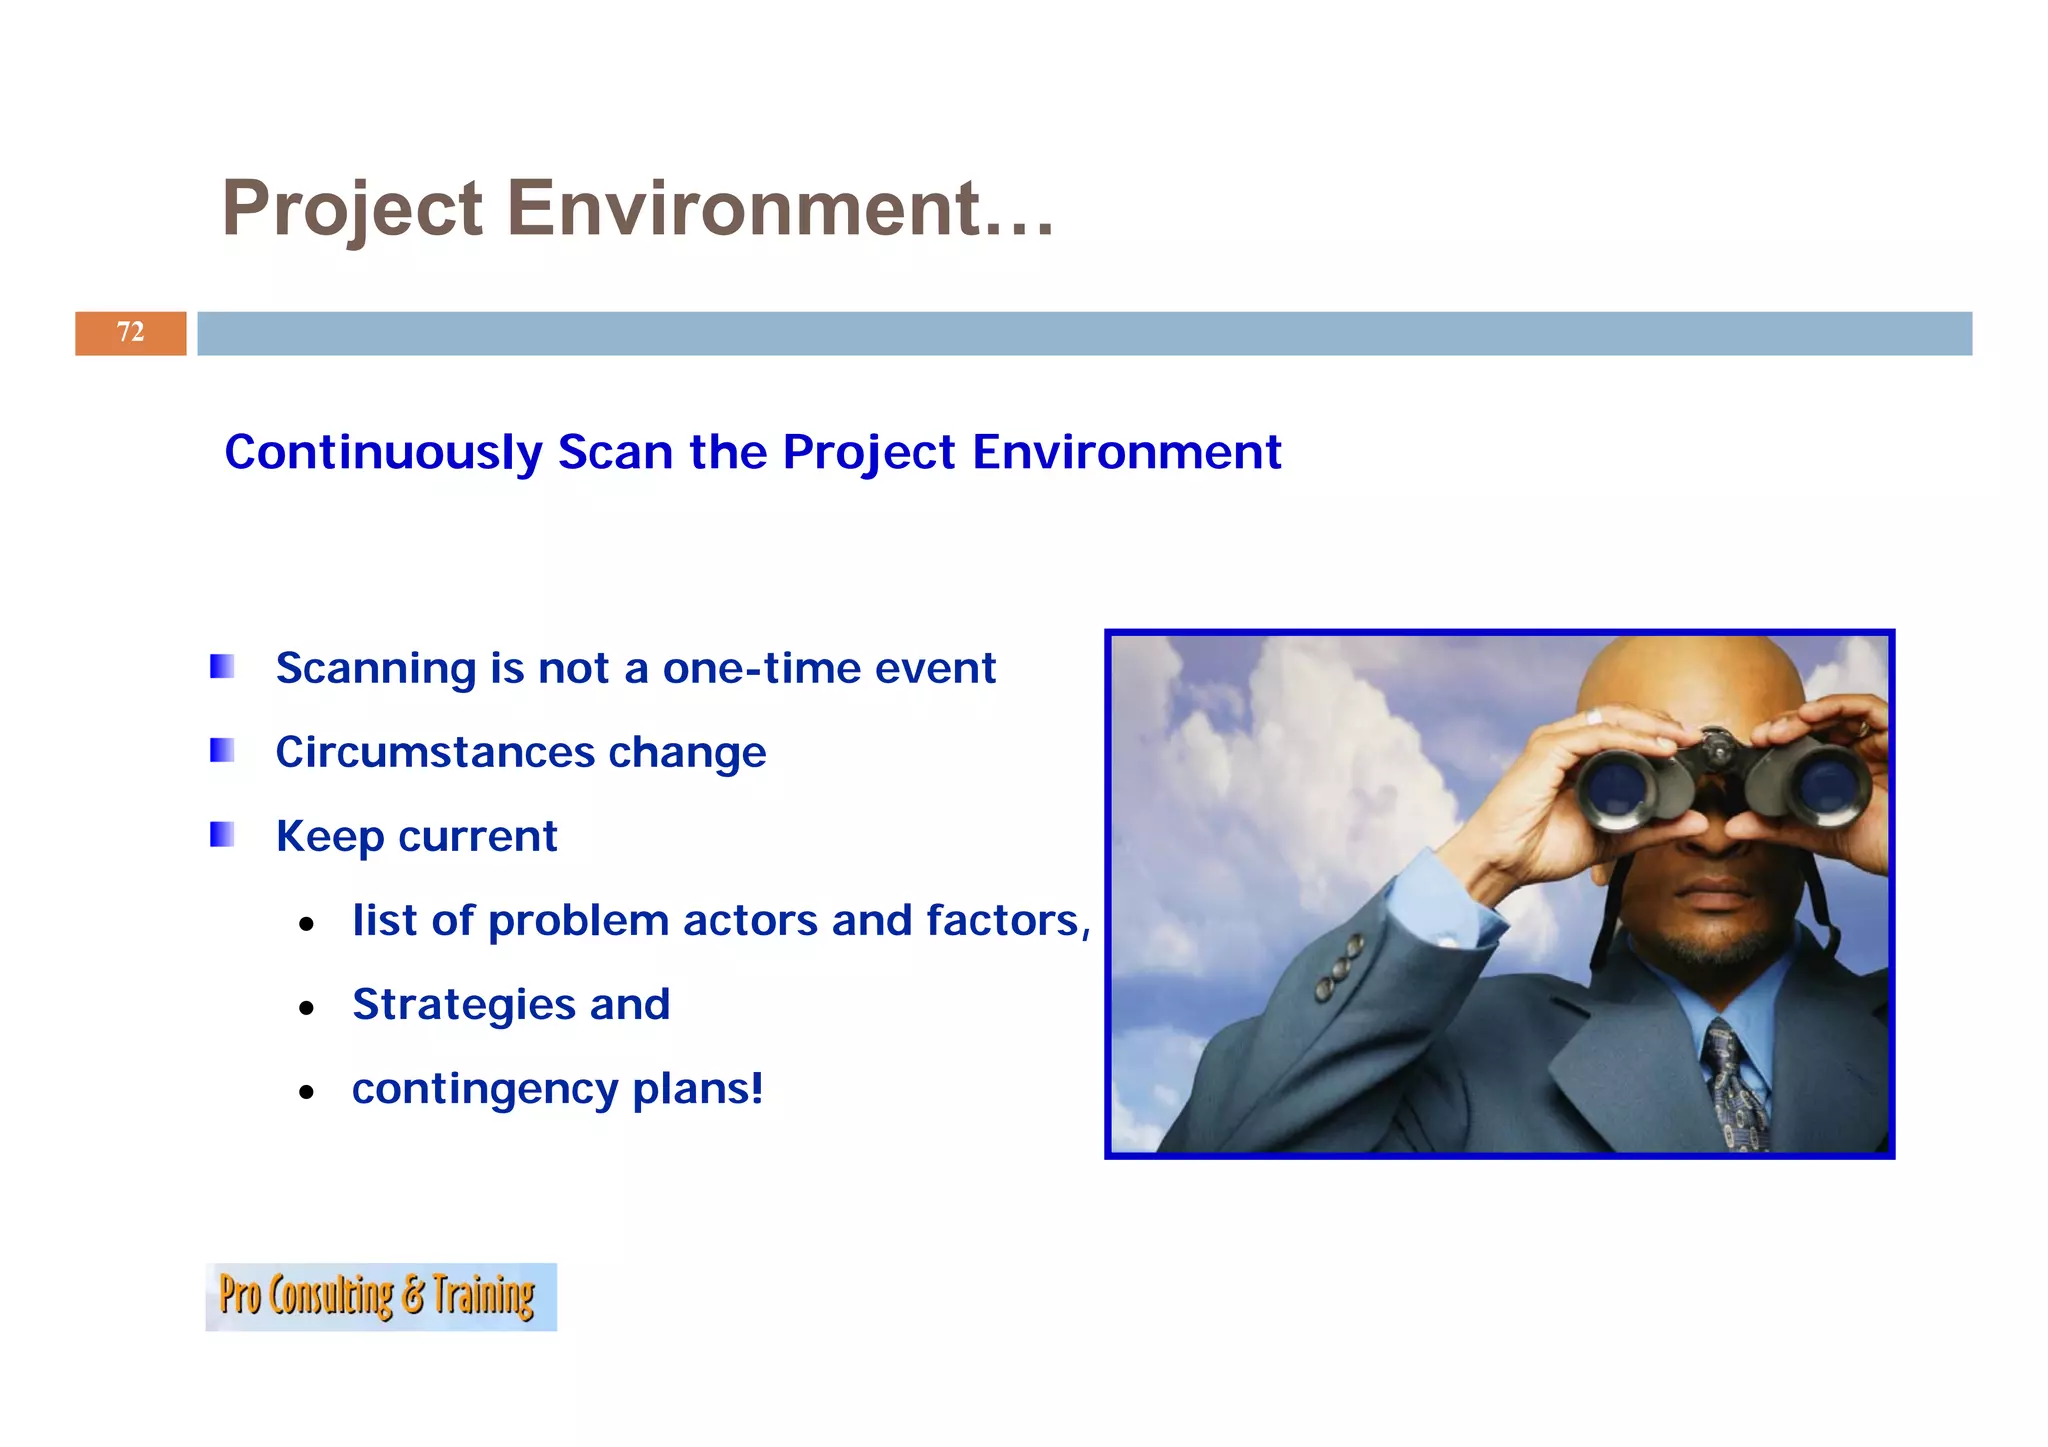
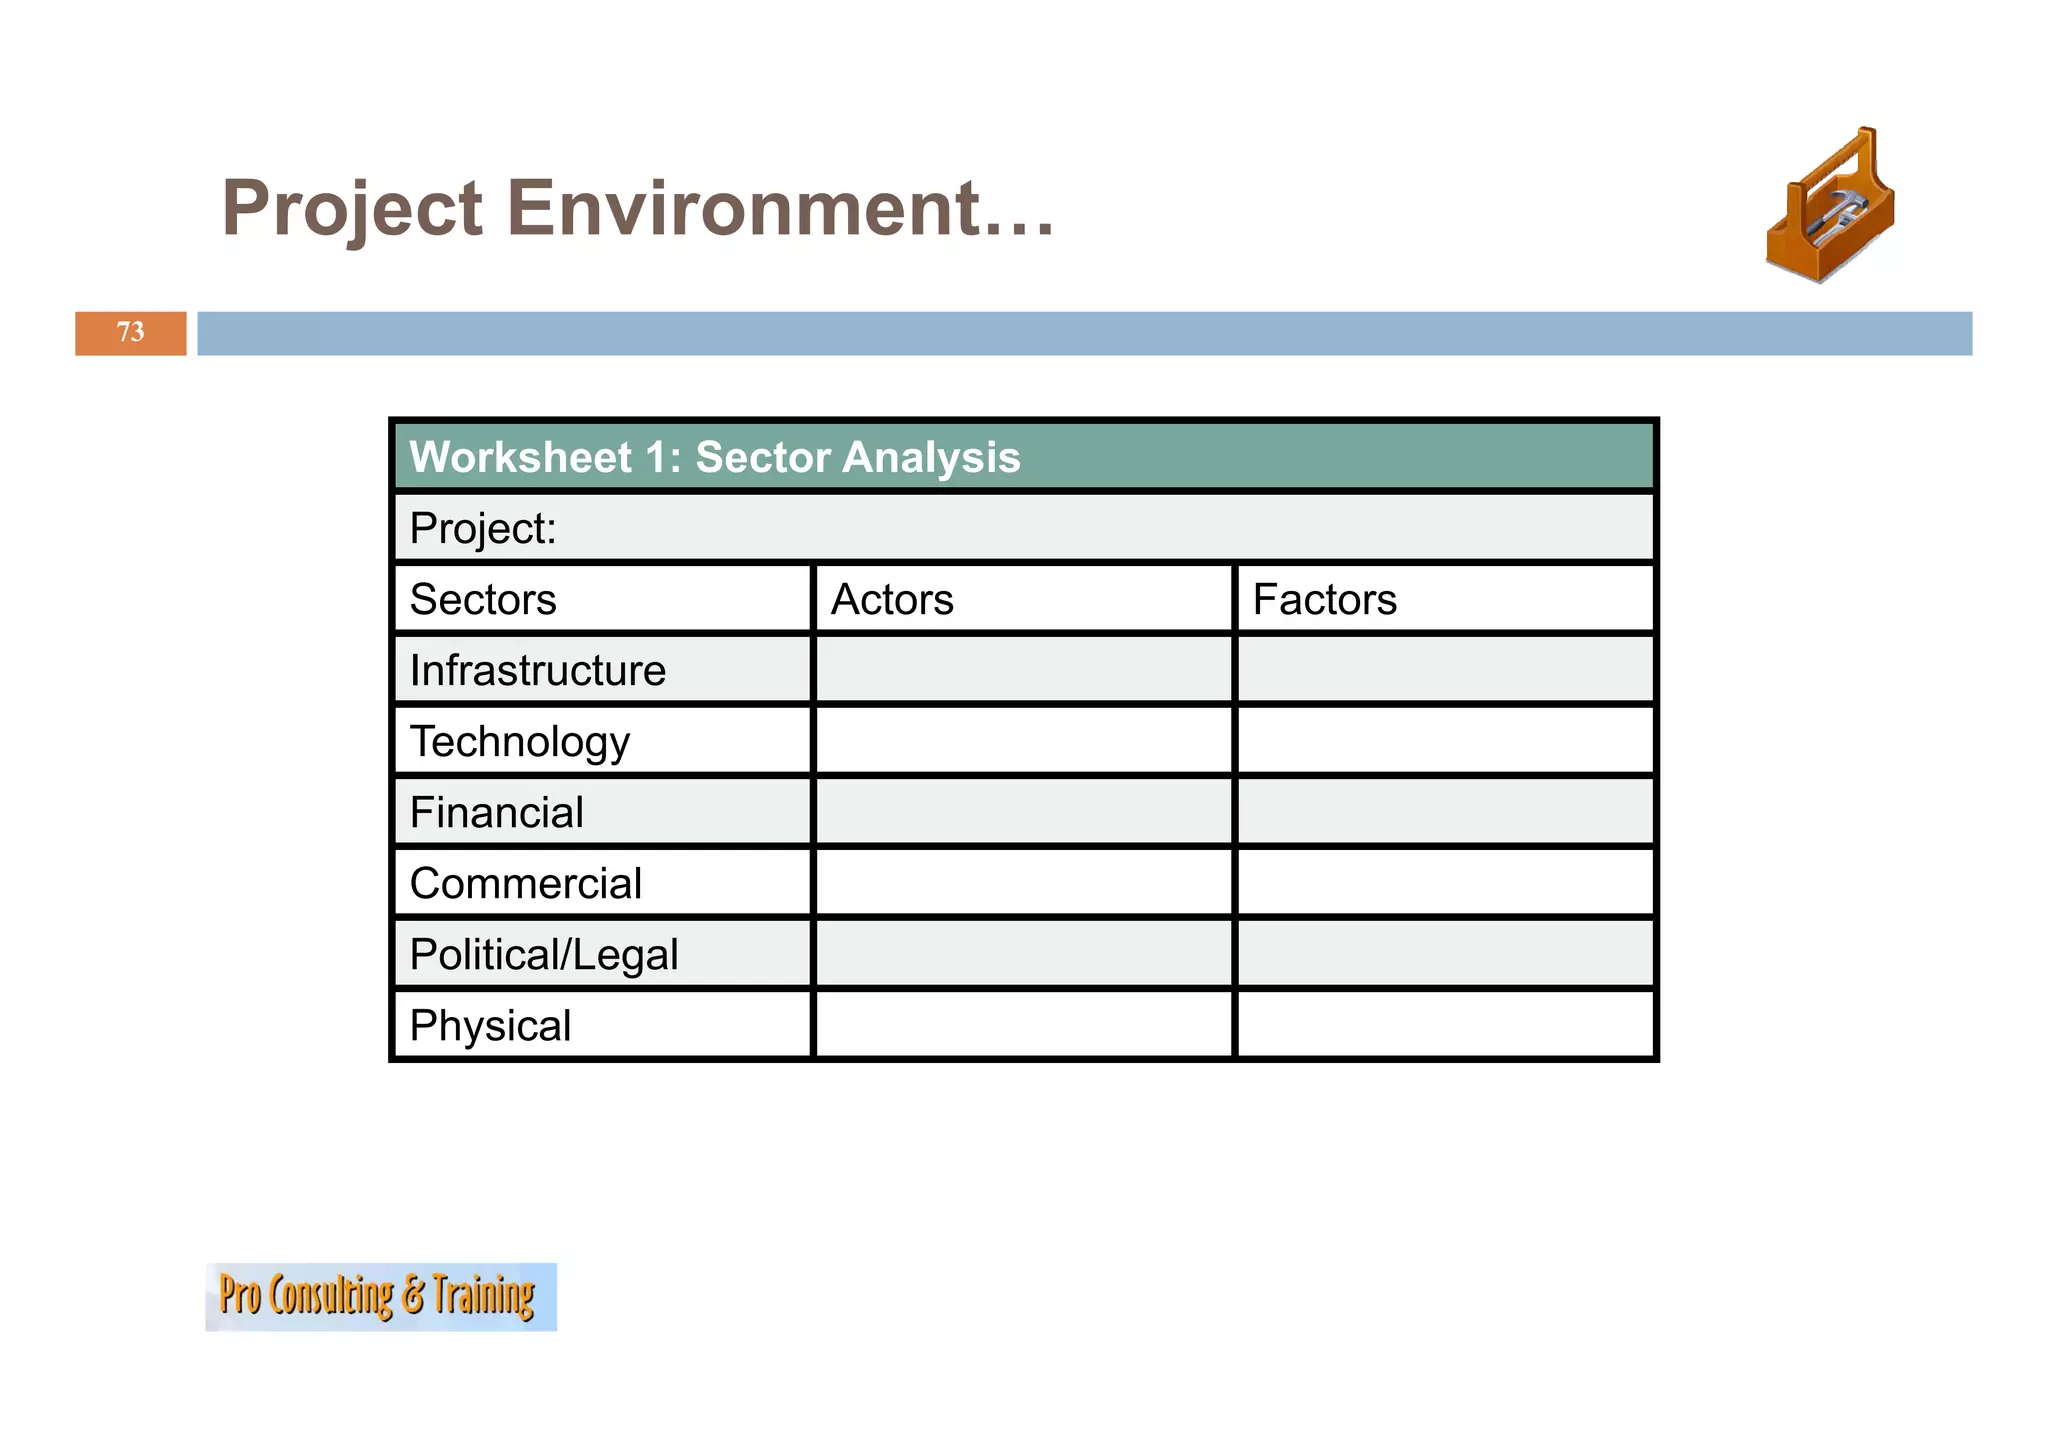
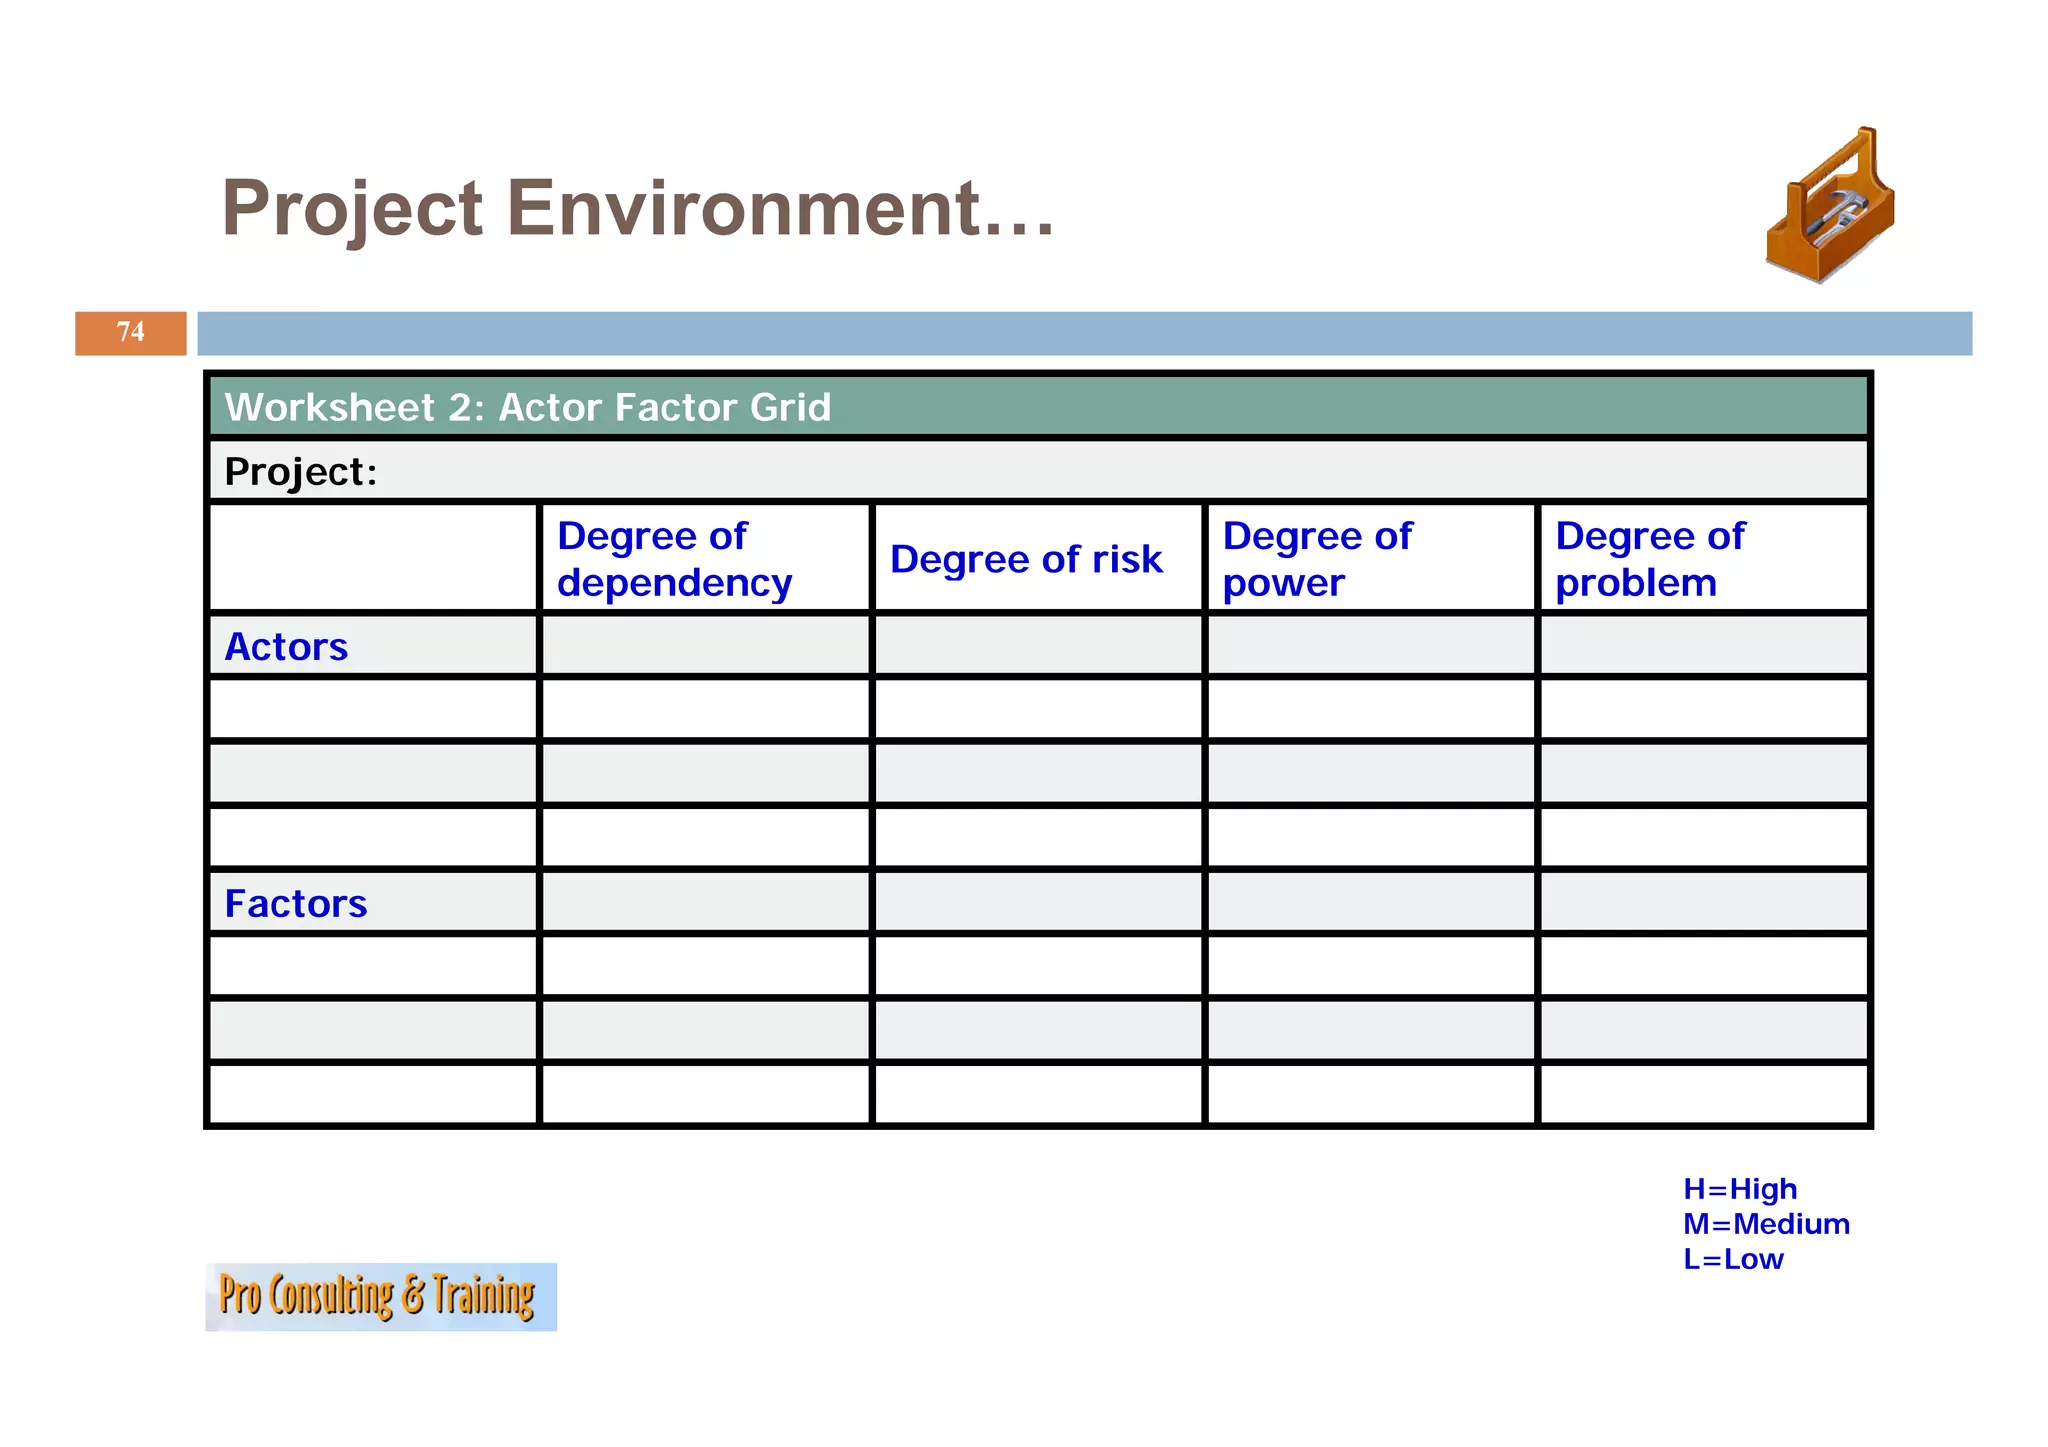
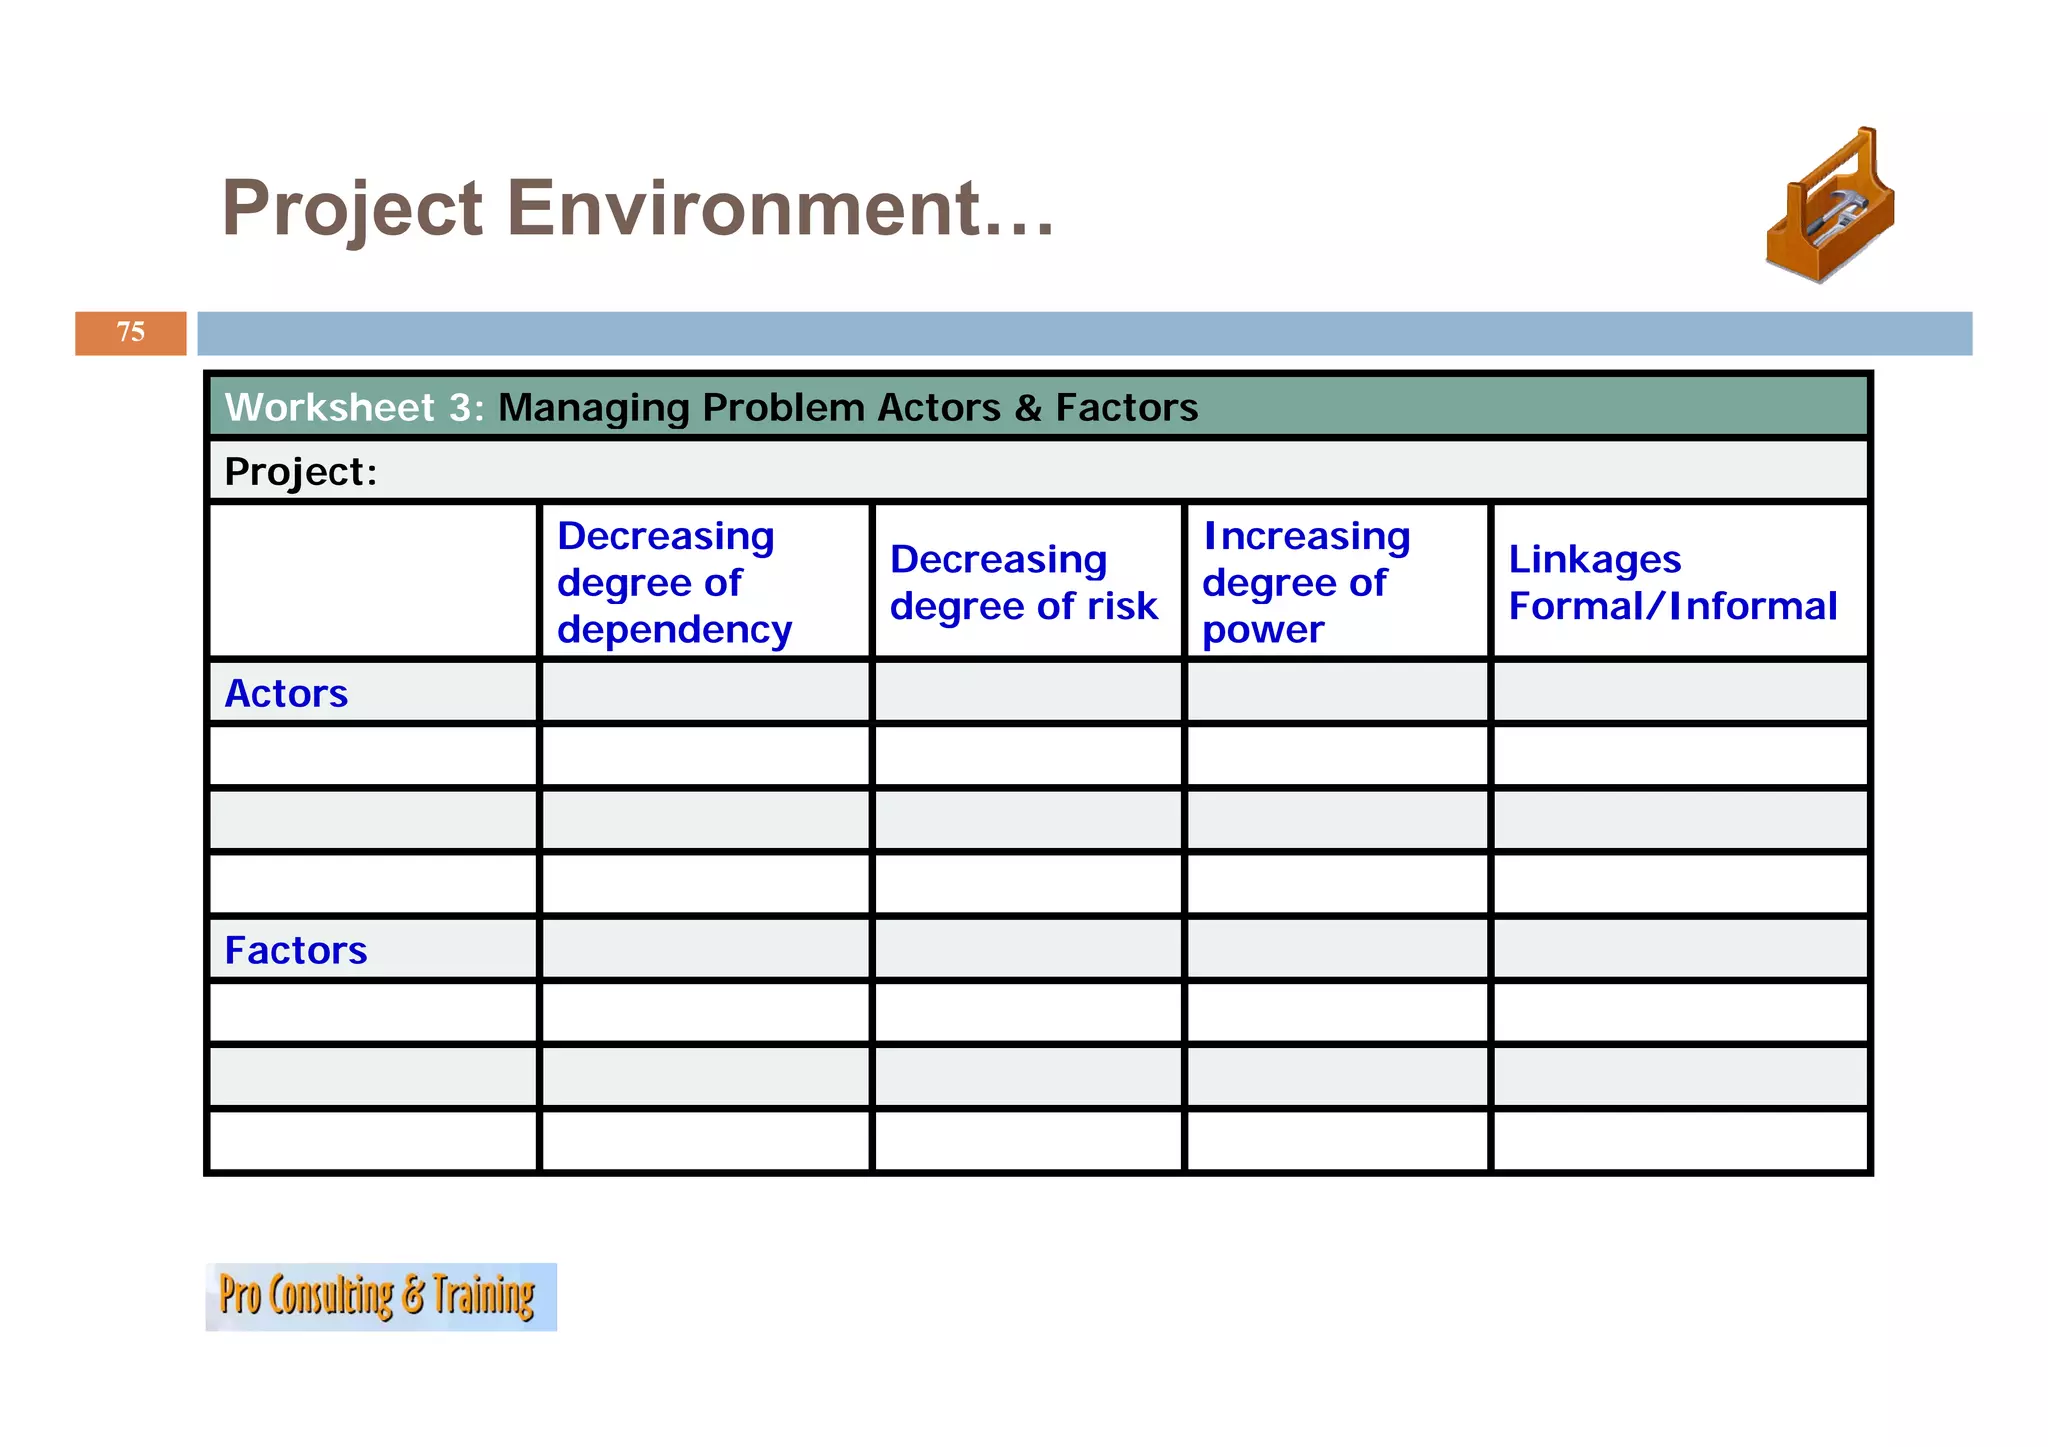
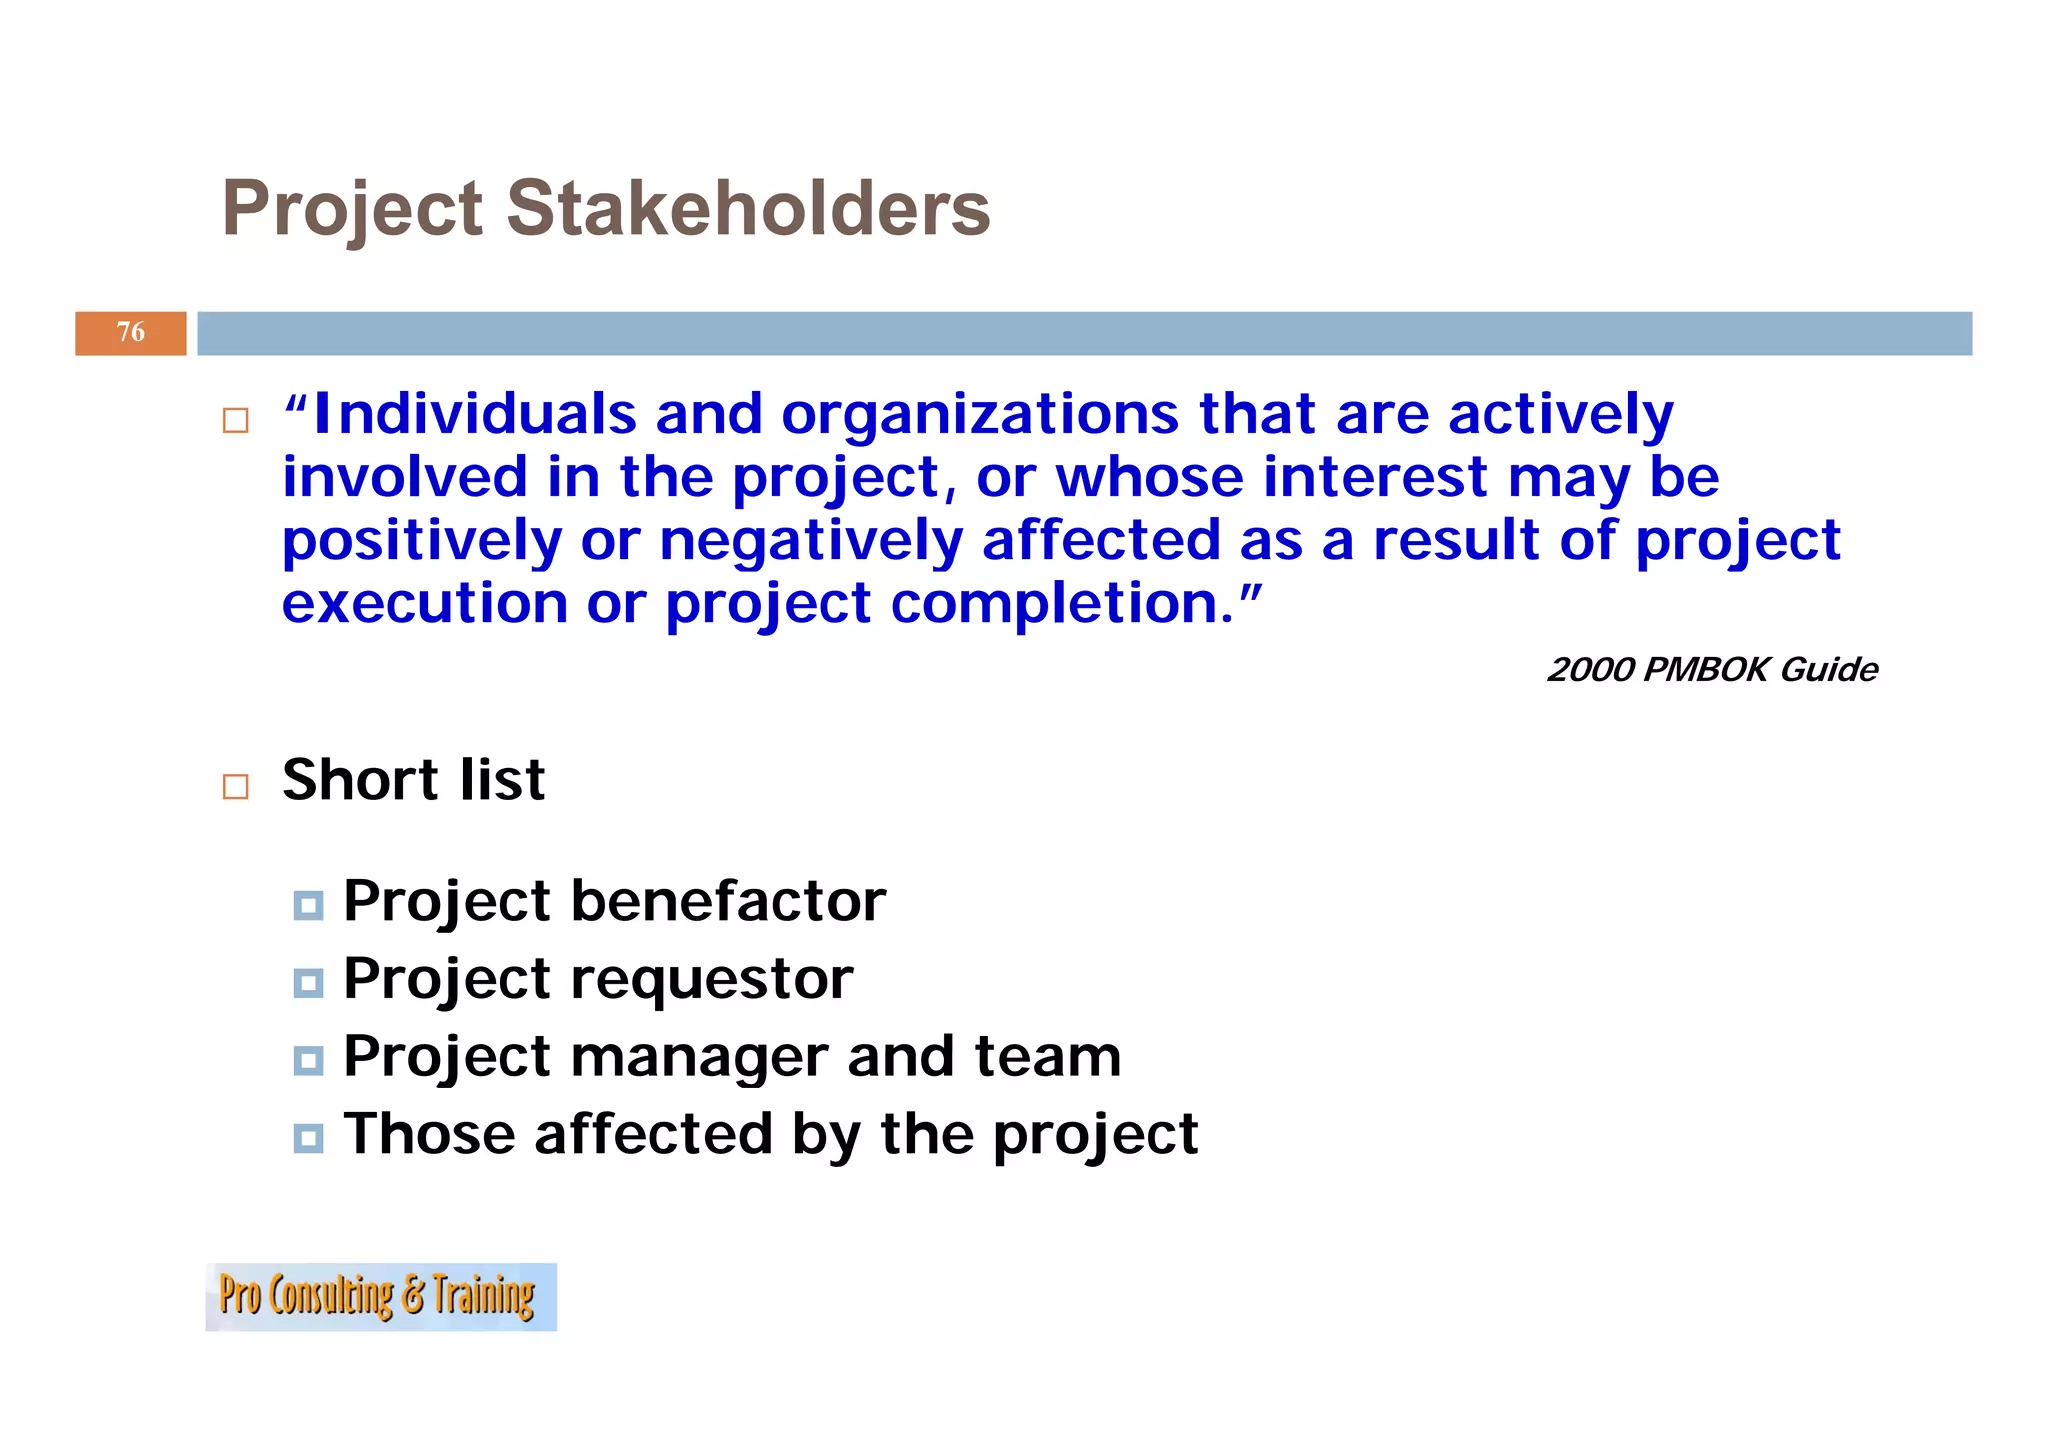
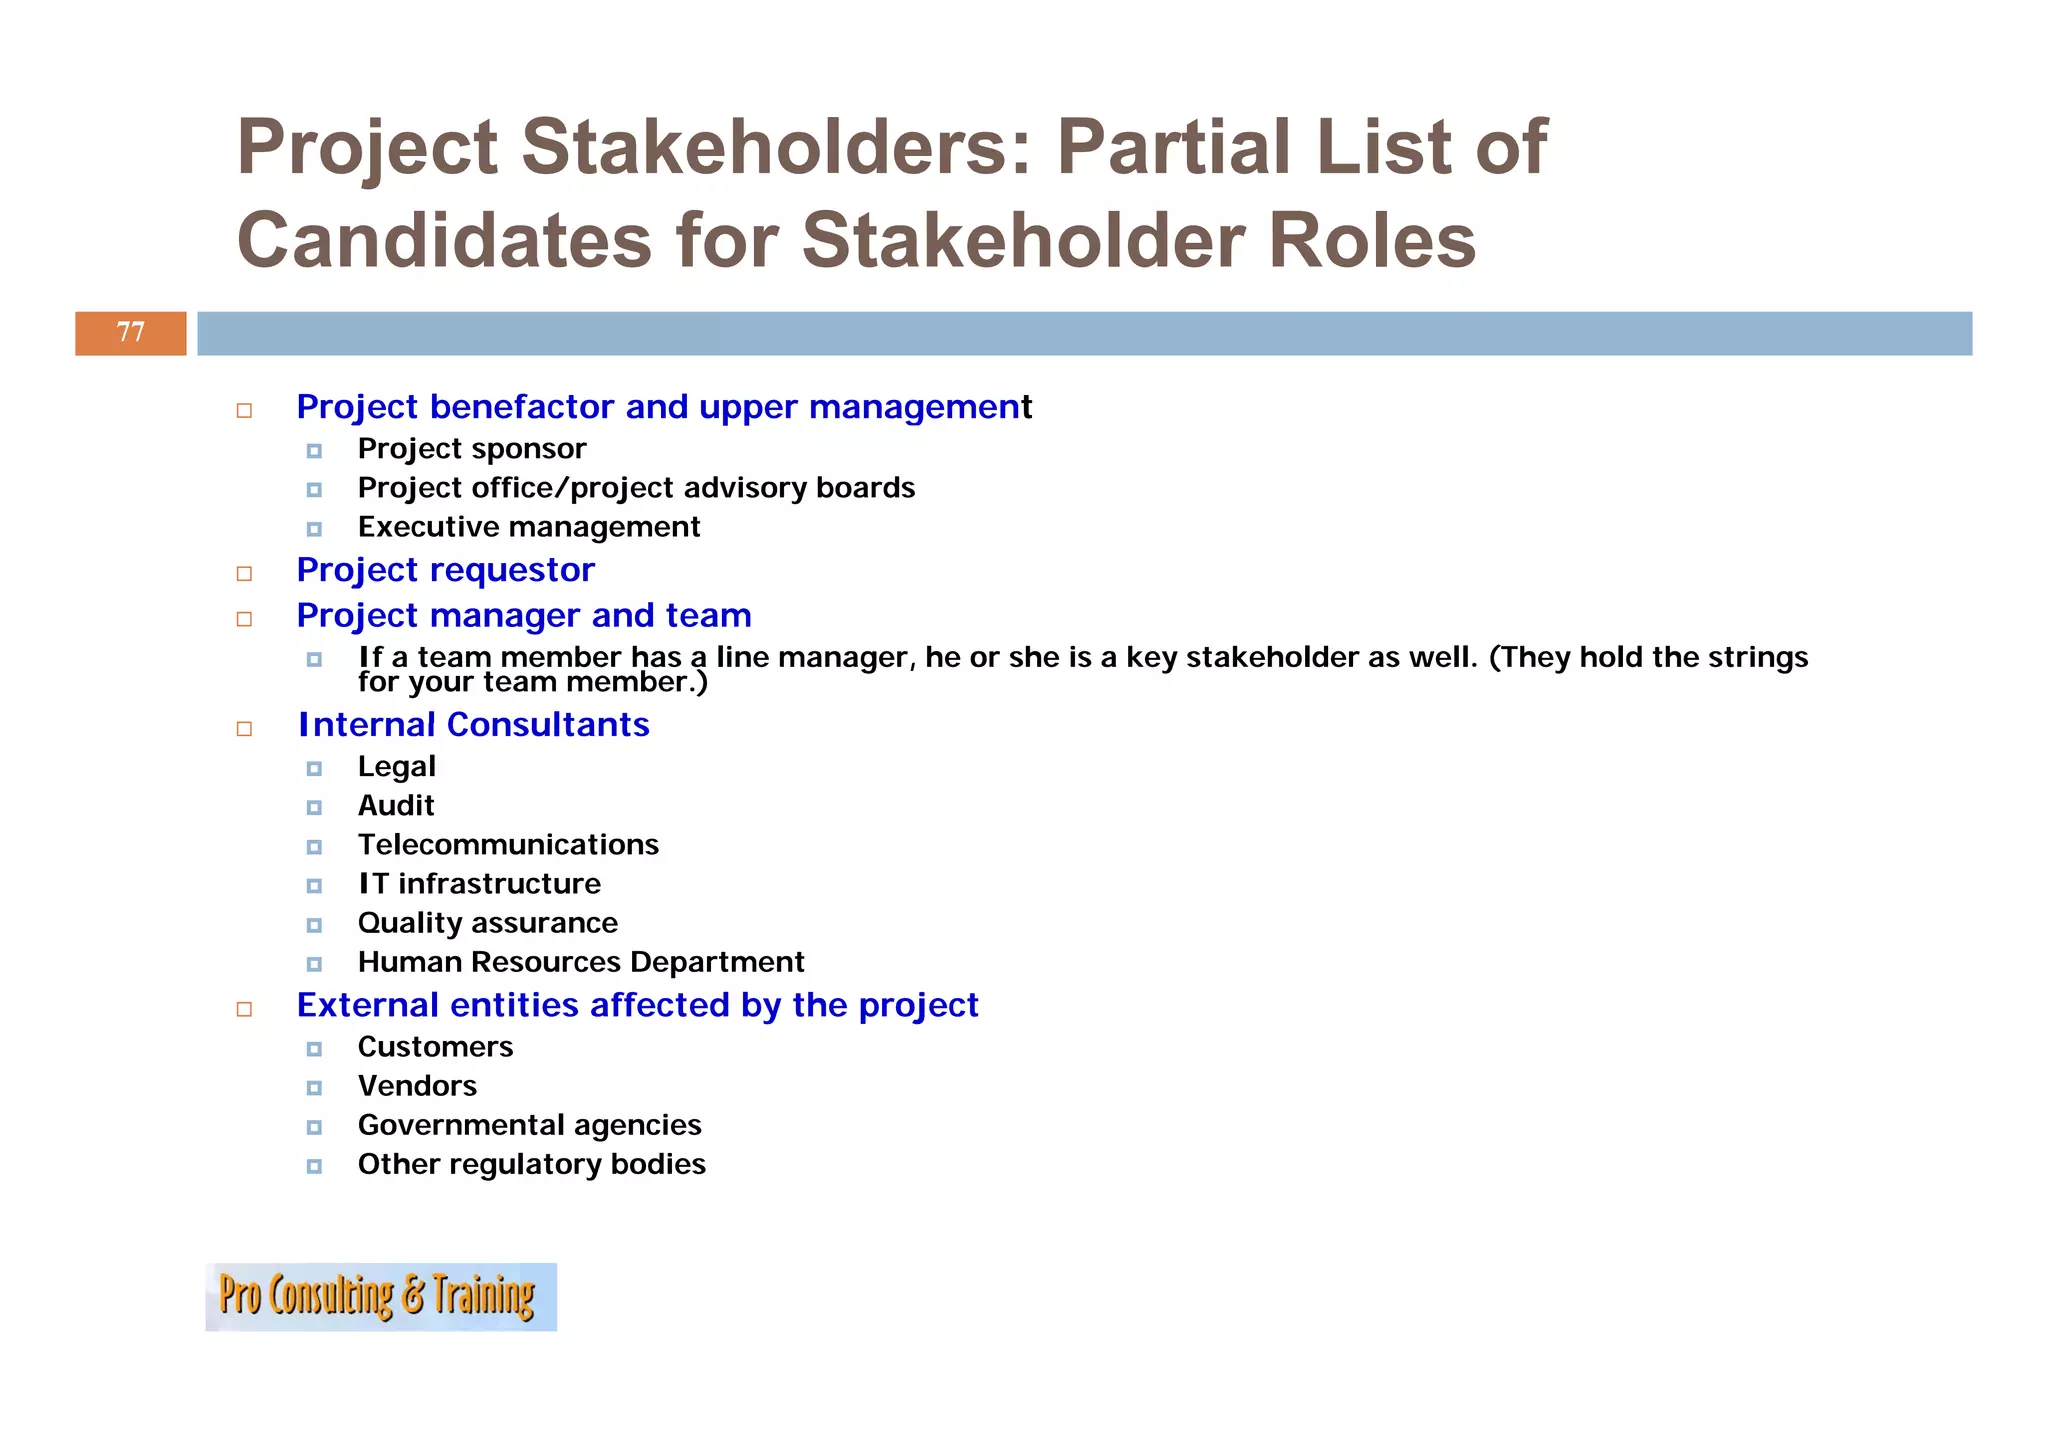
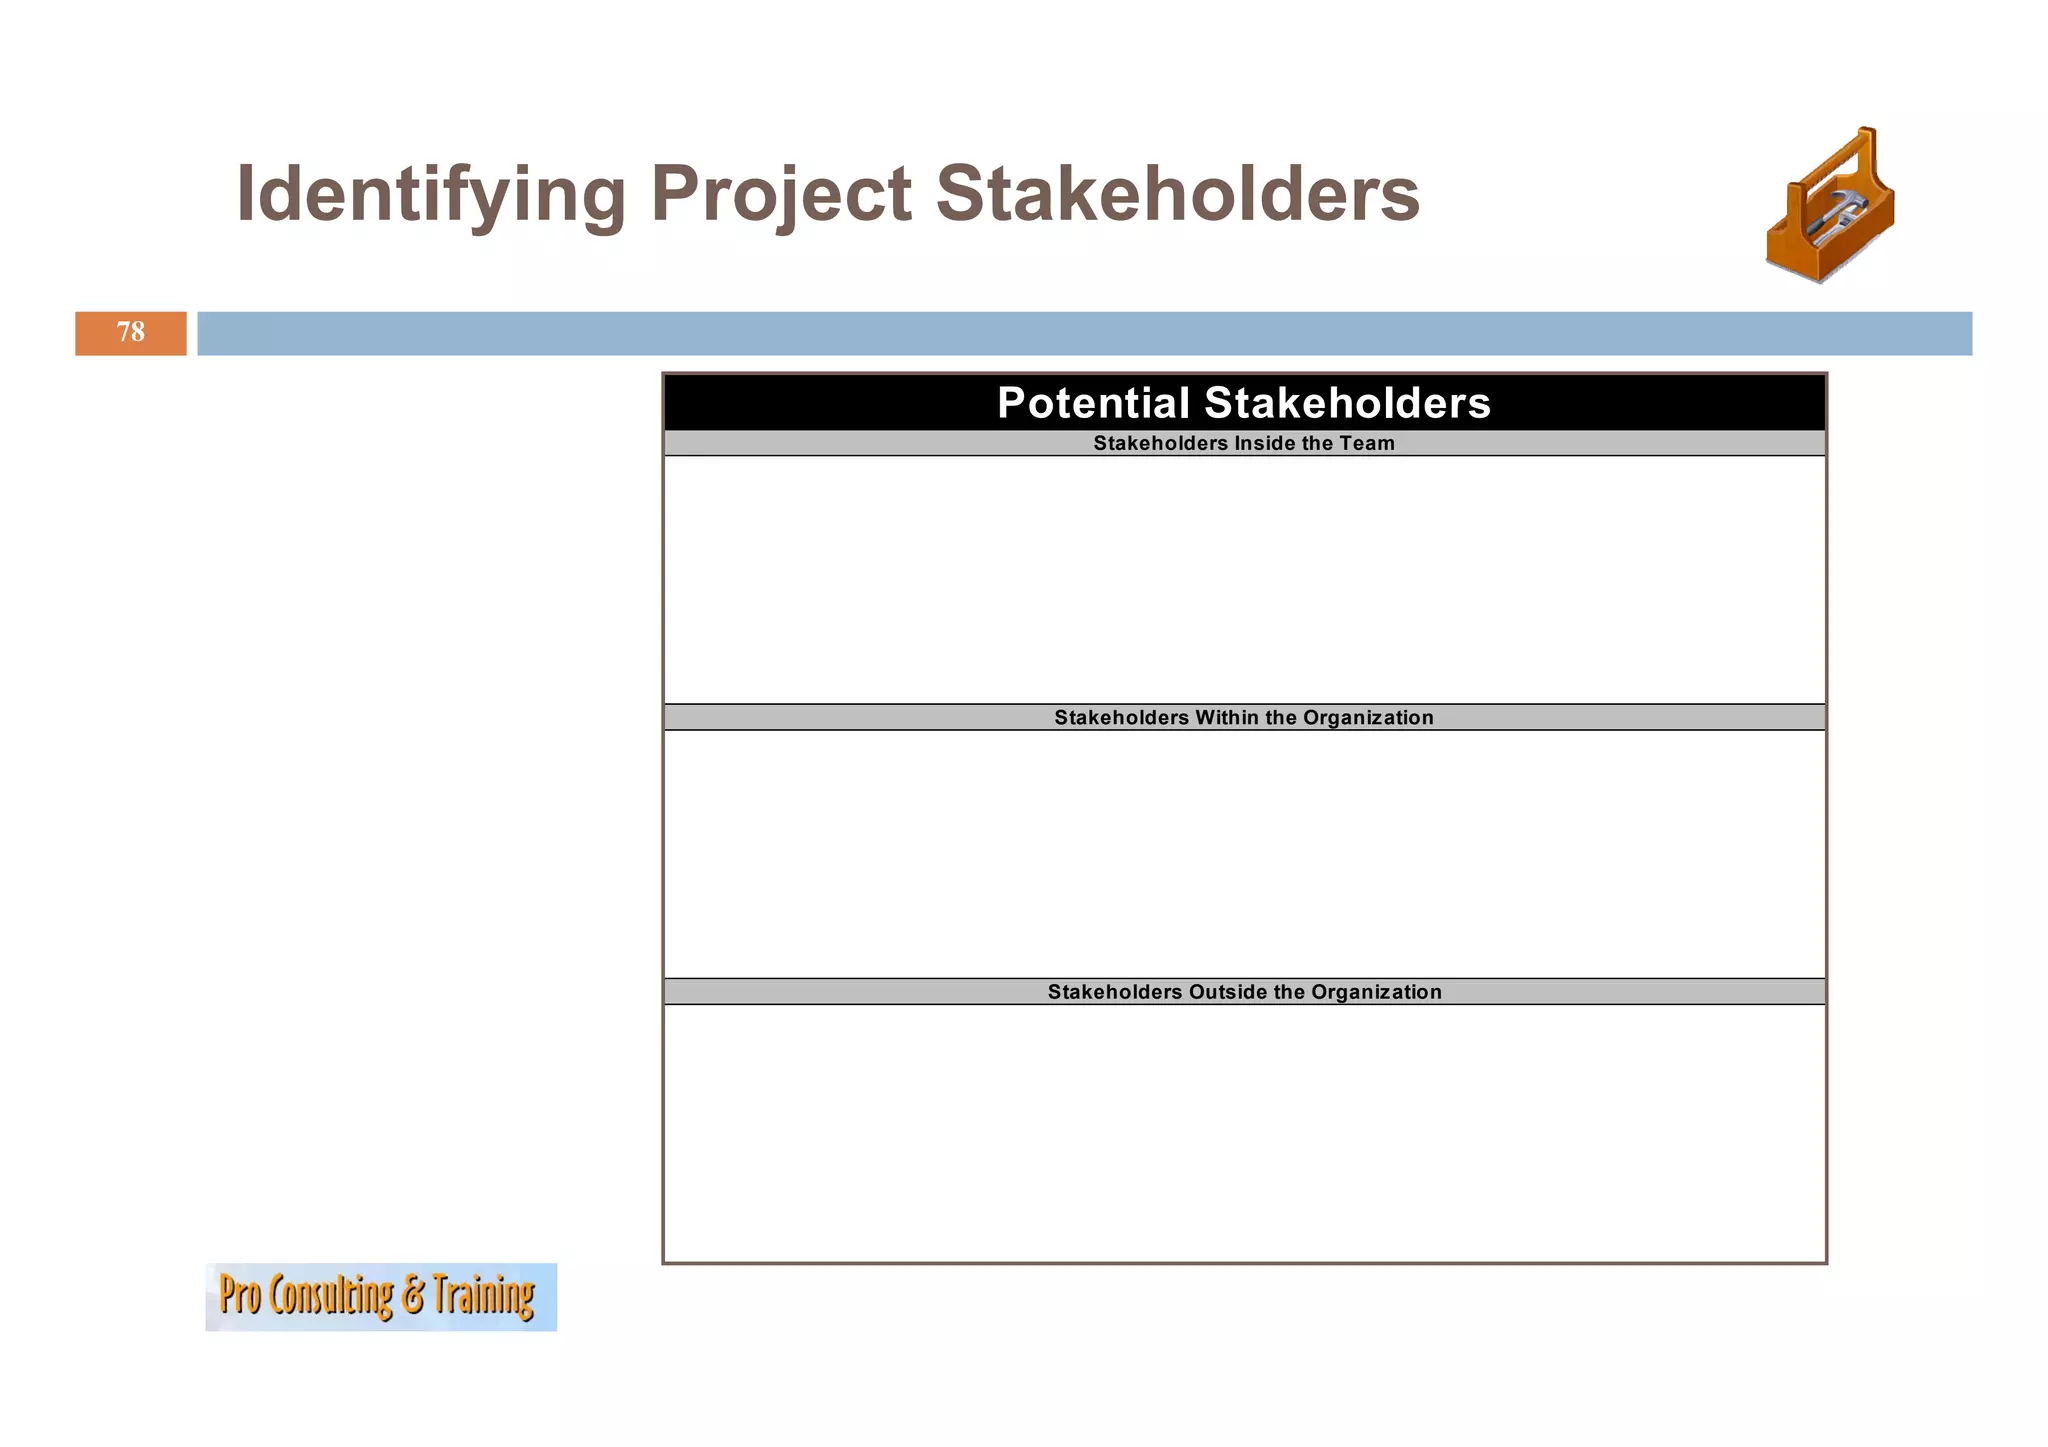
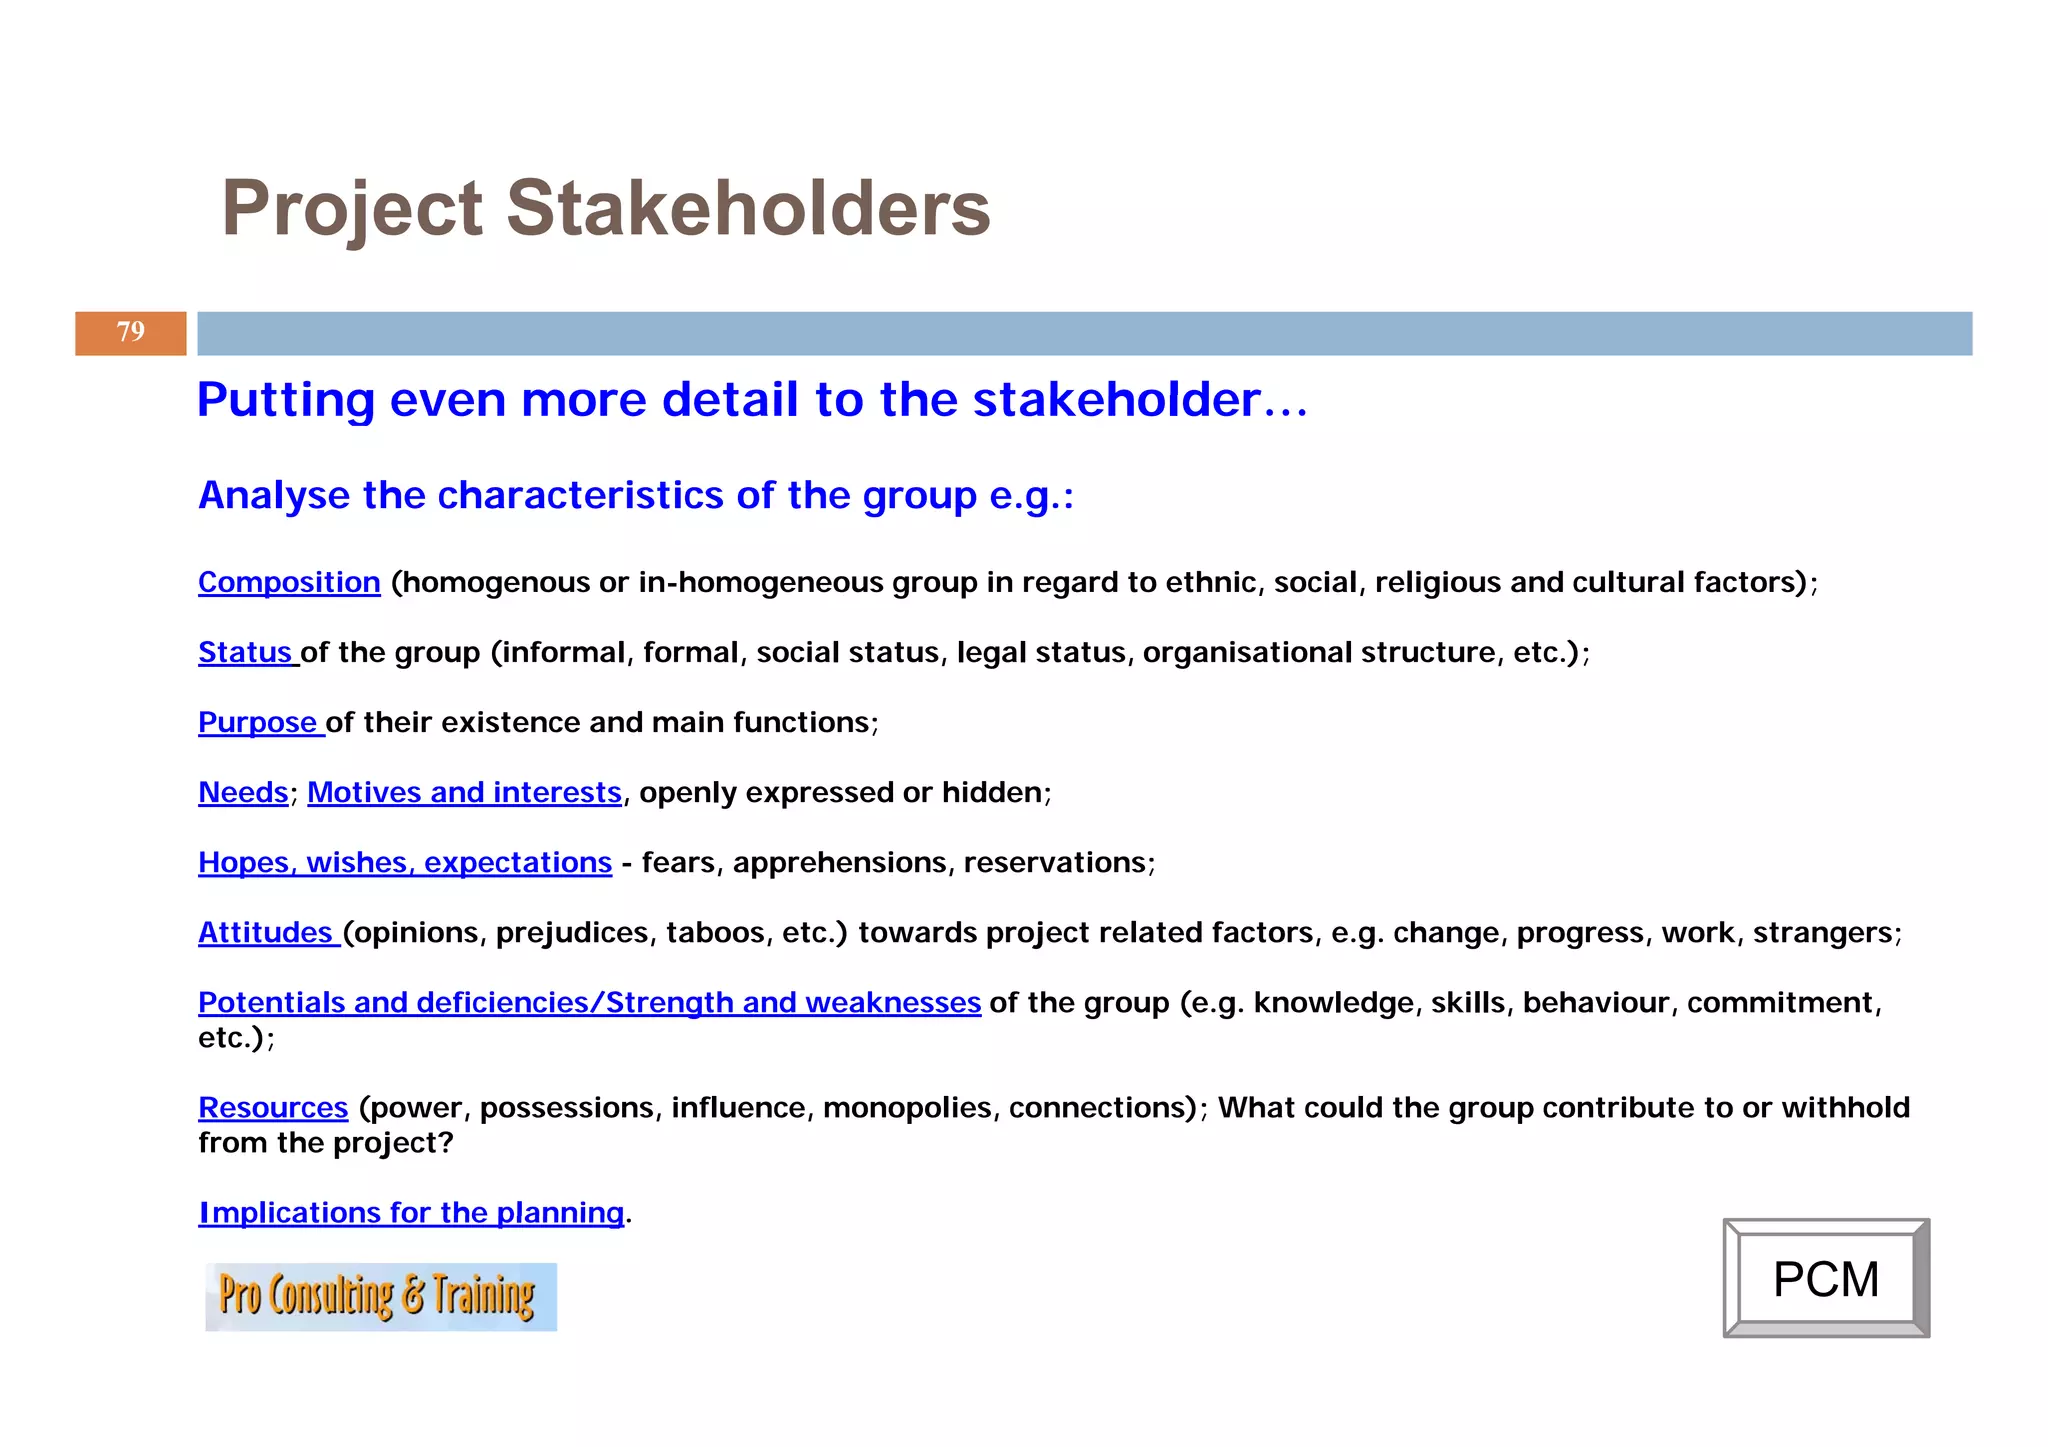
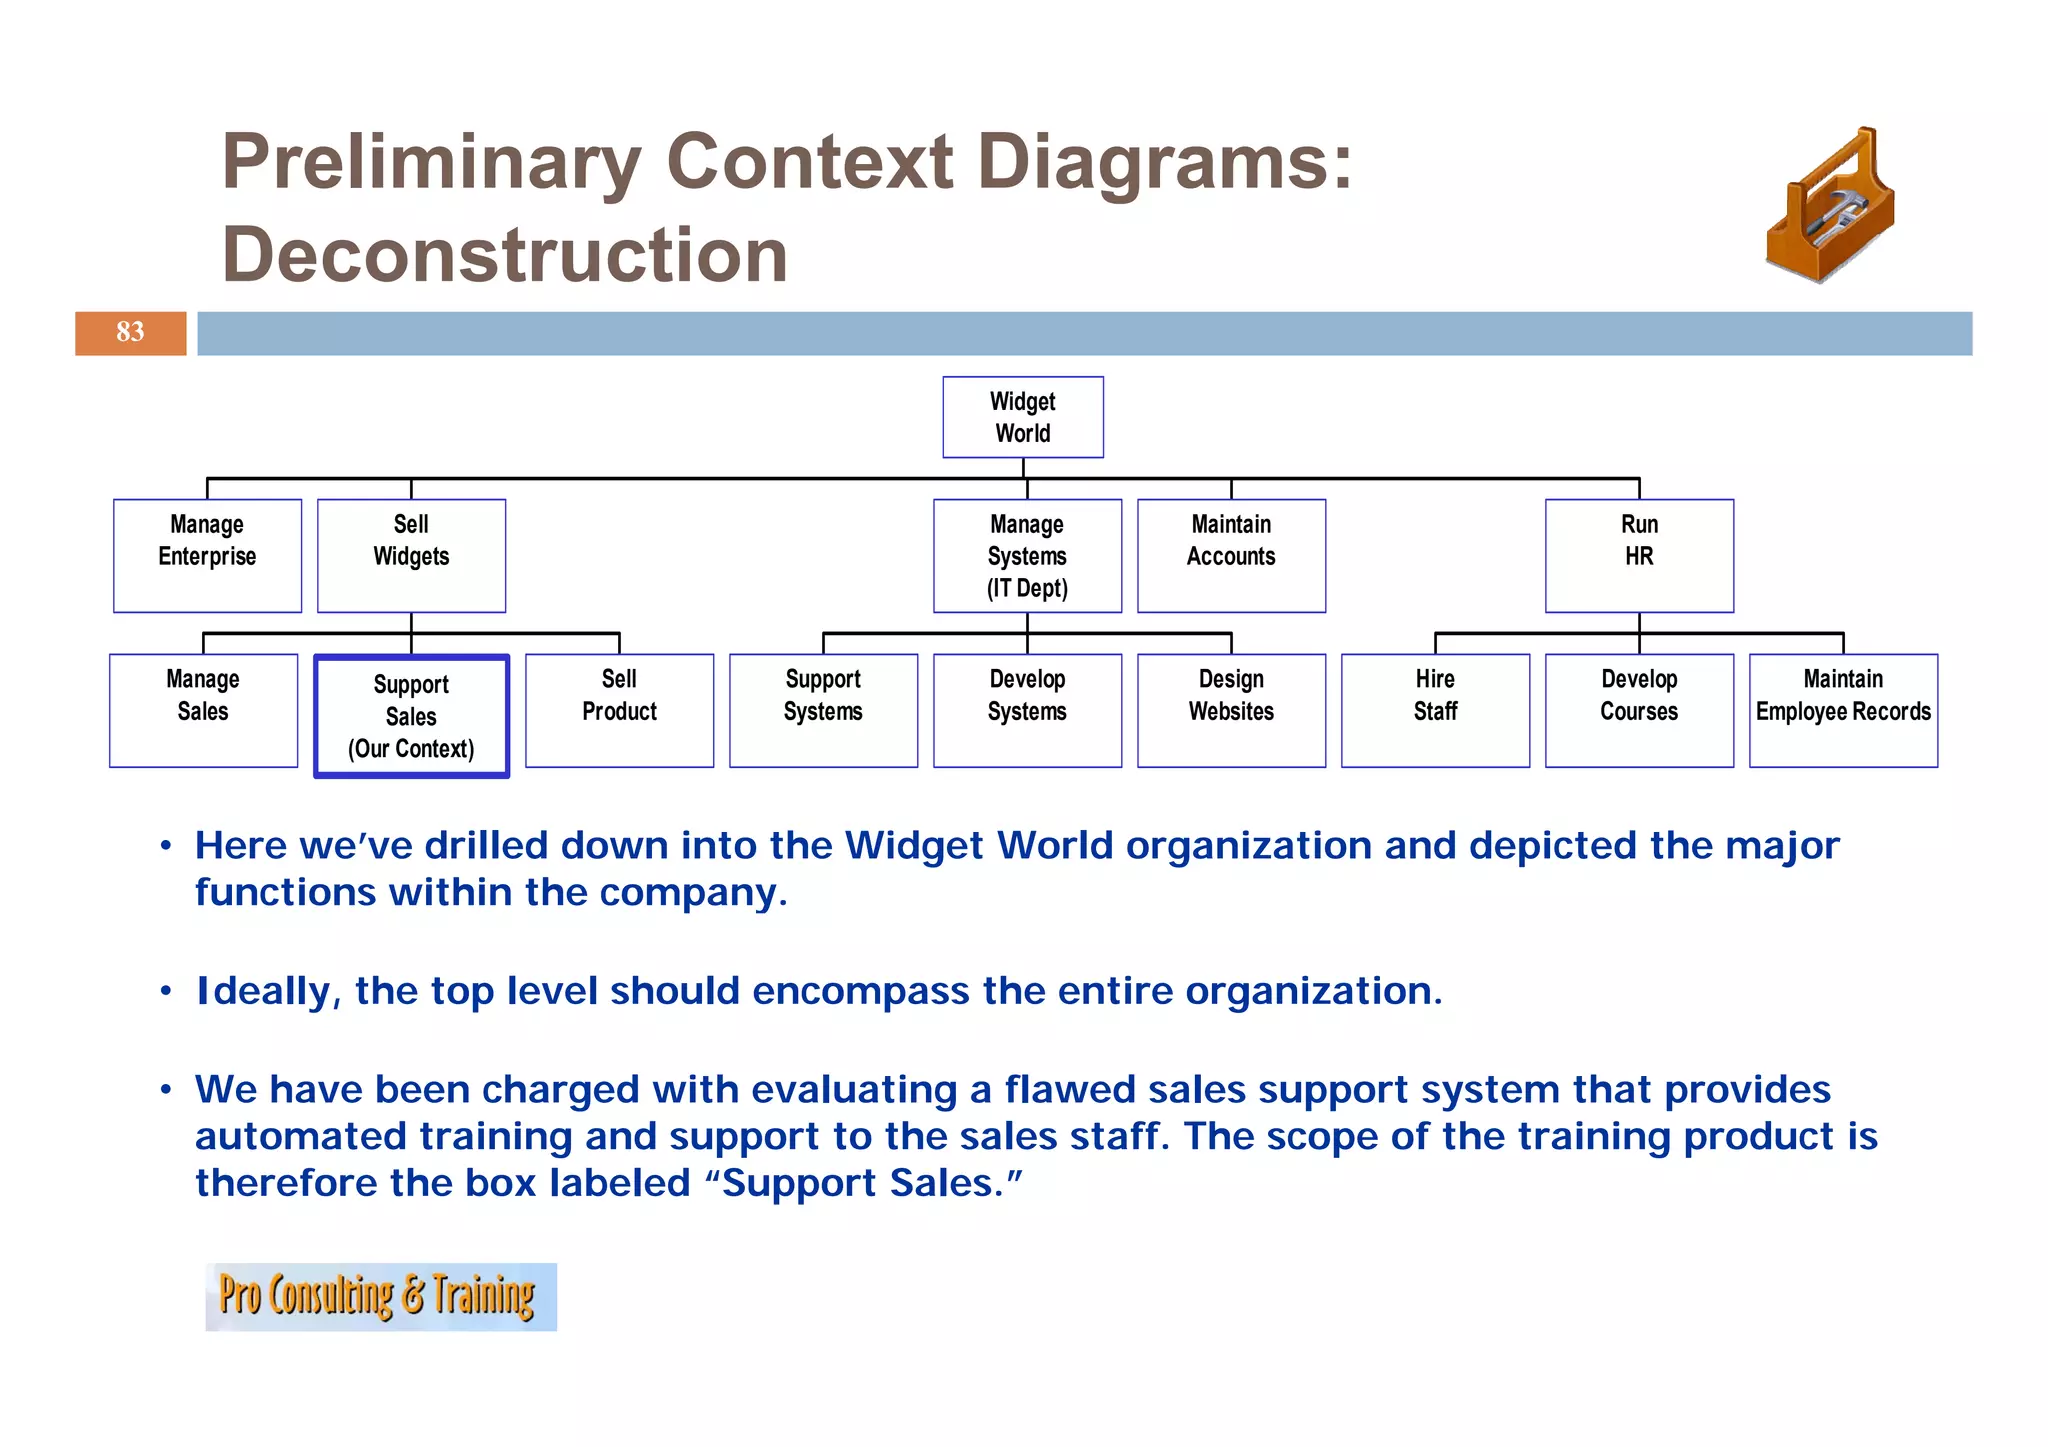
Insight into project environment analysis, stakeholder identification, and factor impact assessment.
Insight into project environment analysis, stakeholder identification, and factor impact assessment.
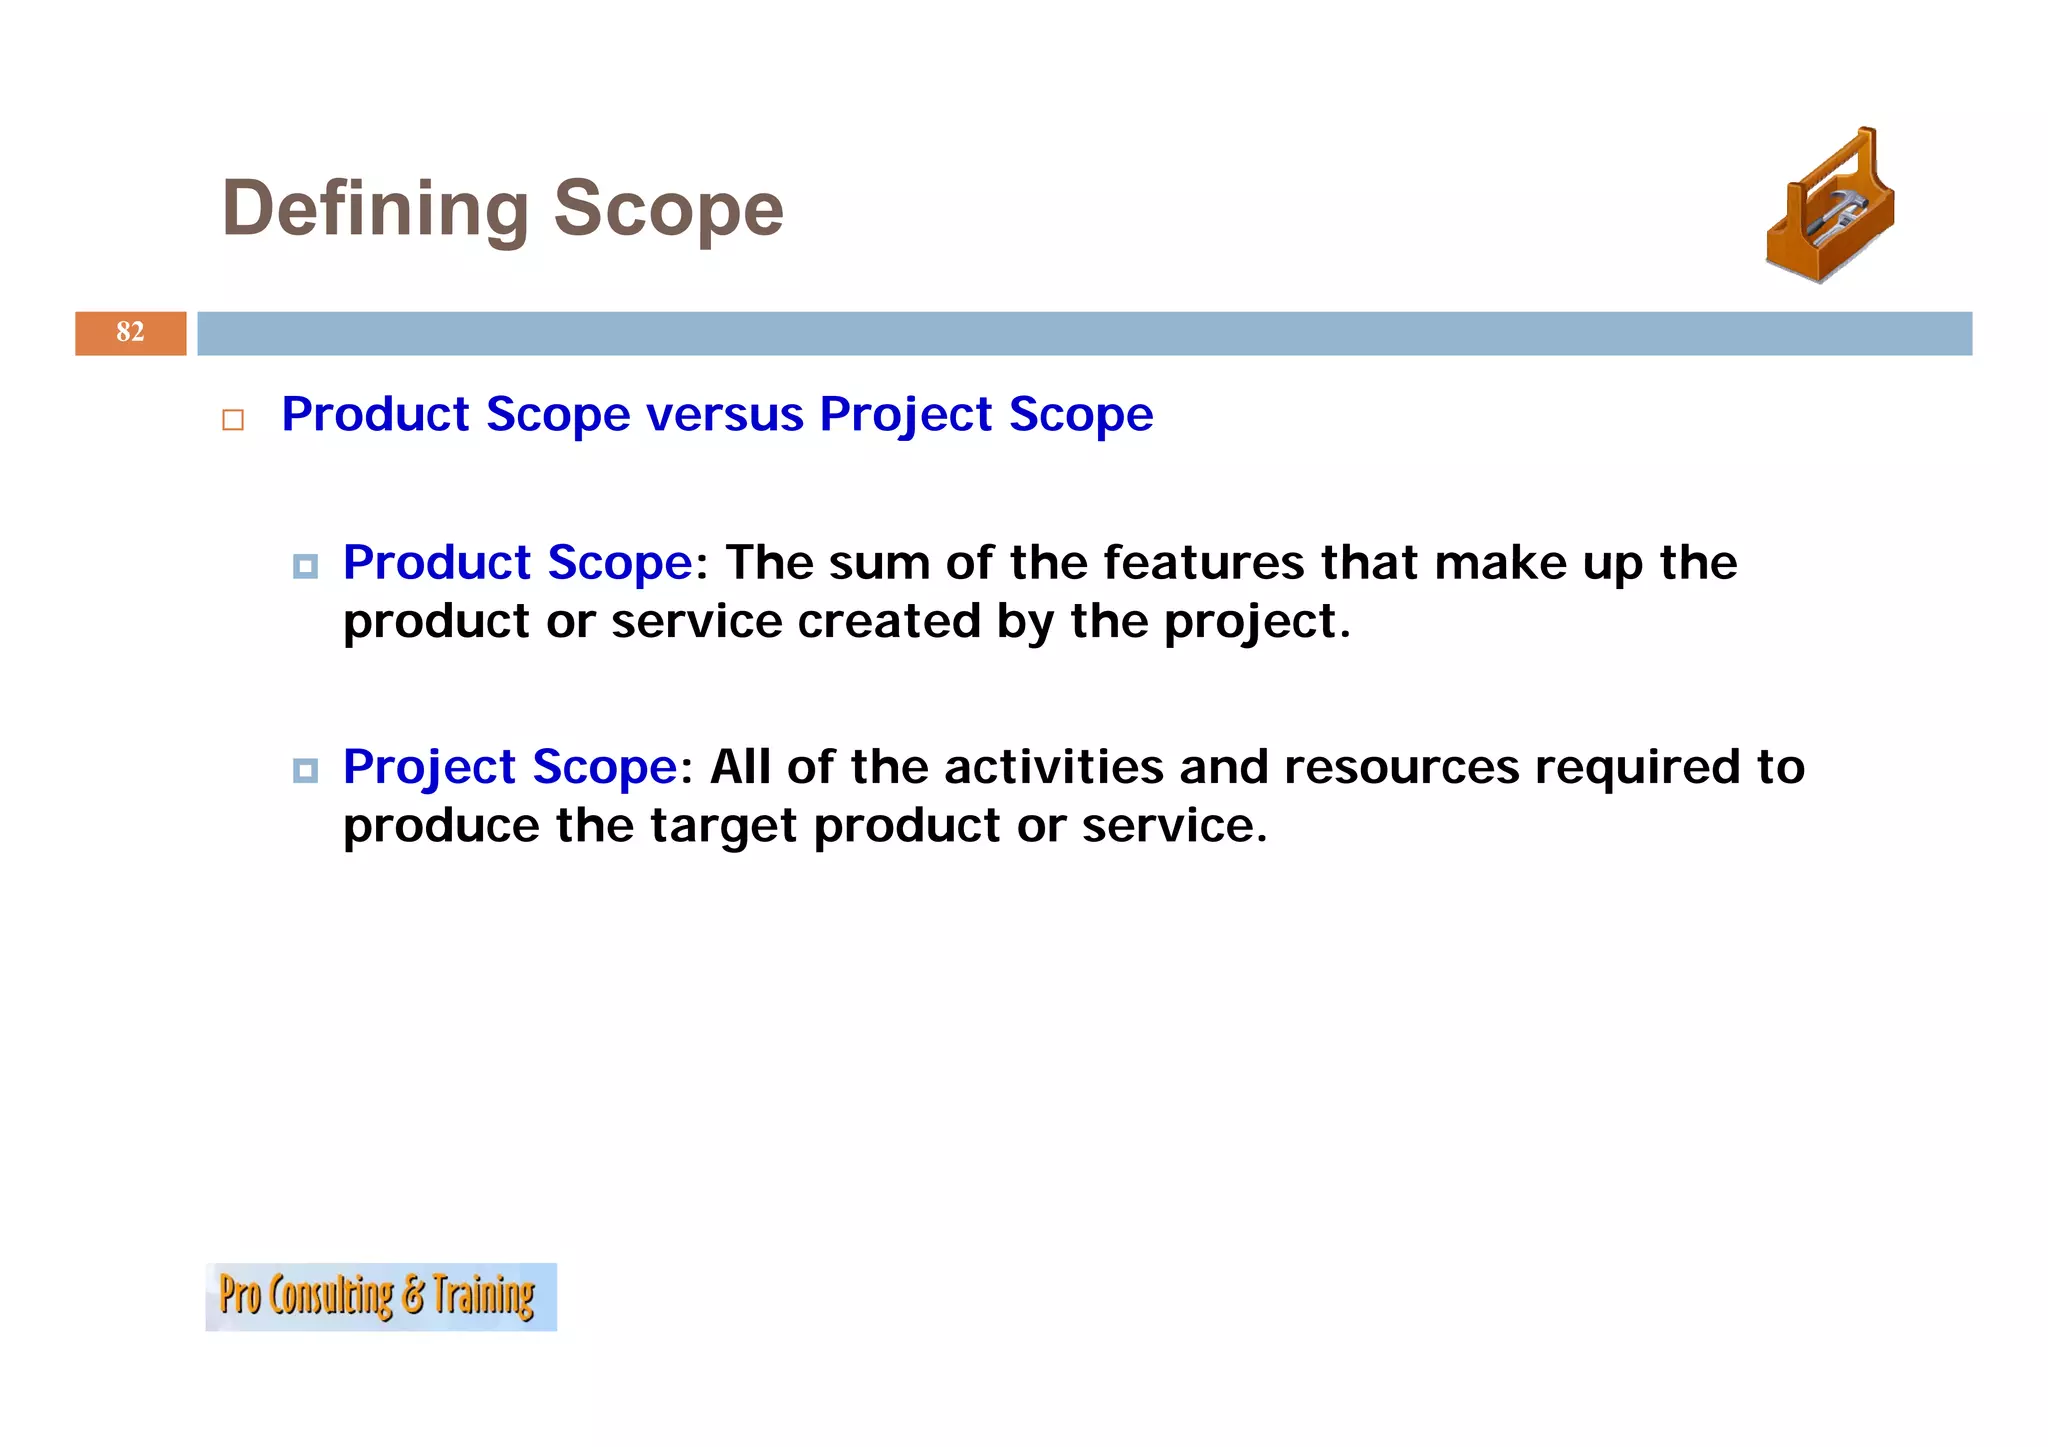
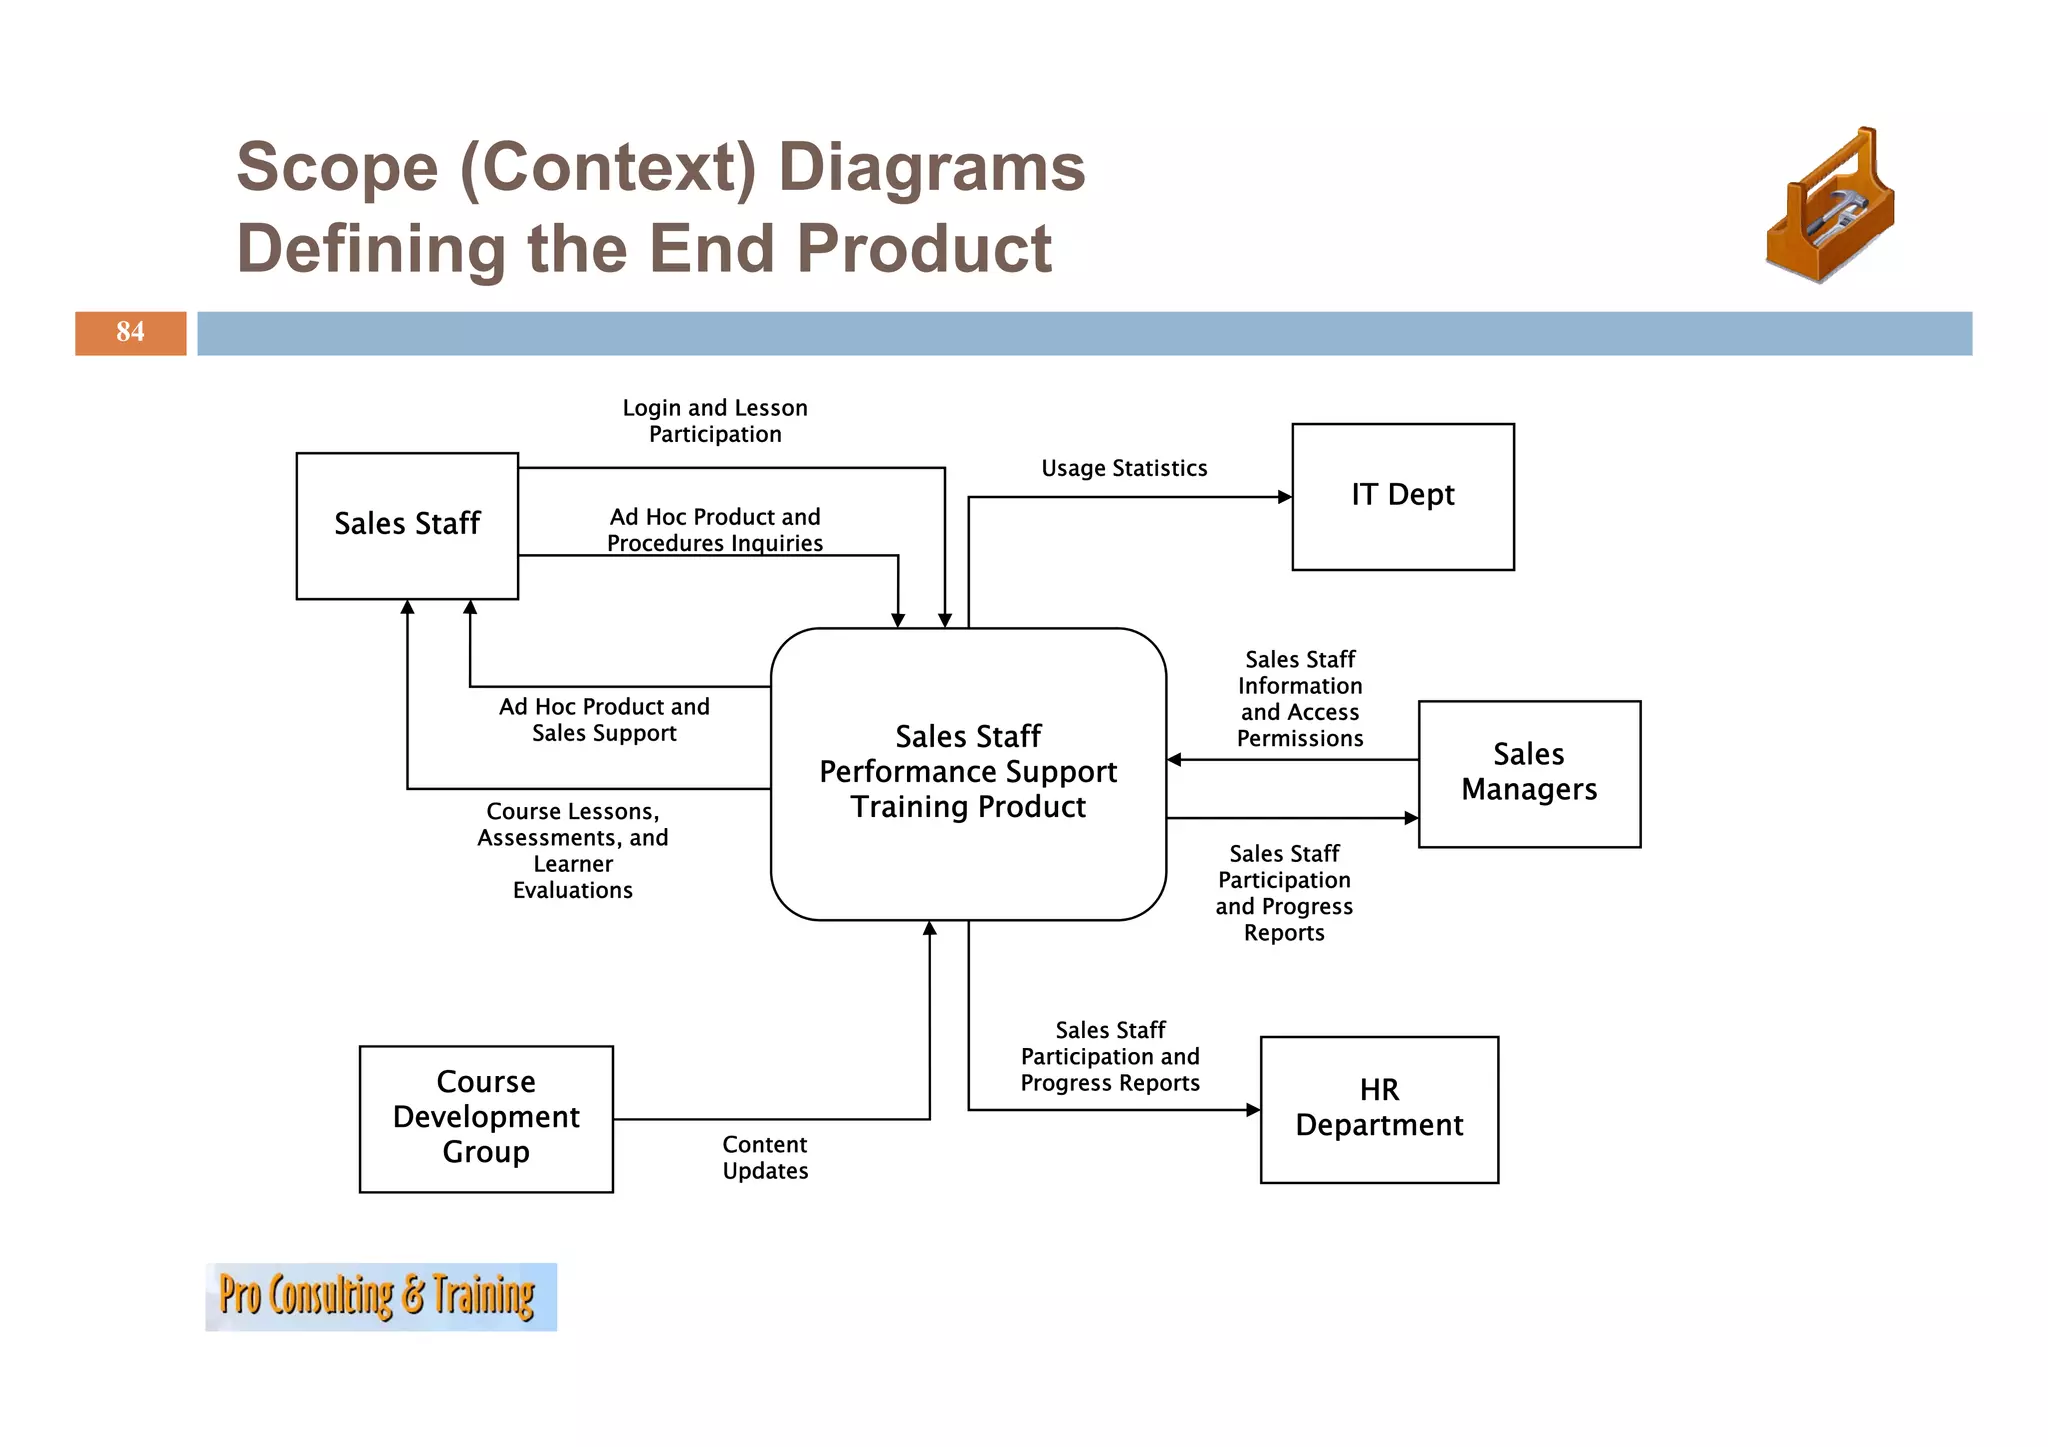
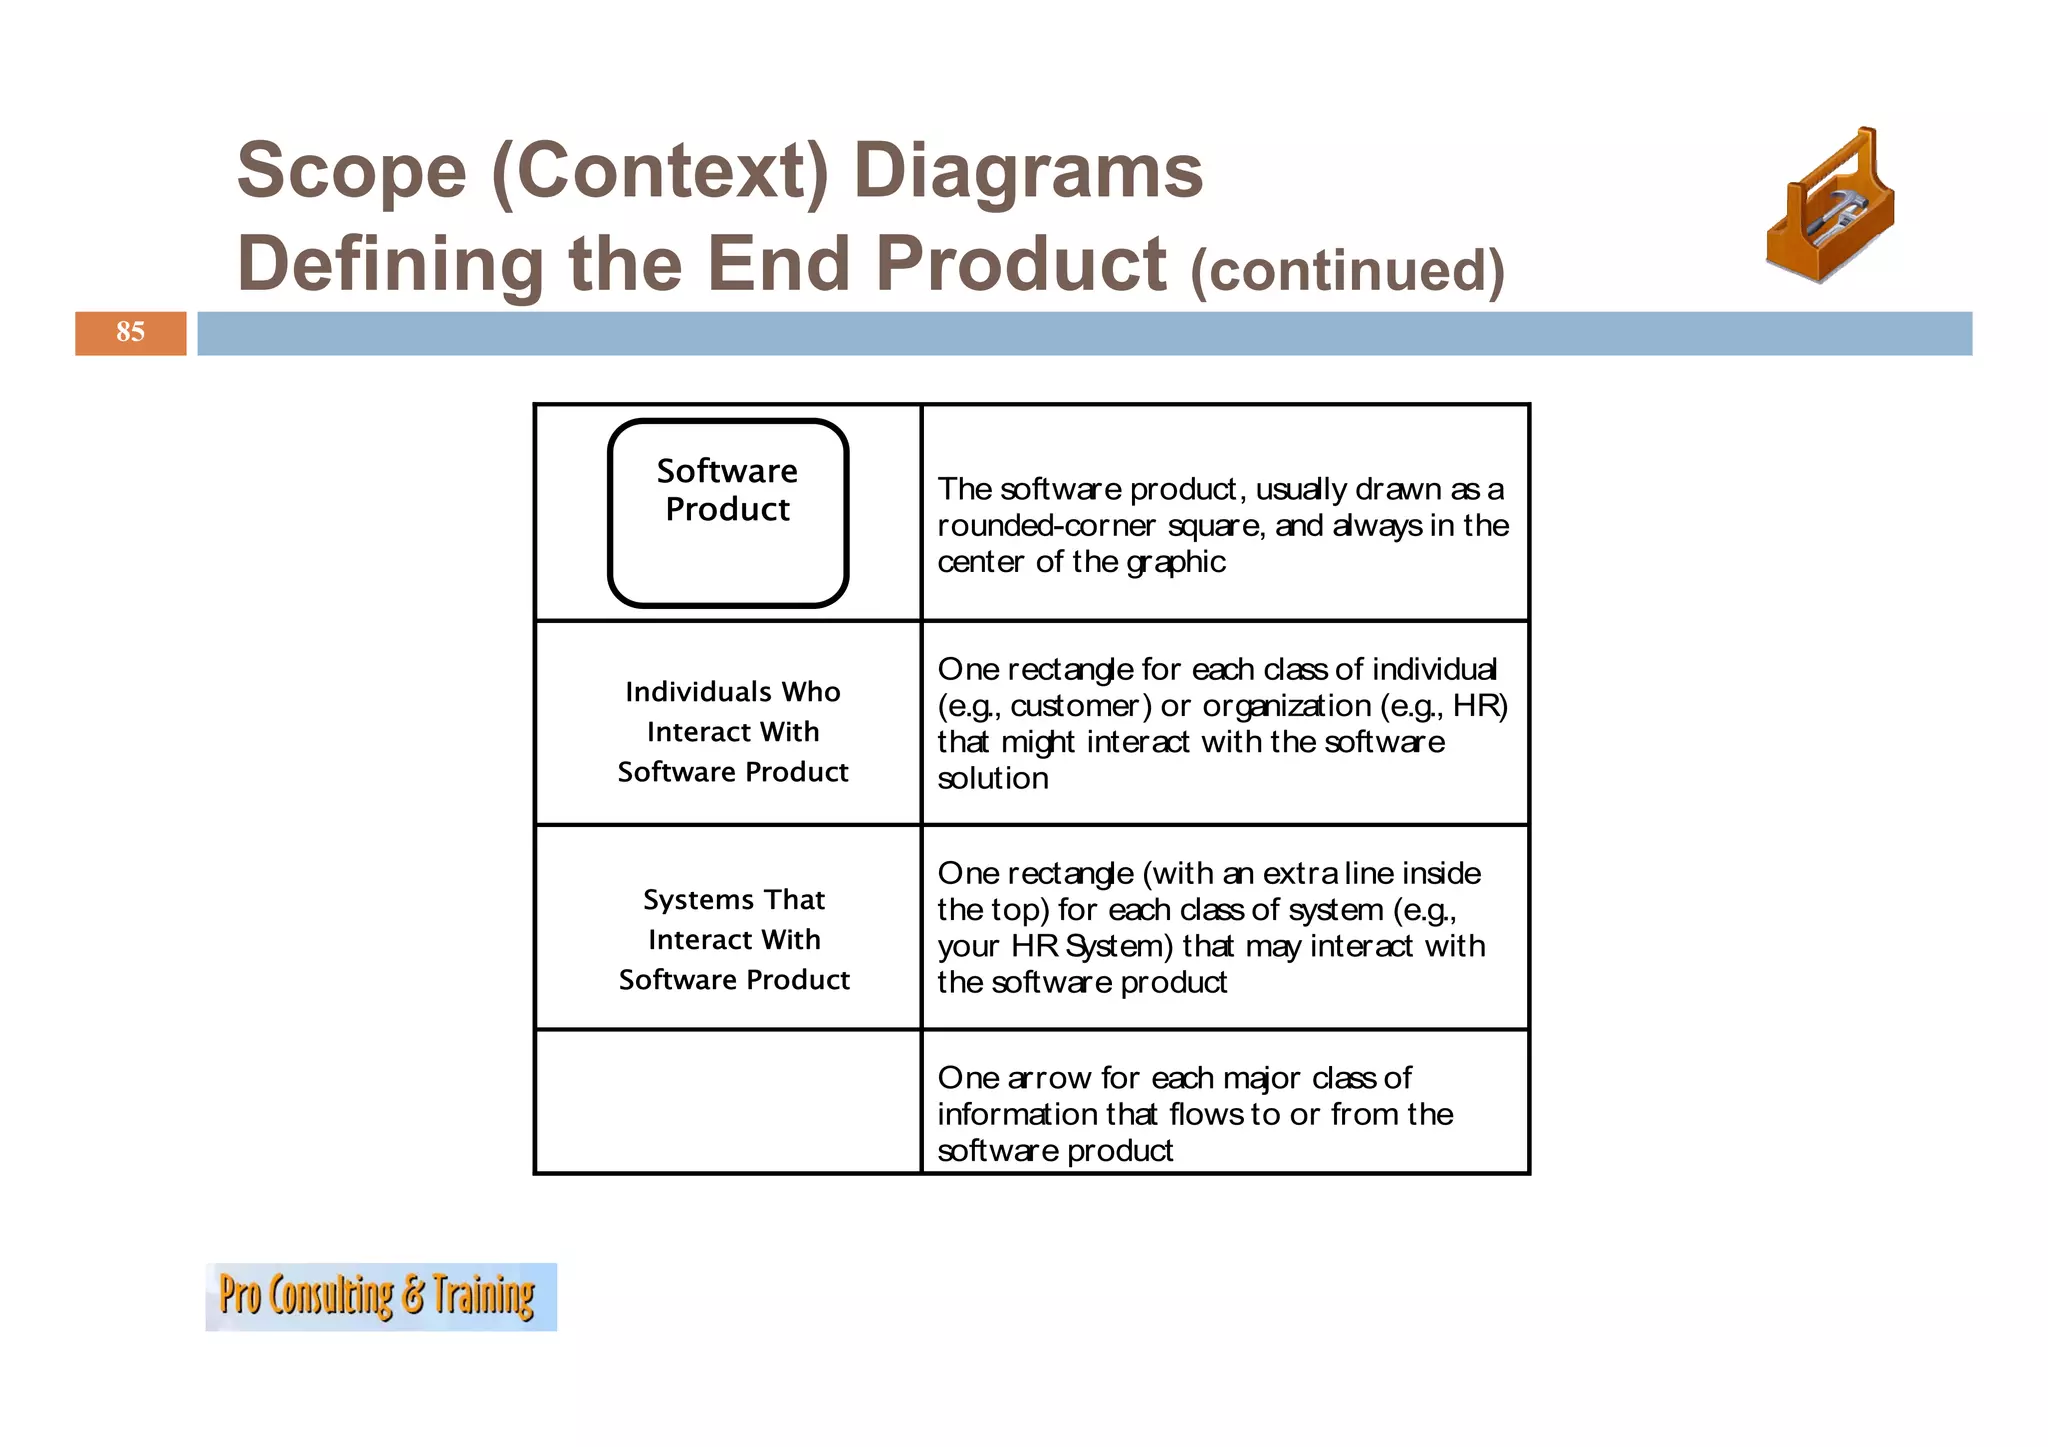
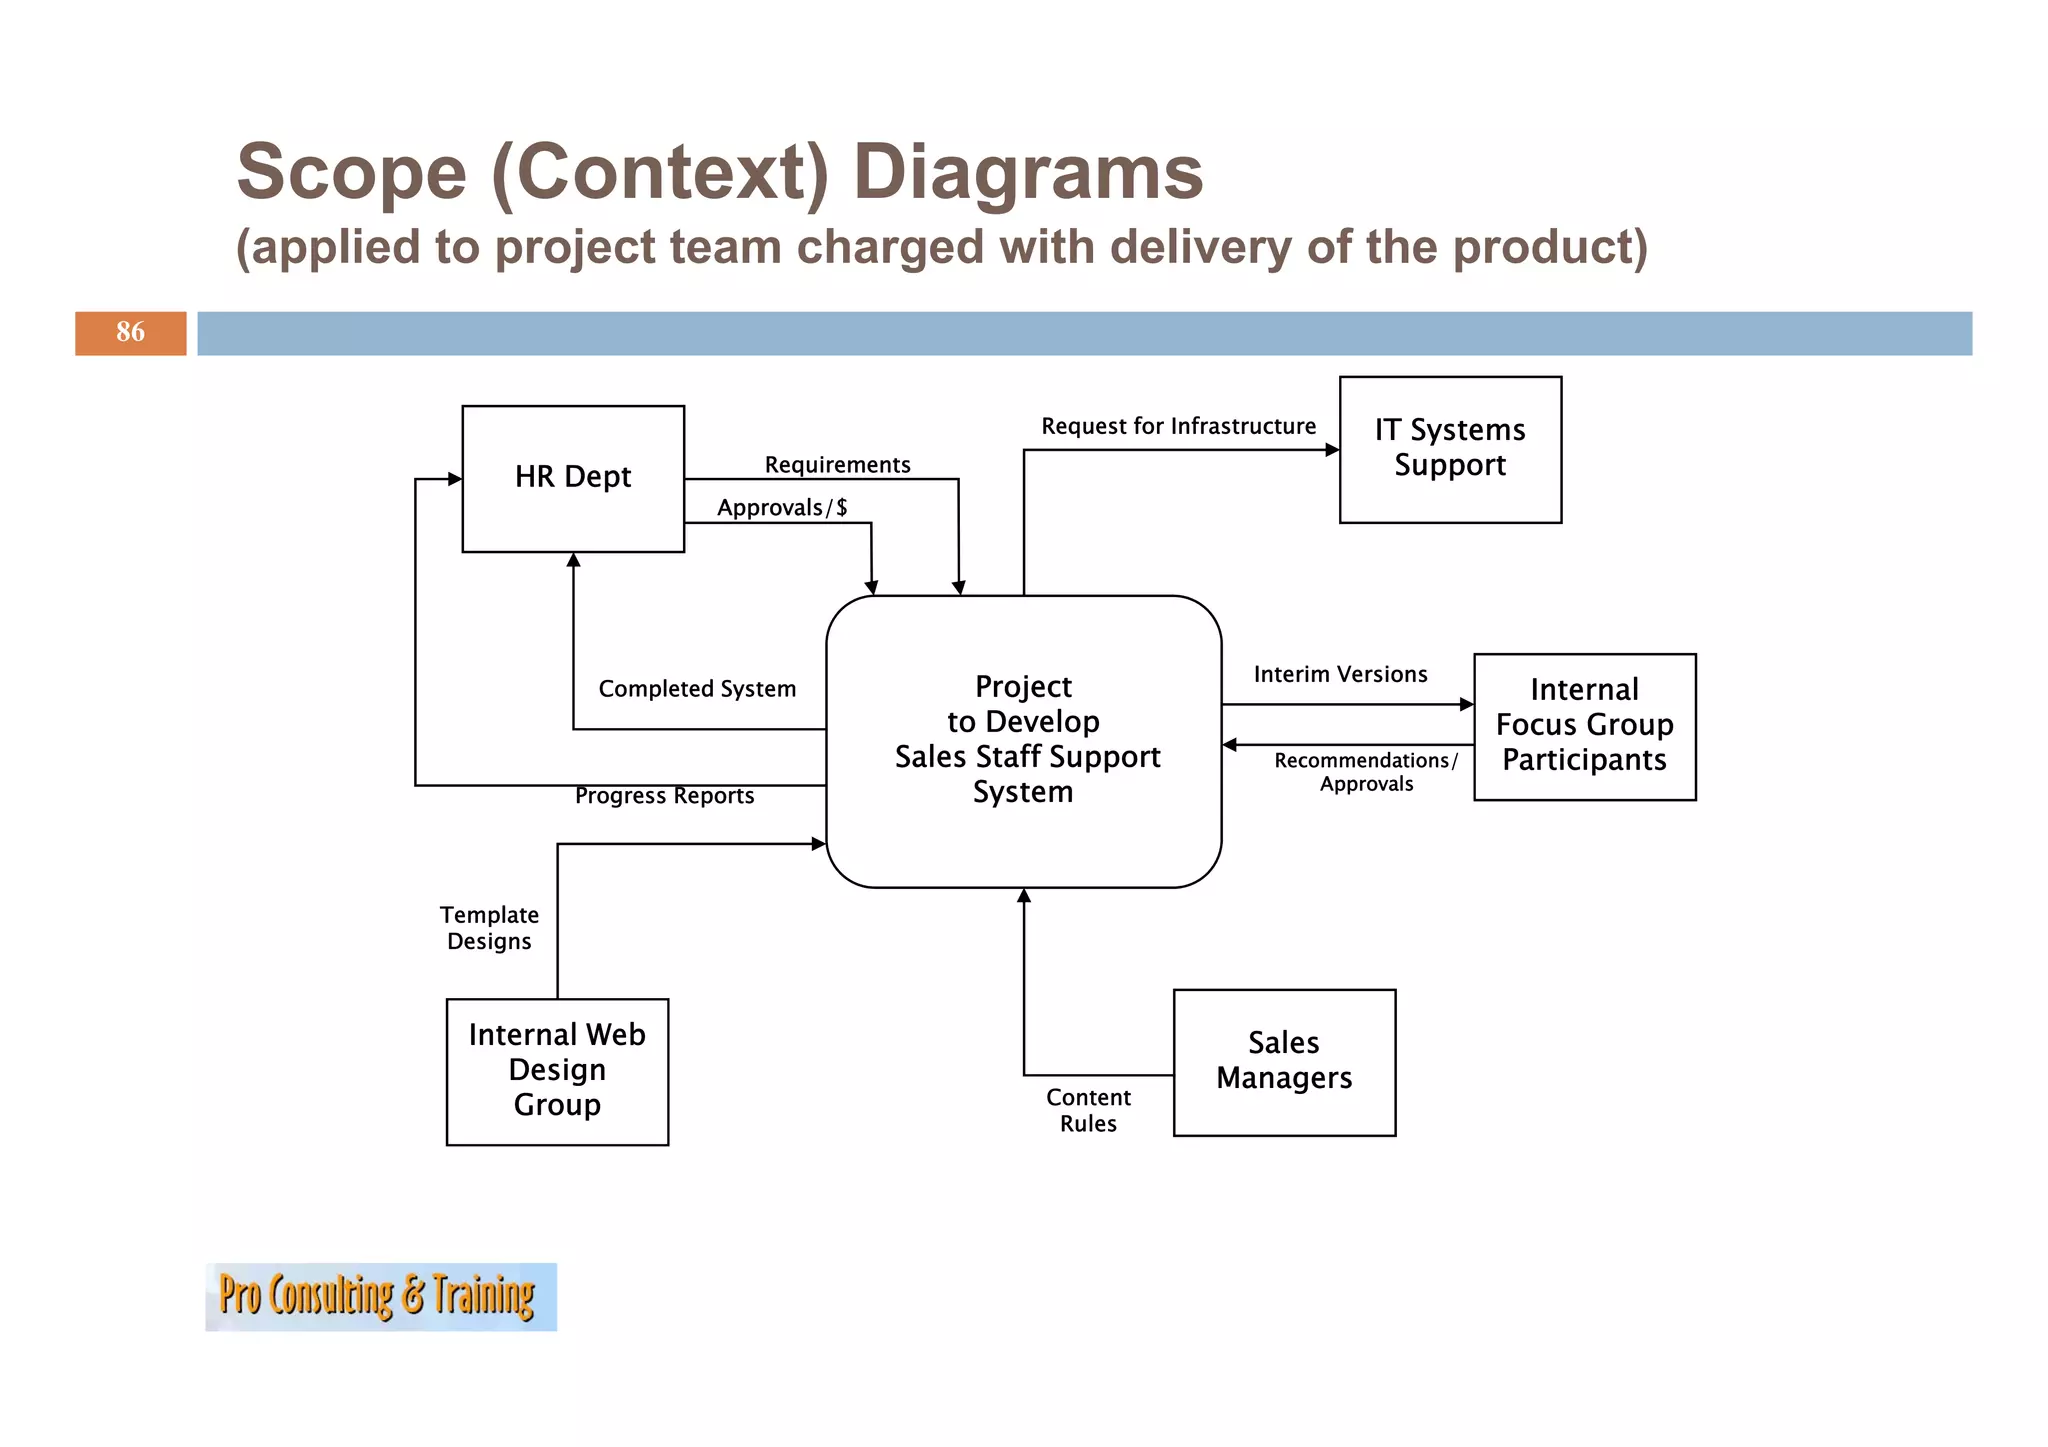
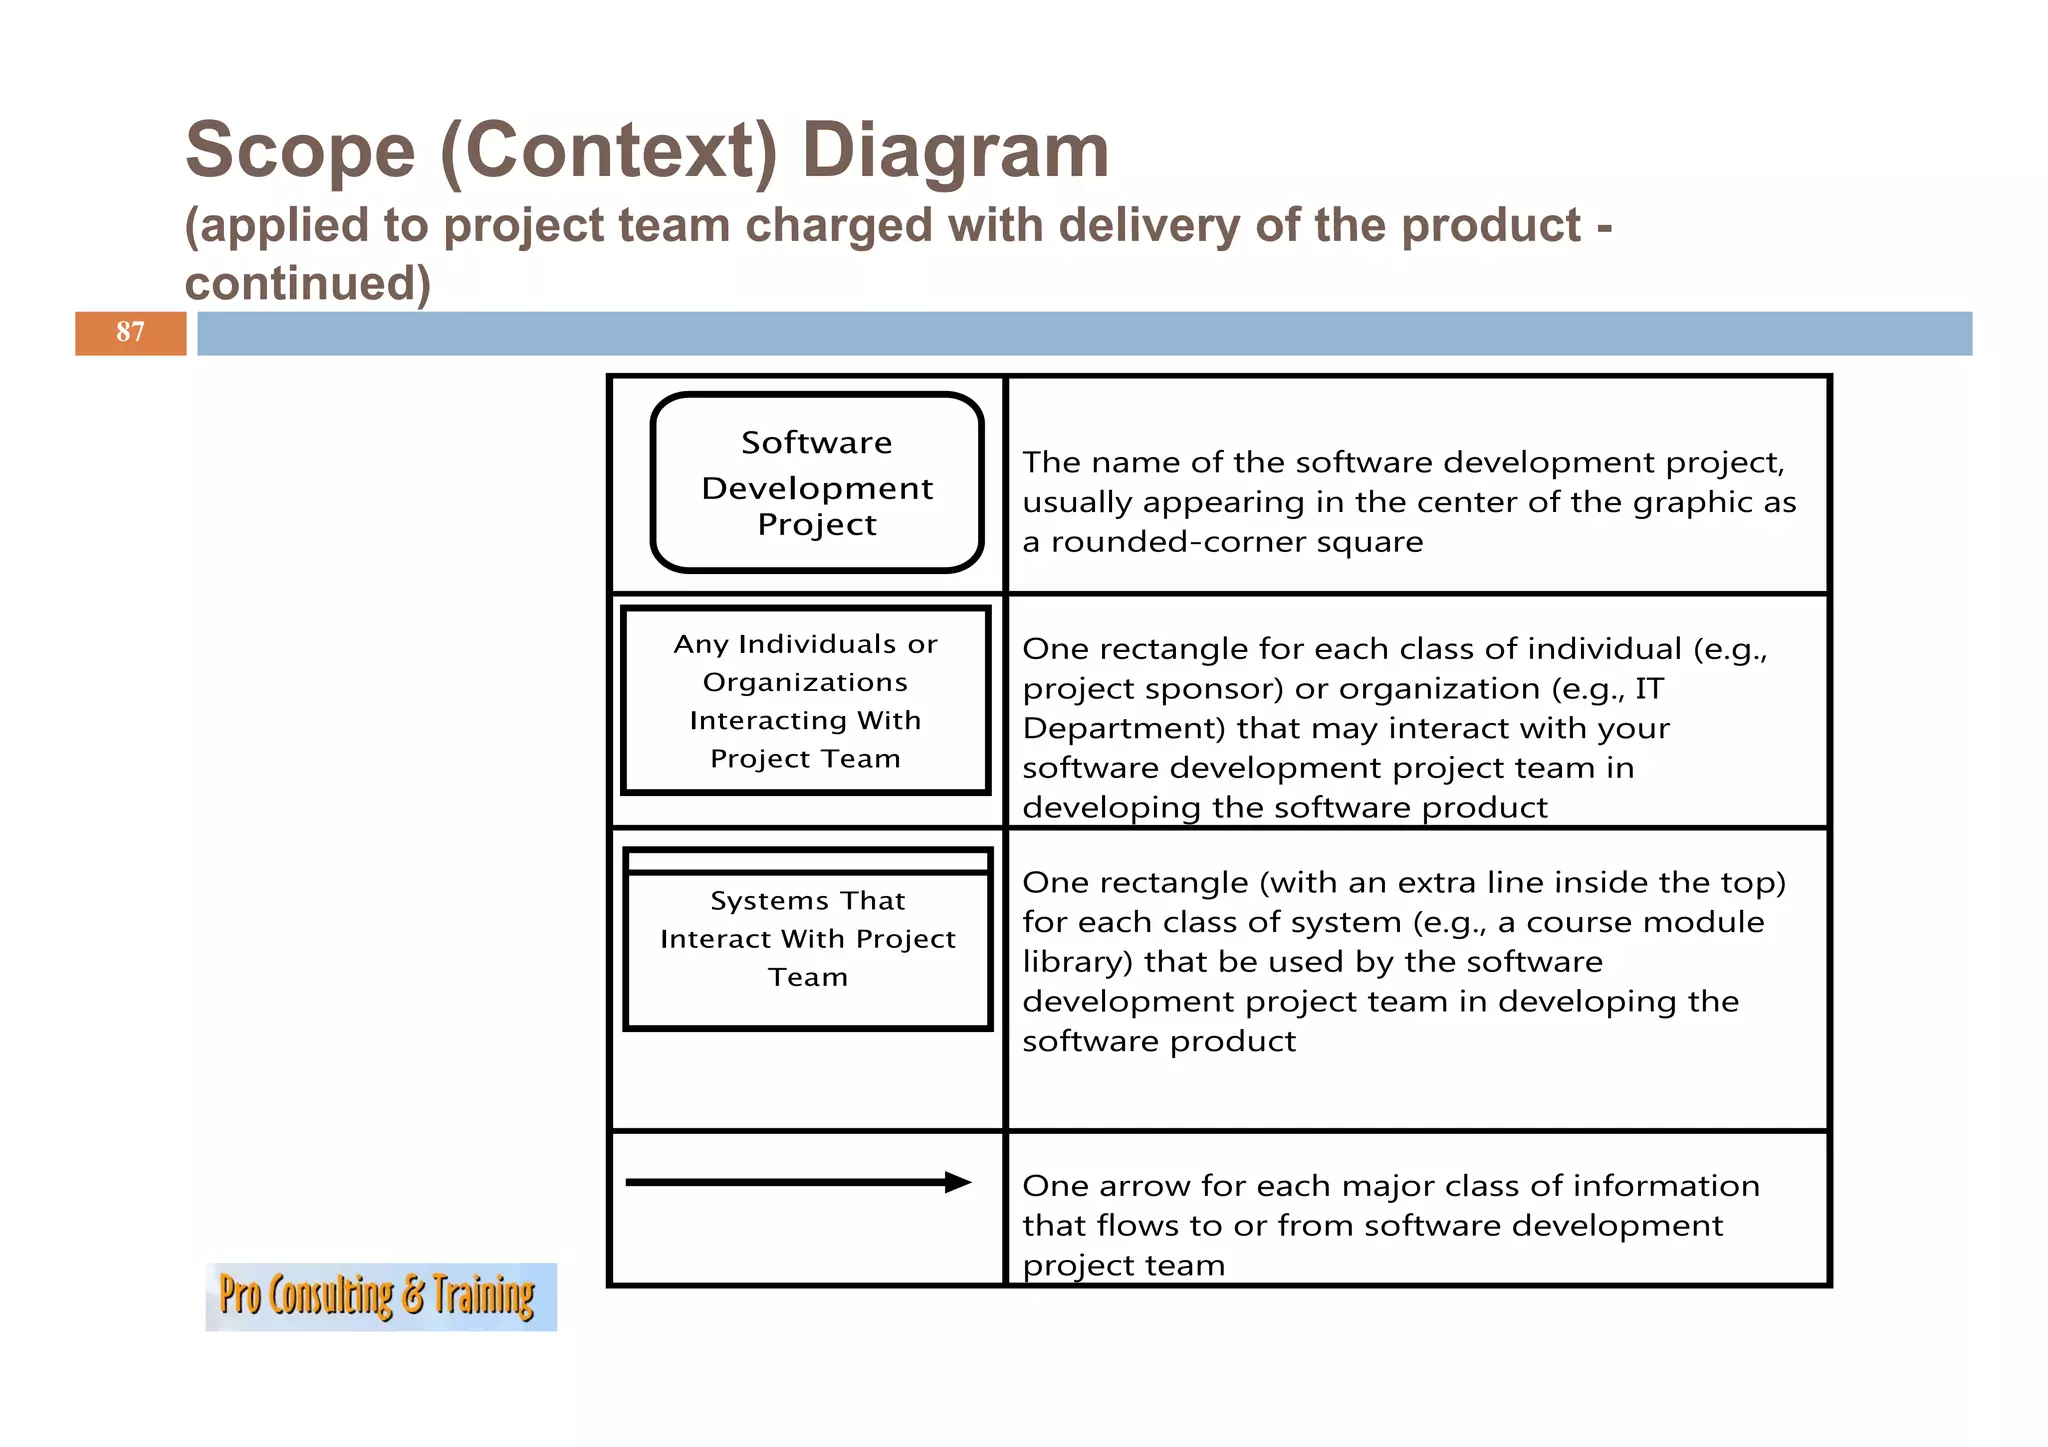
Focus on defining product and project scope, highlighting the importance of clear objectives.
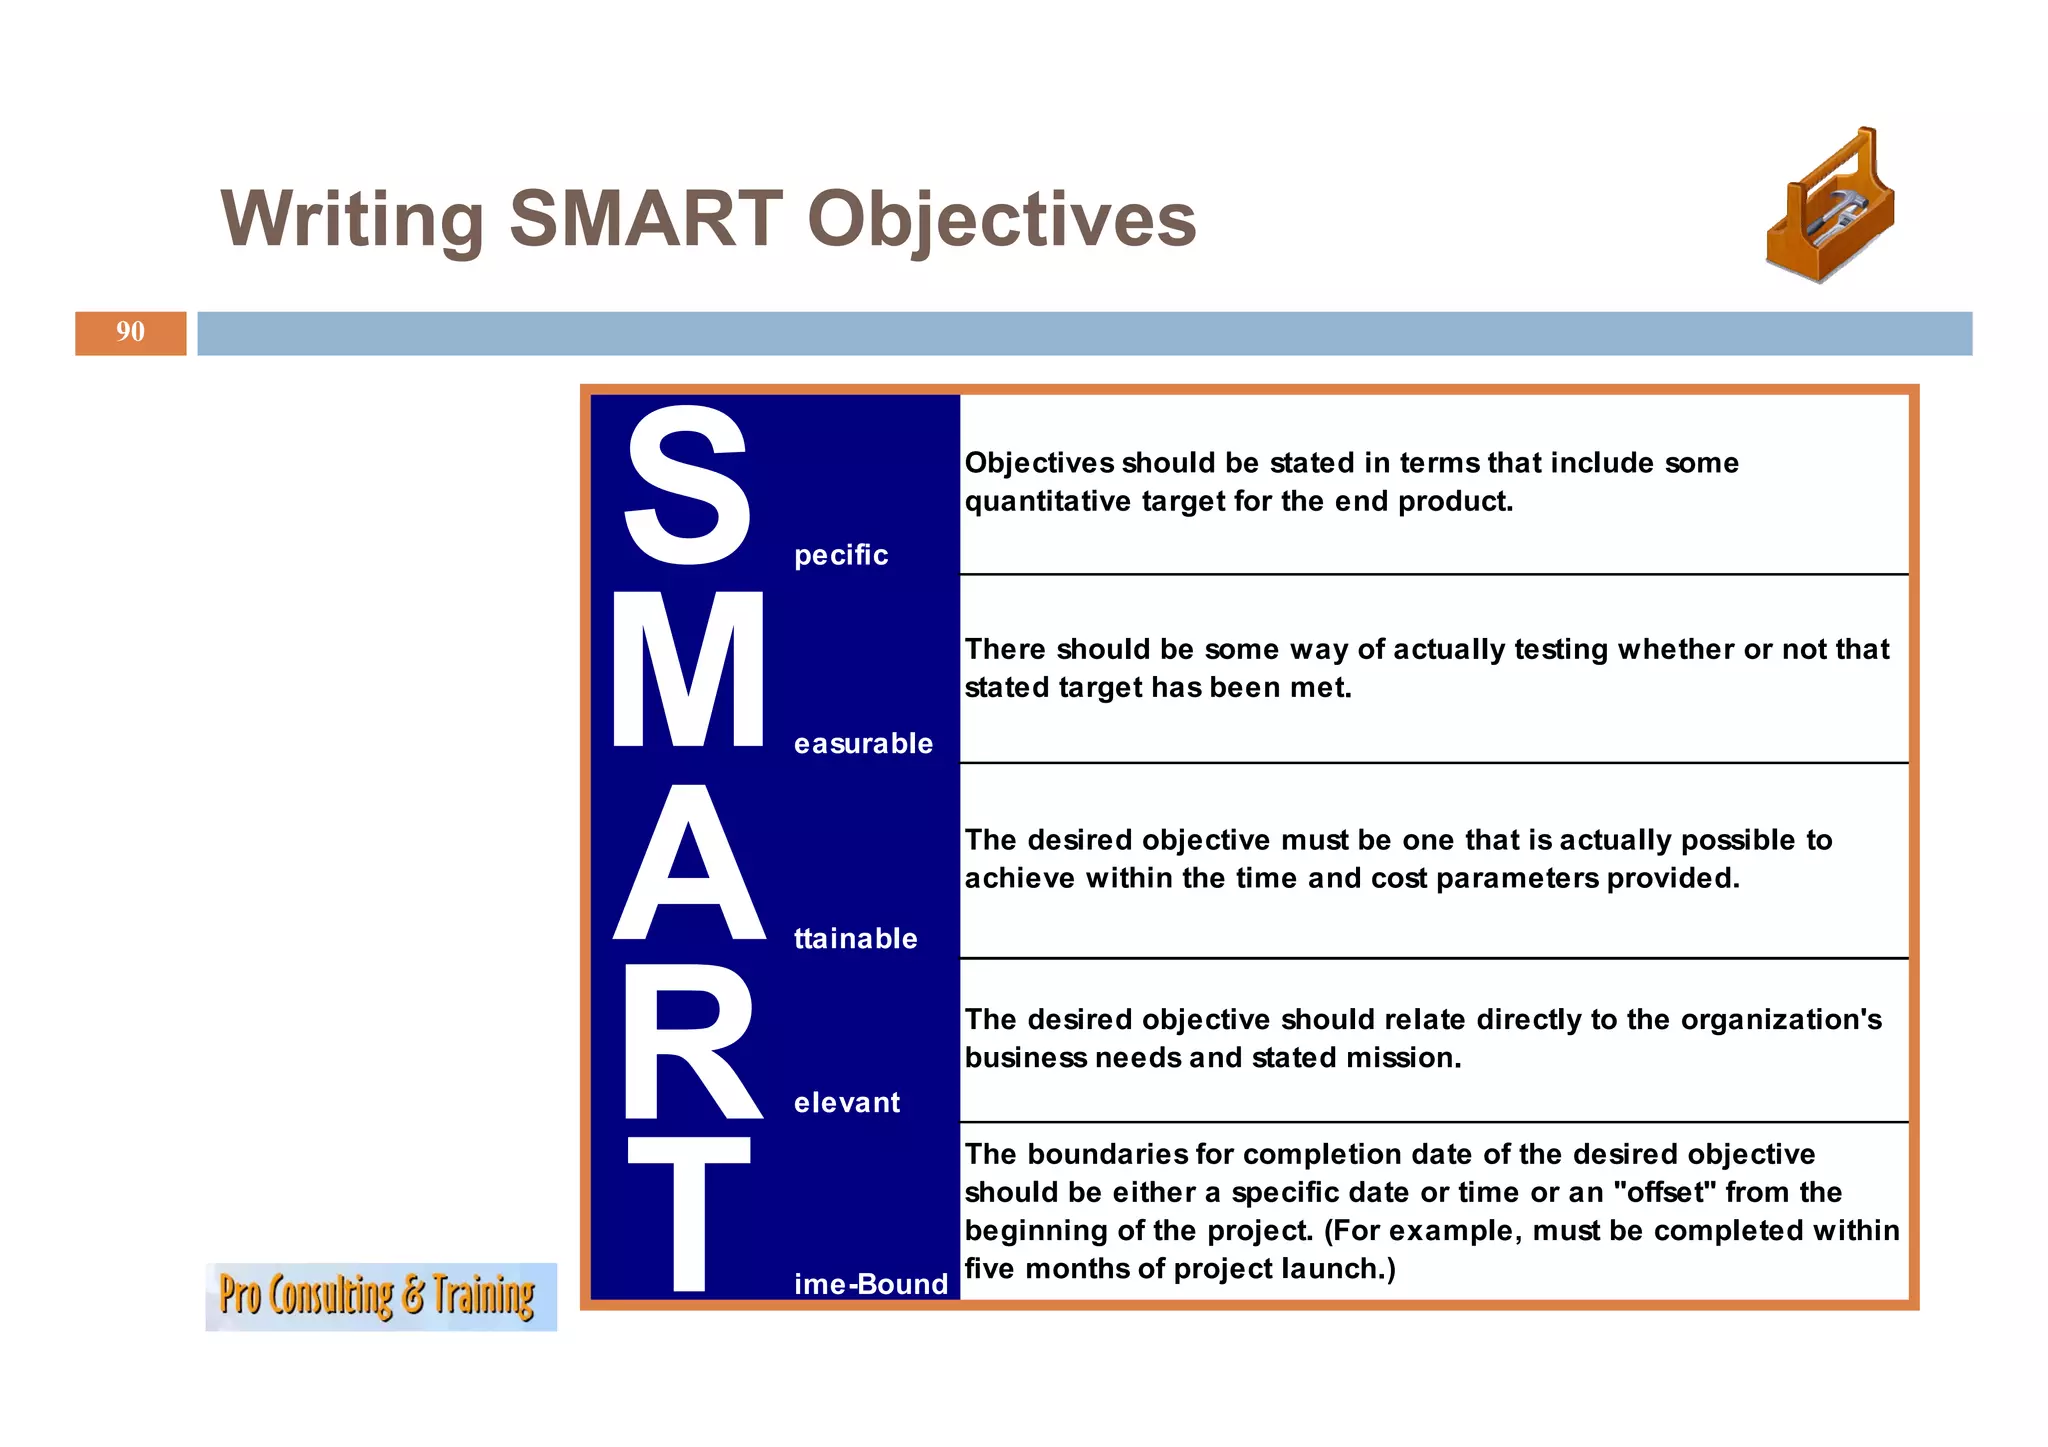
Guidelines on crafting SMART objectives to enhance project success.
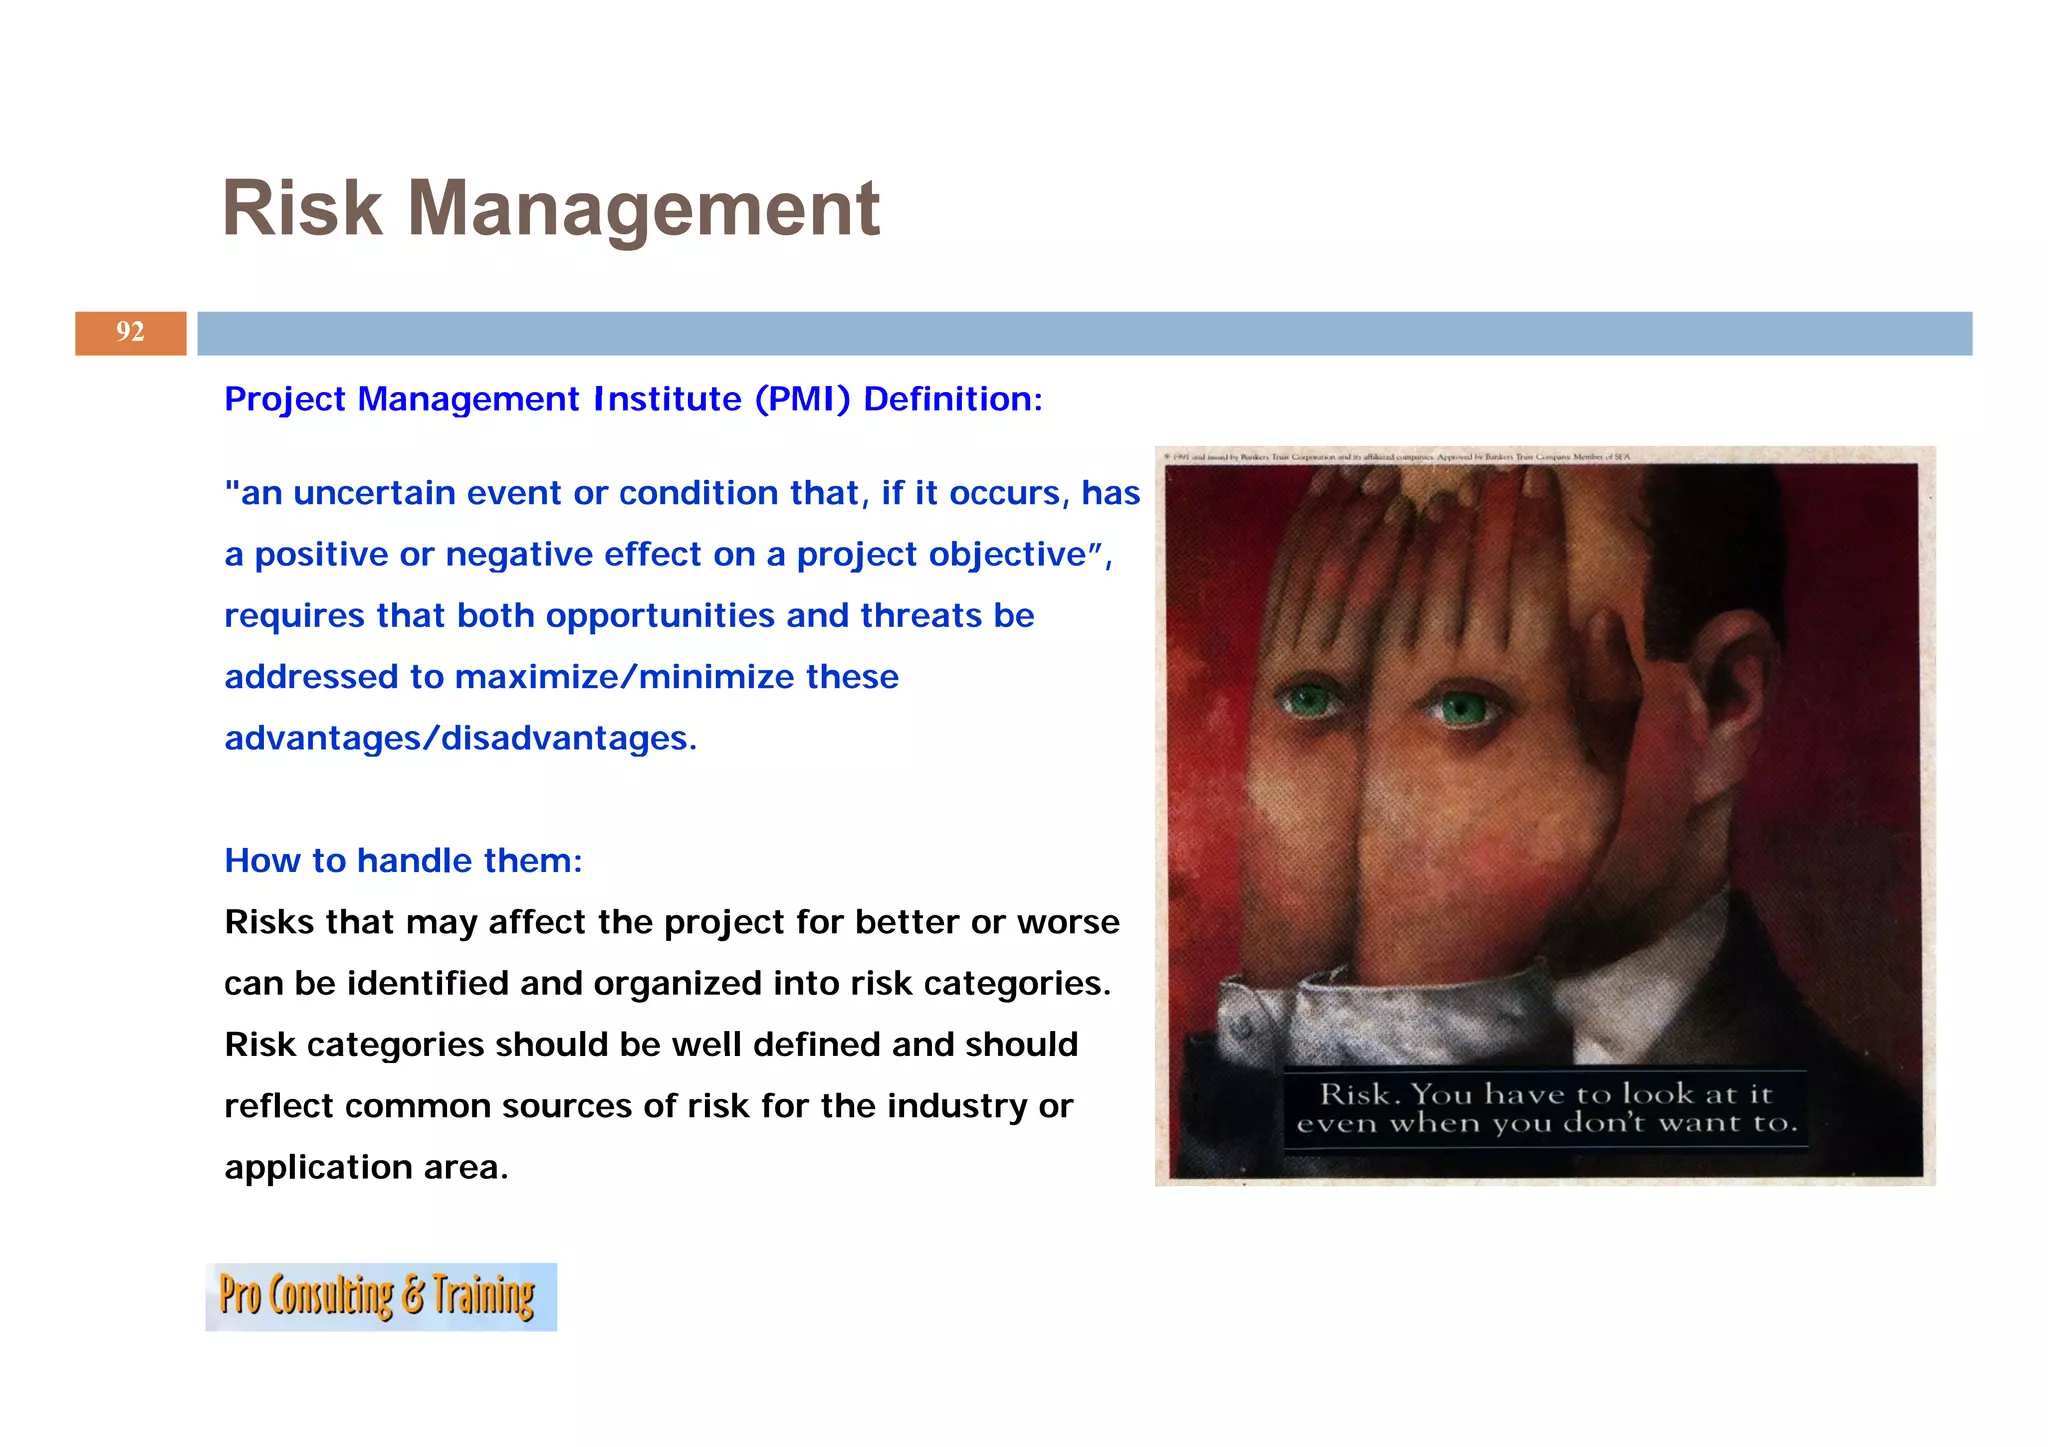
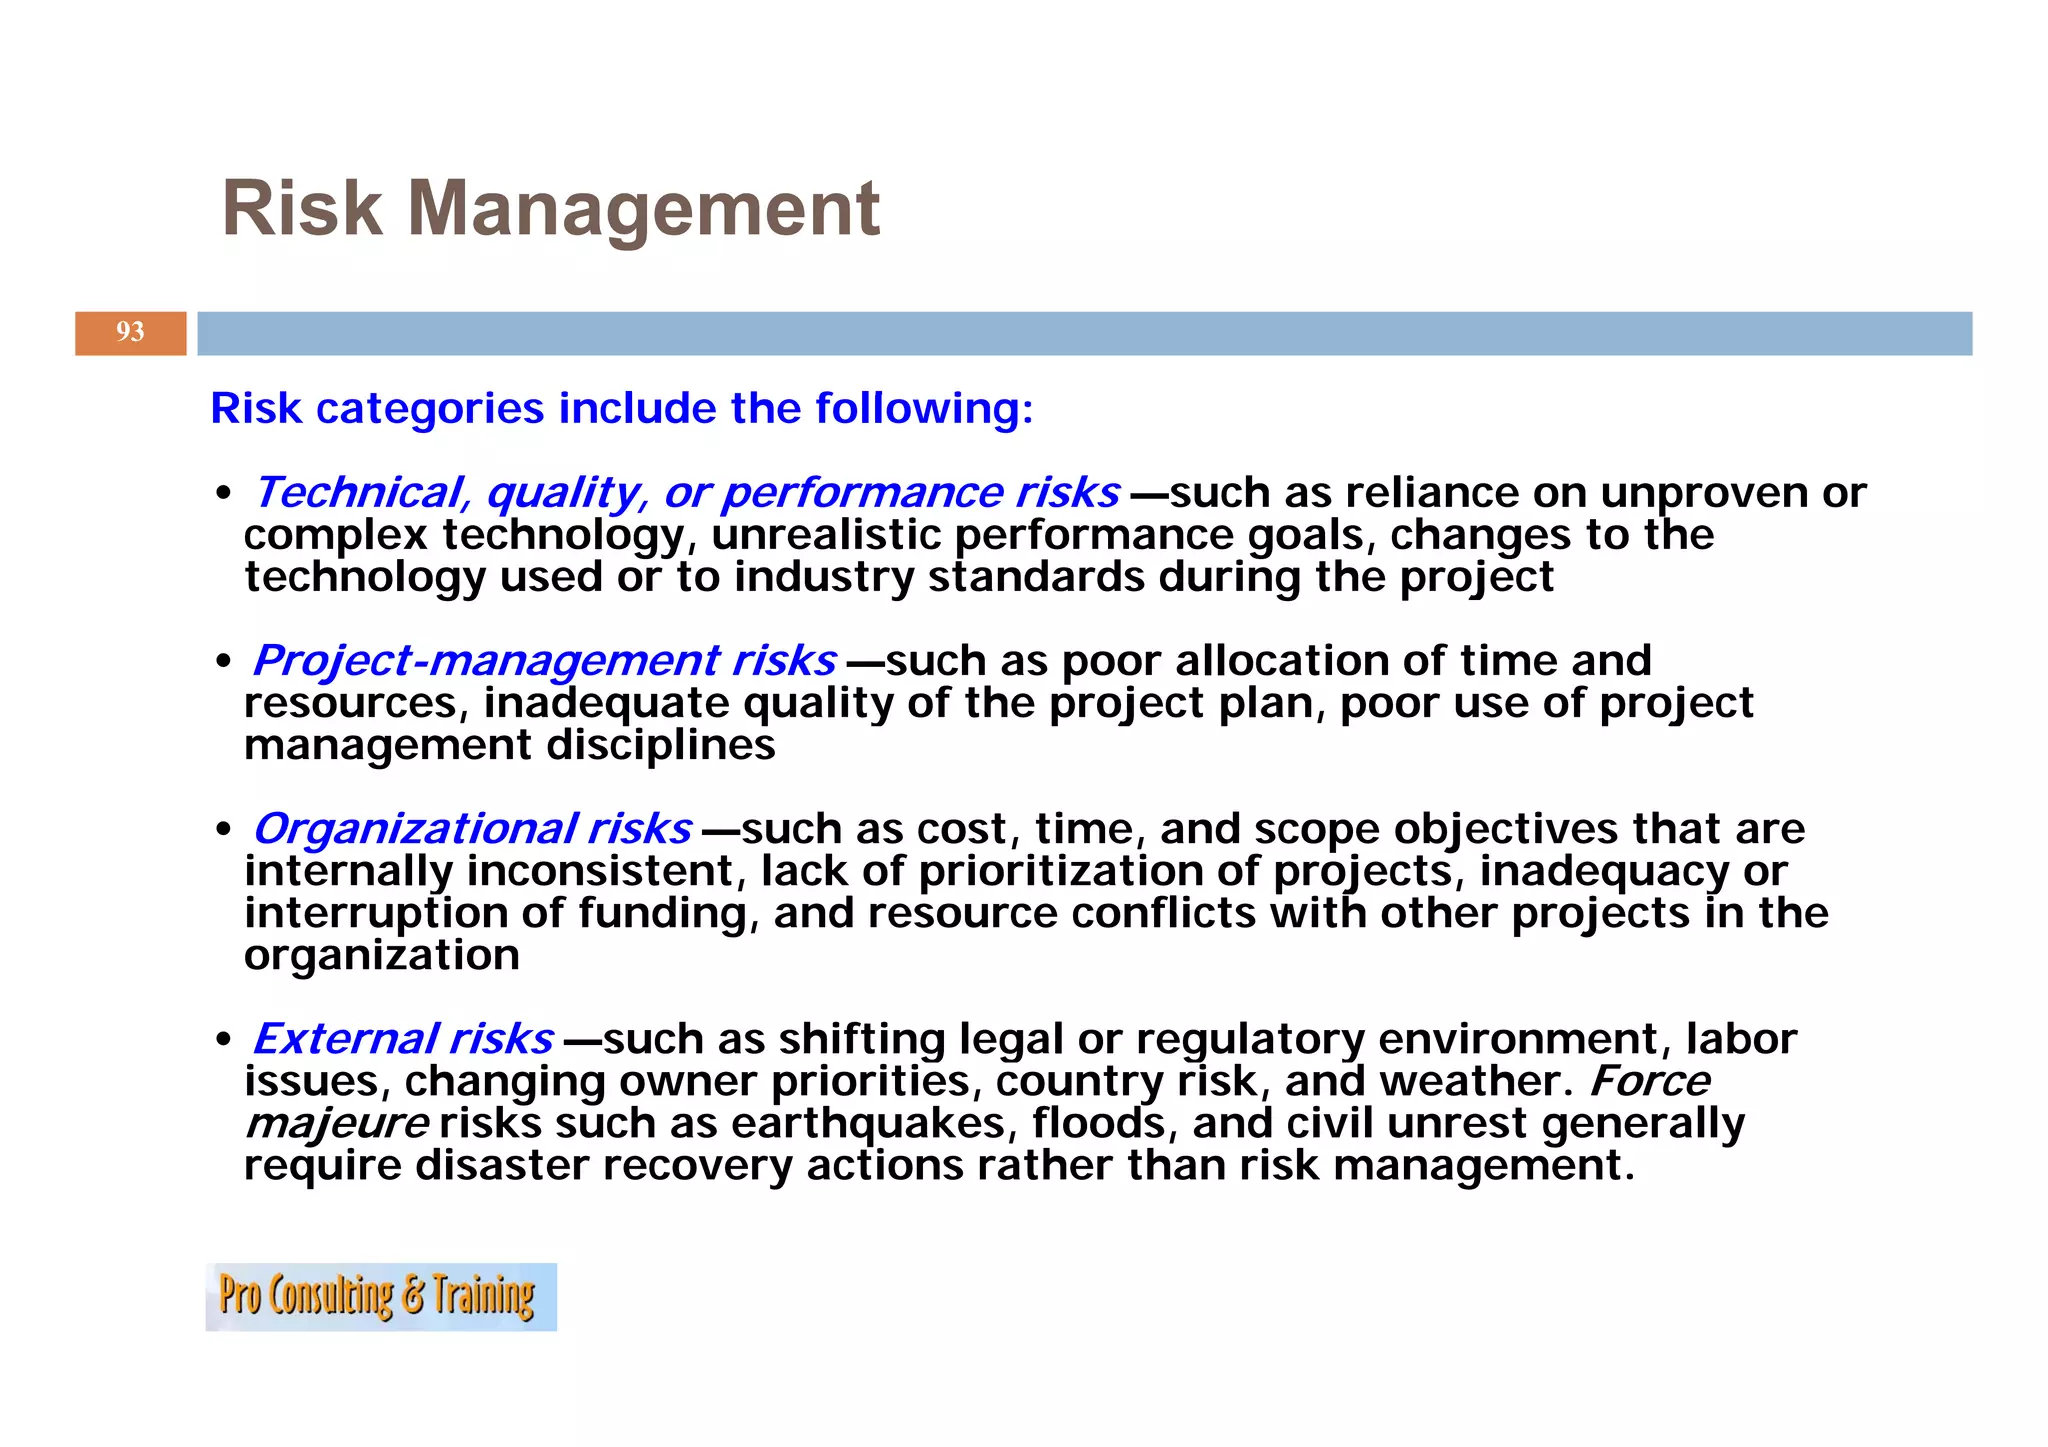
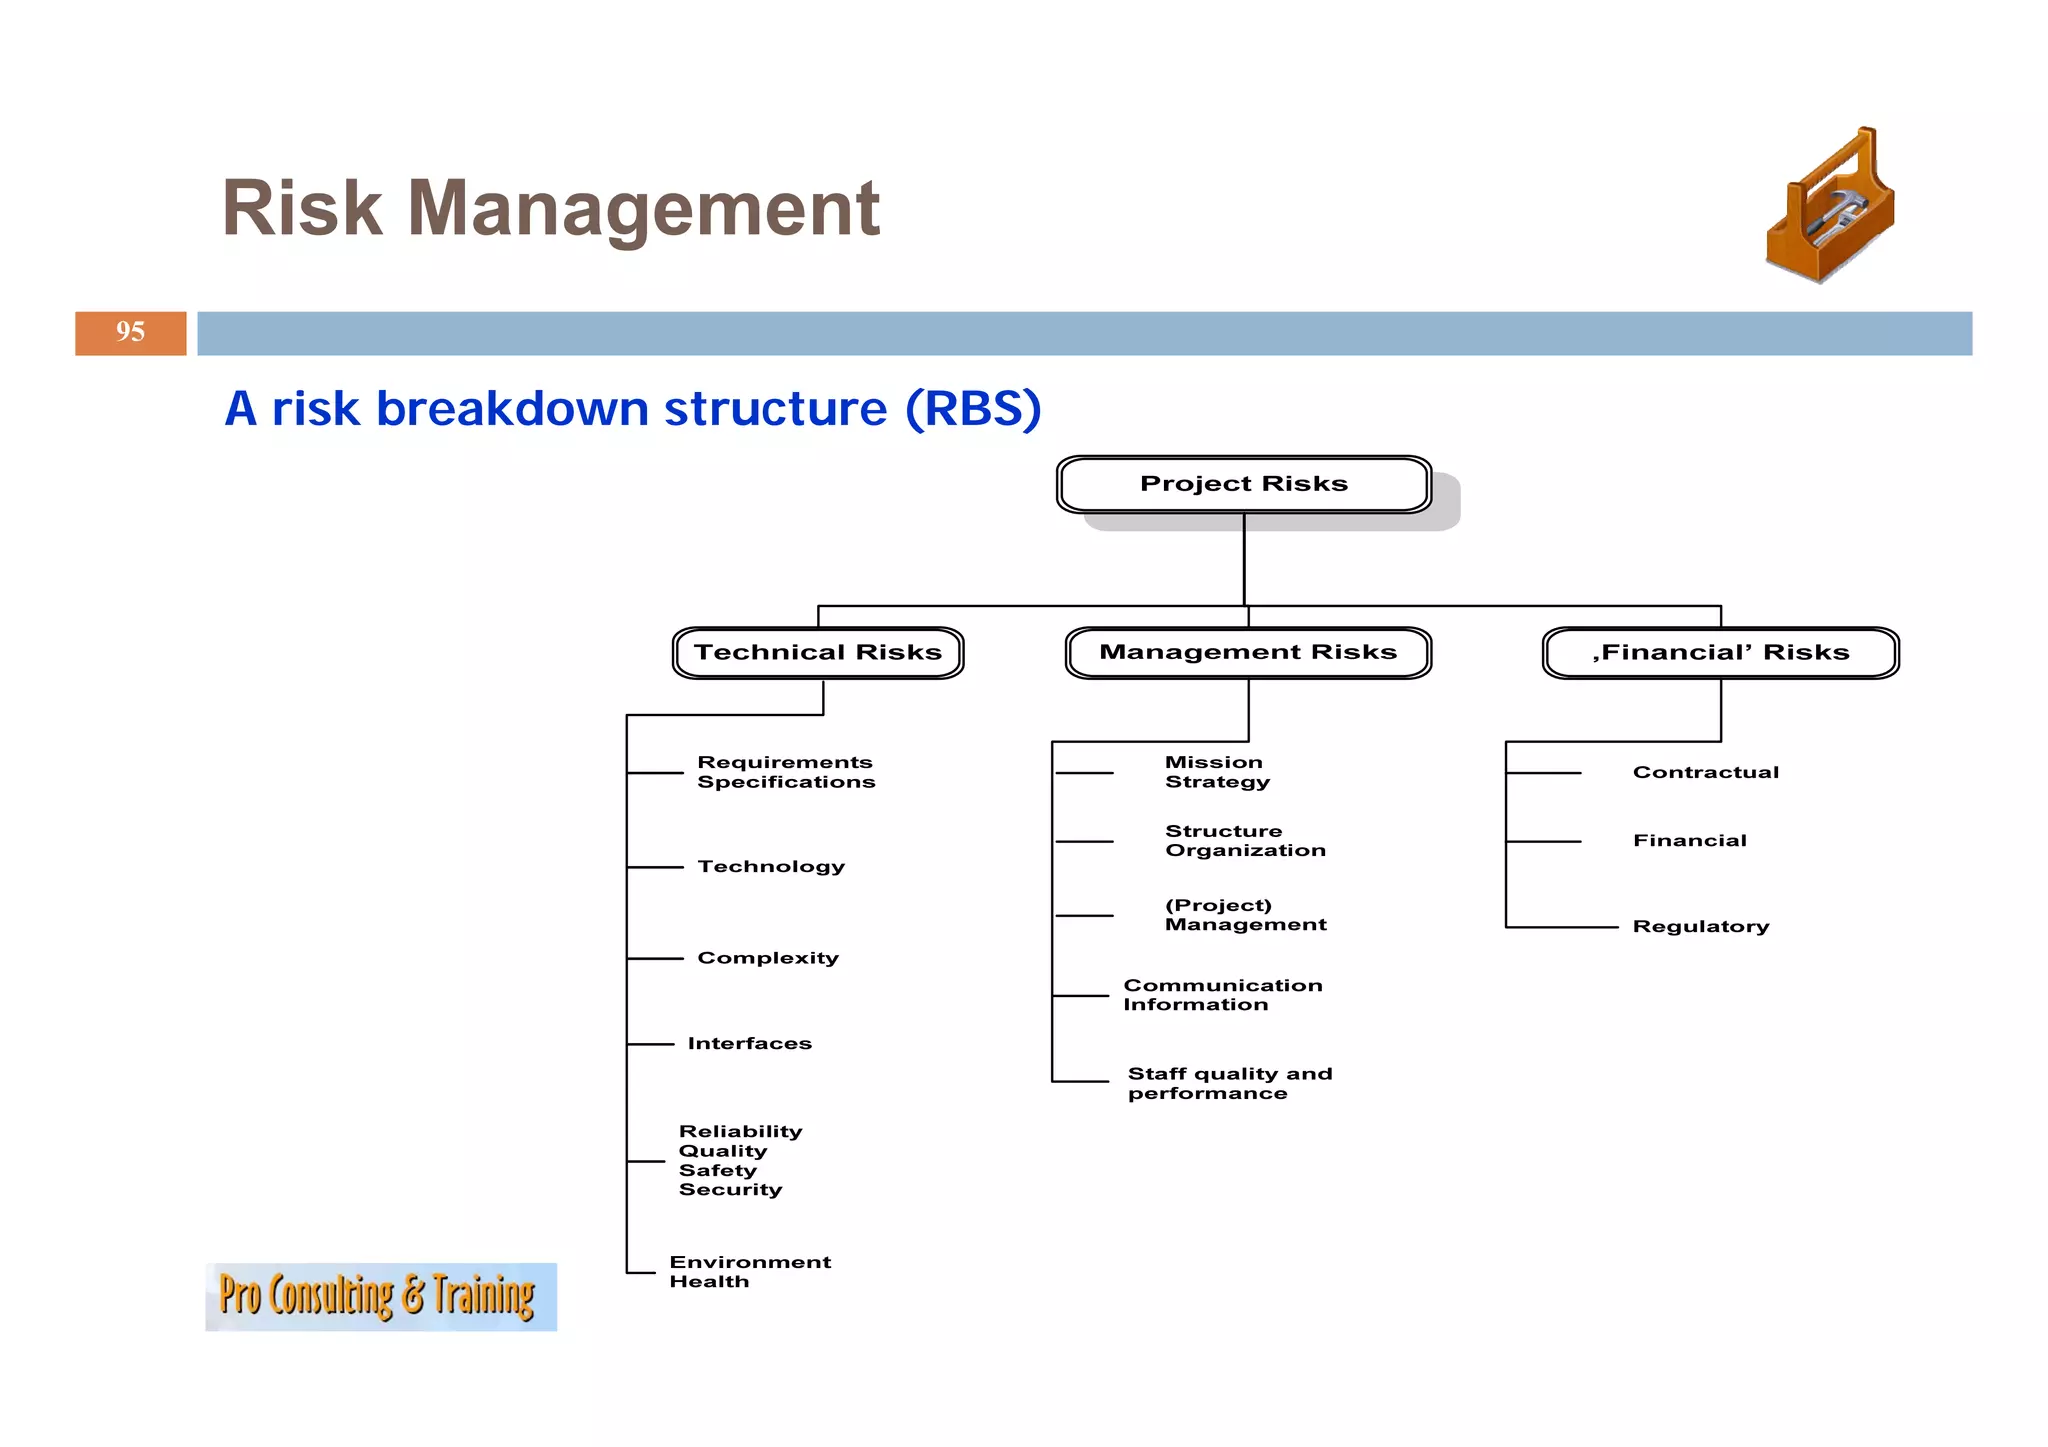
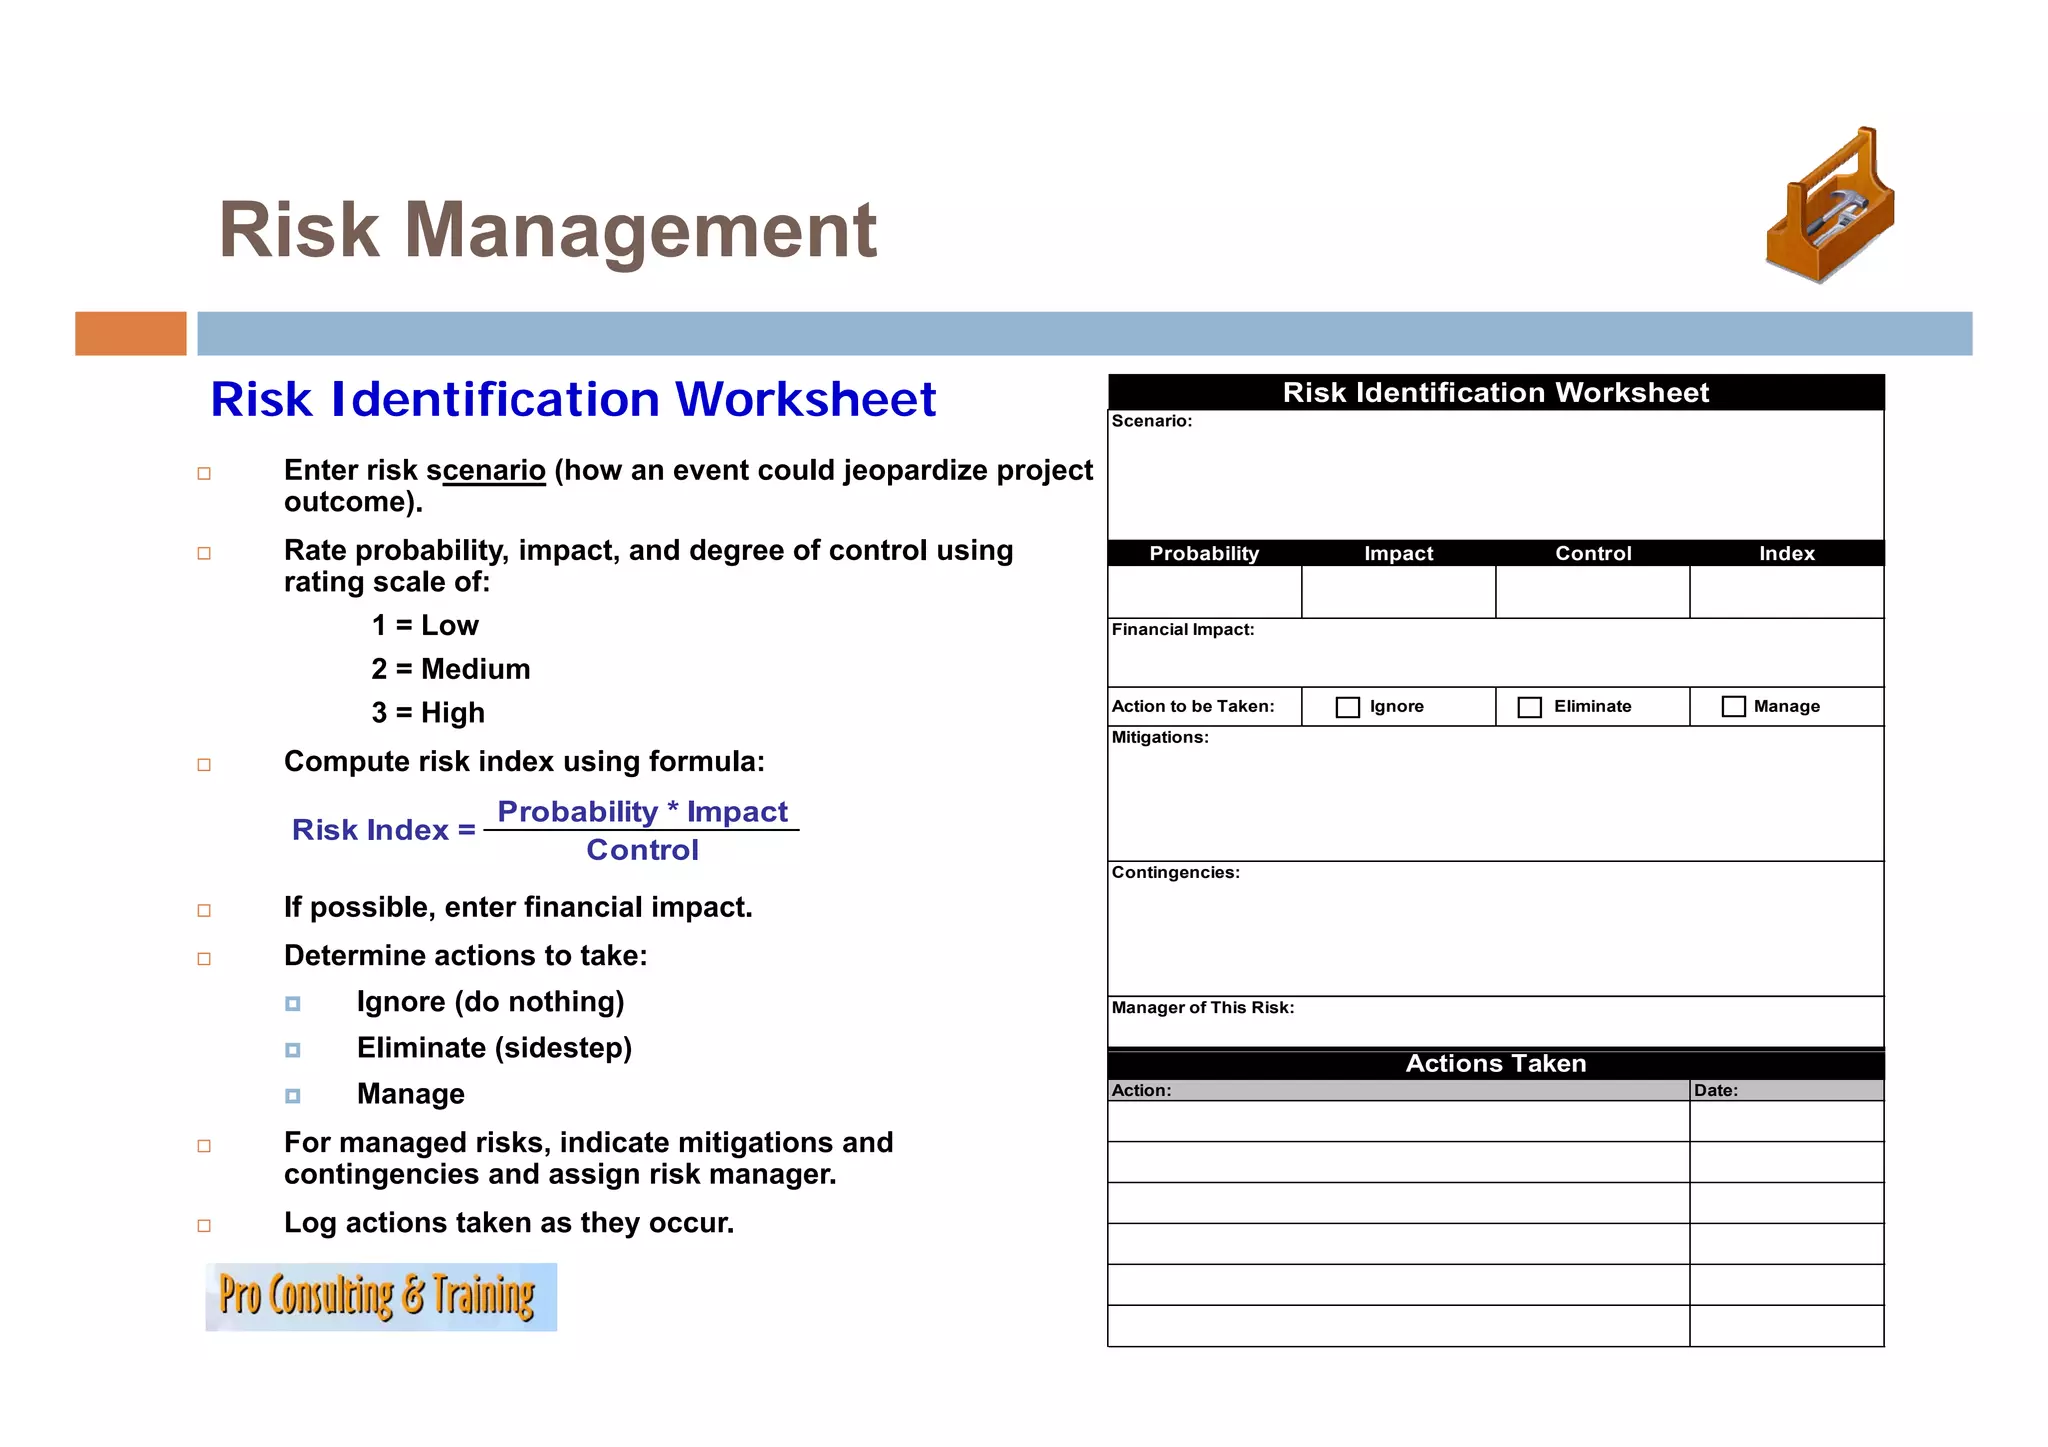
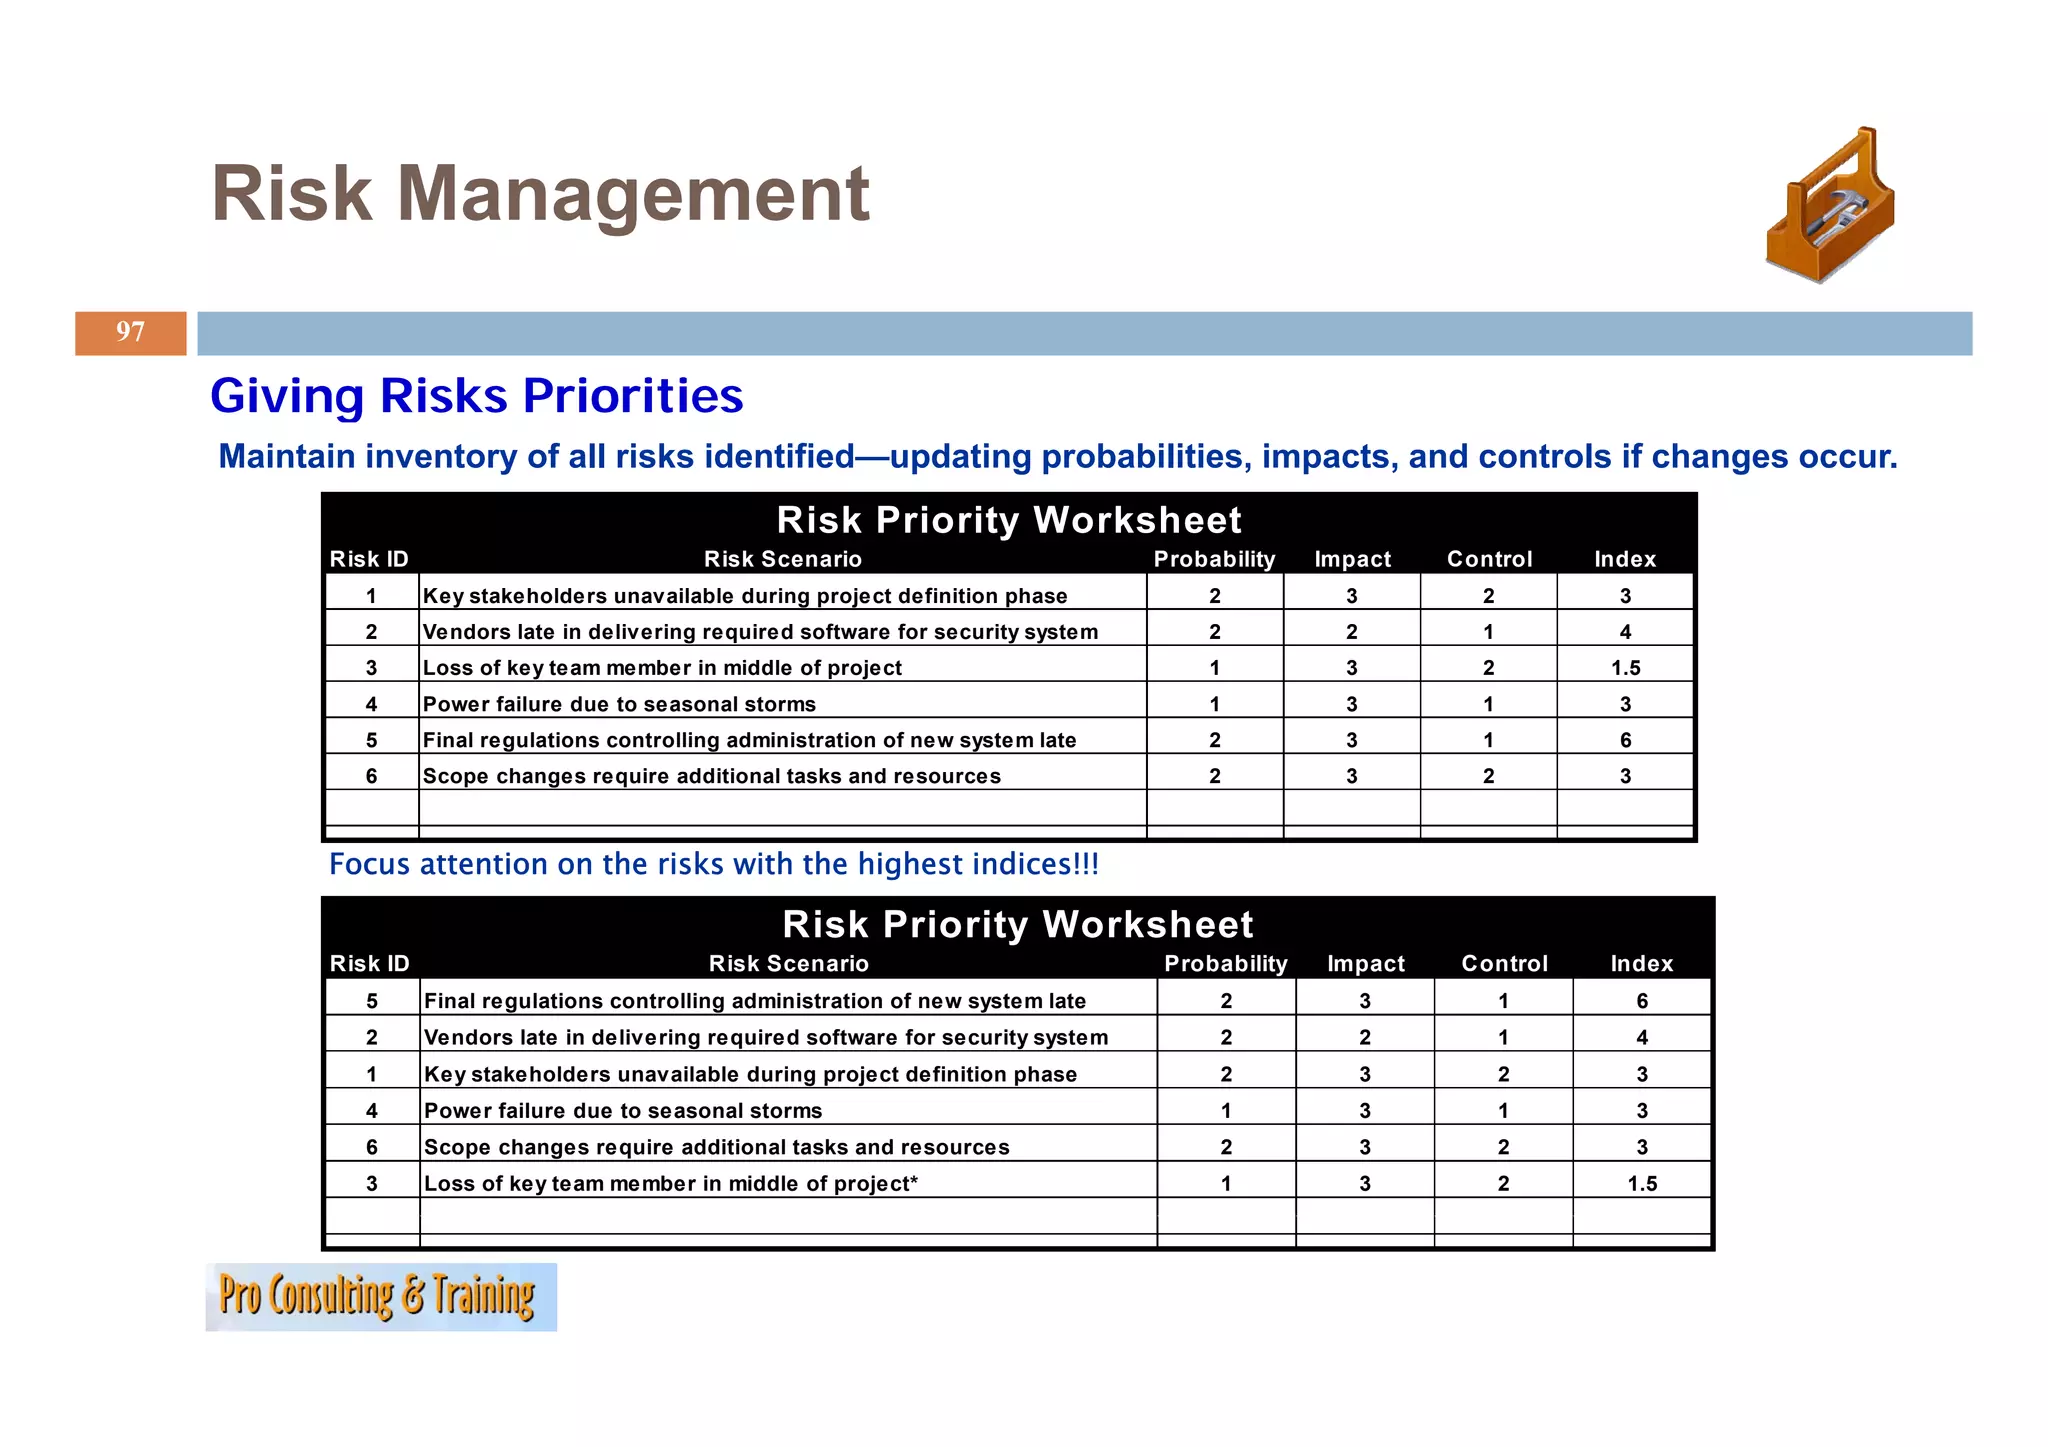
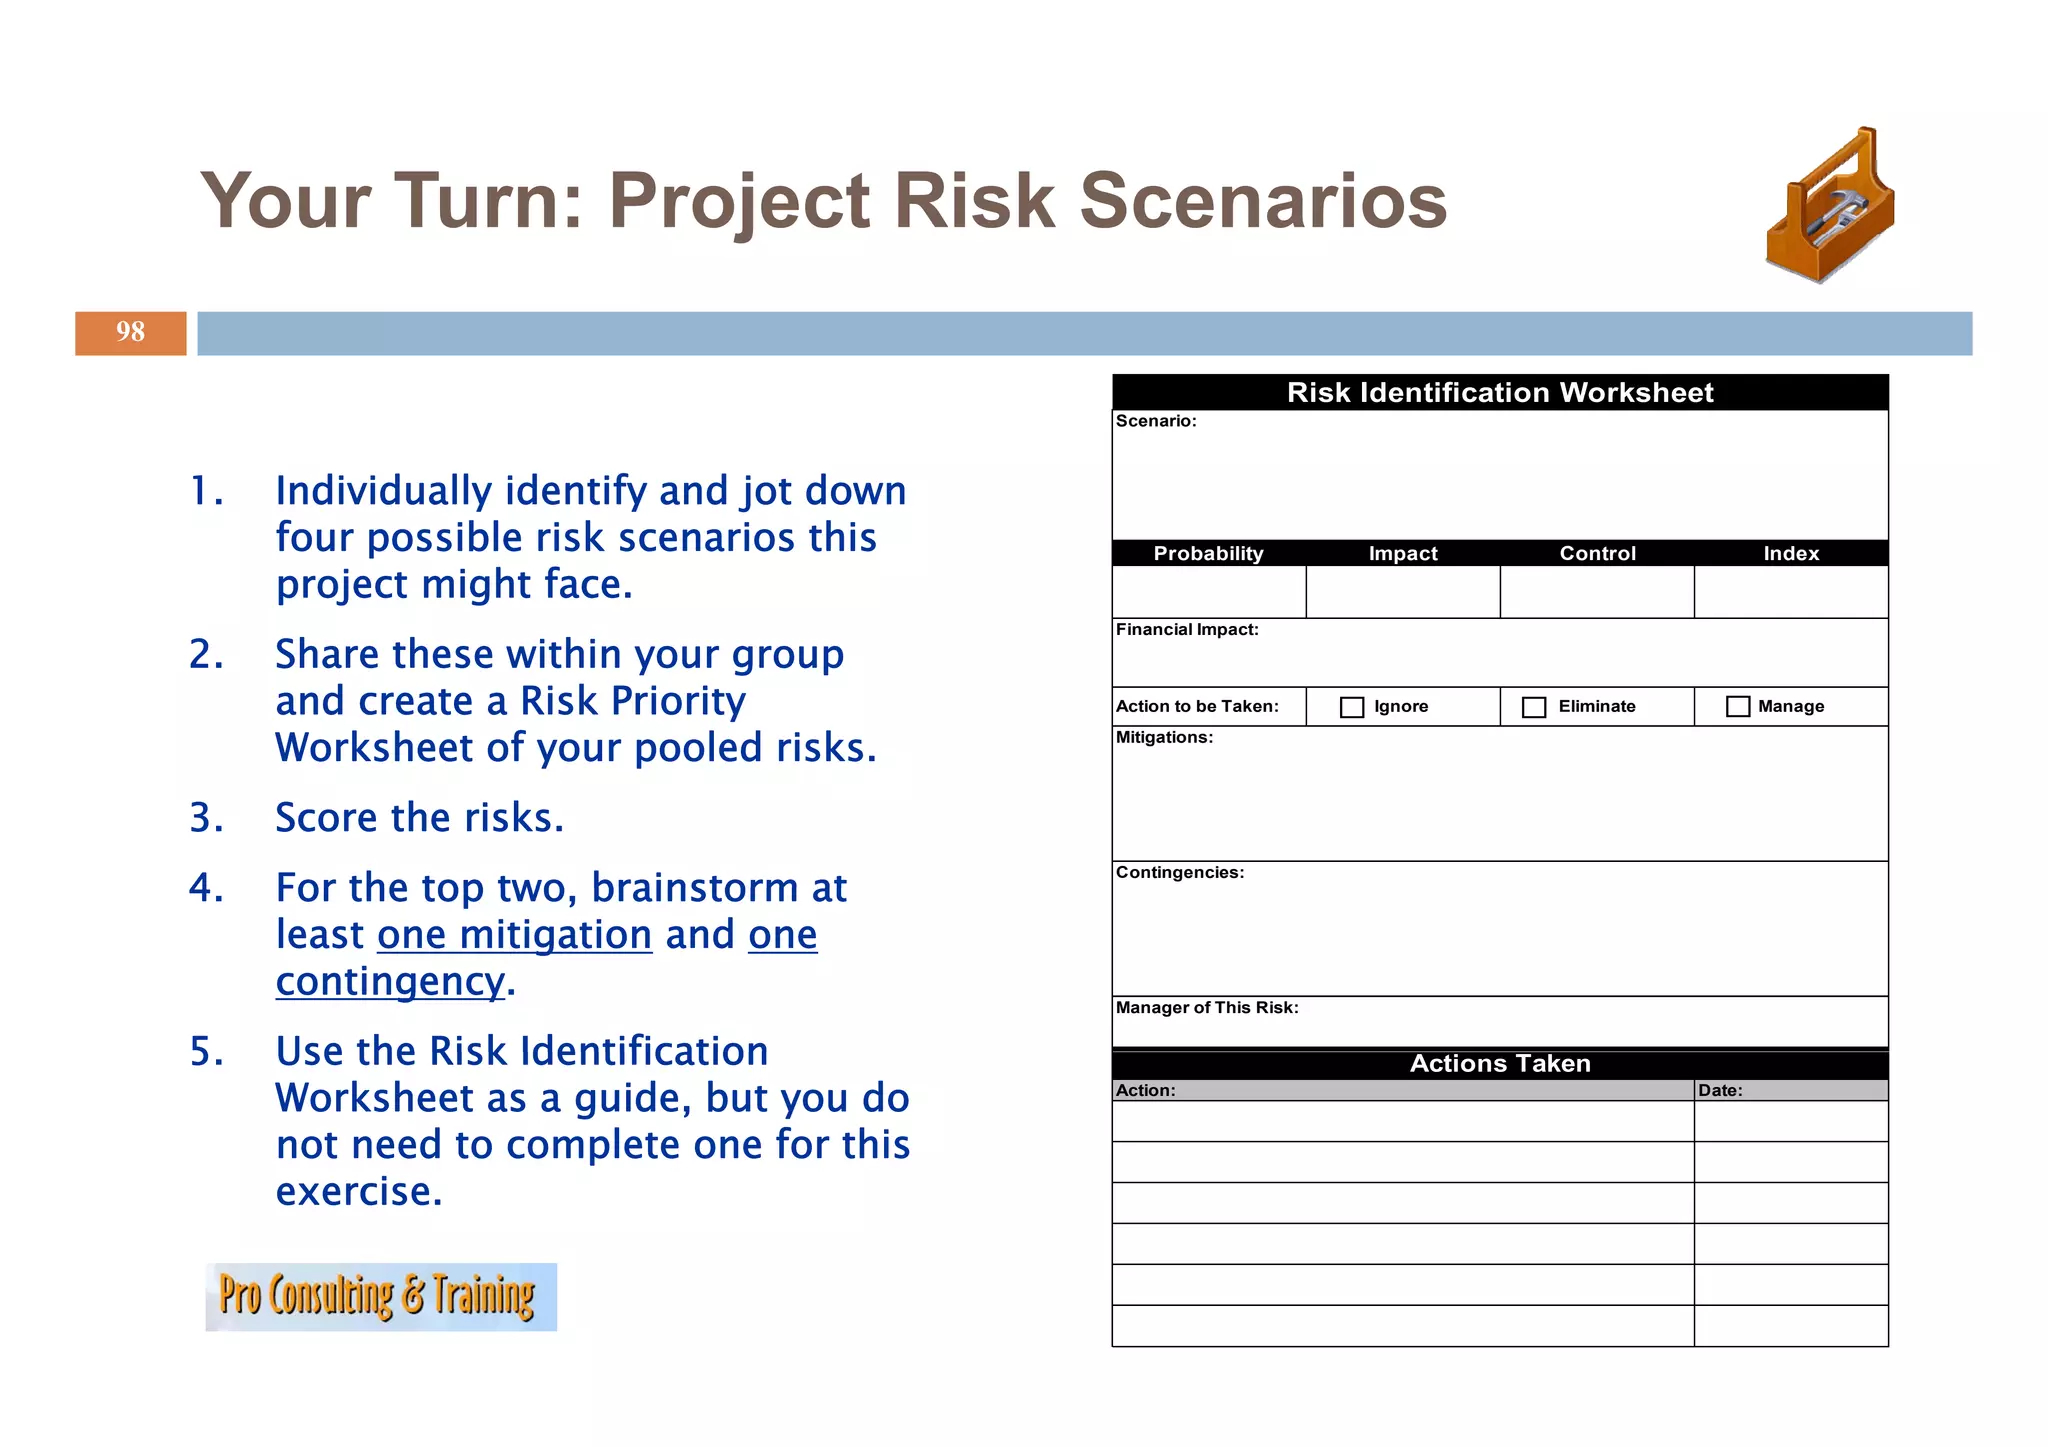
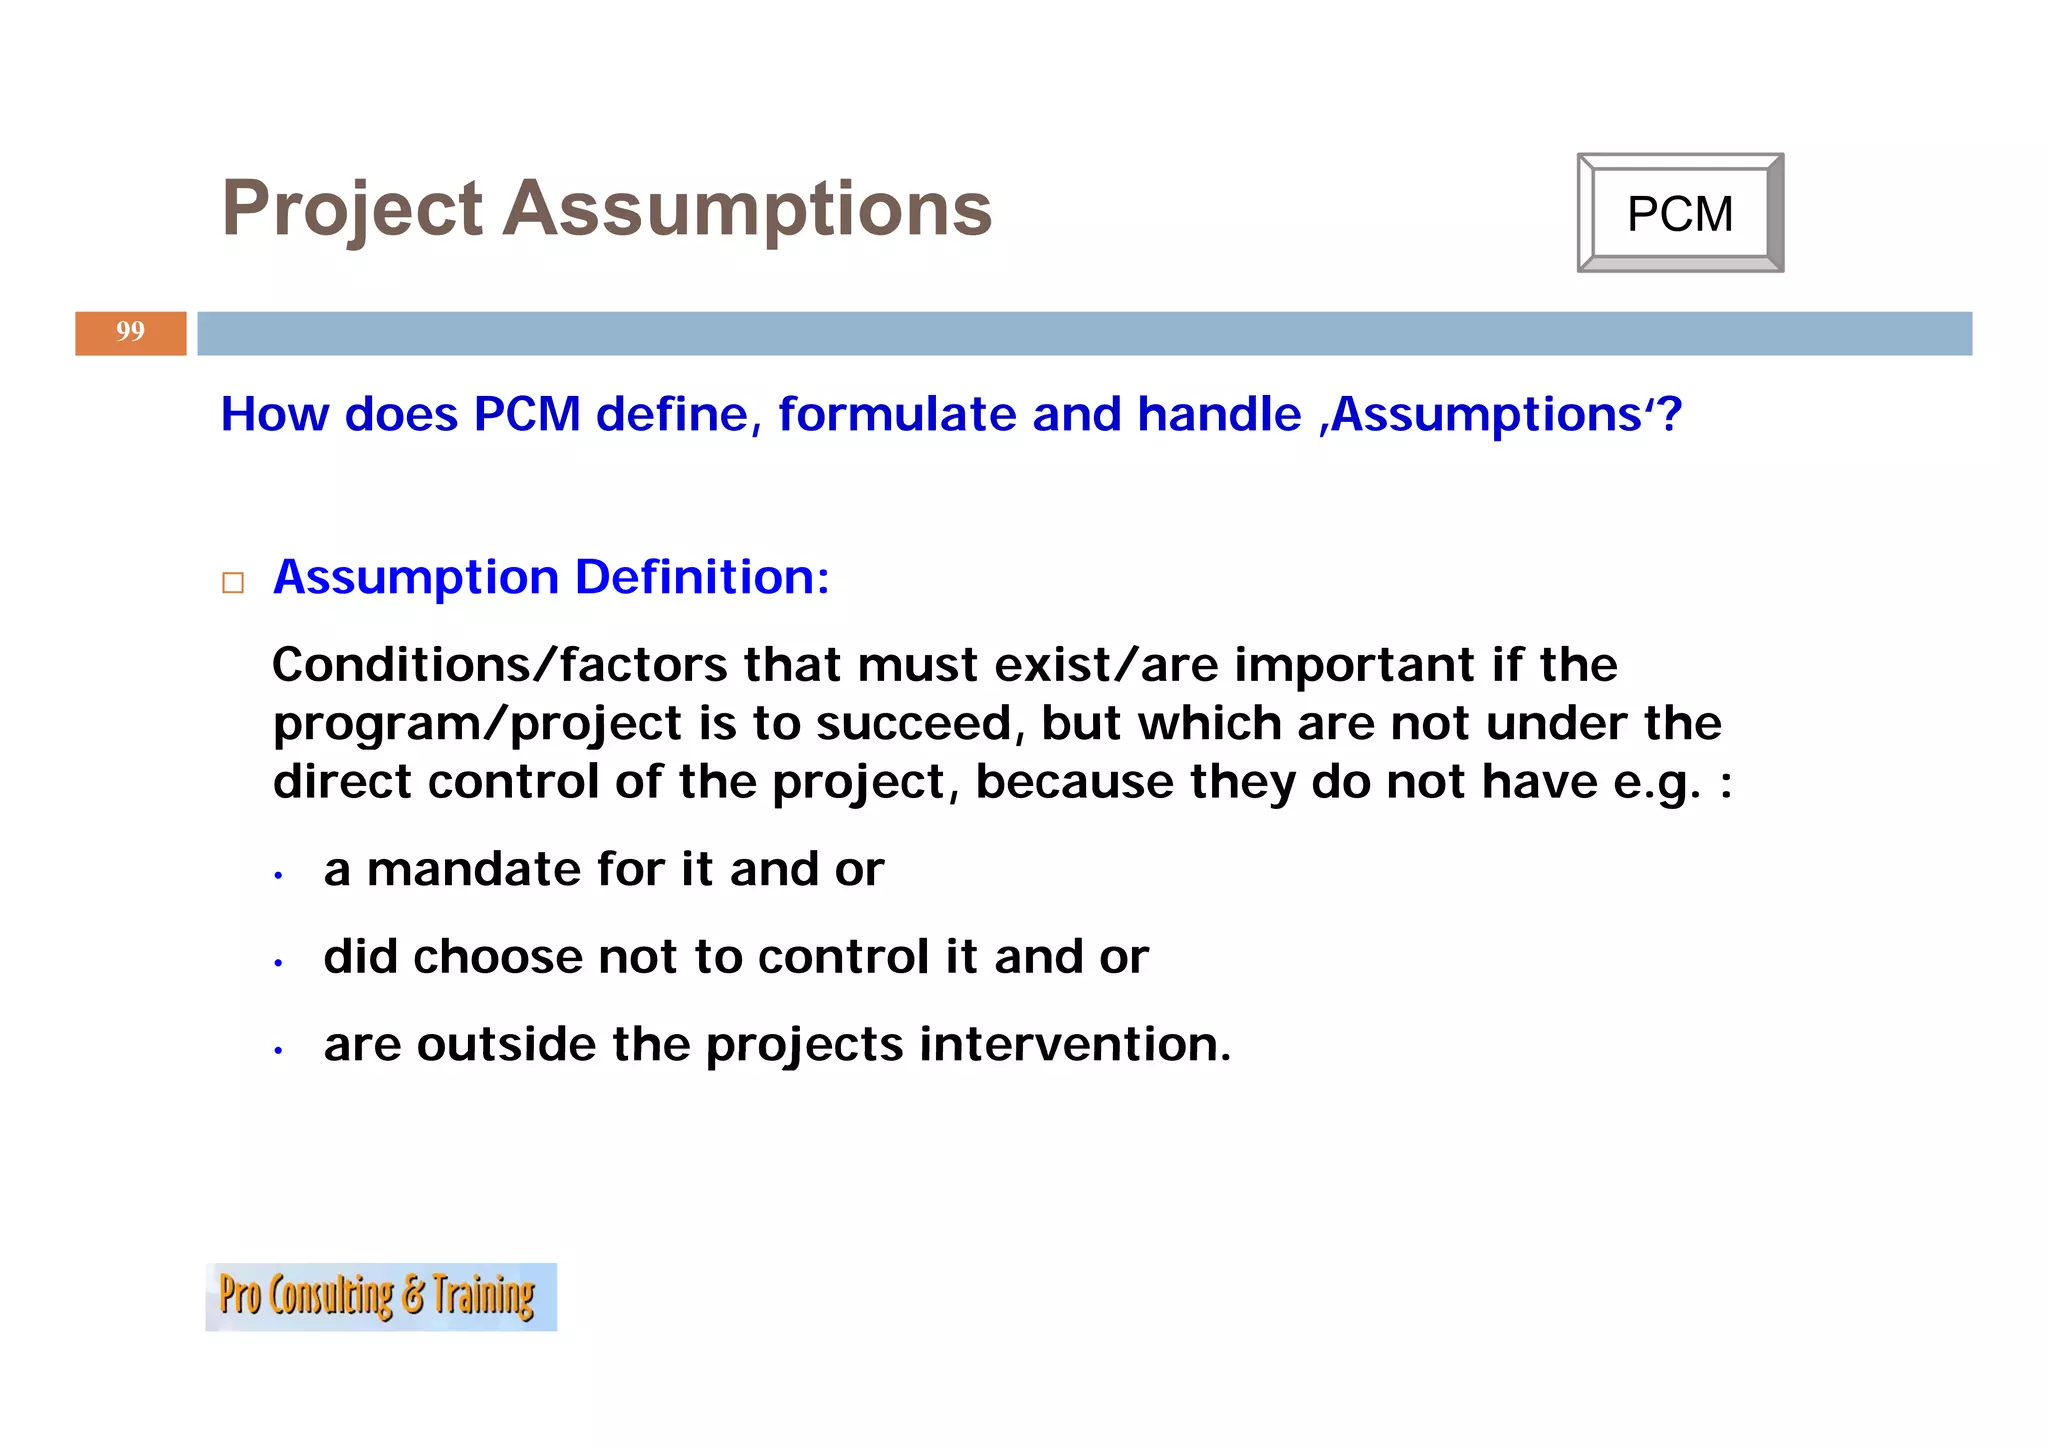
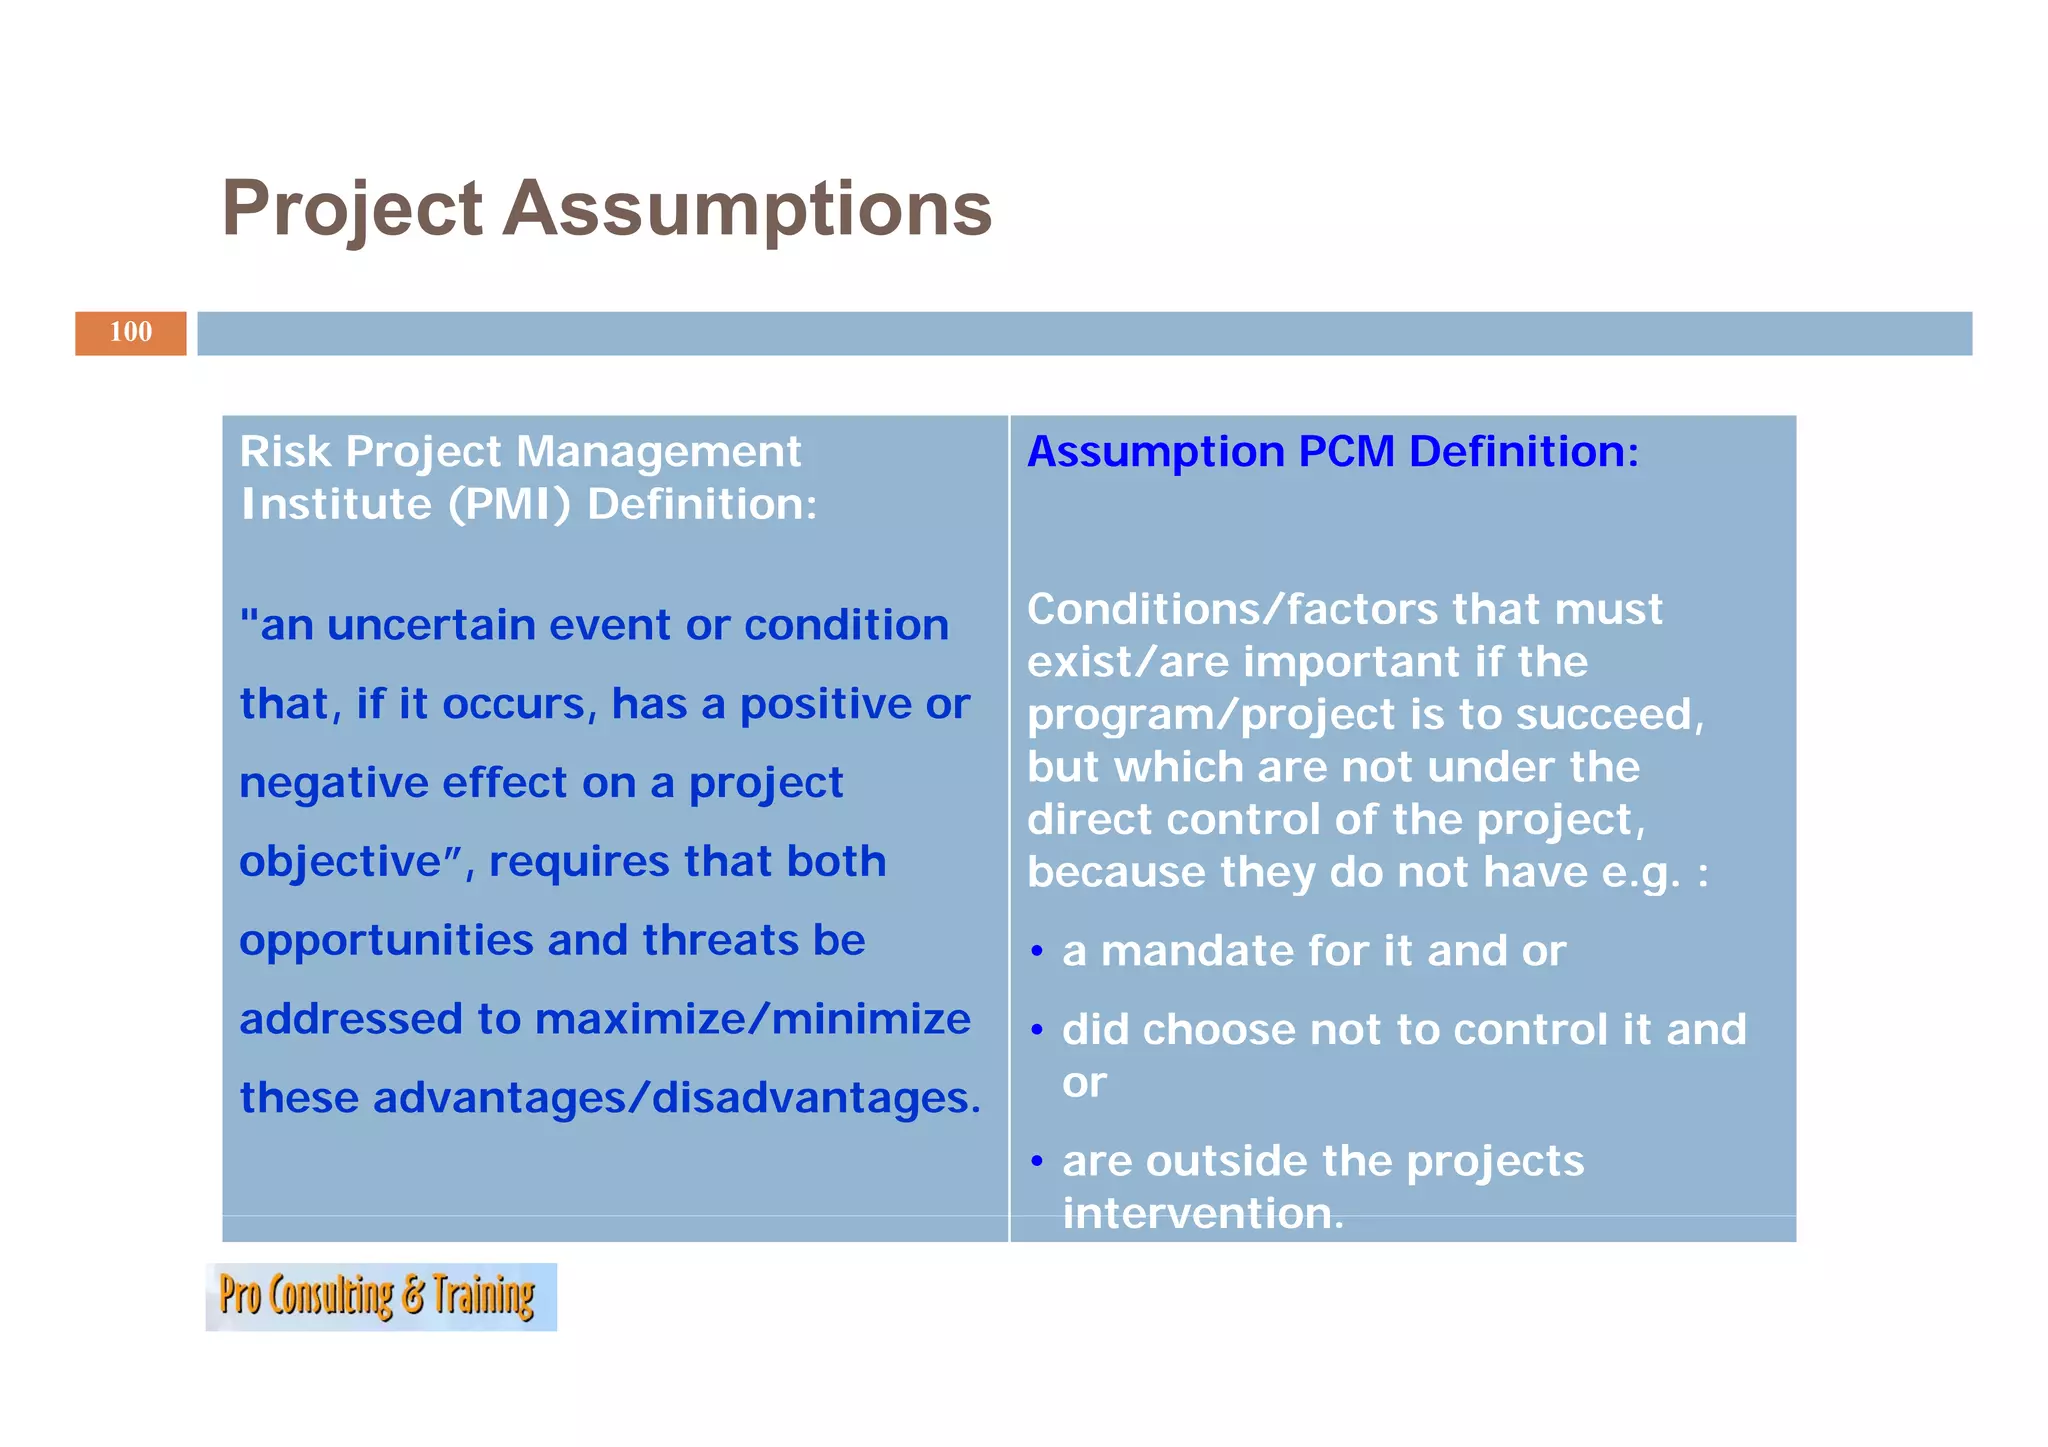
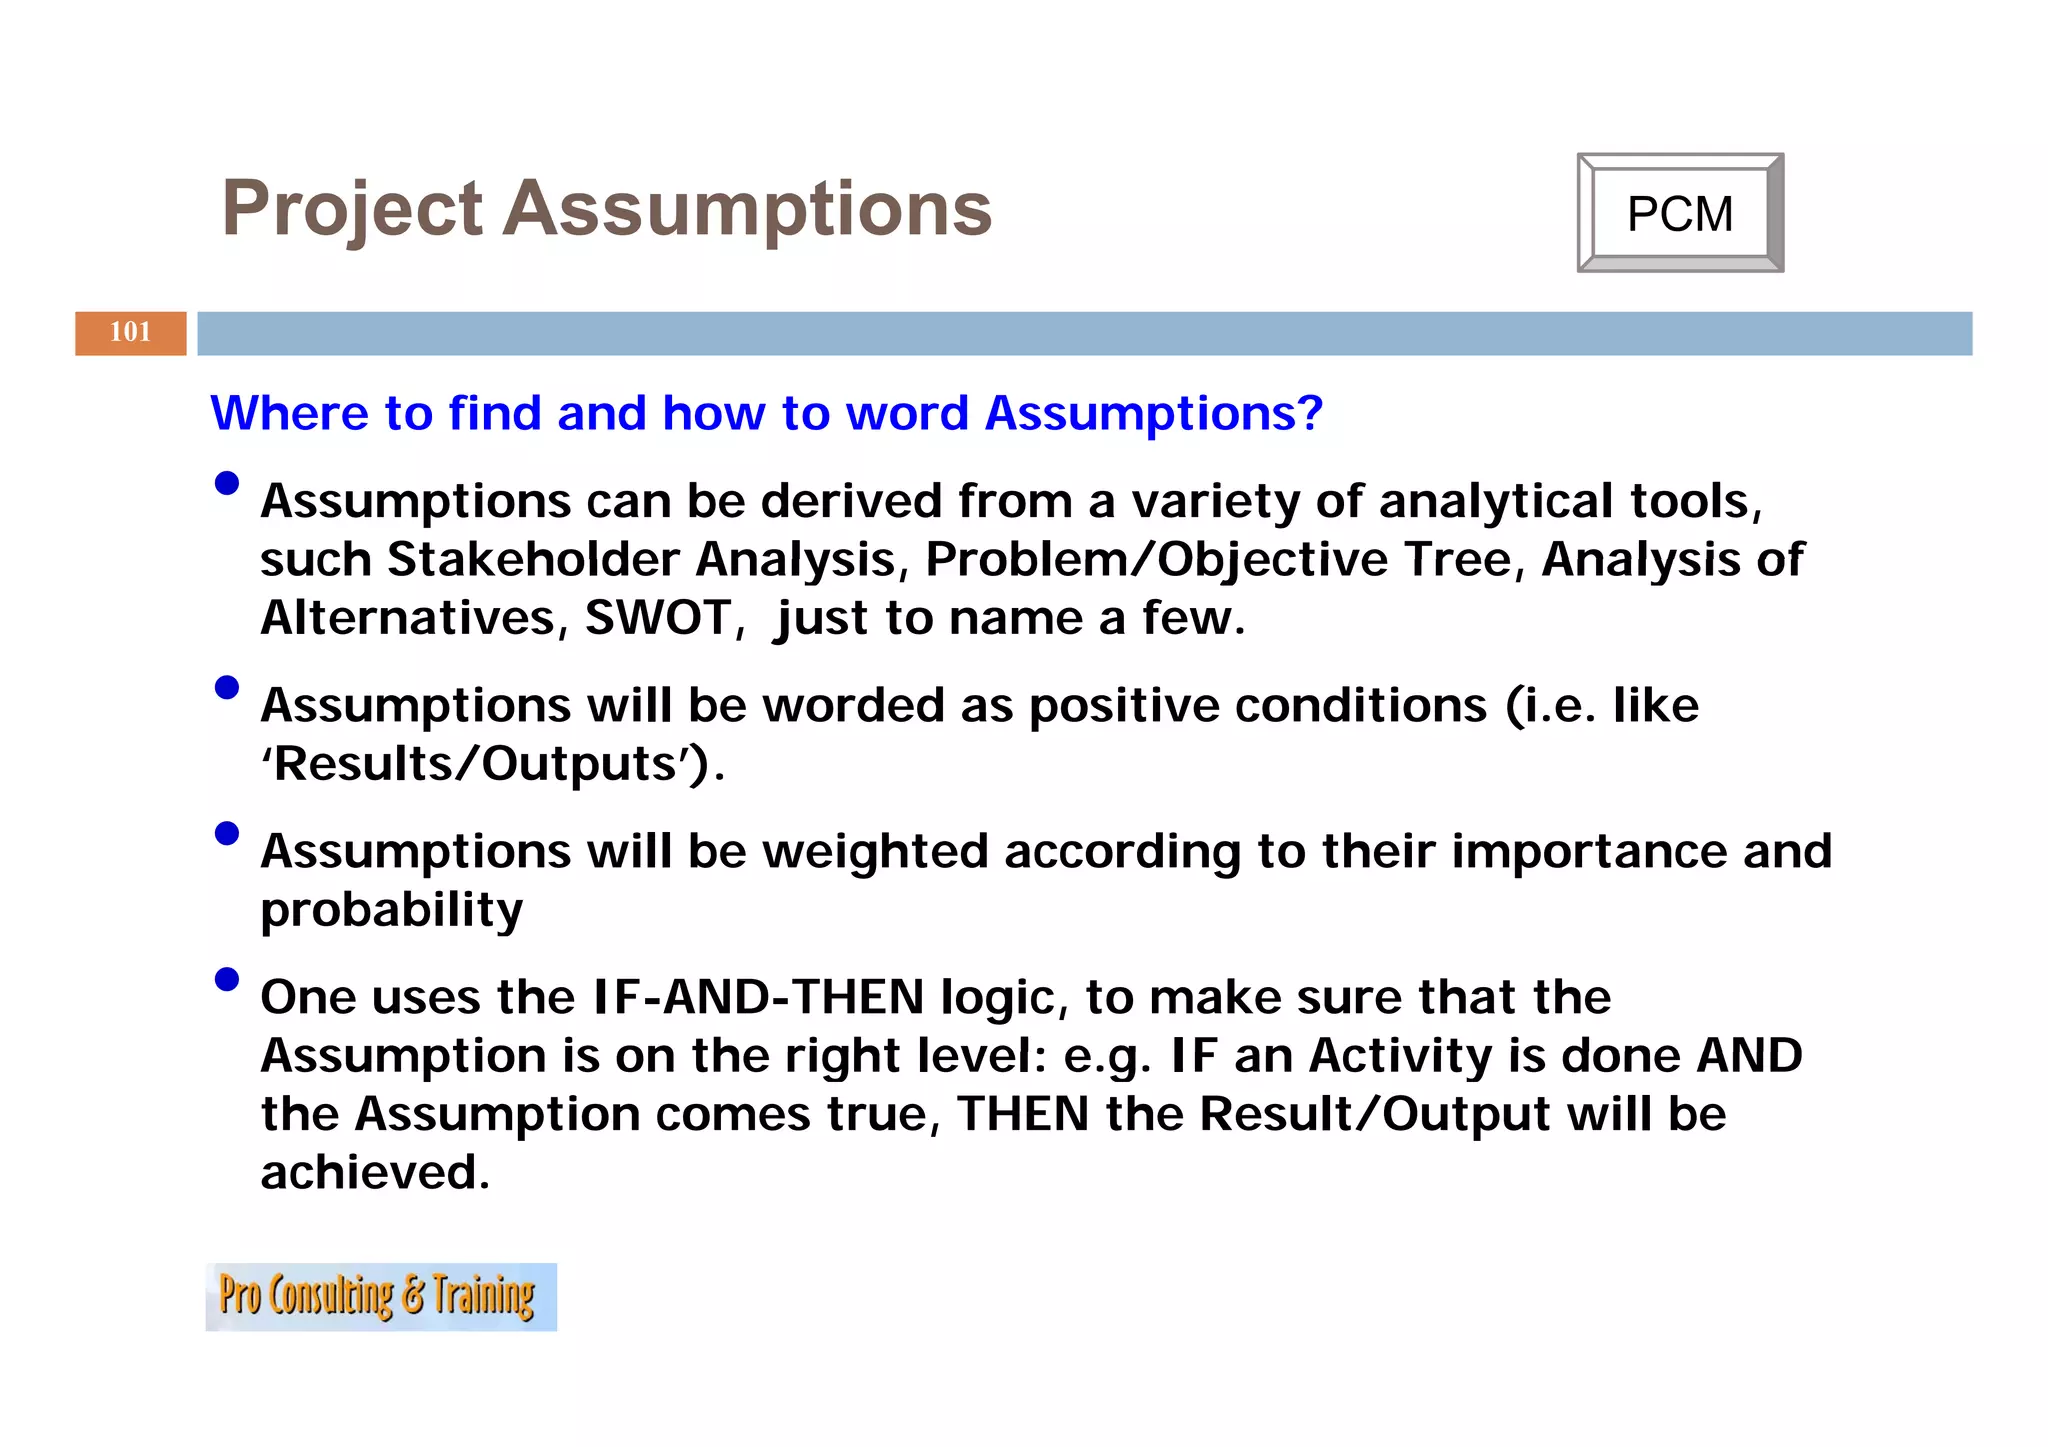
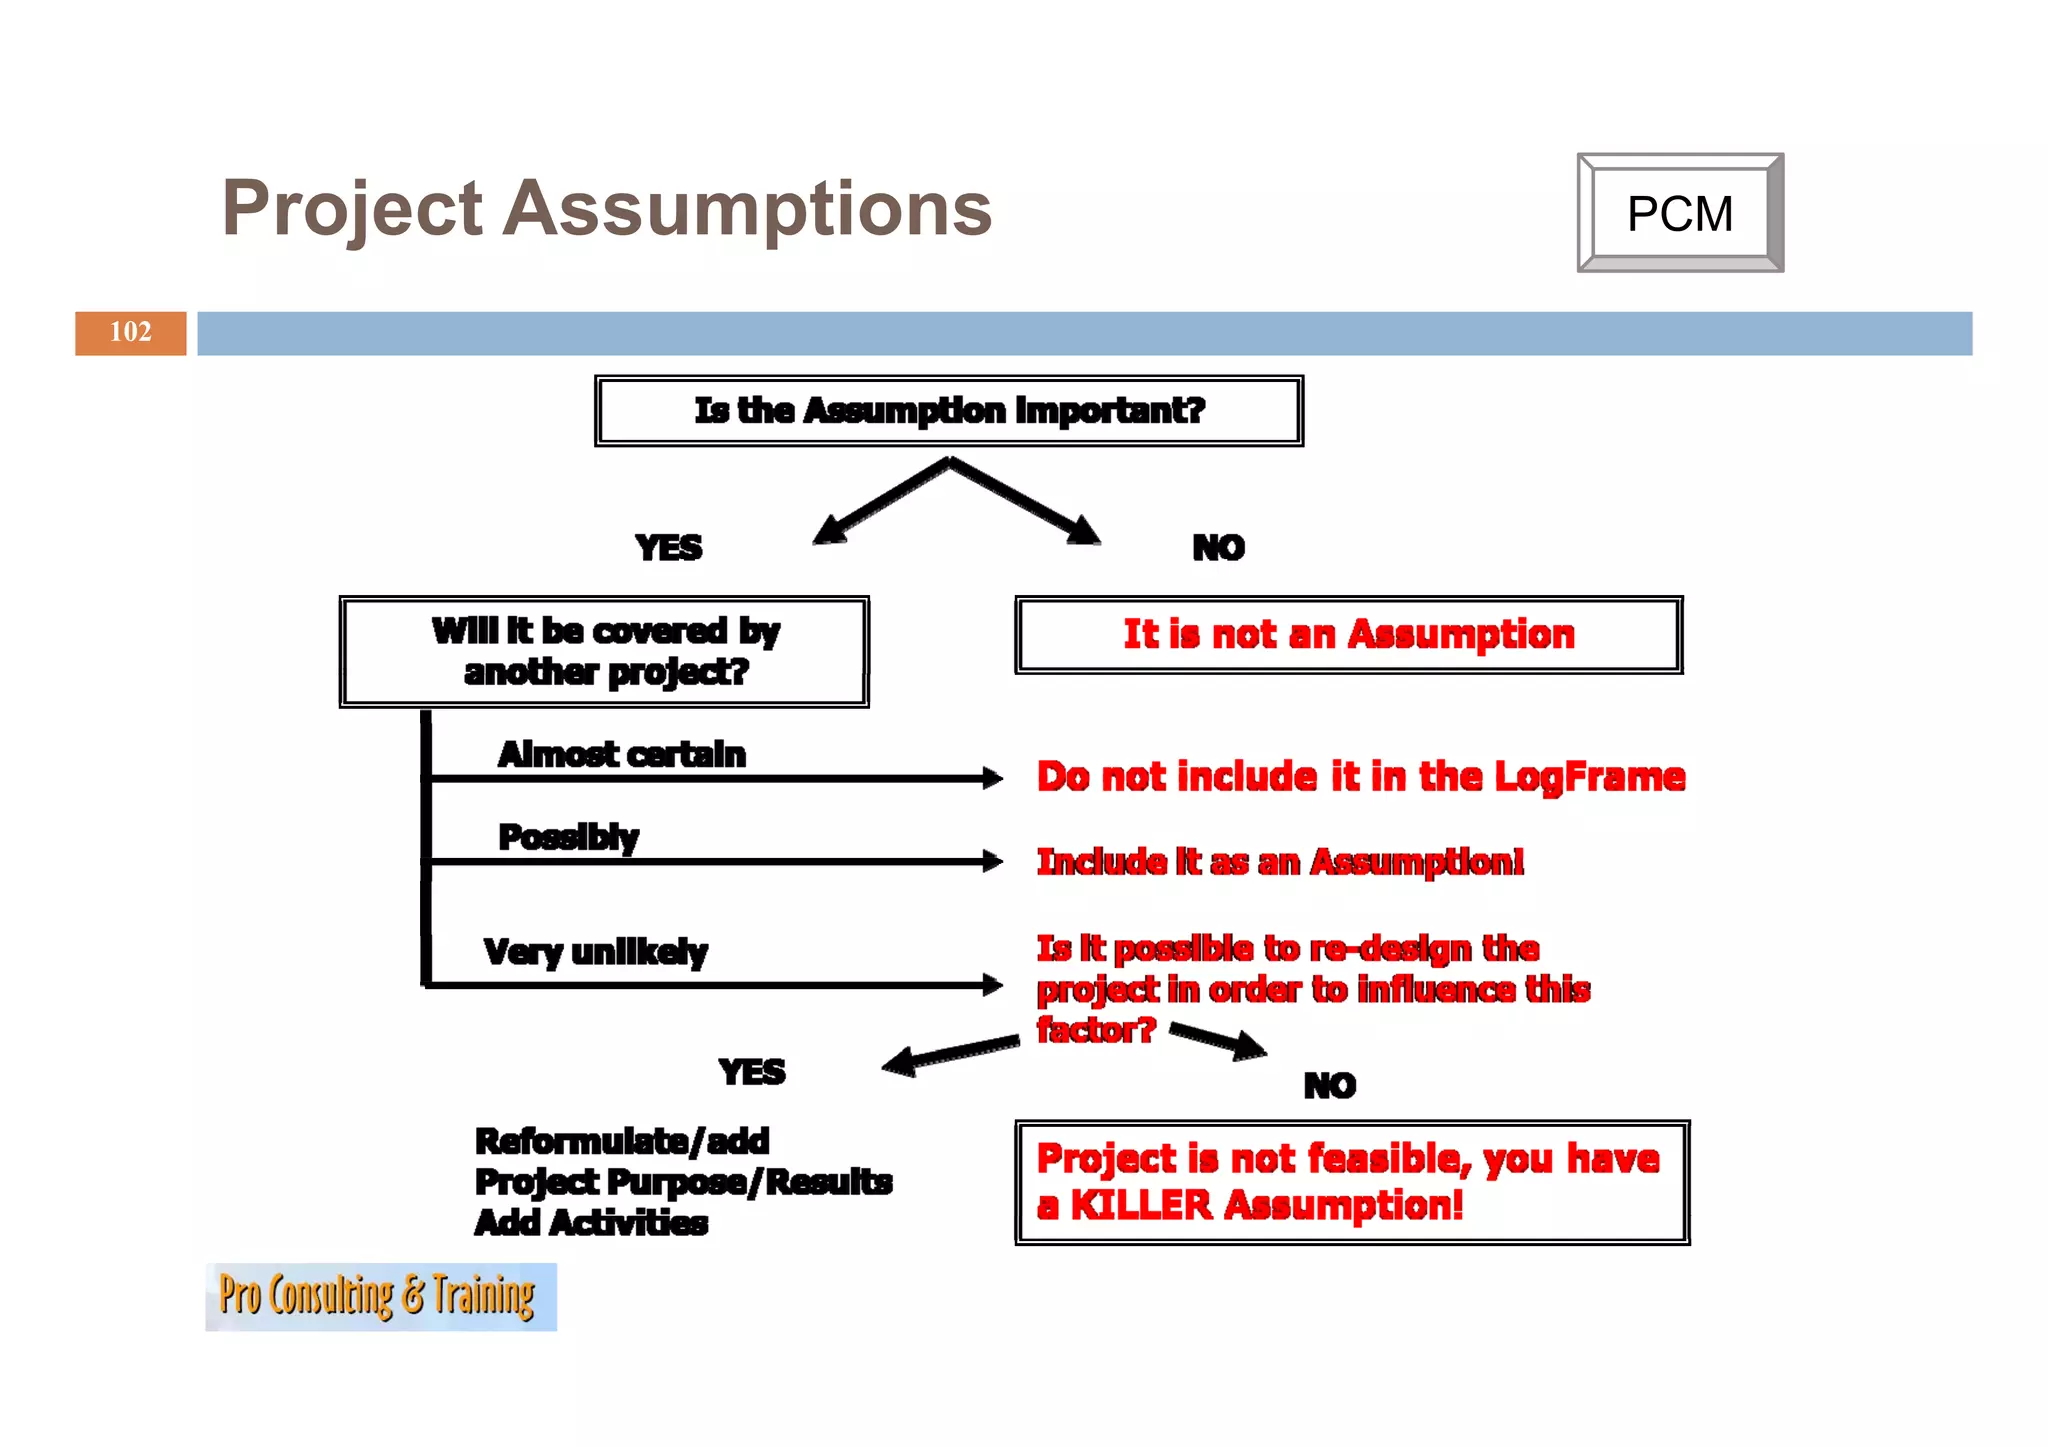
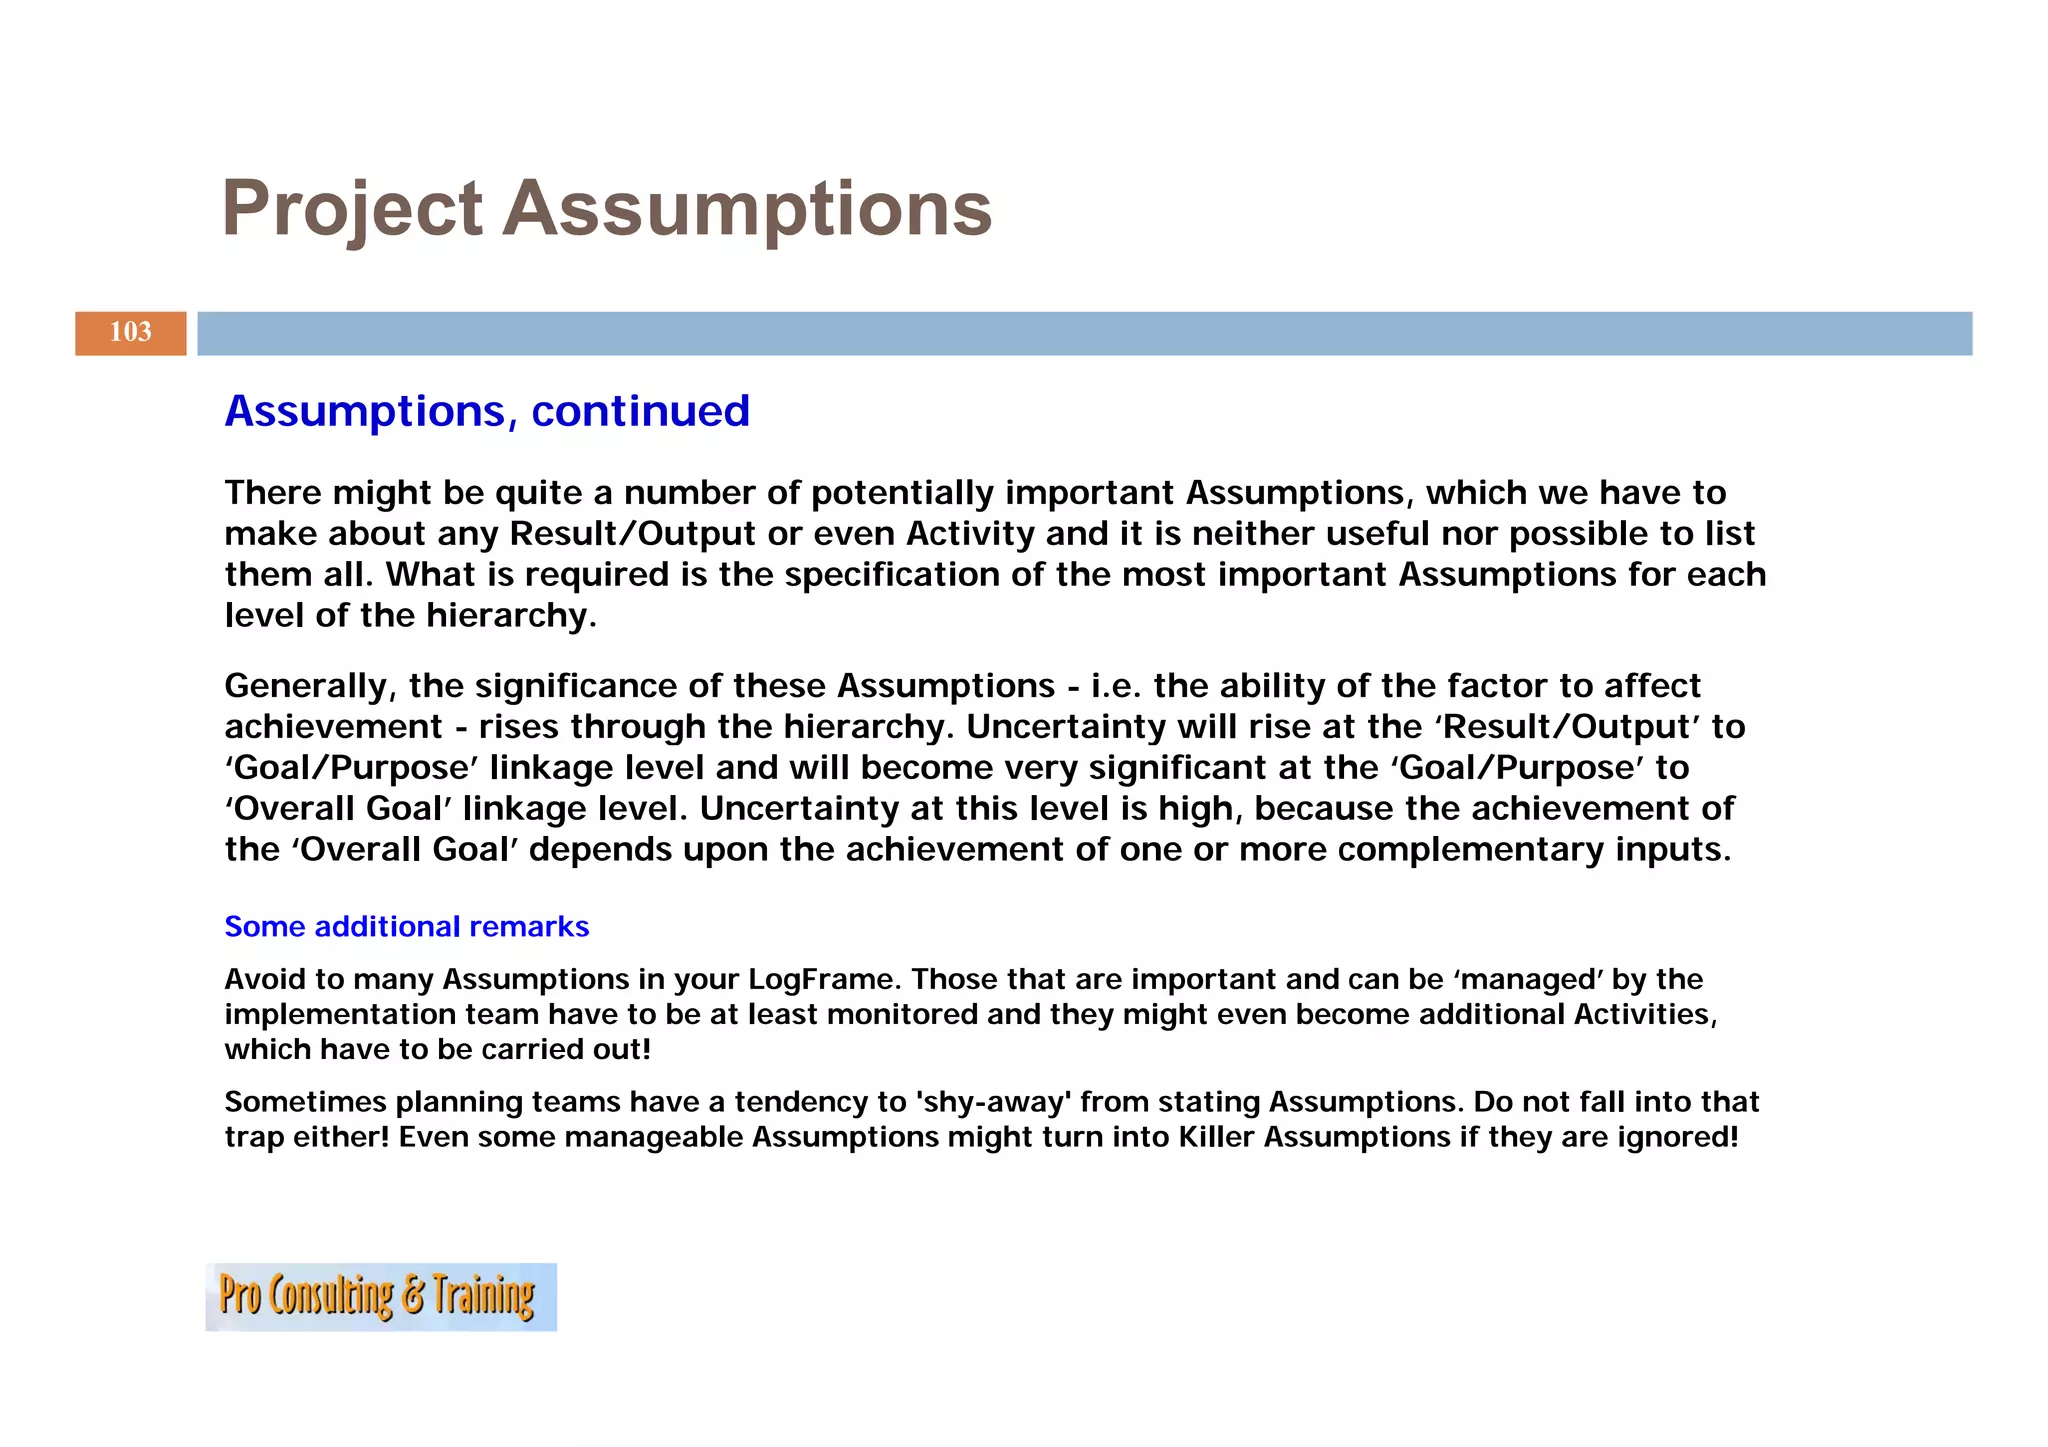
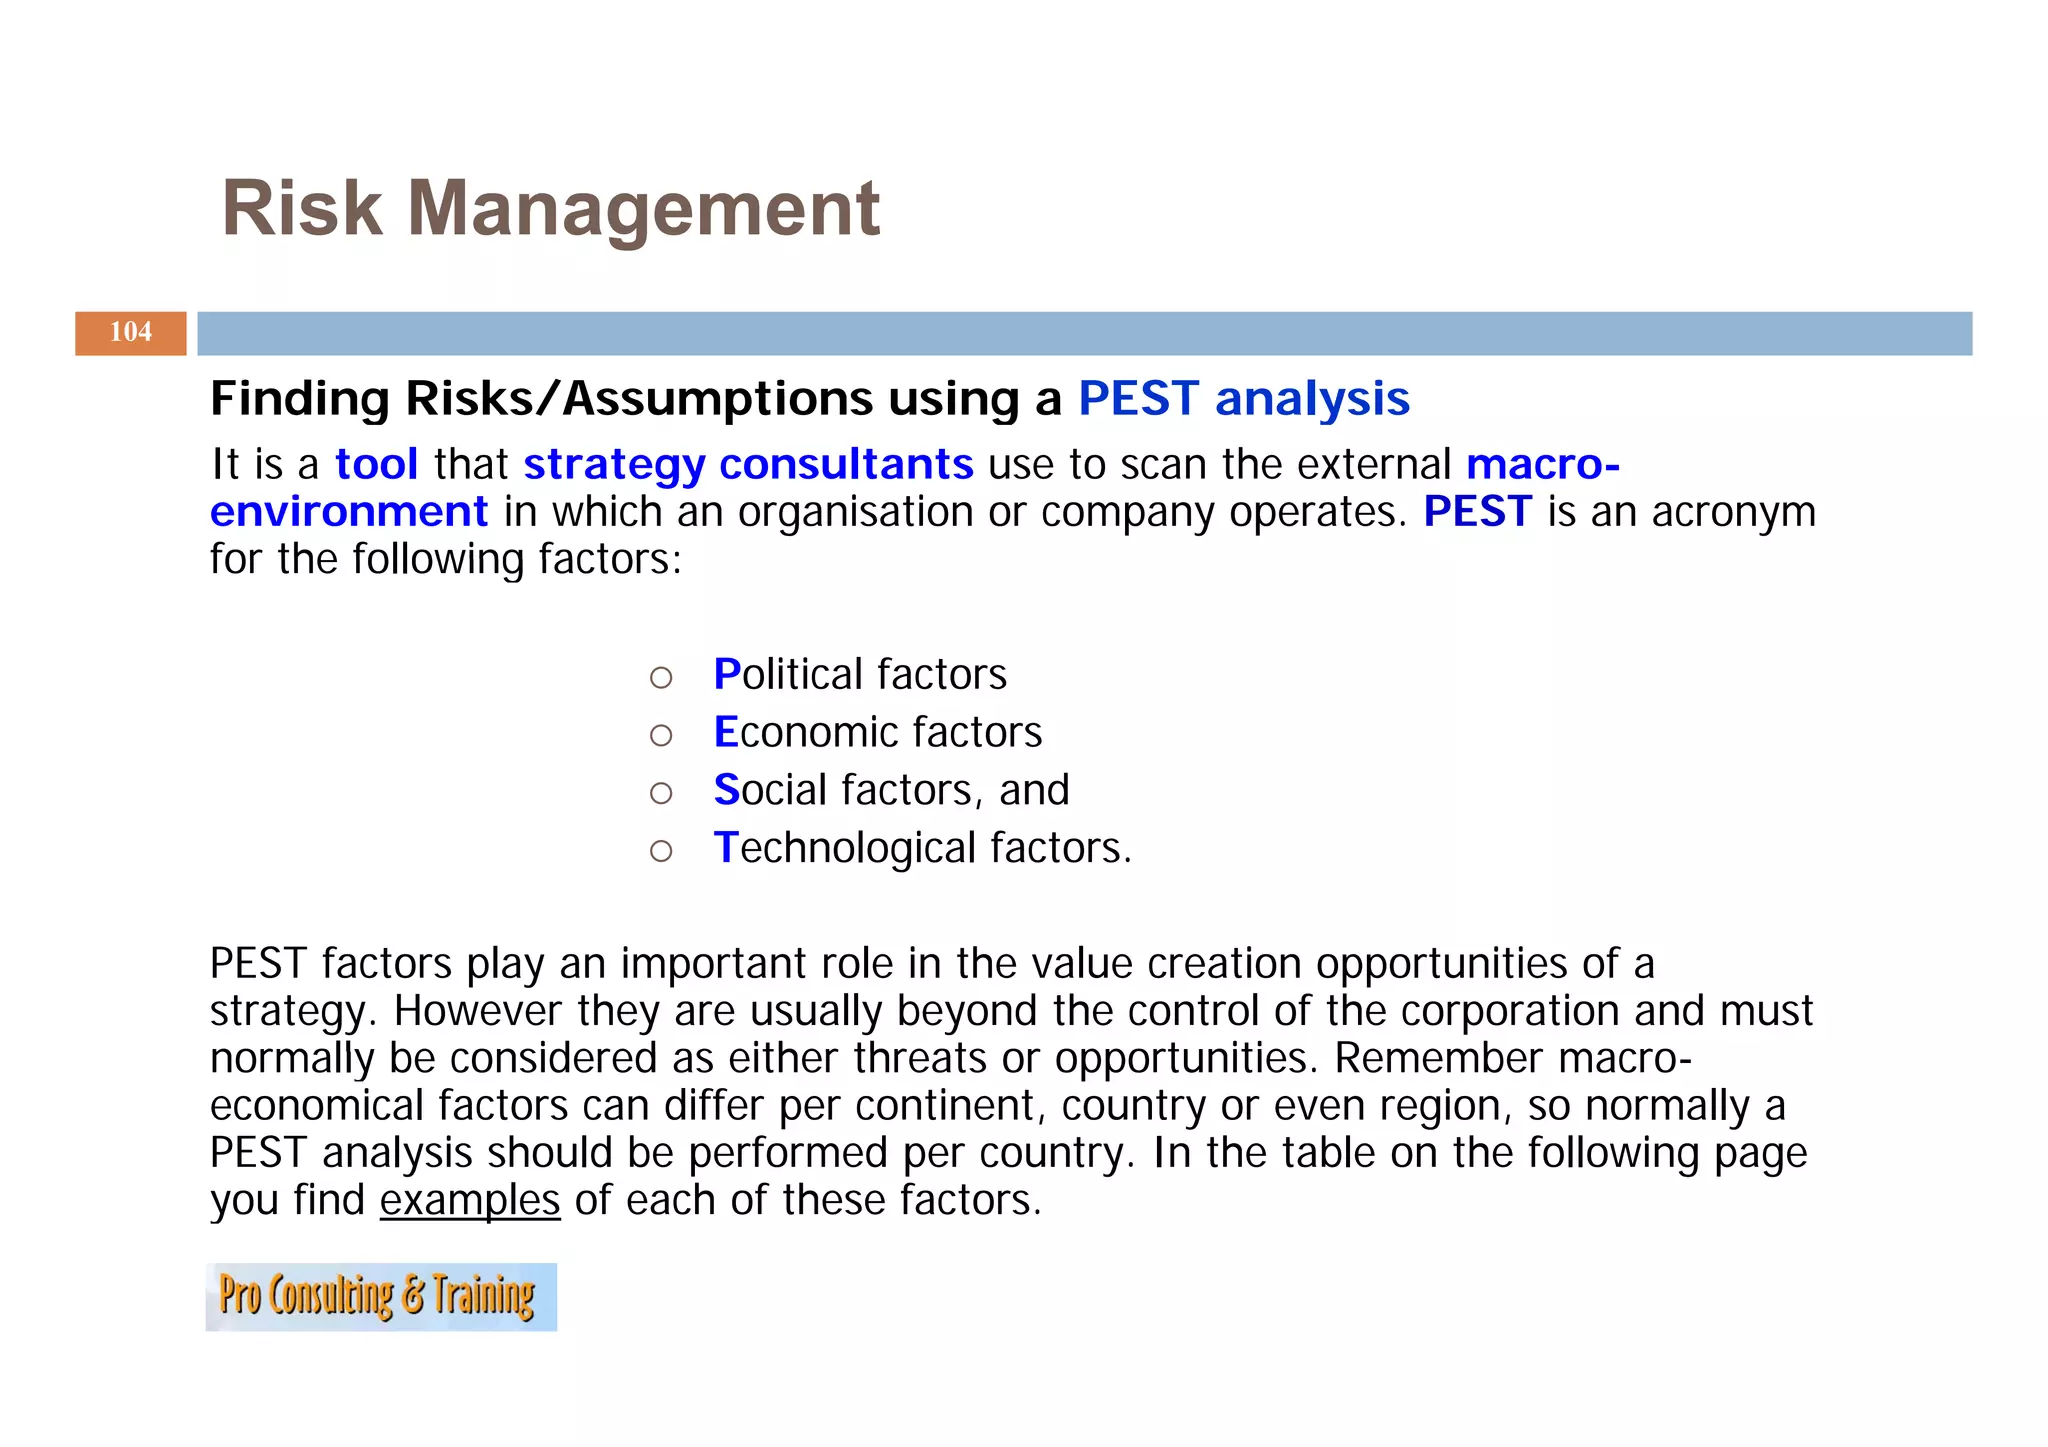
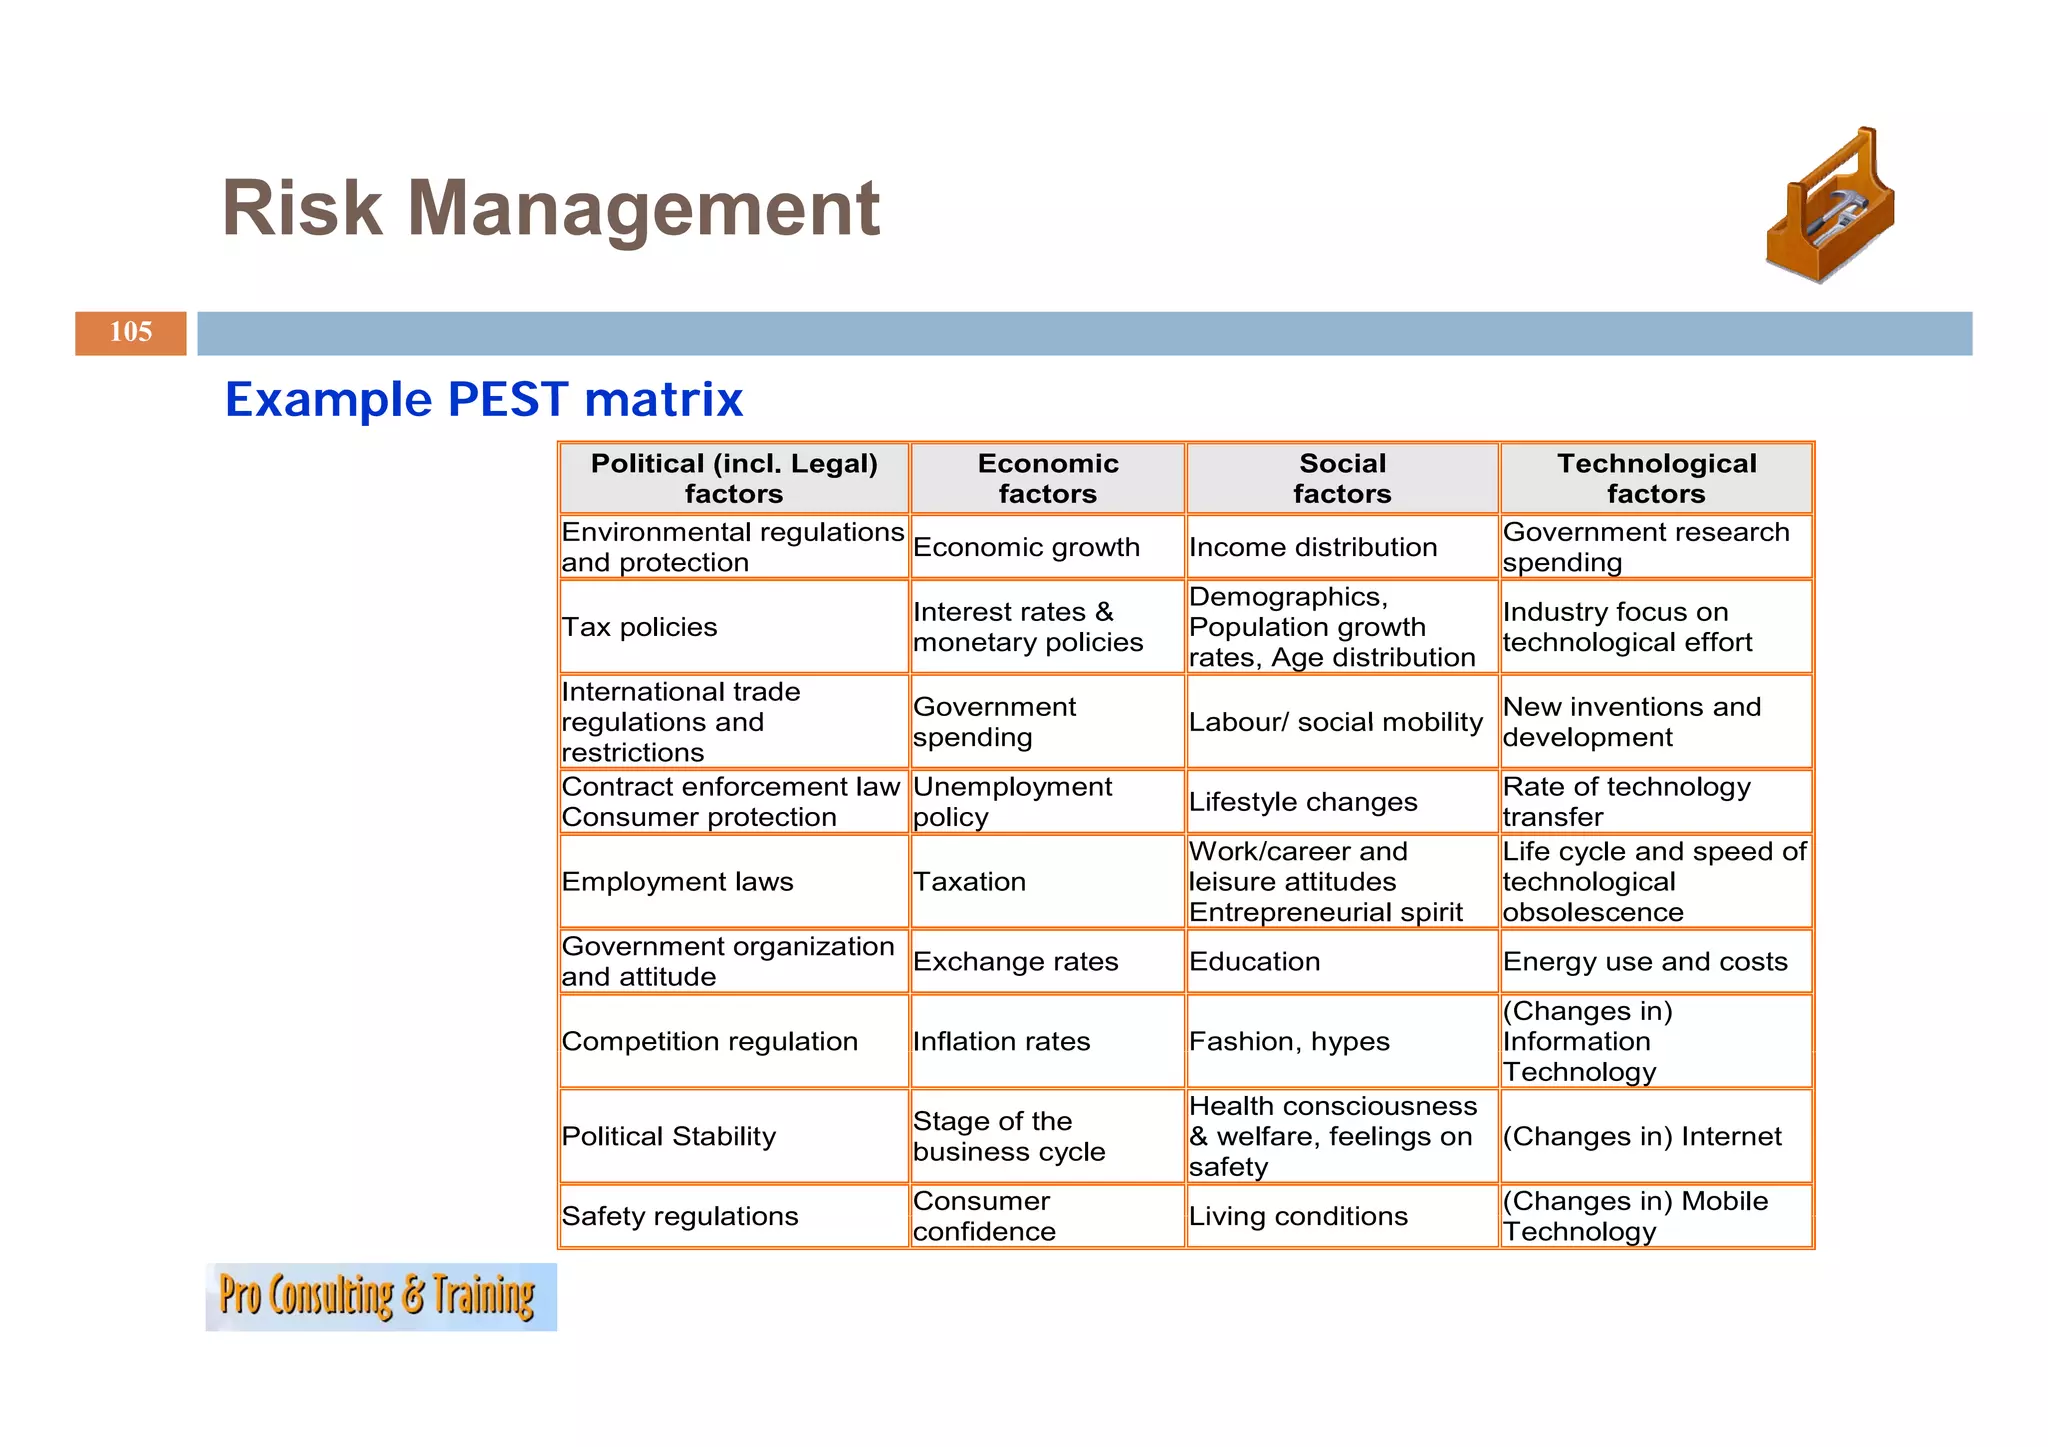
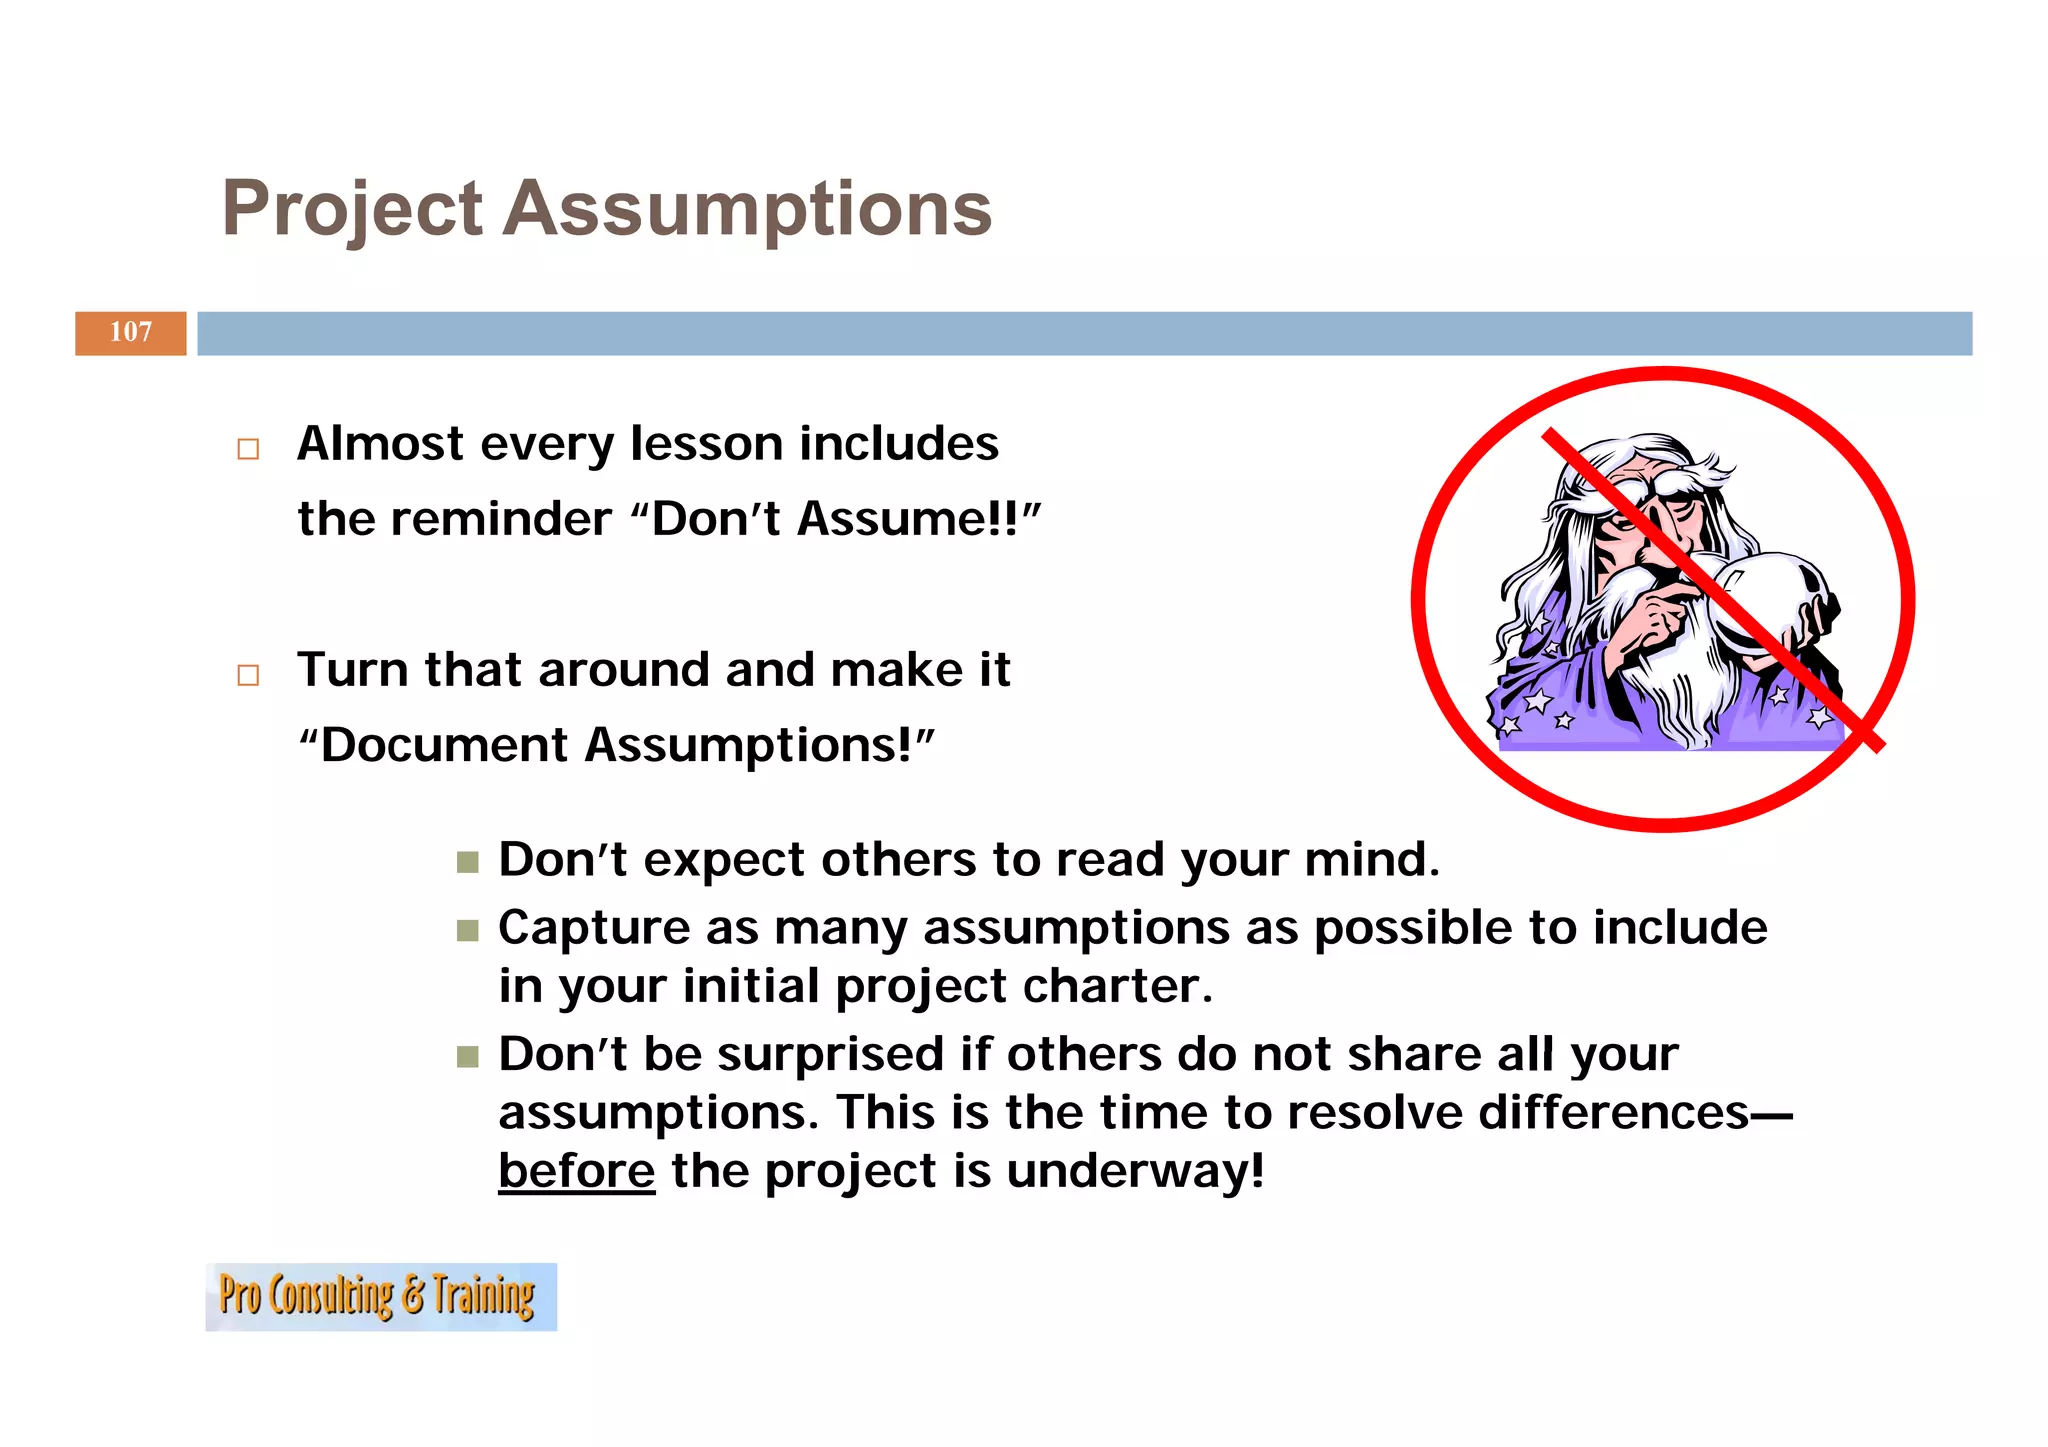
Overview of risk management processes, identifying risks, and addressing project assumptions.
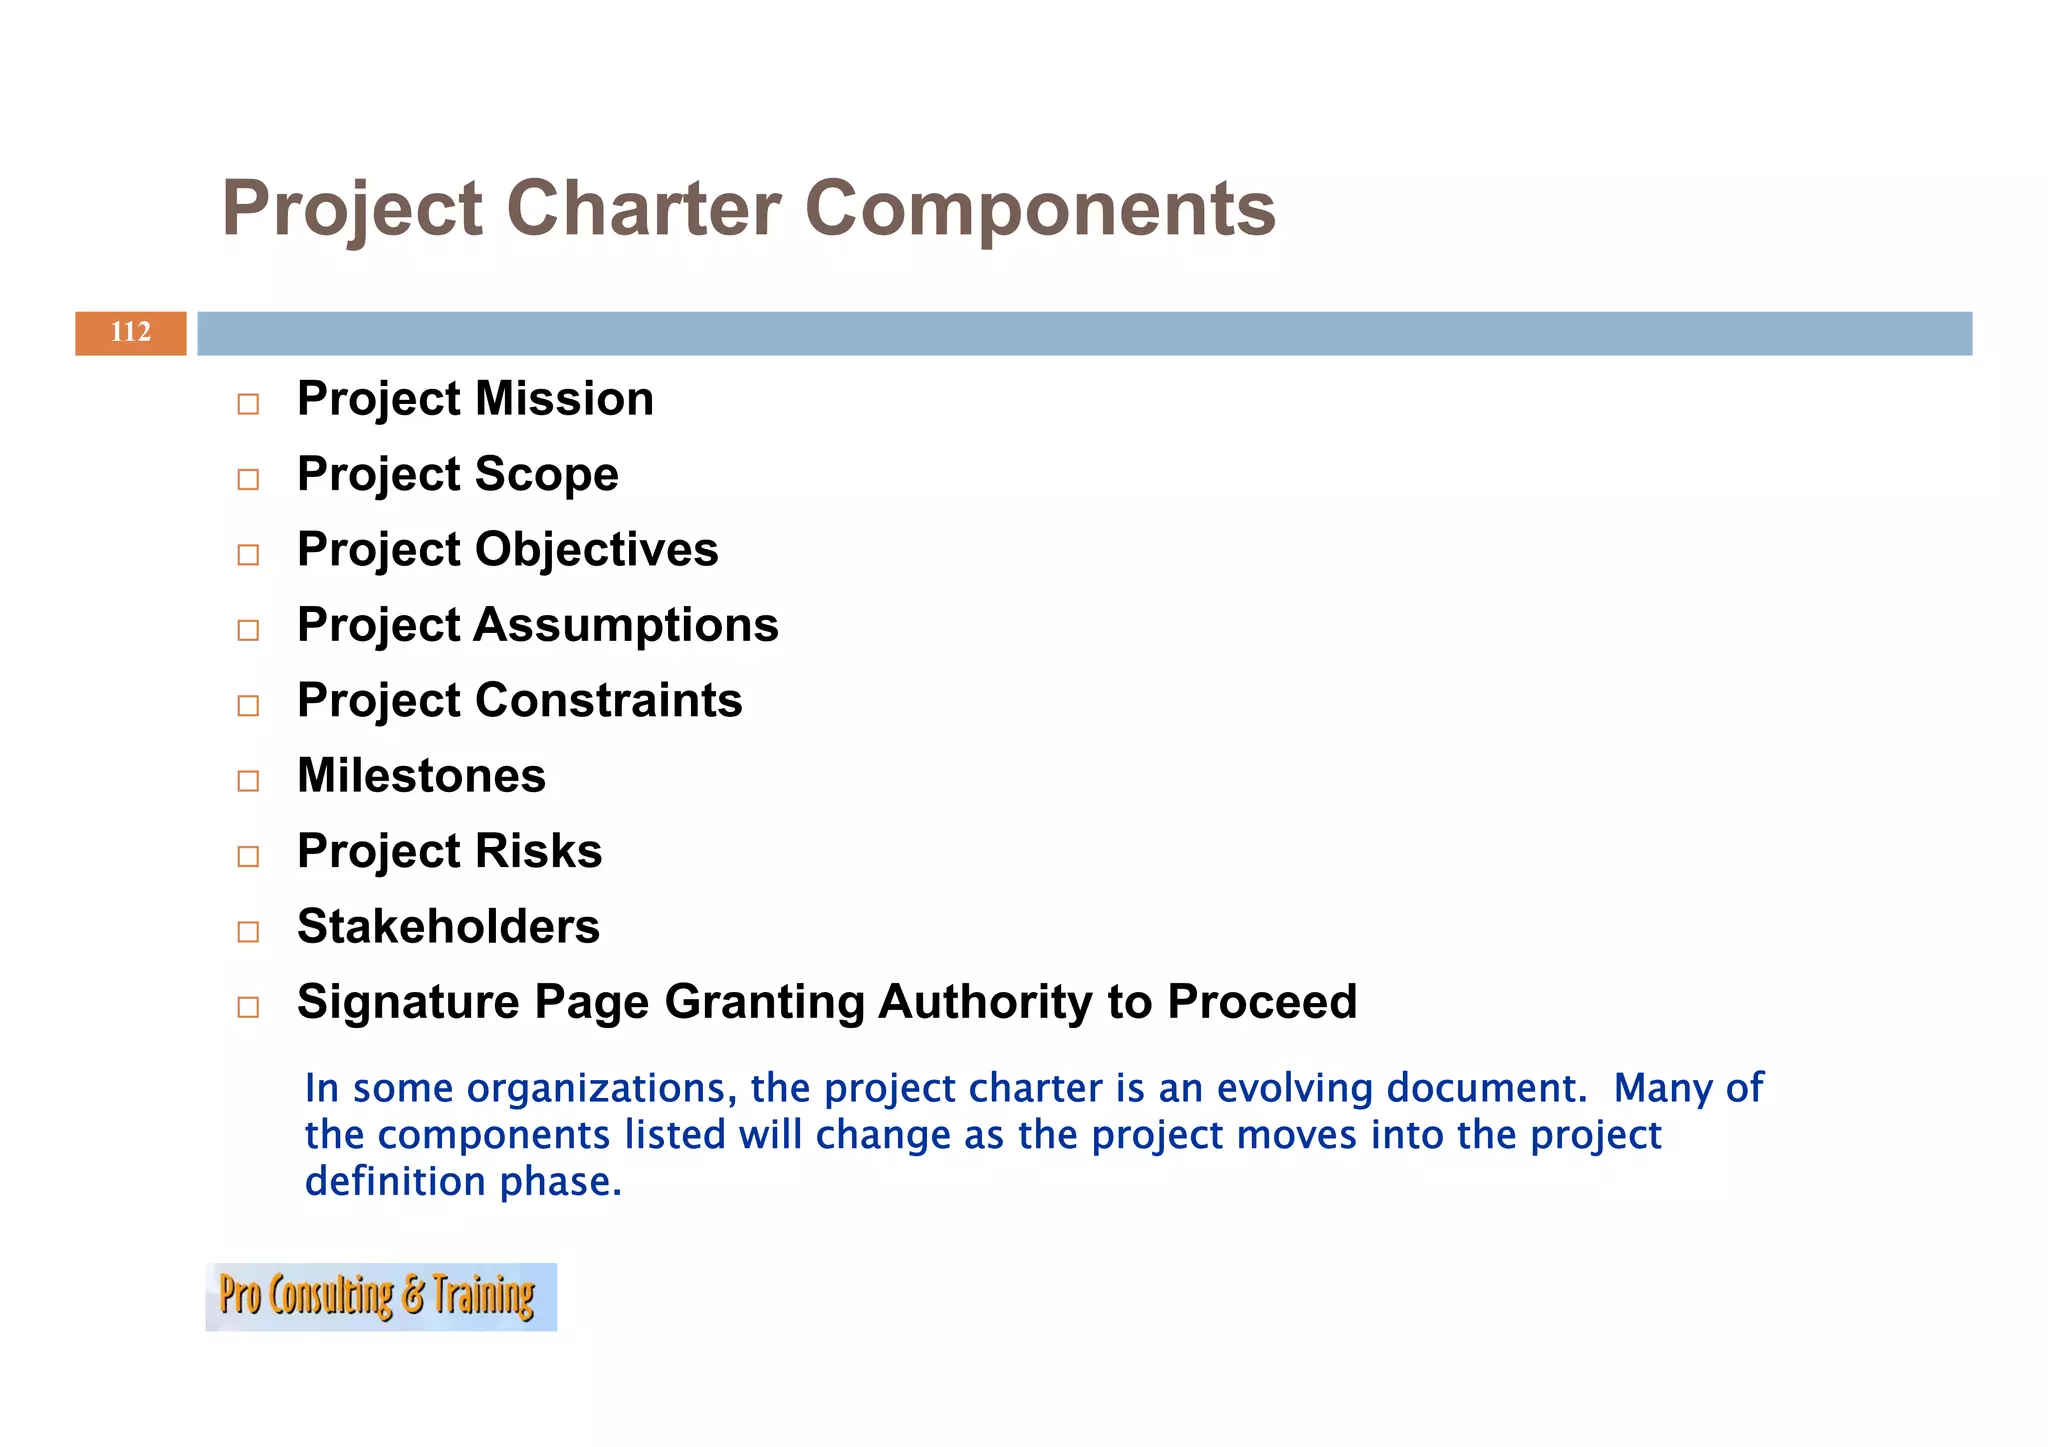
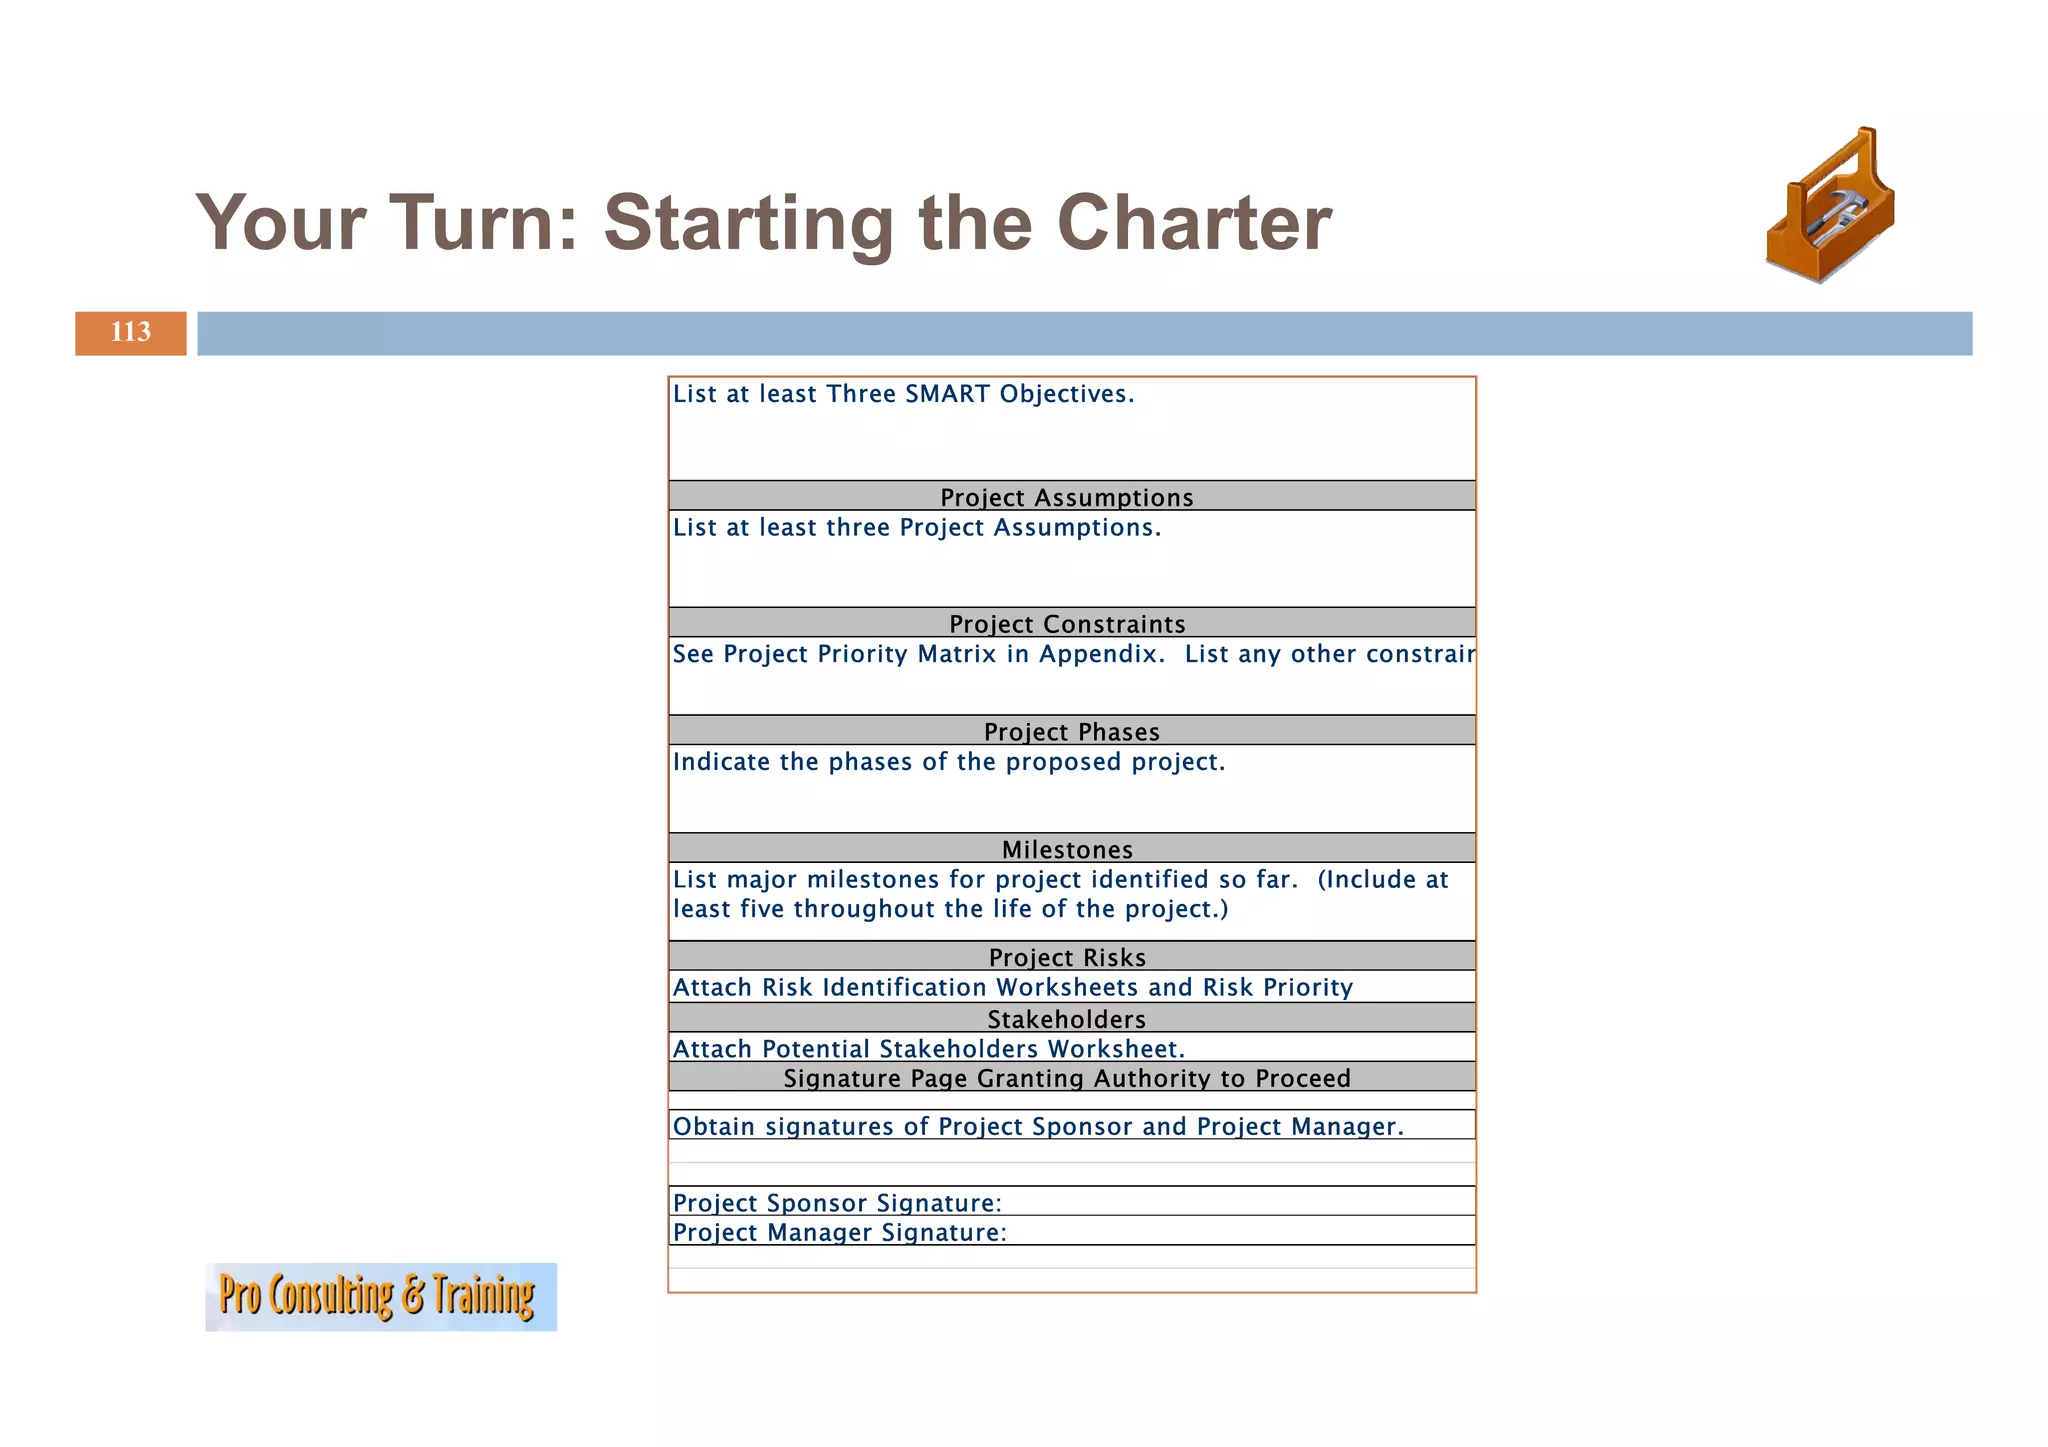
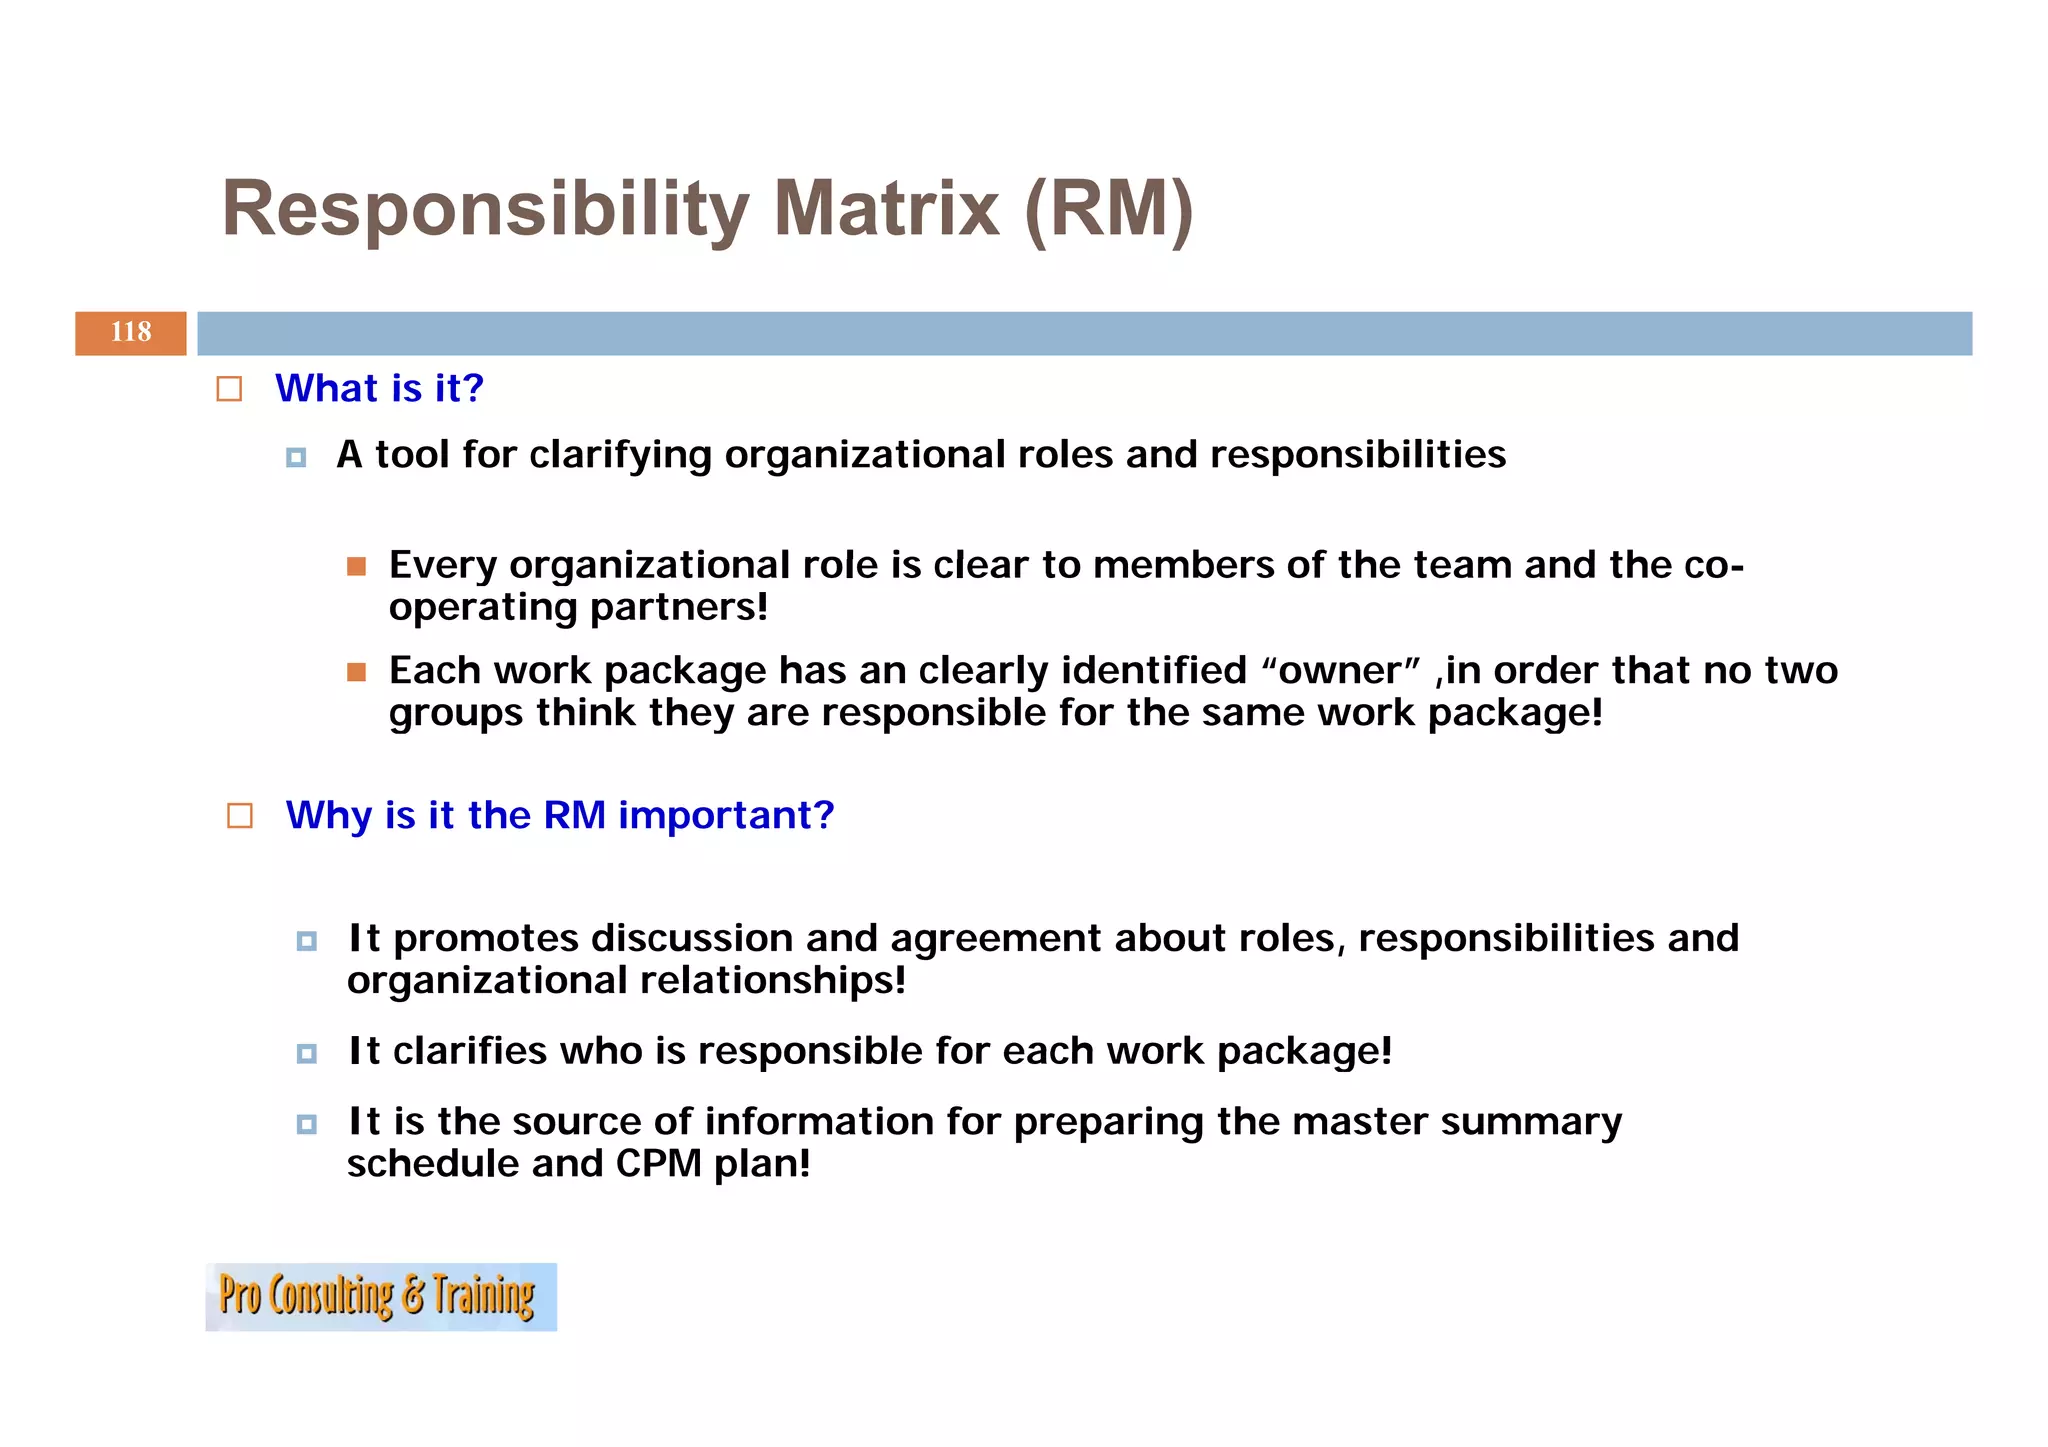
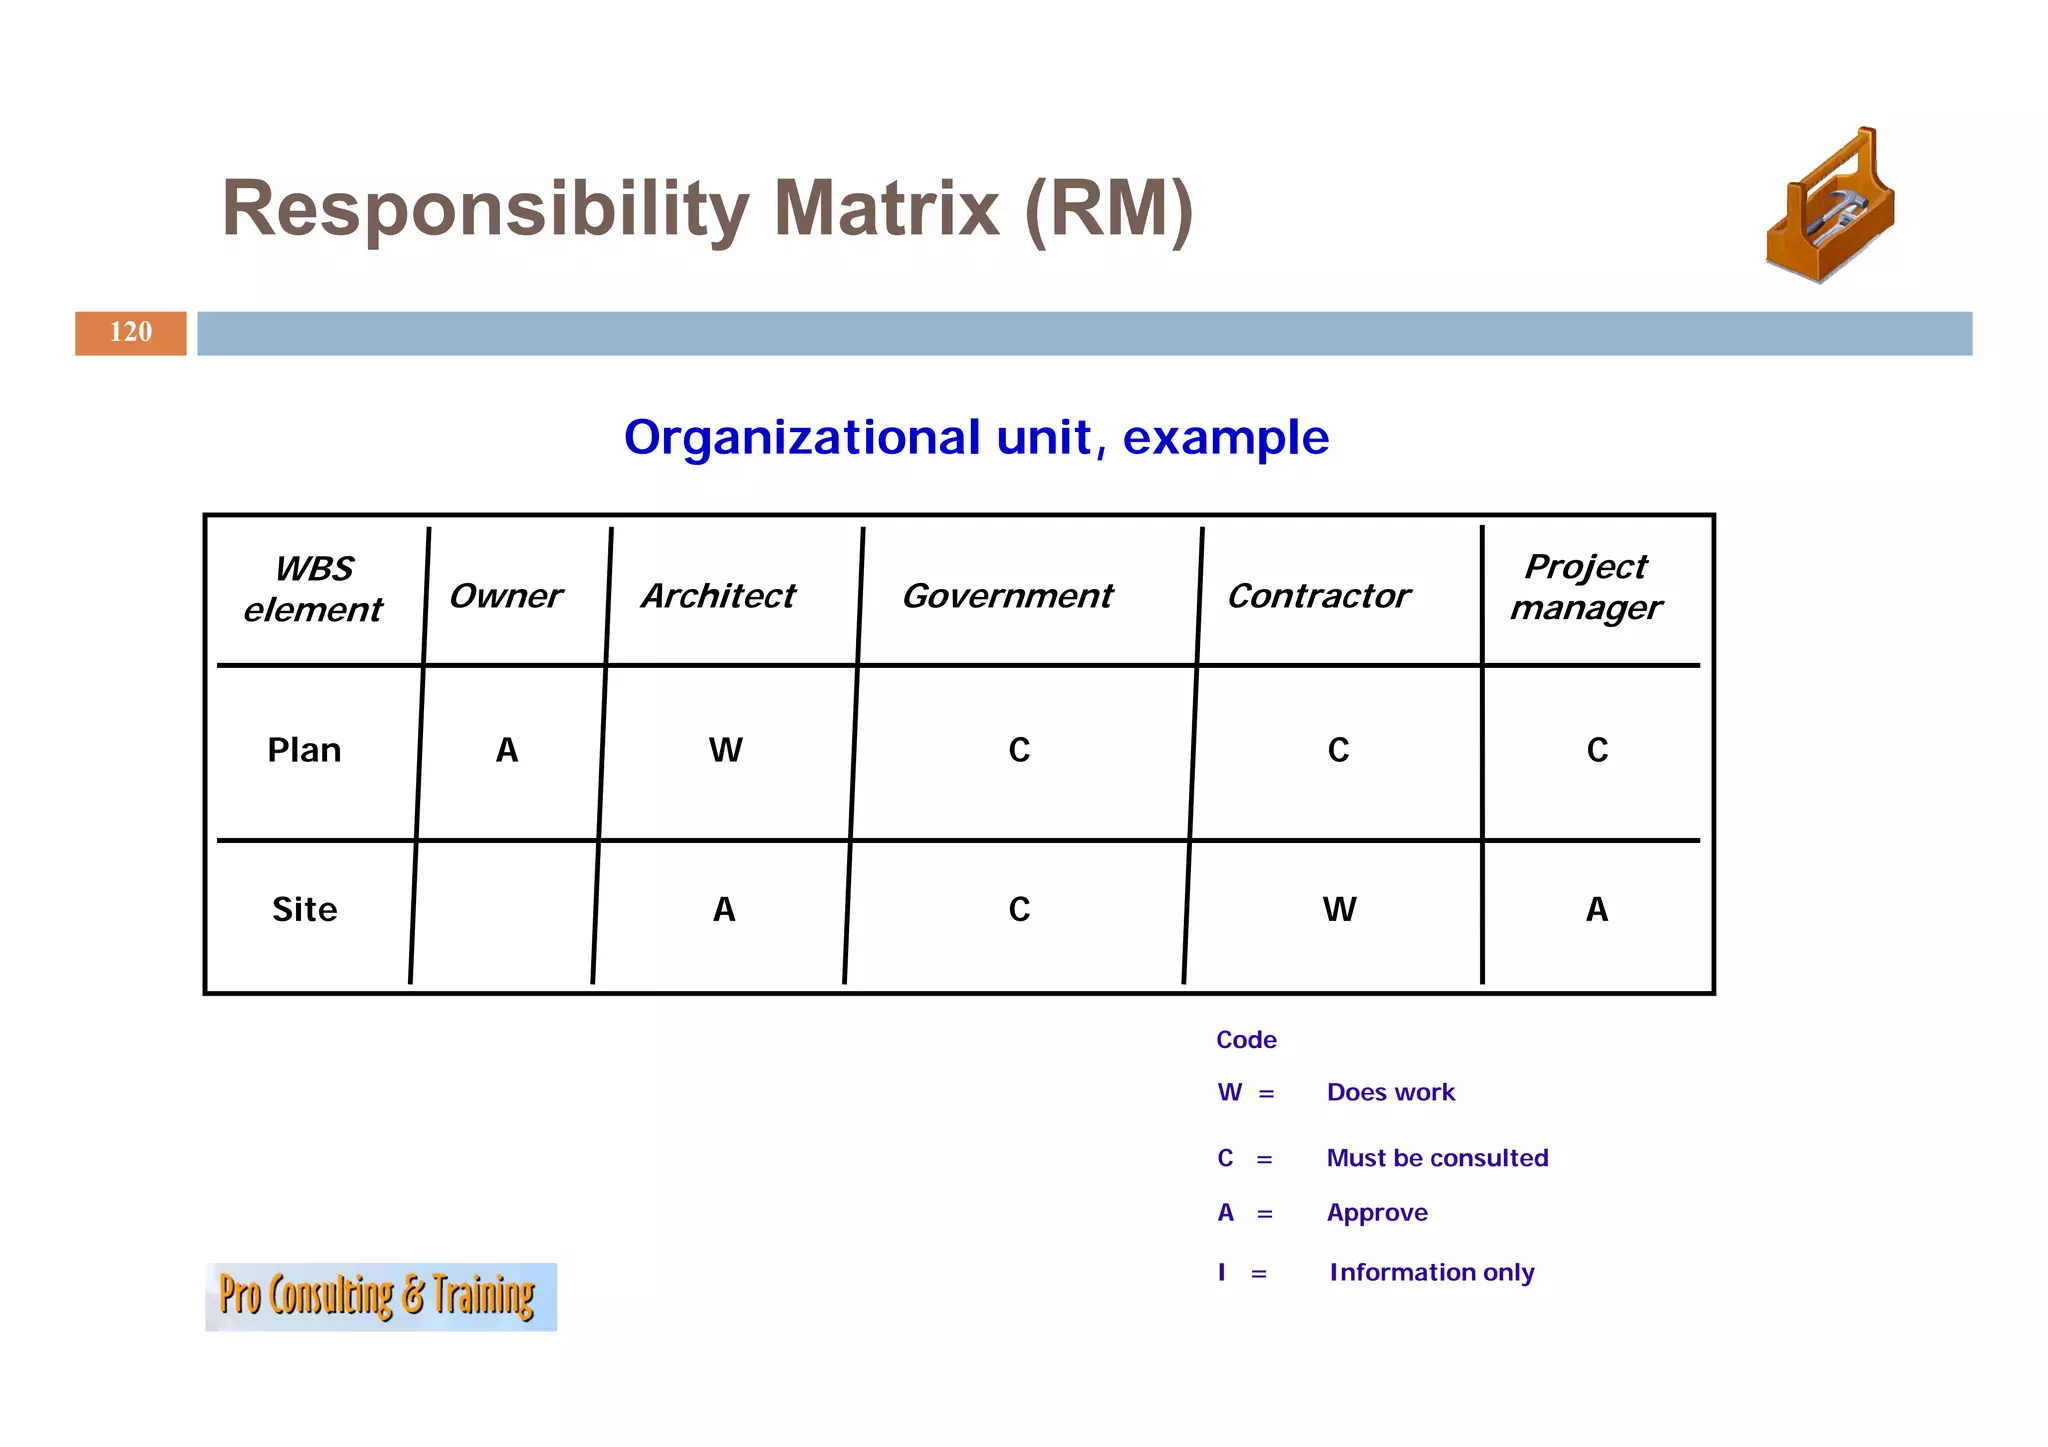
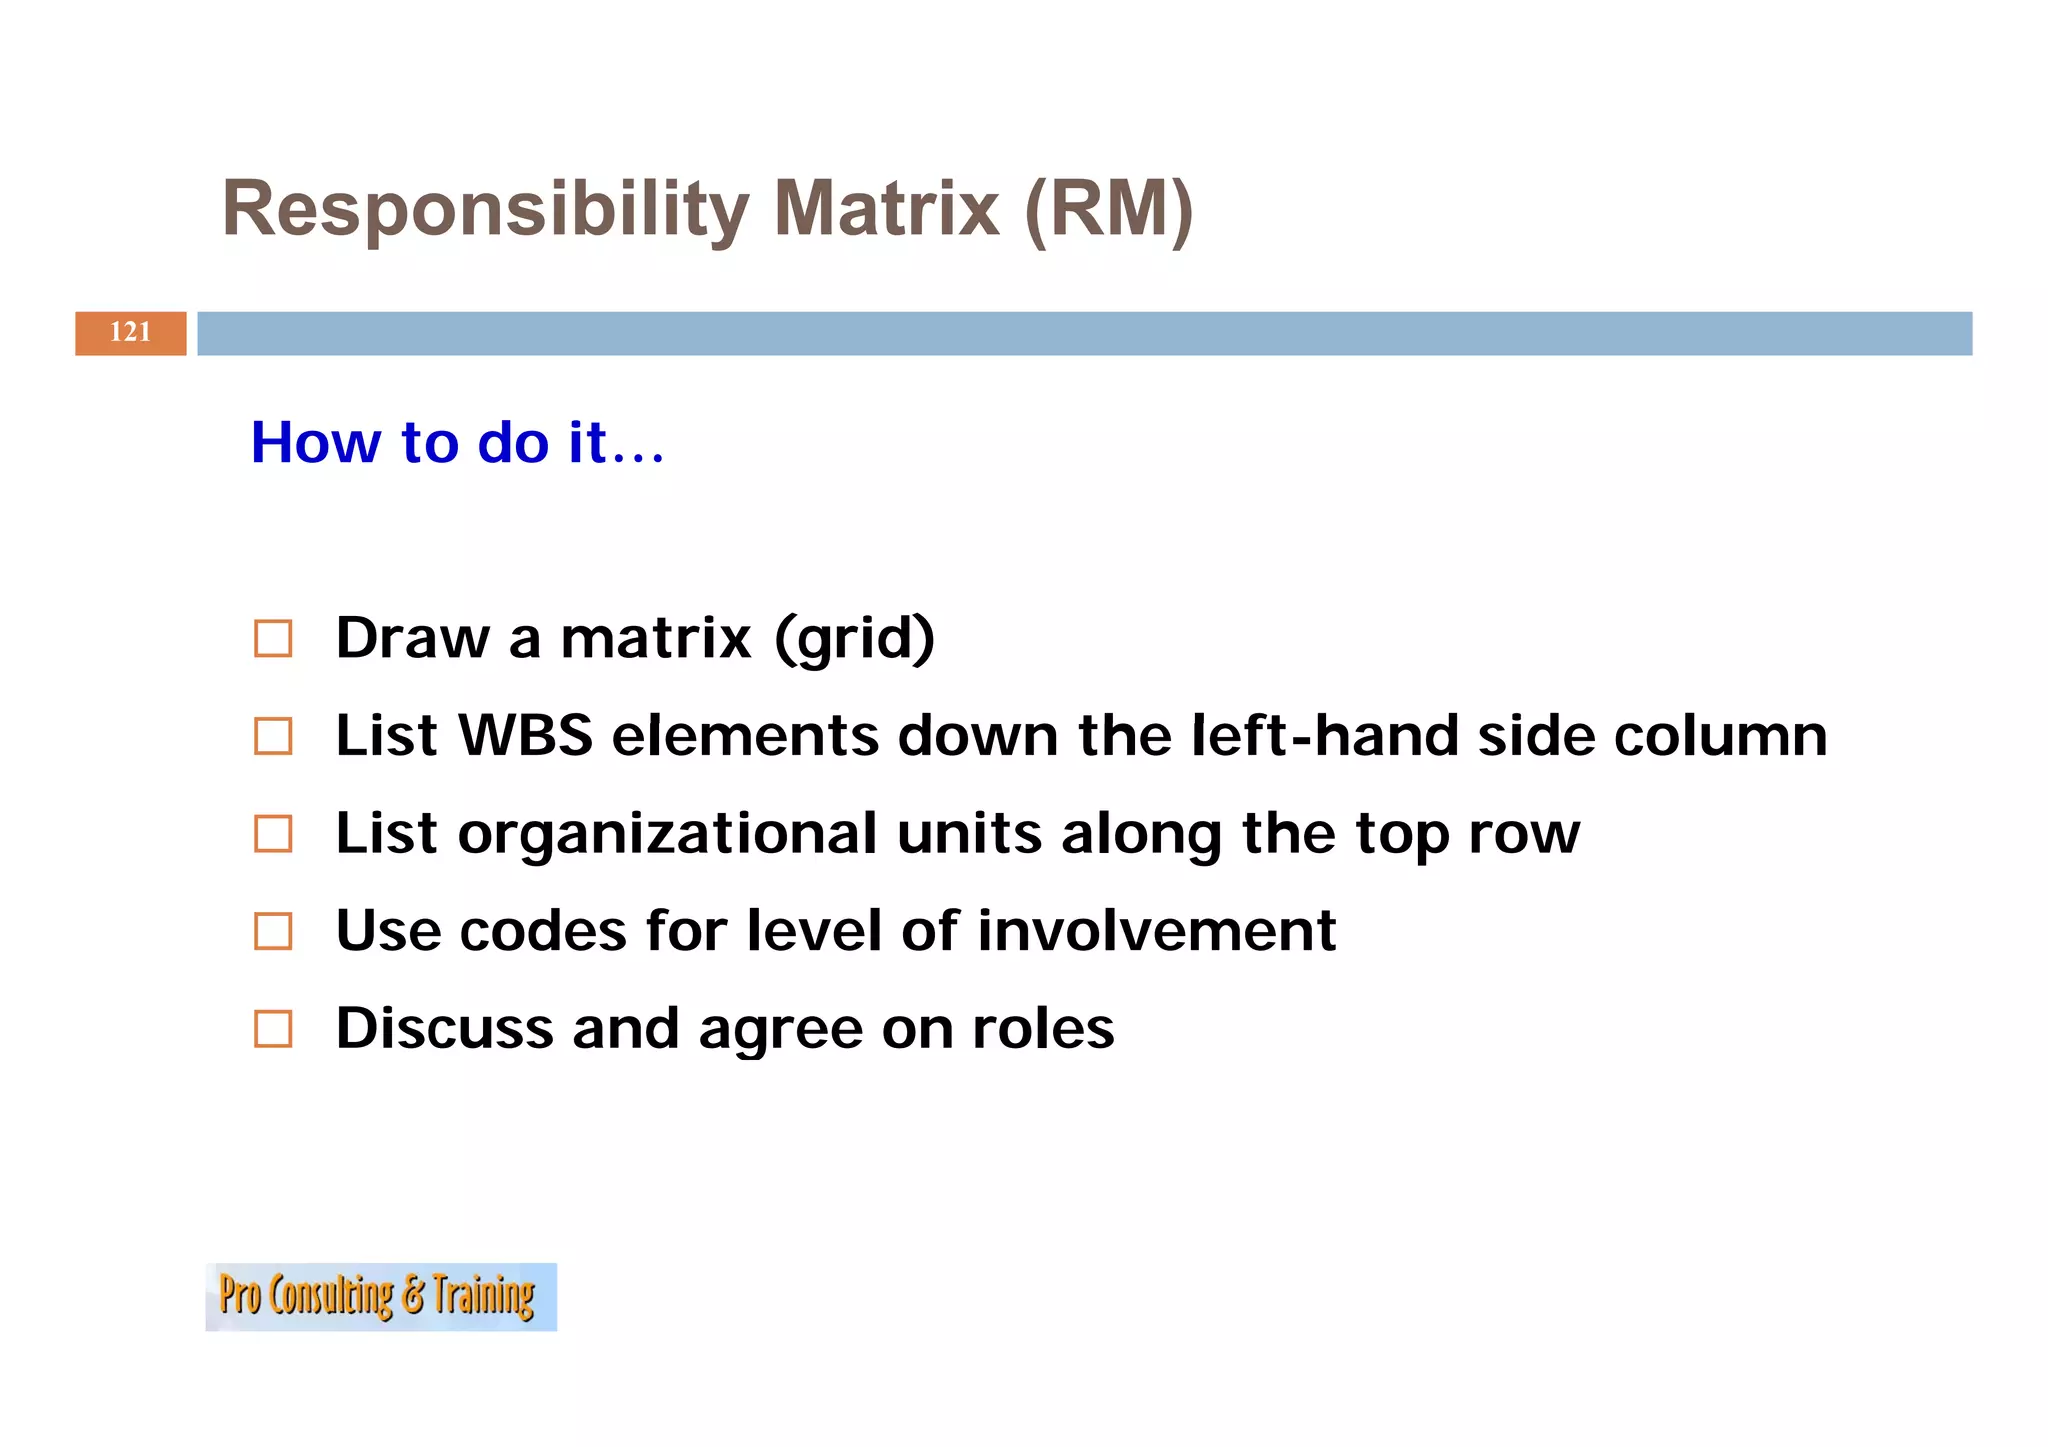
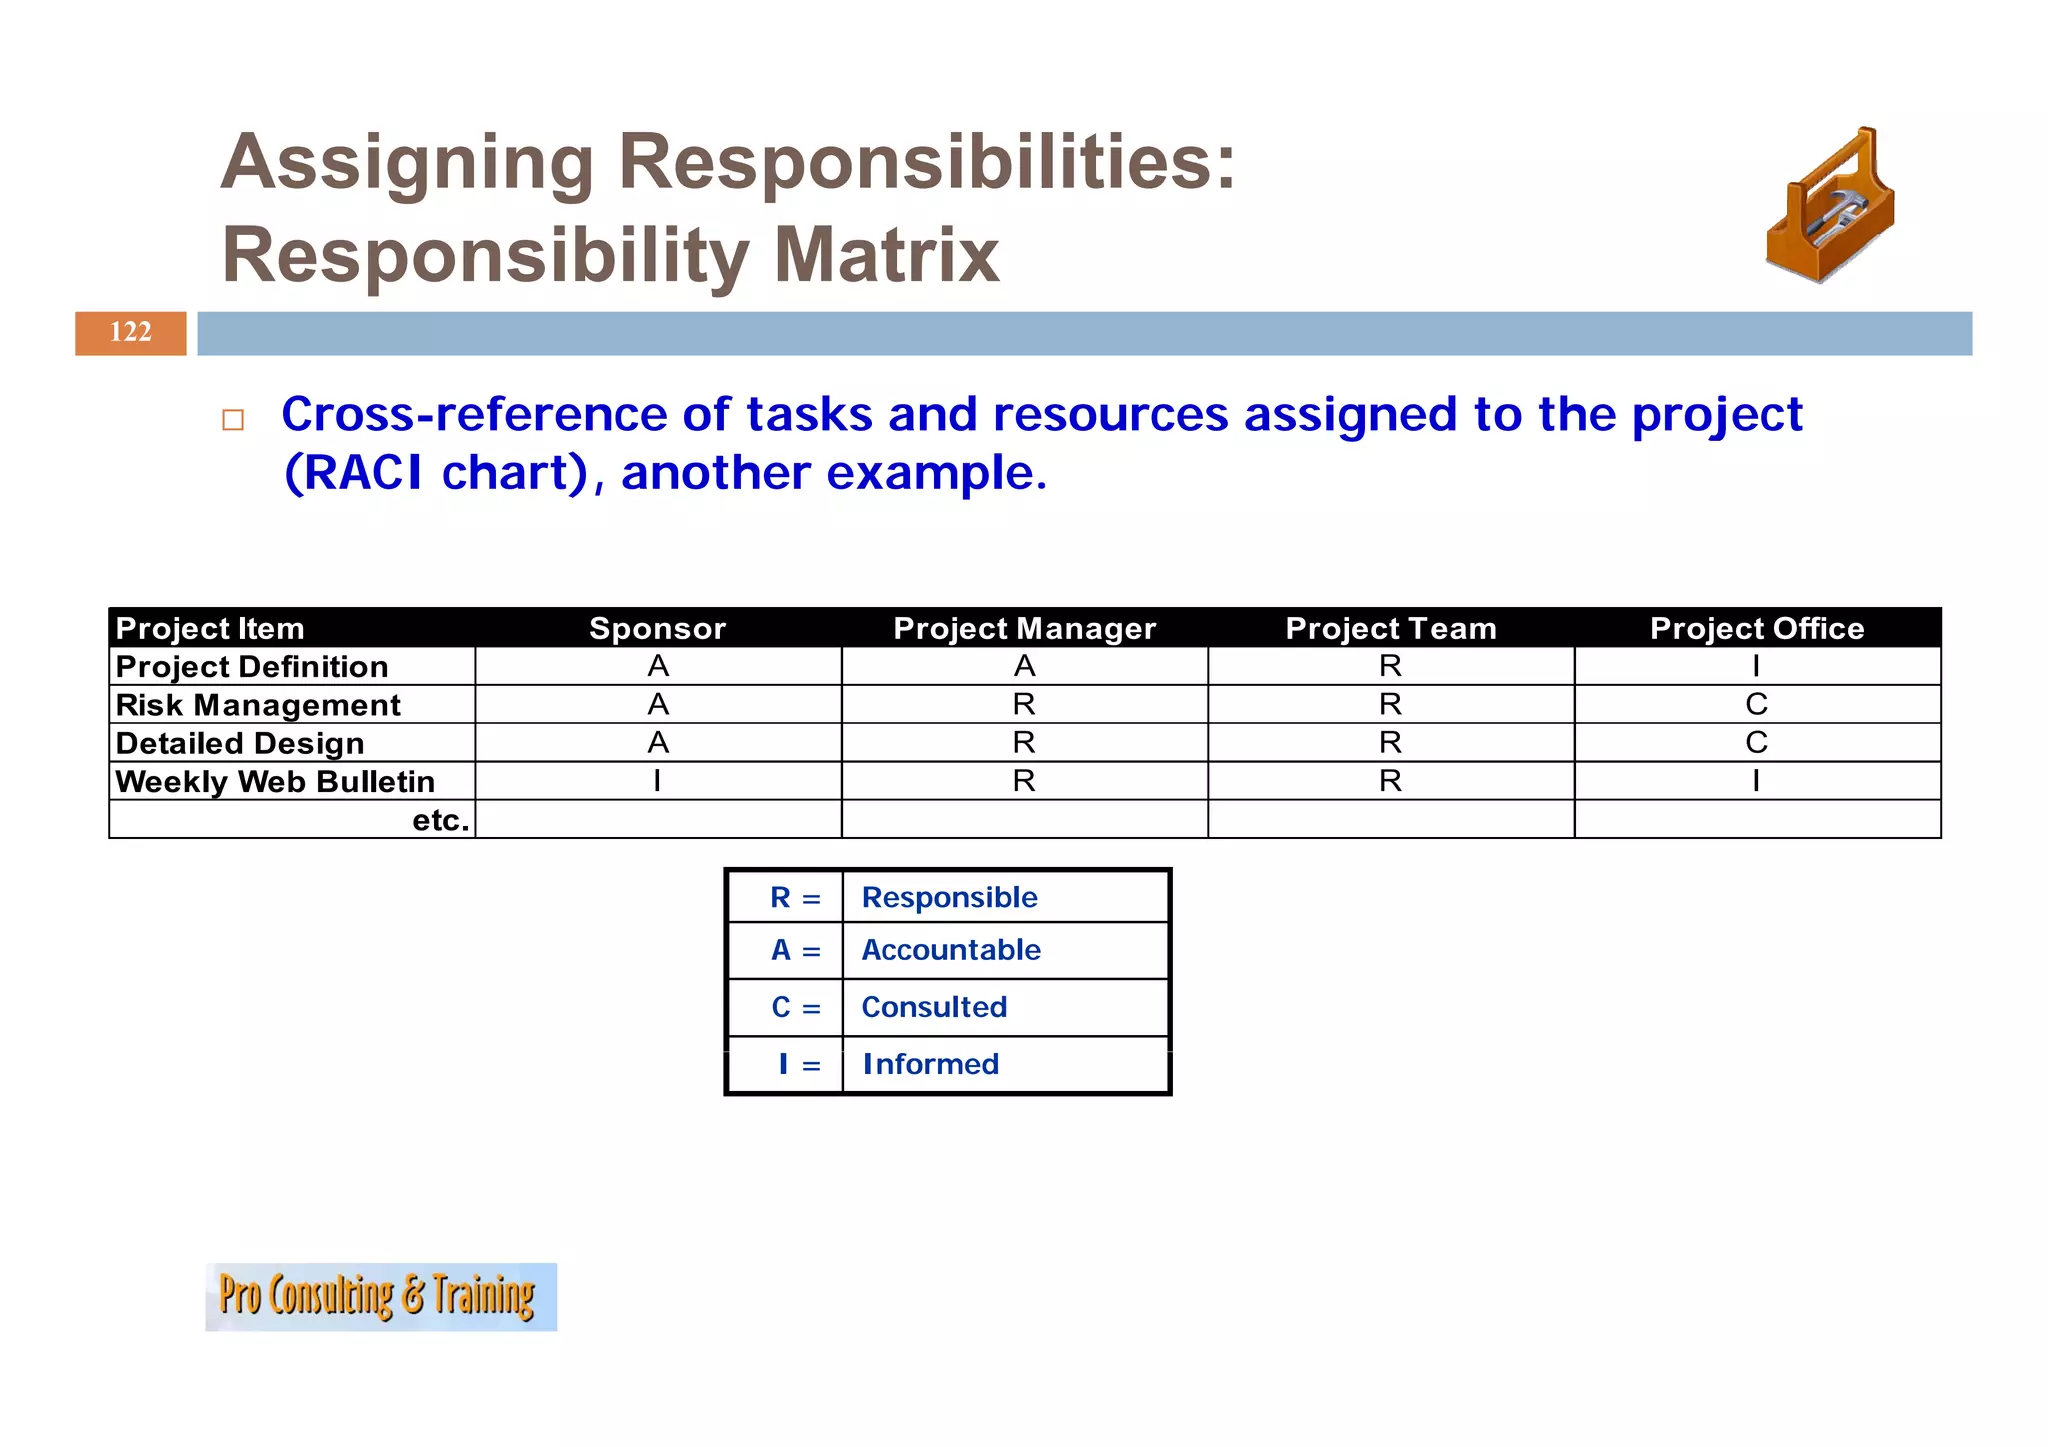
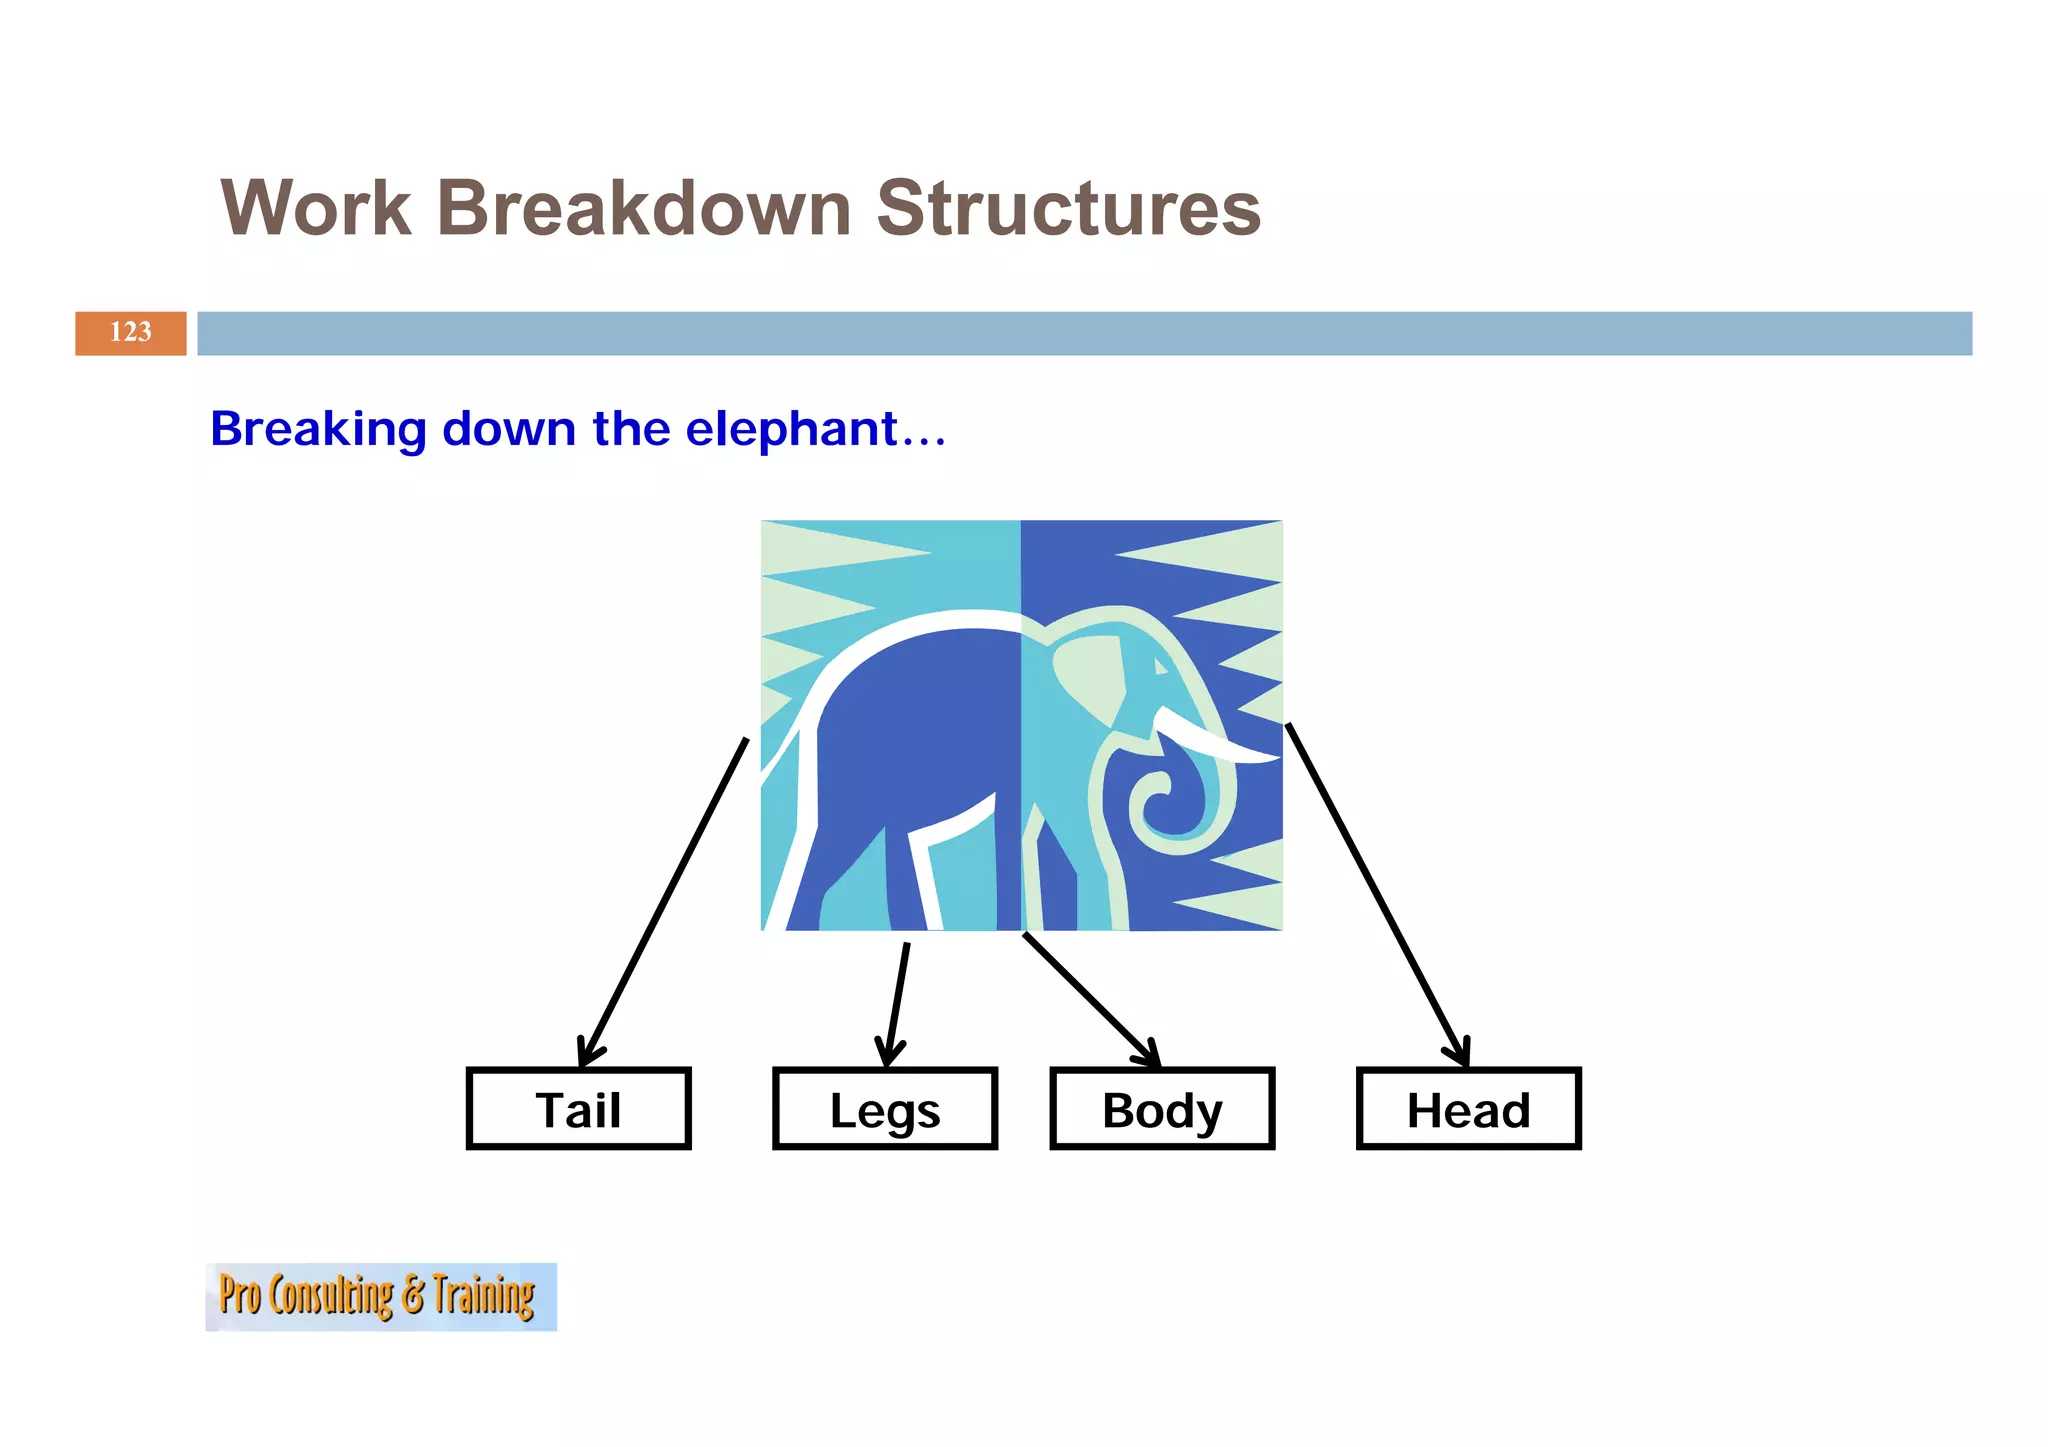
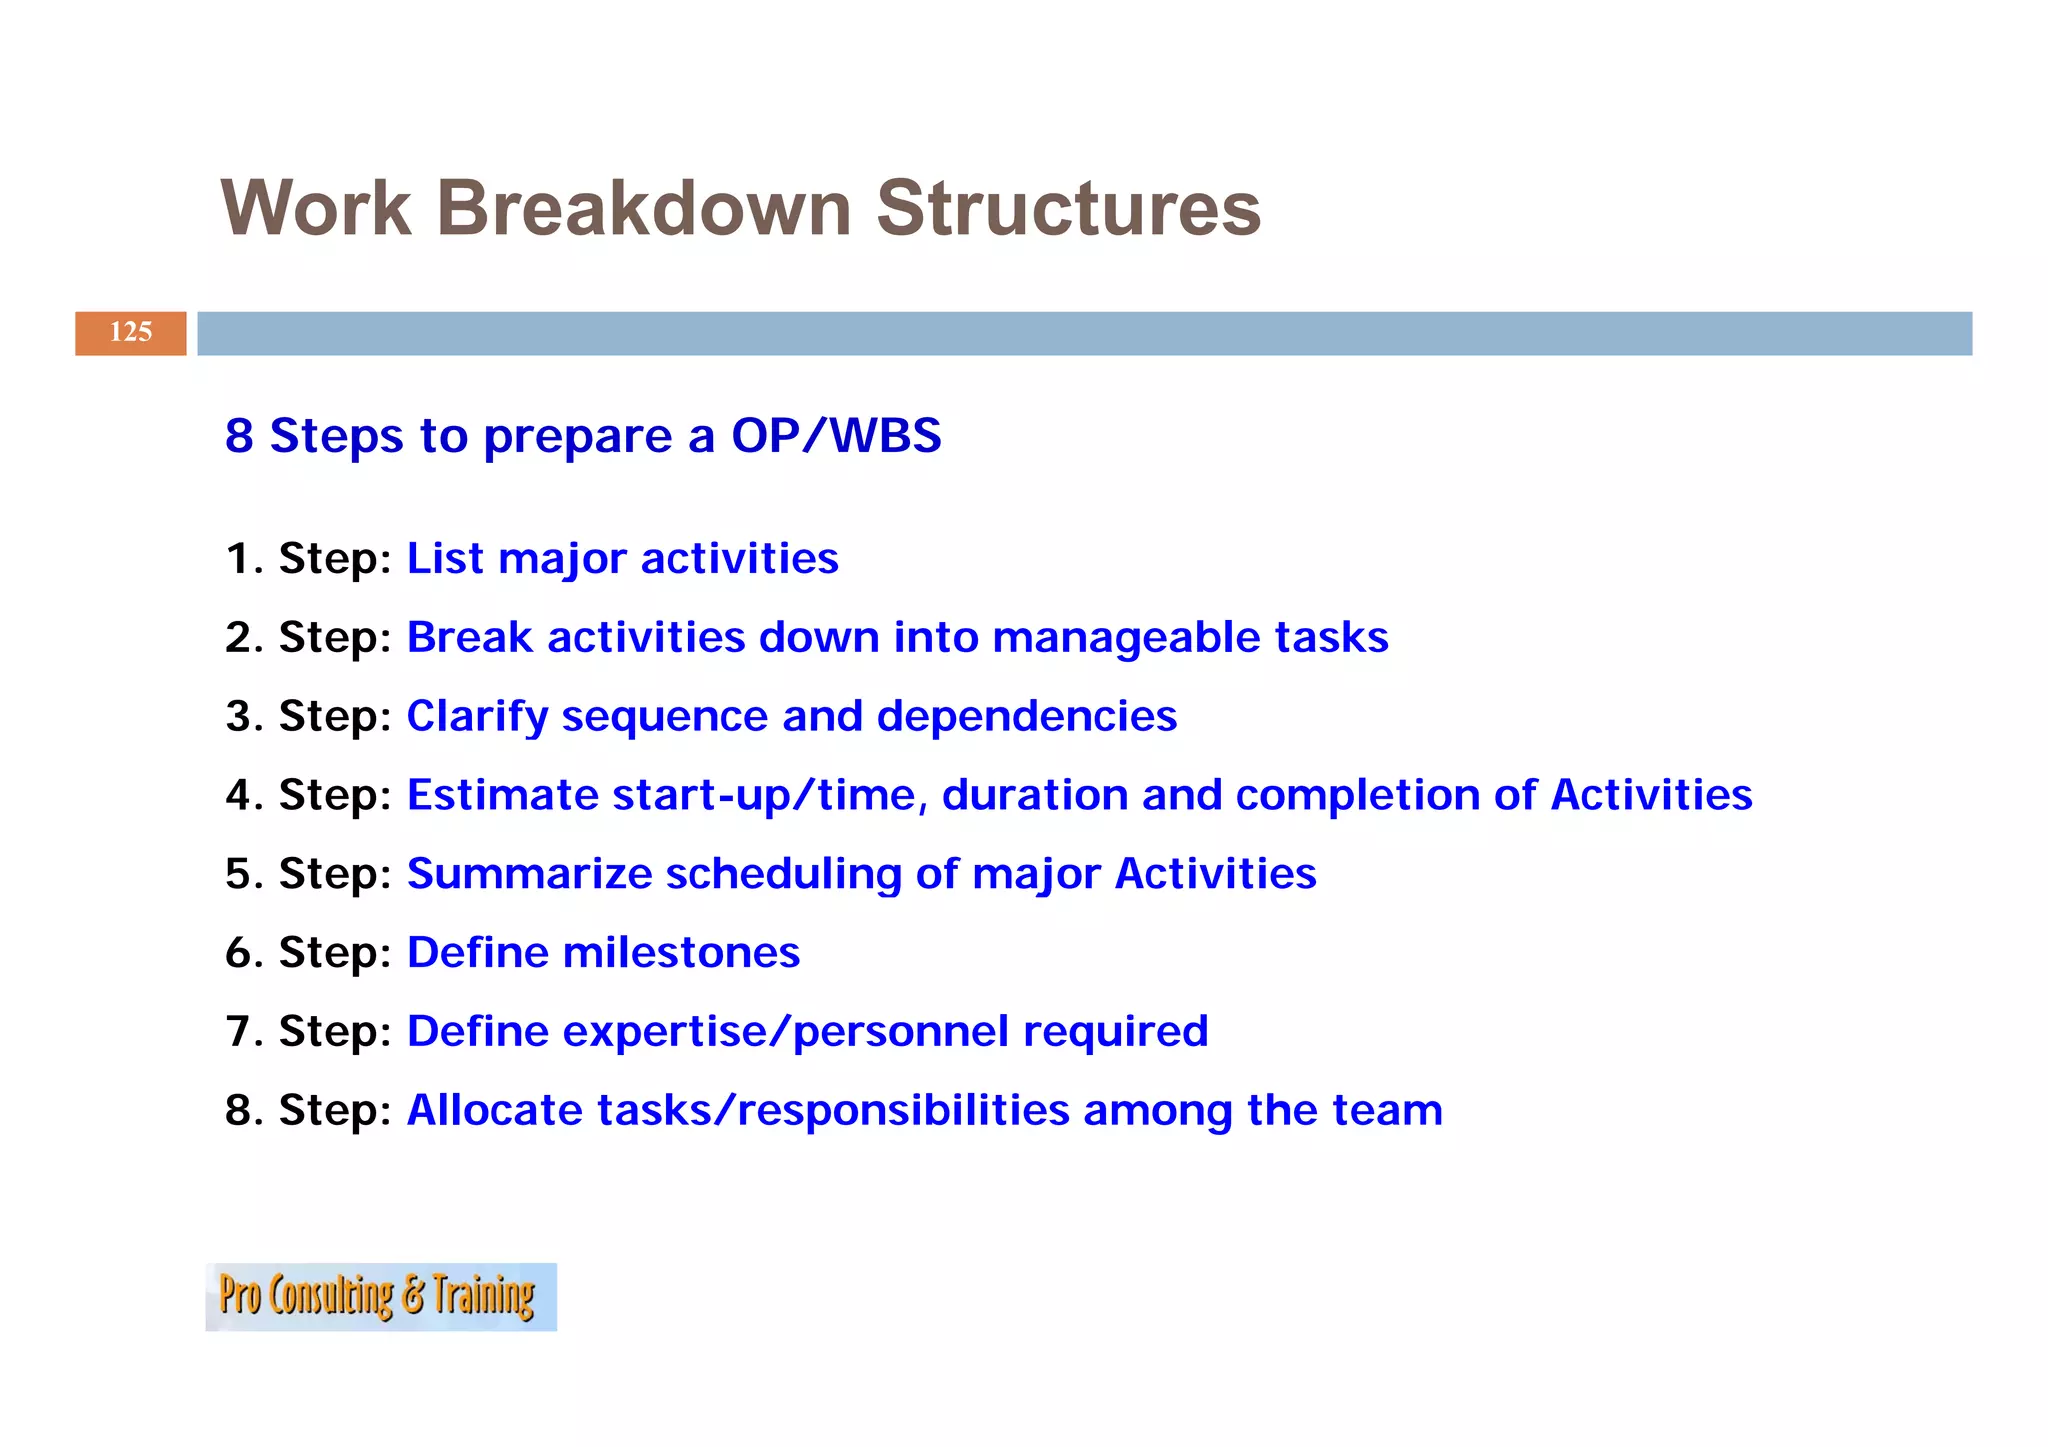
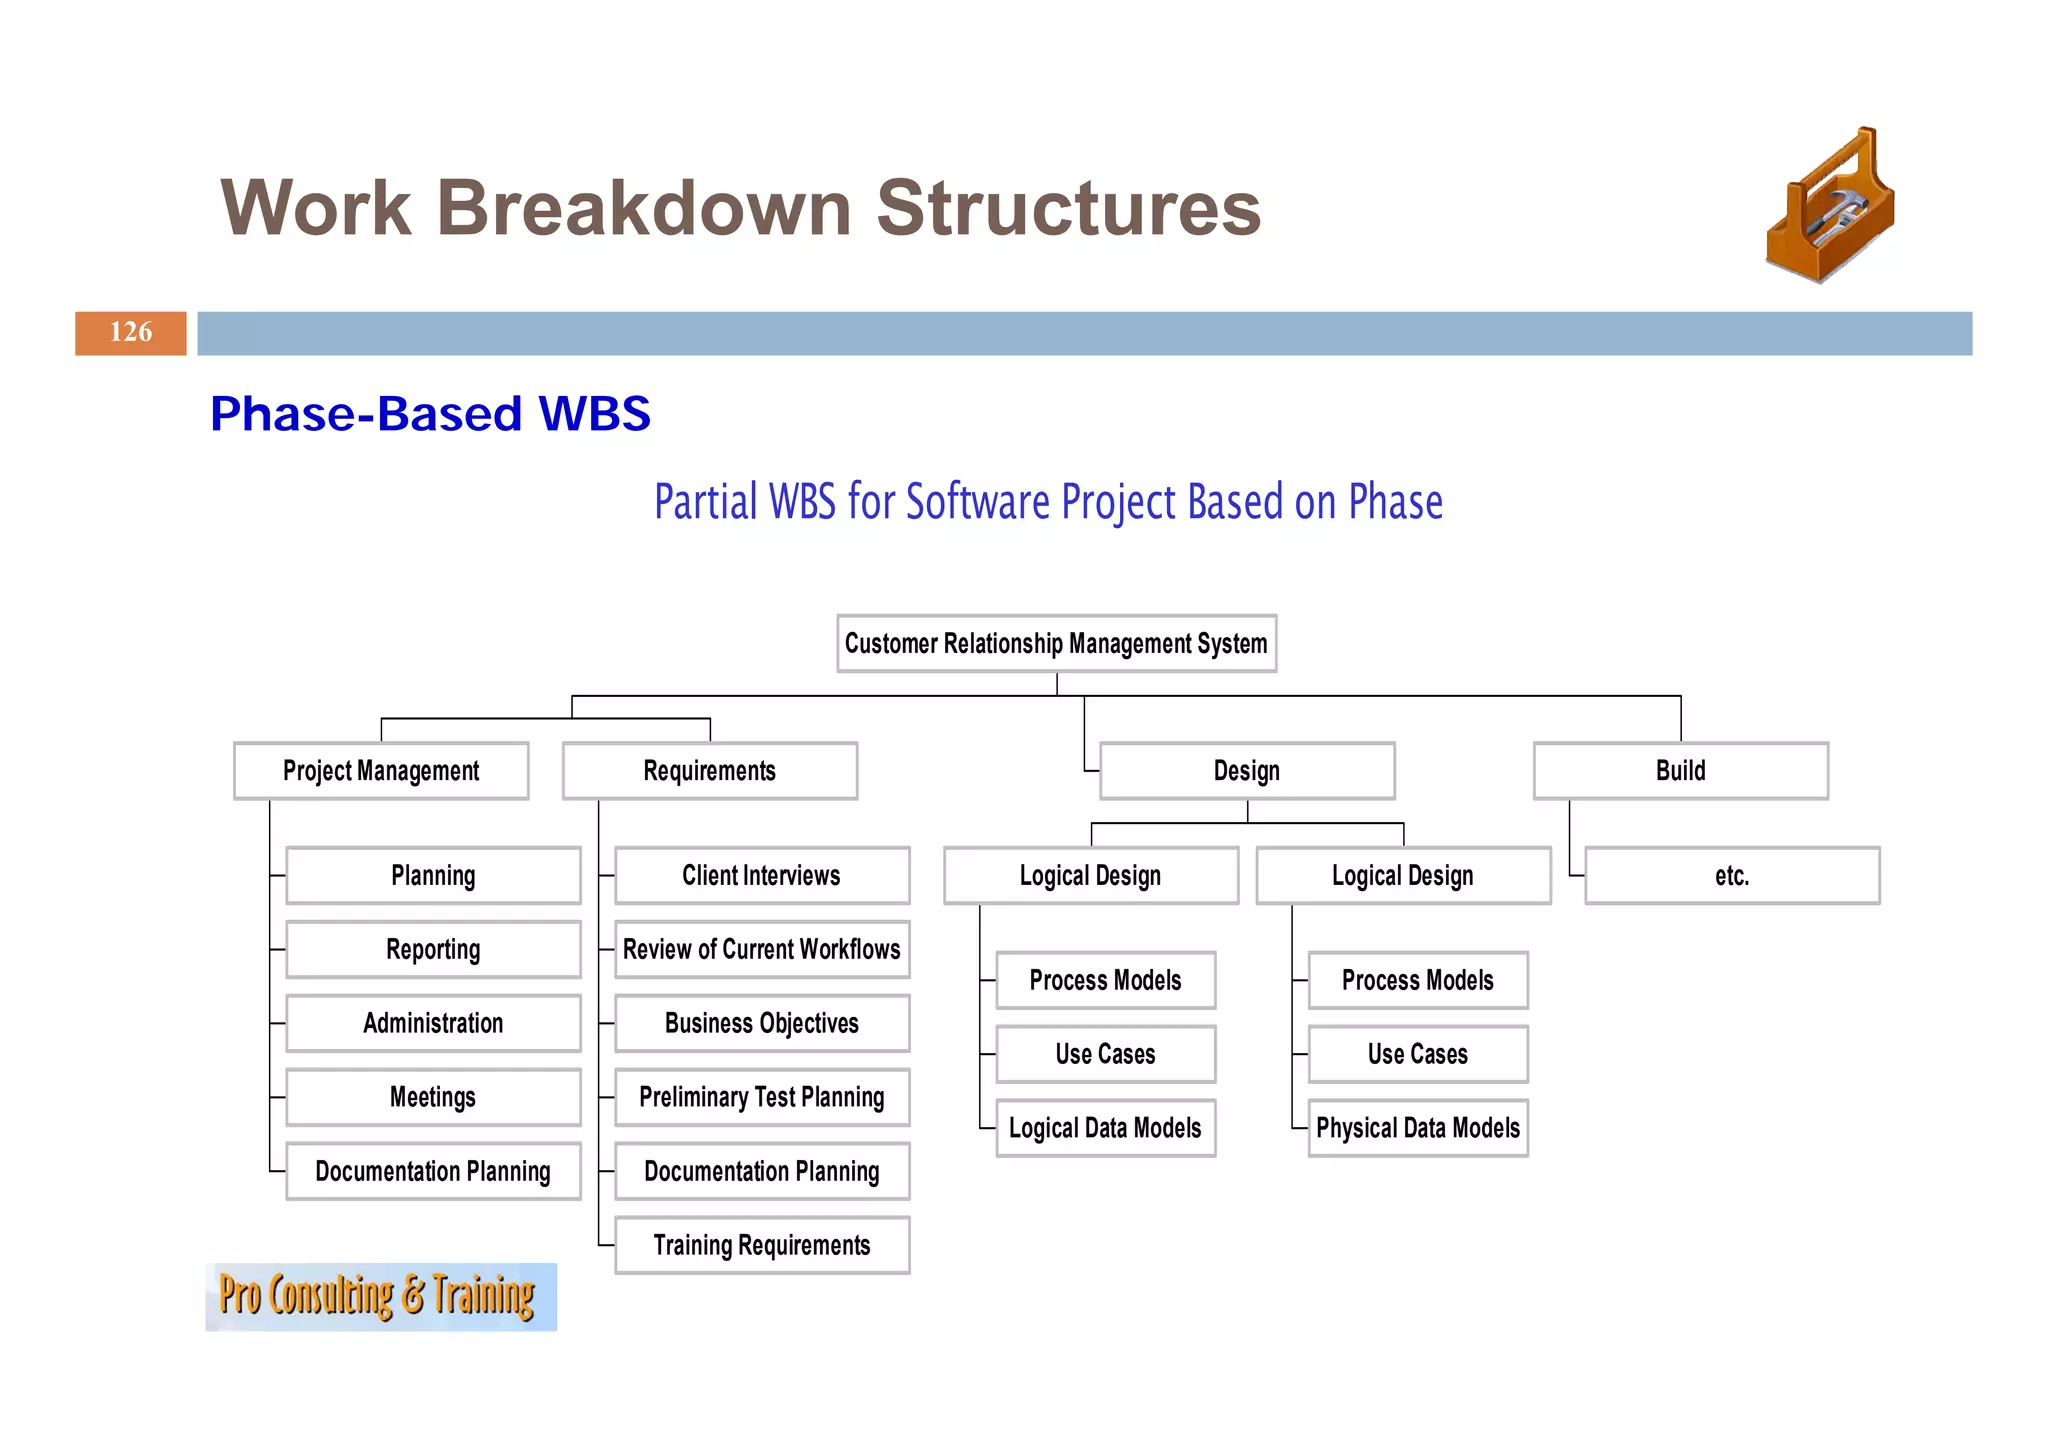
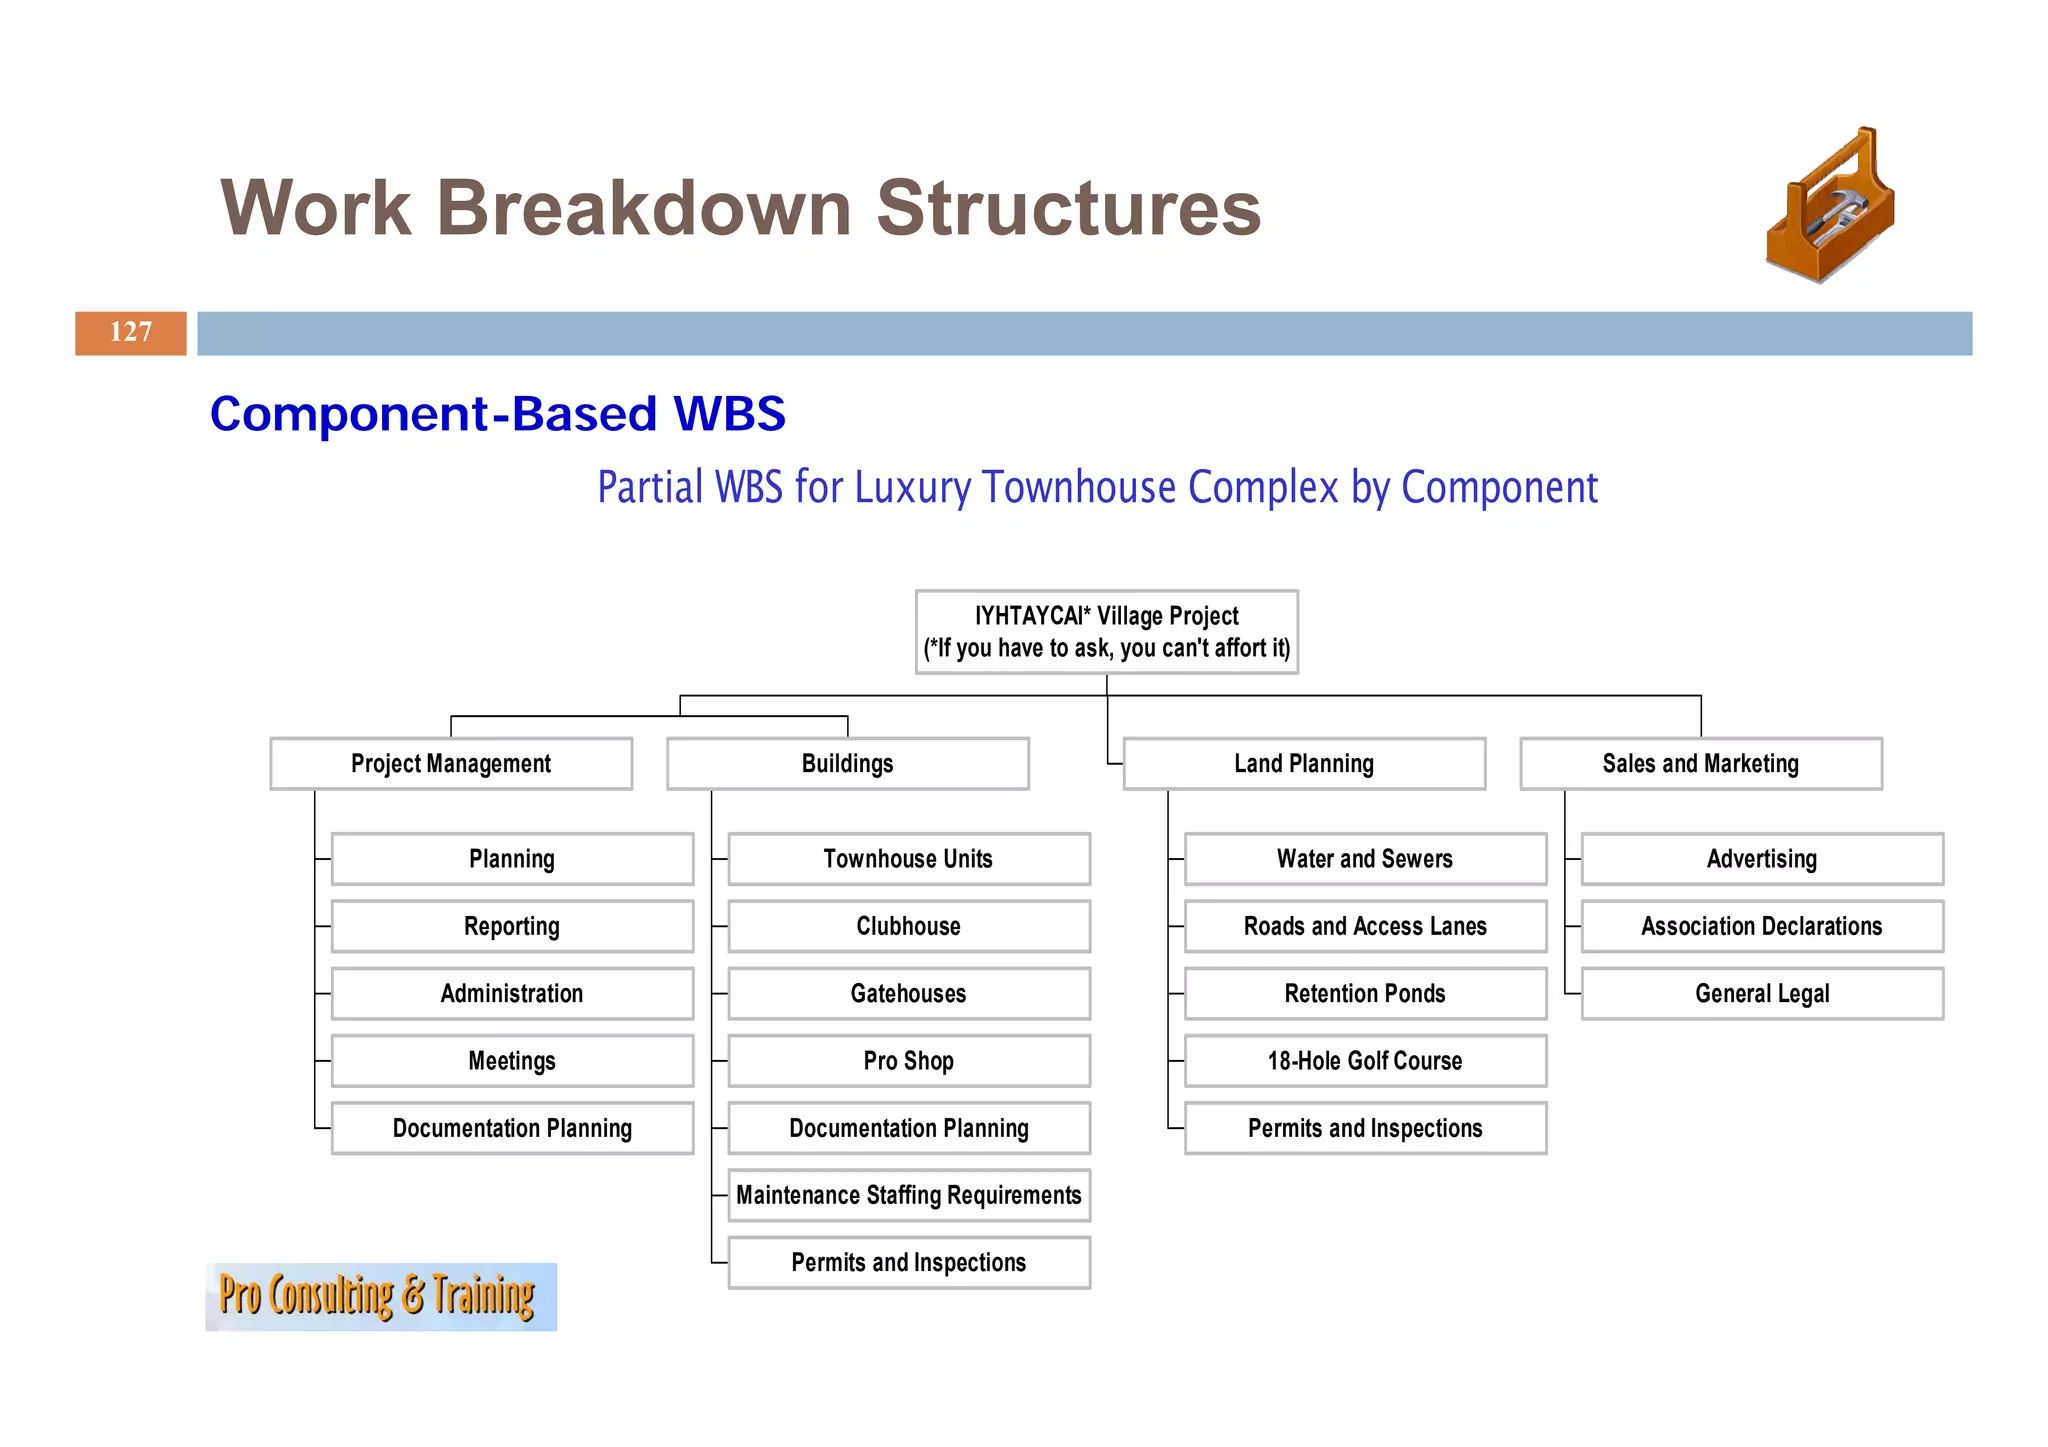
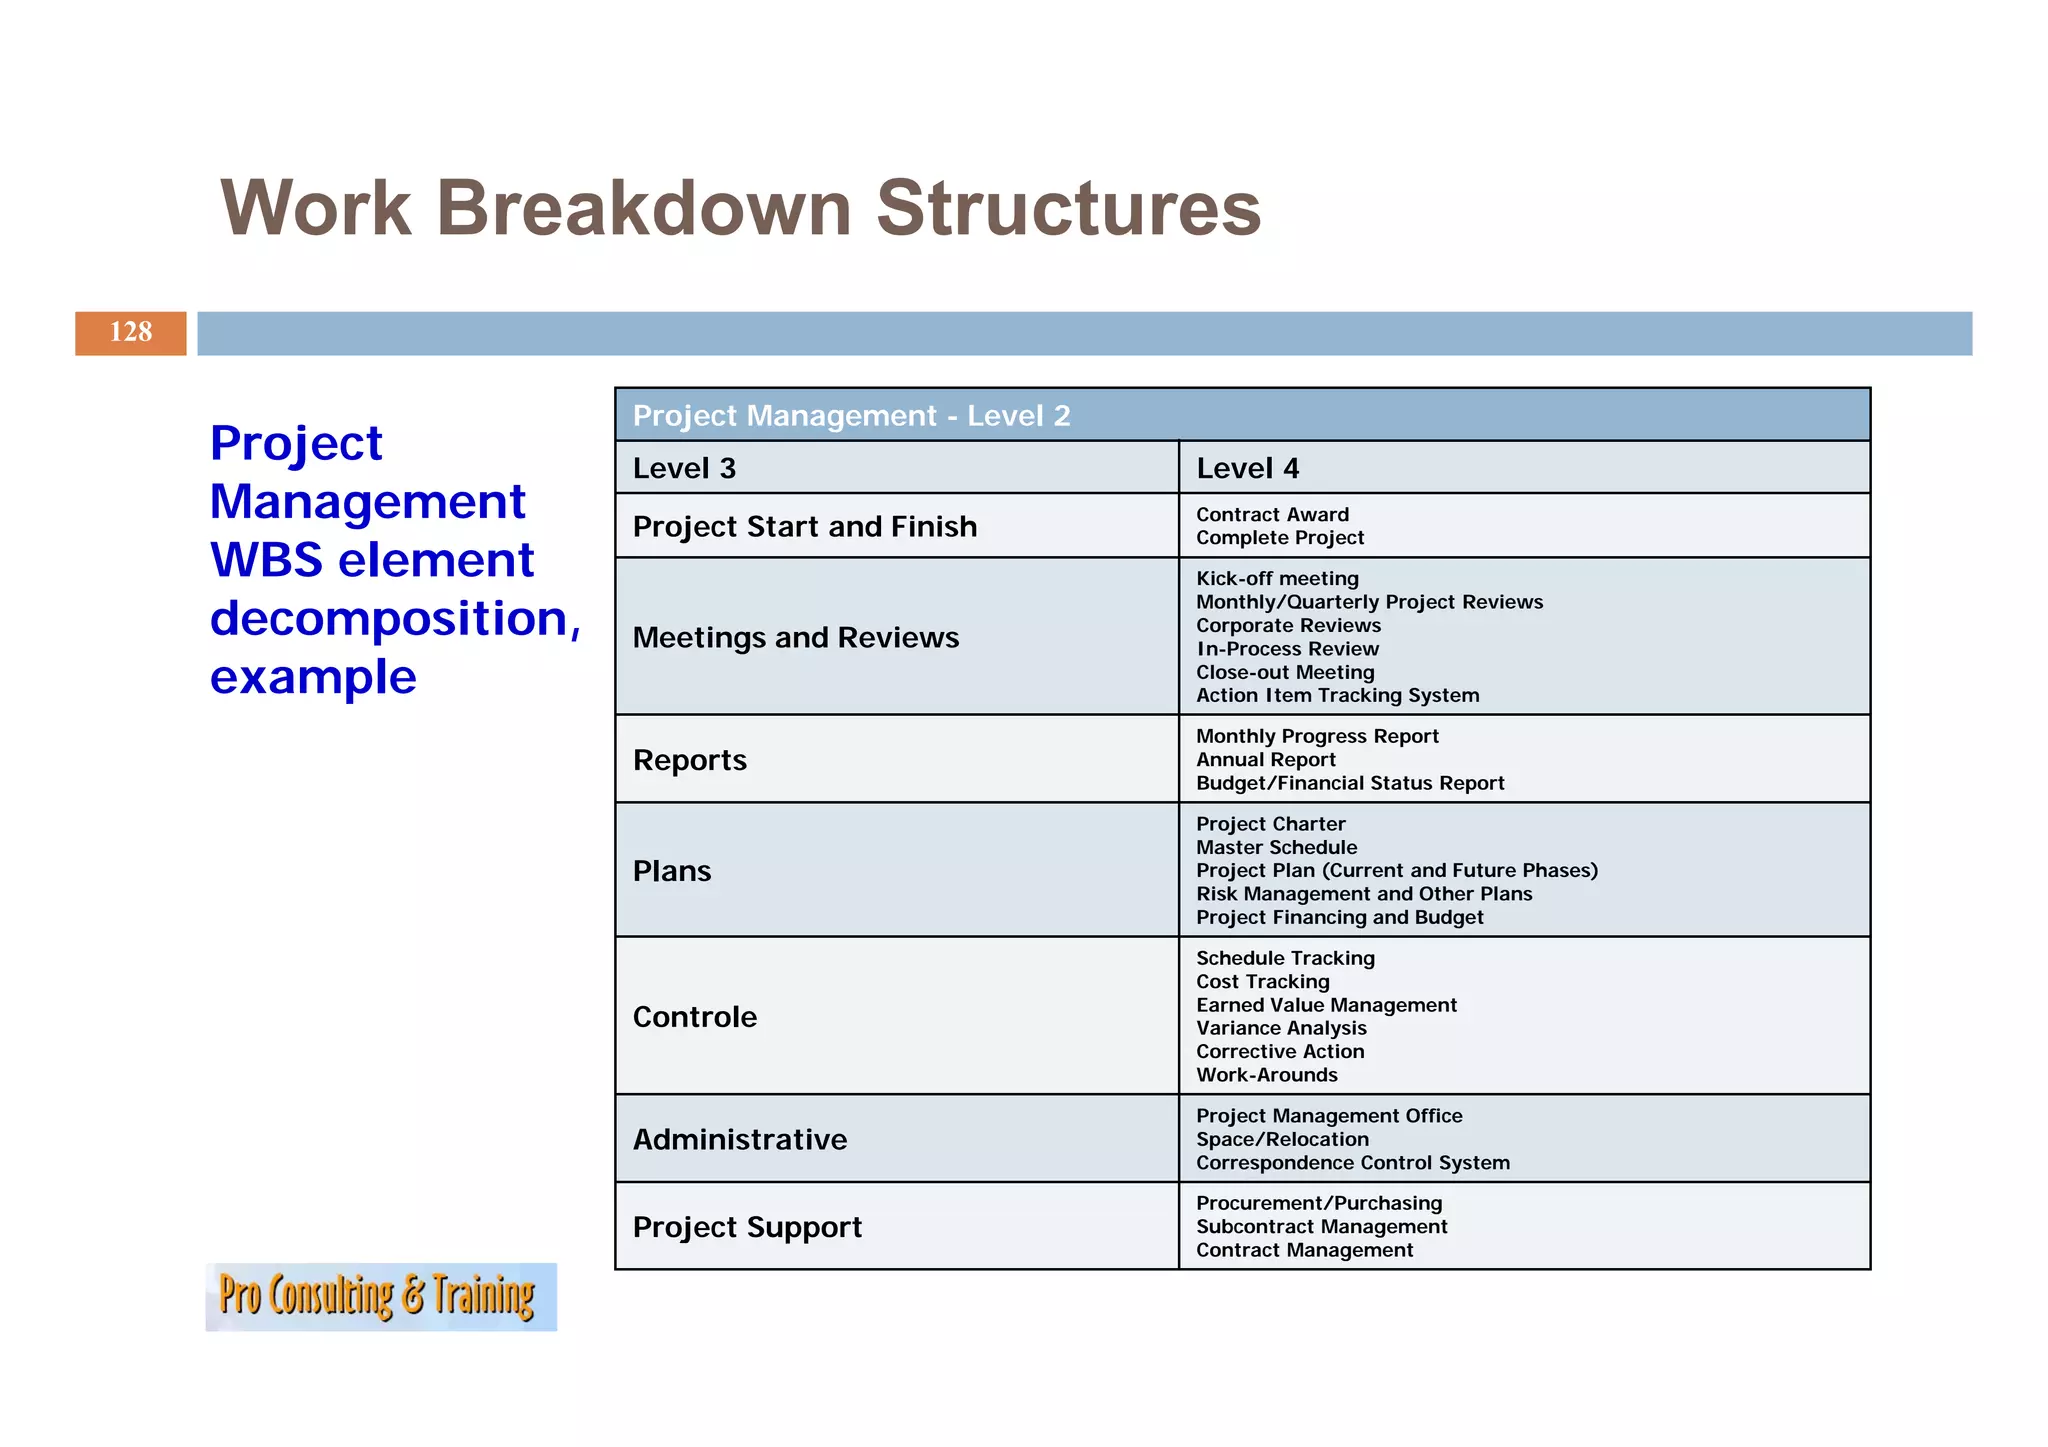
Definition and critical importance of project charters in gaining project approval.Exploration of responsibility matrices and work breakdown structures (WBS) defining team roles.
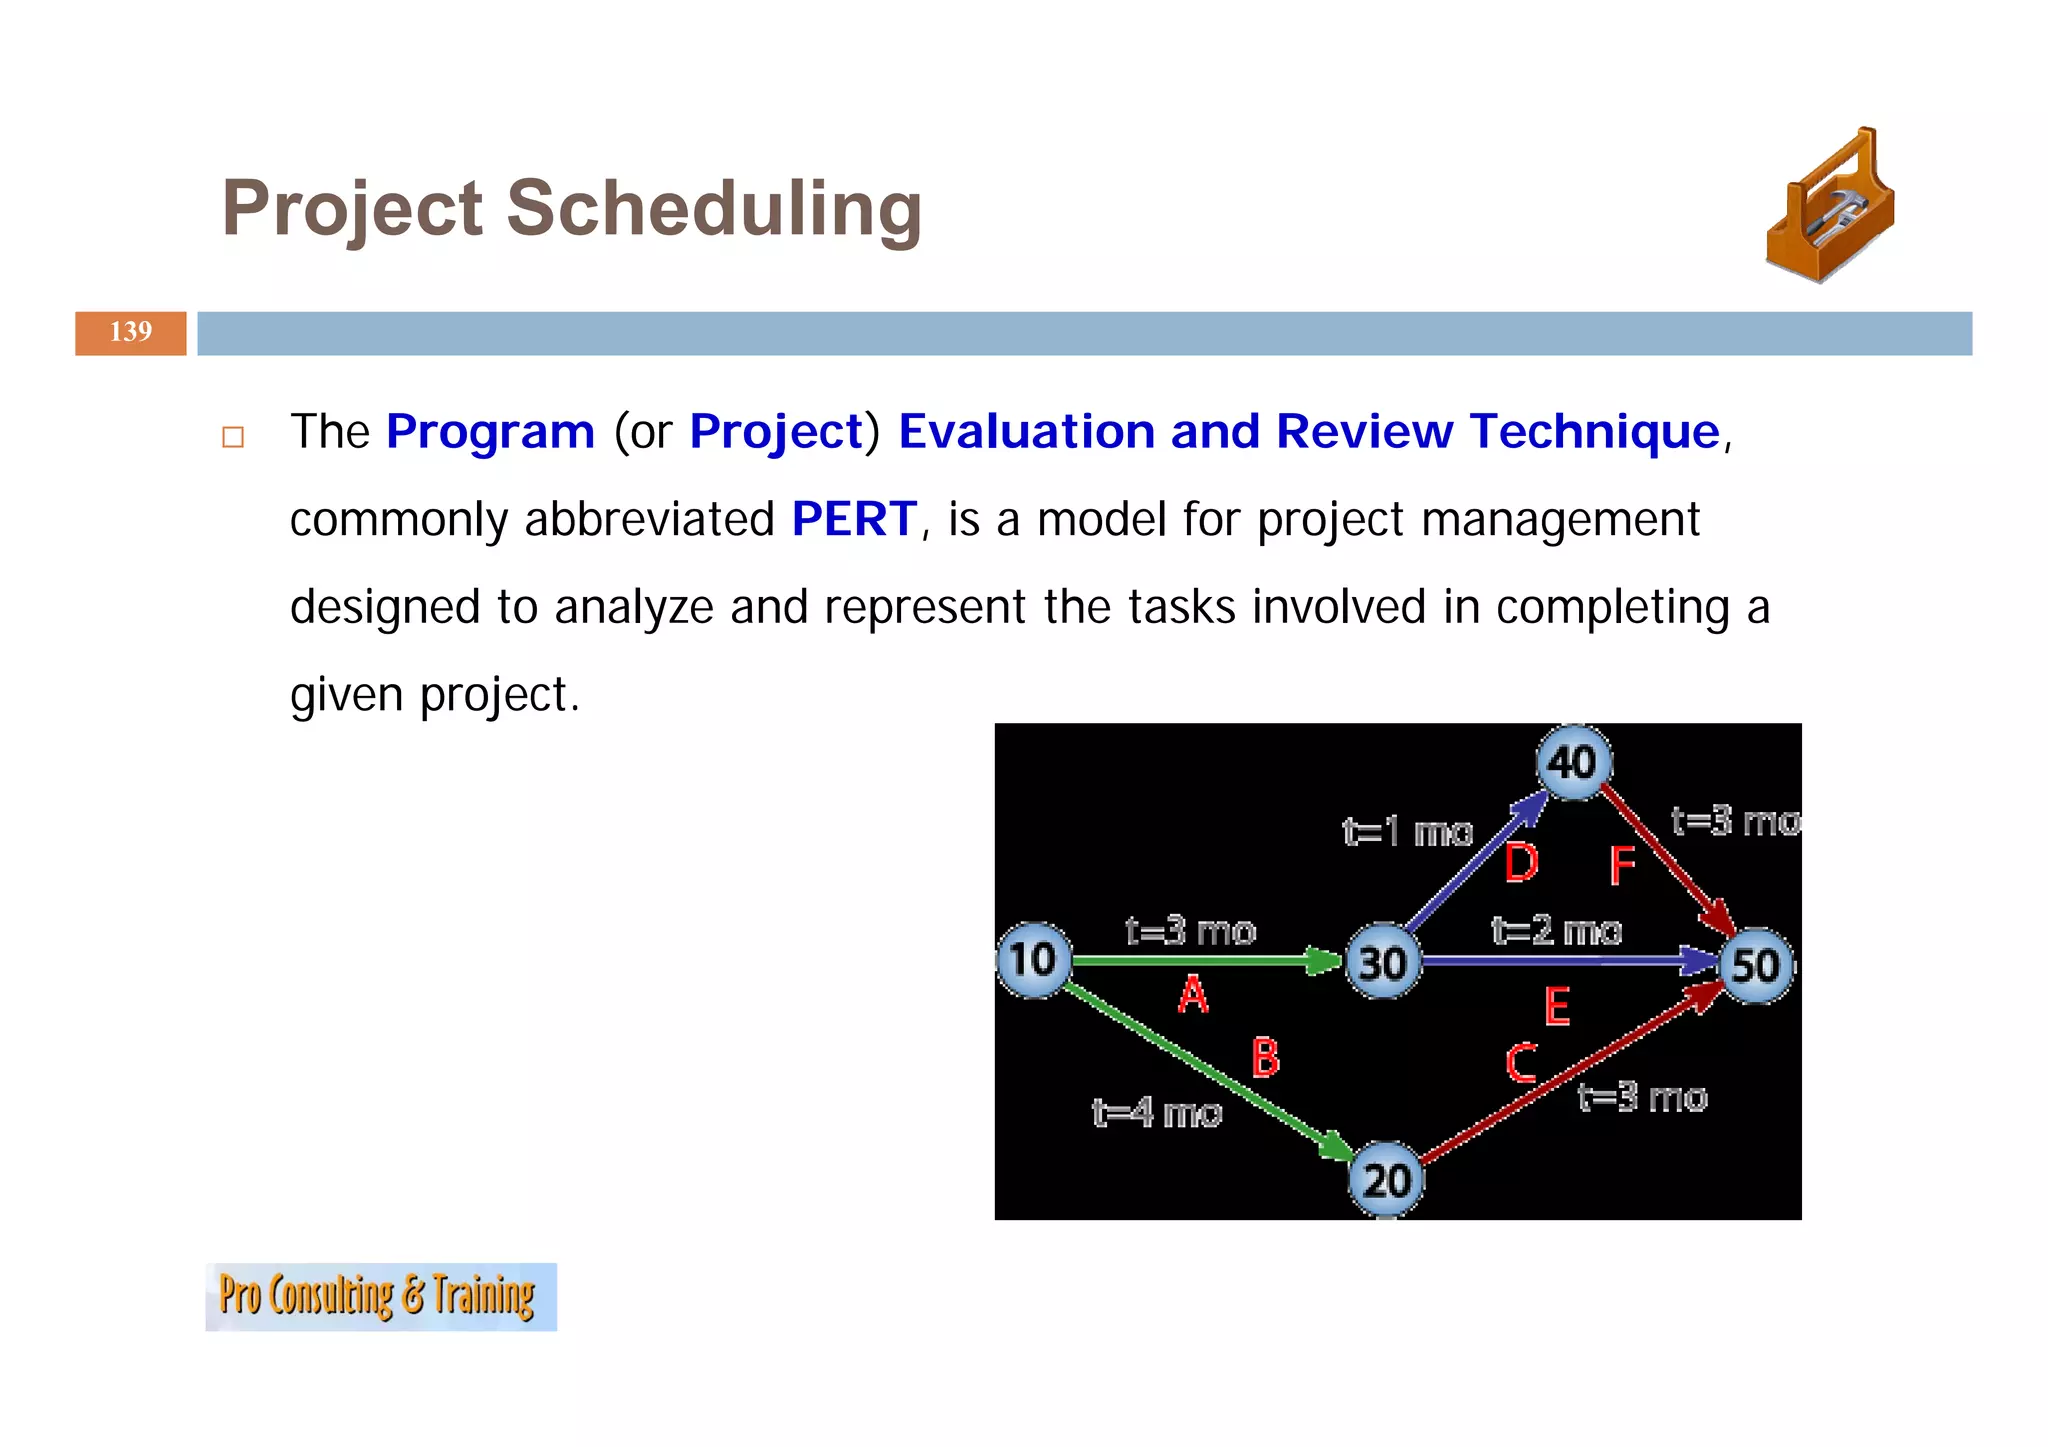
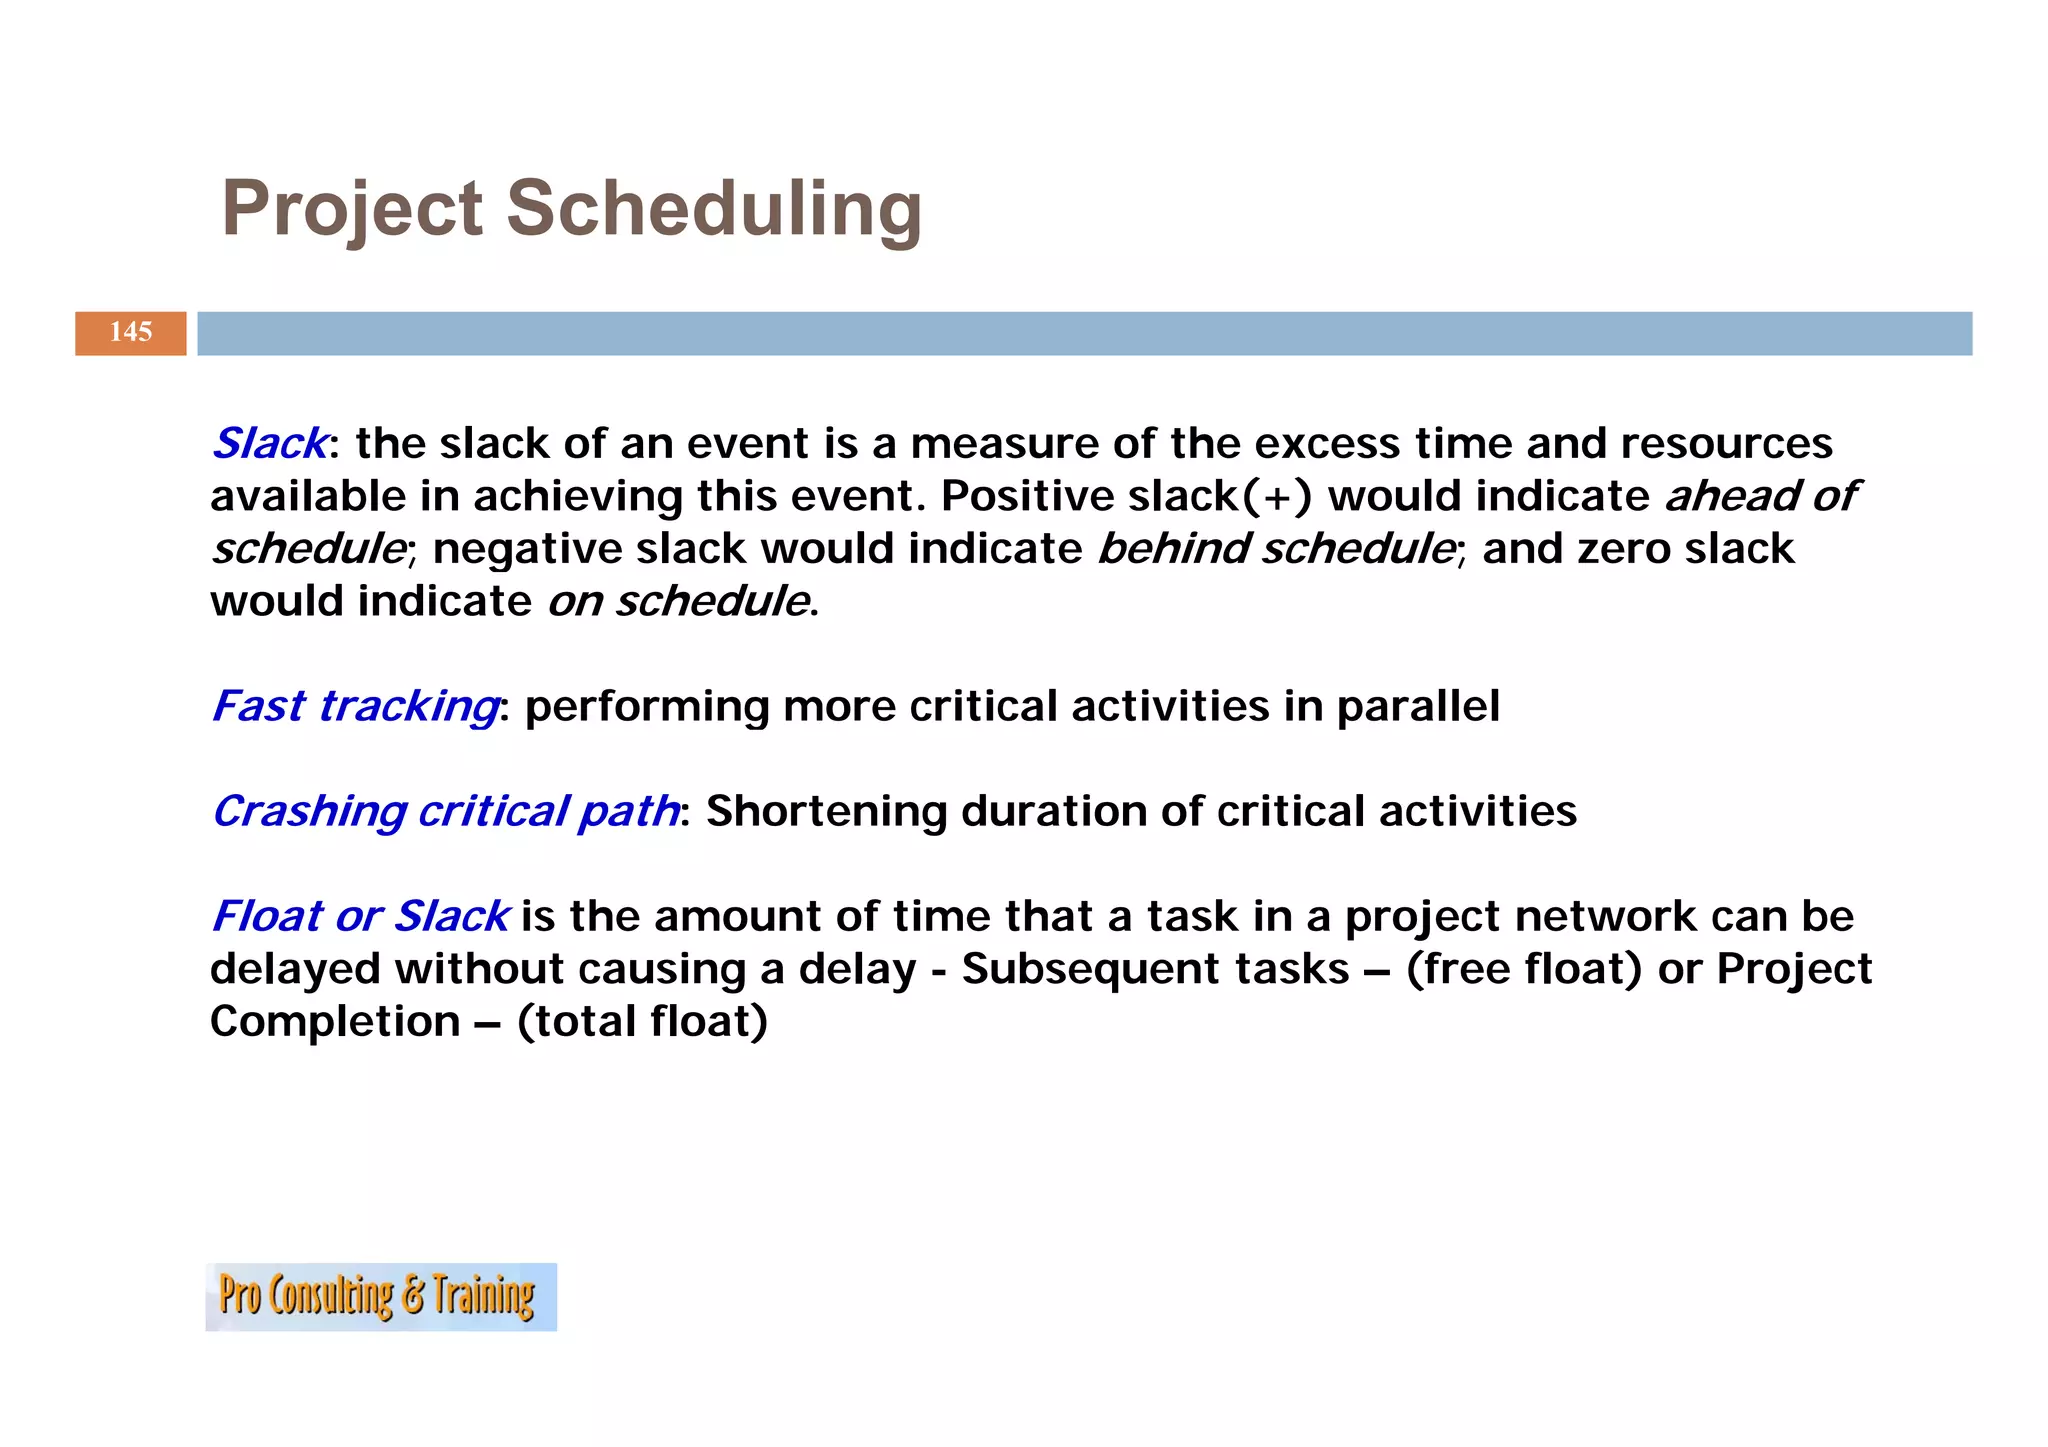
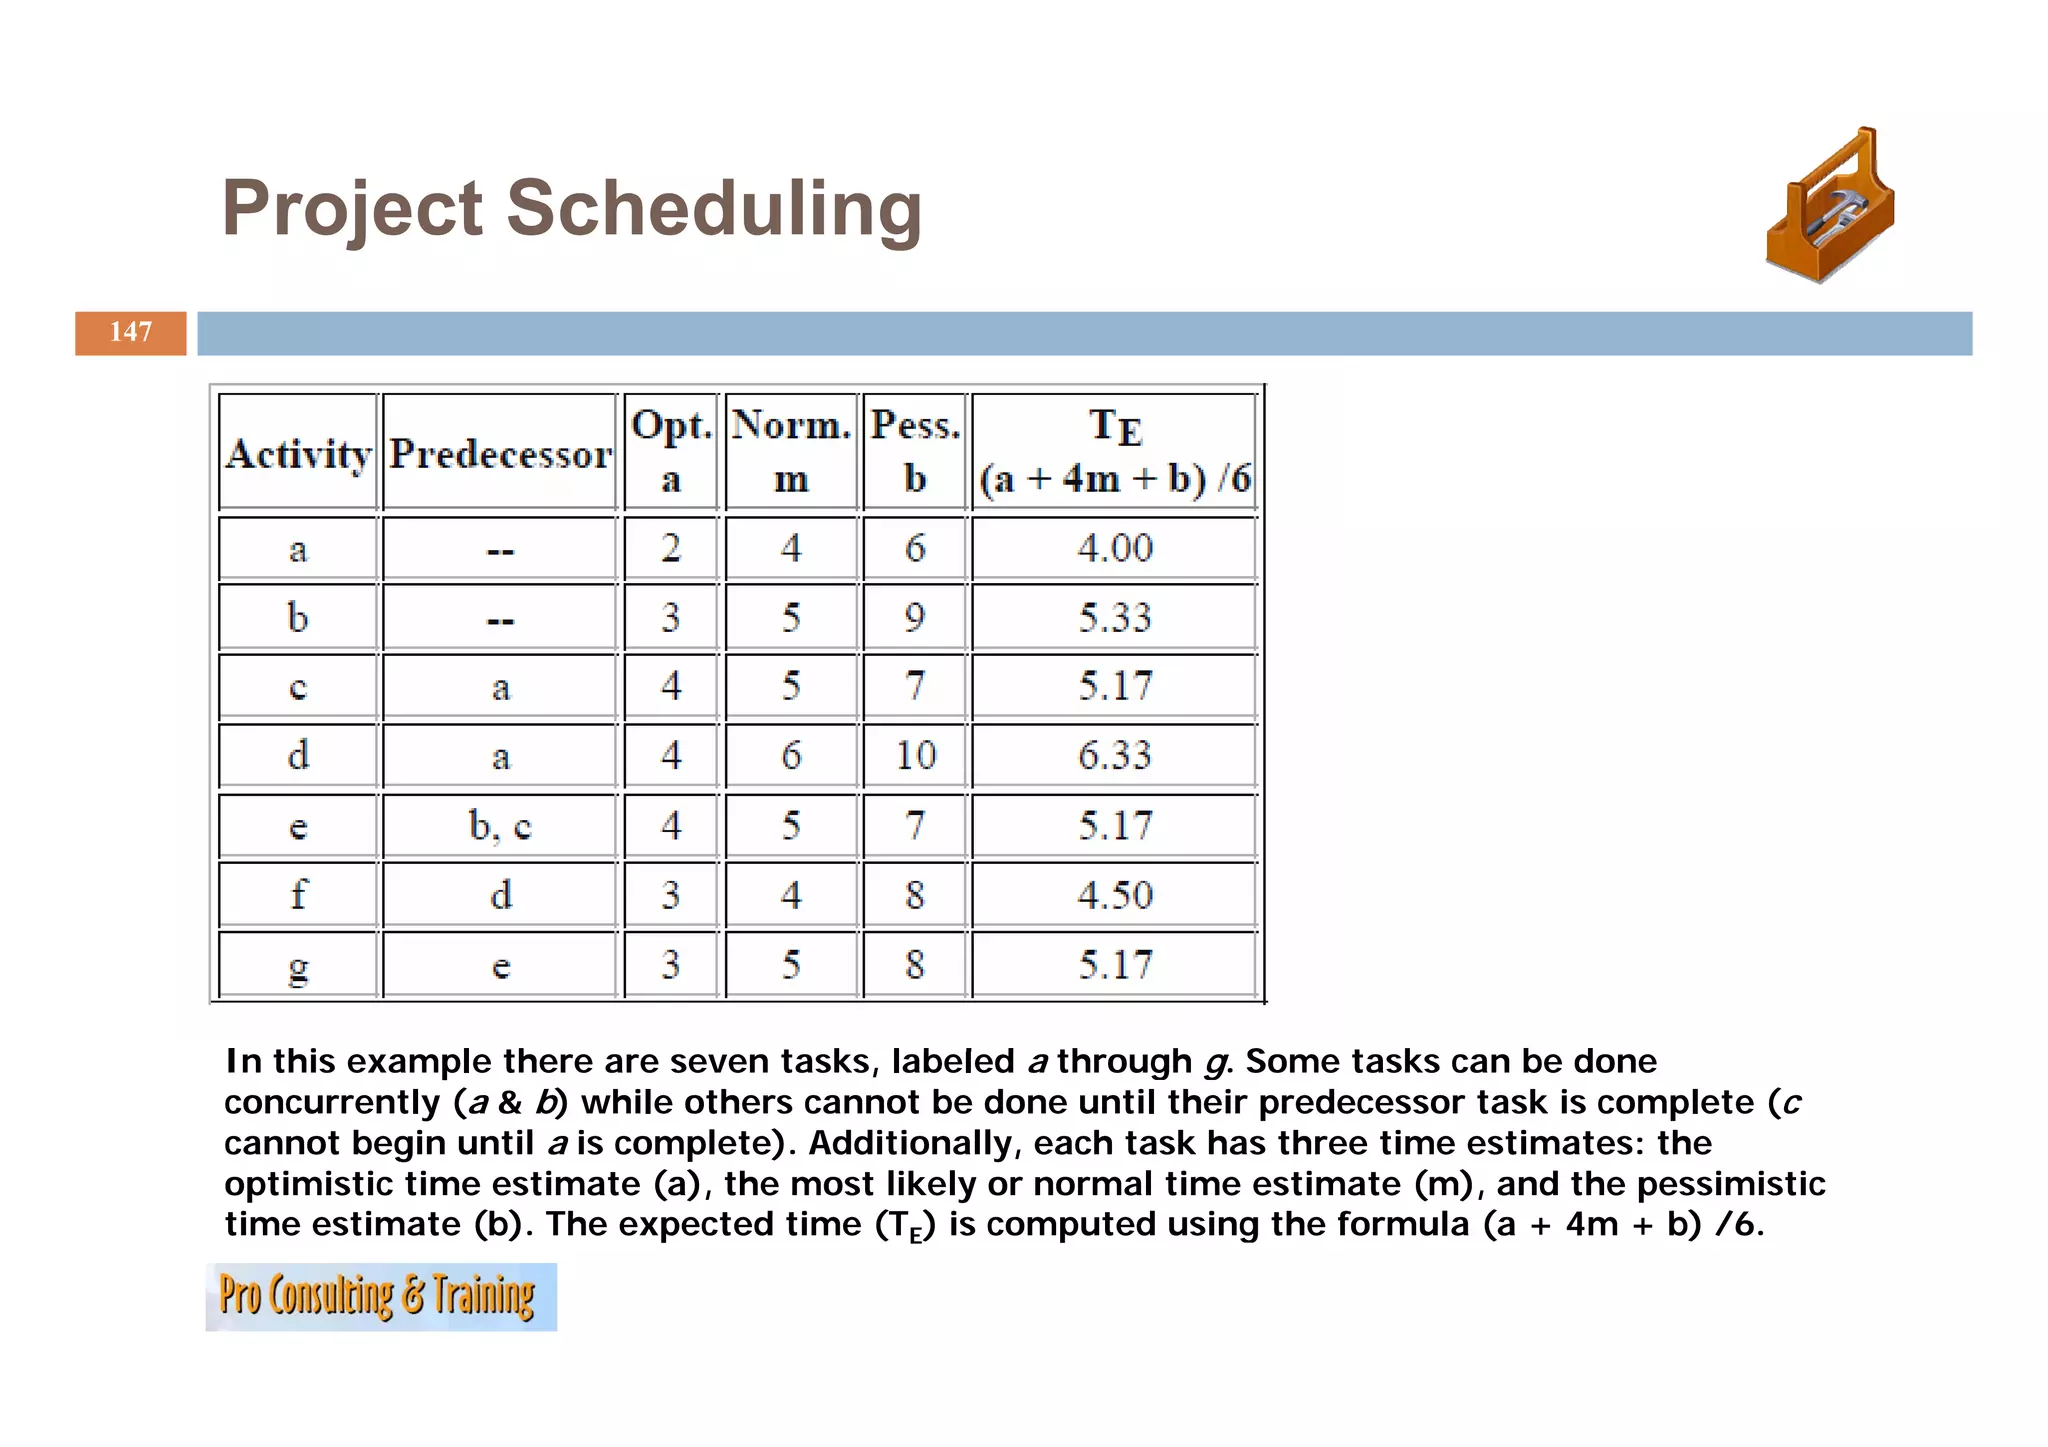
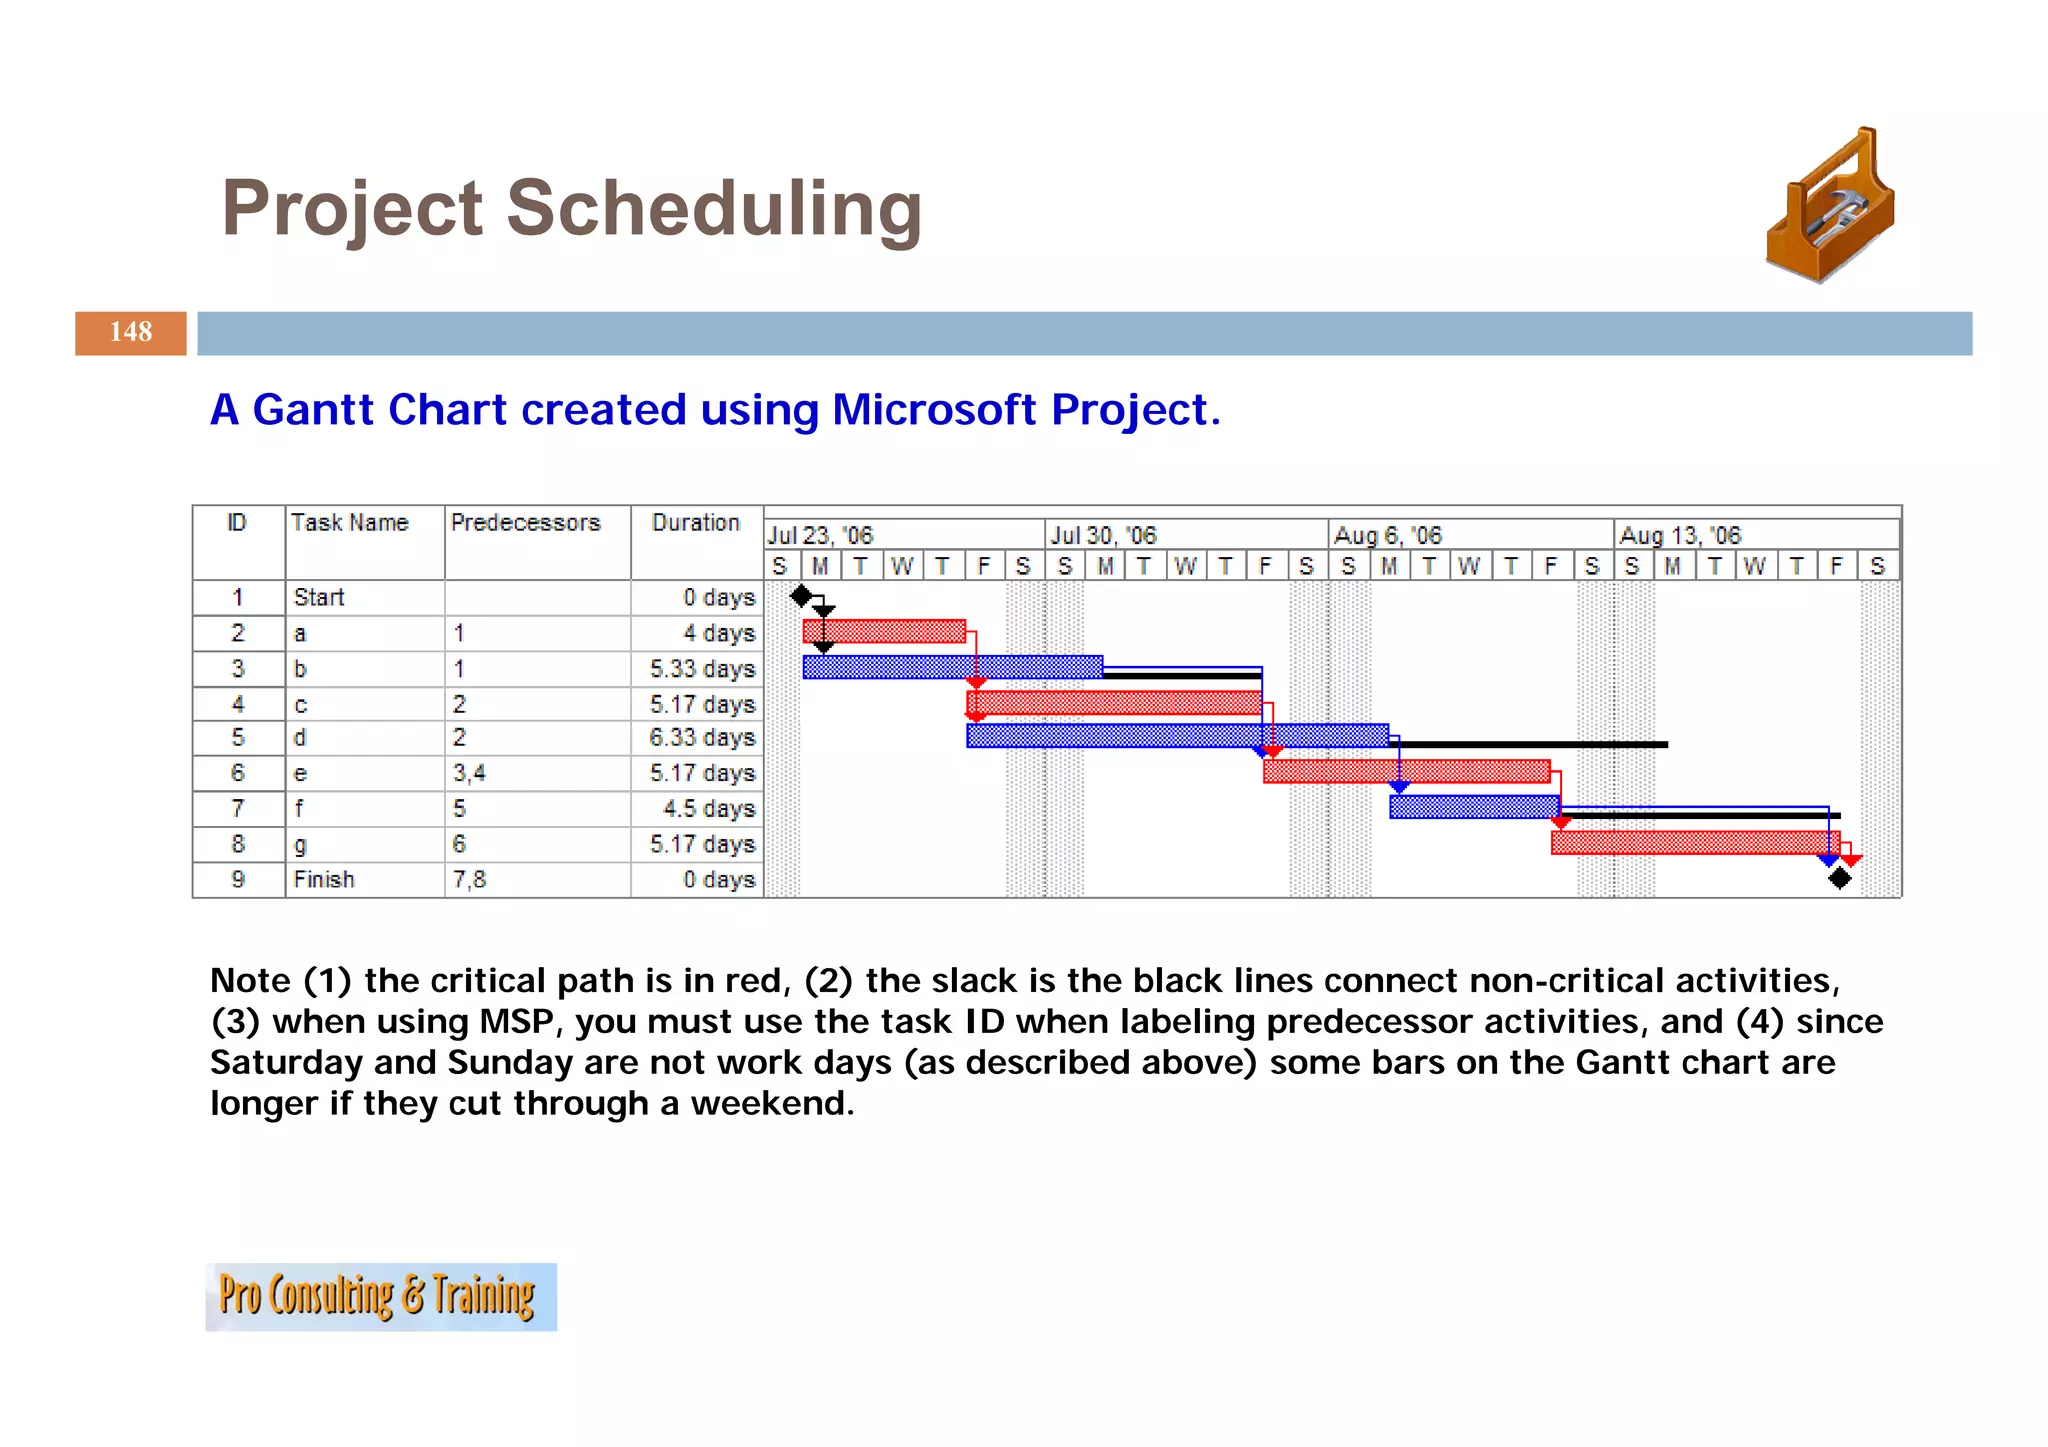
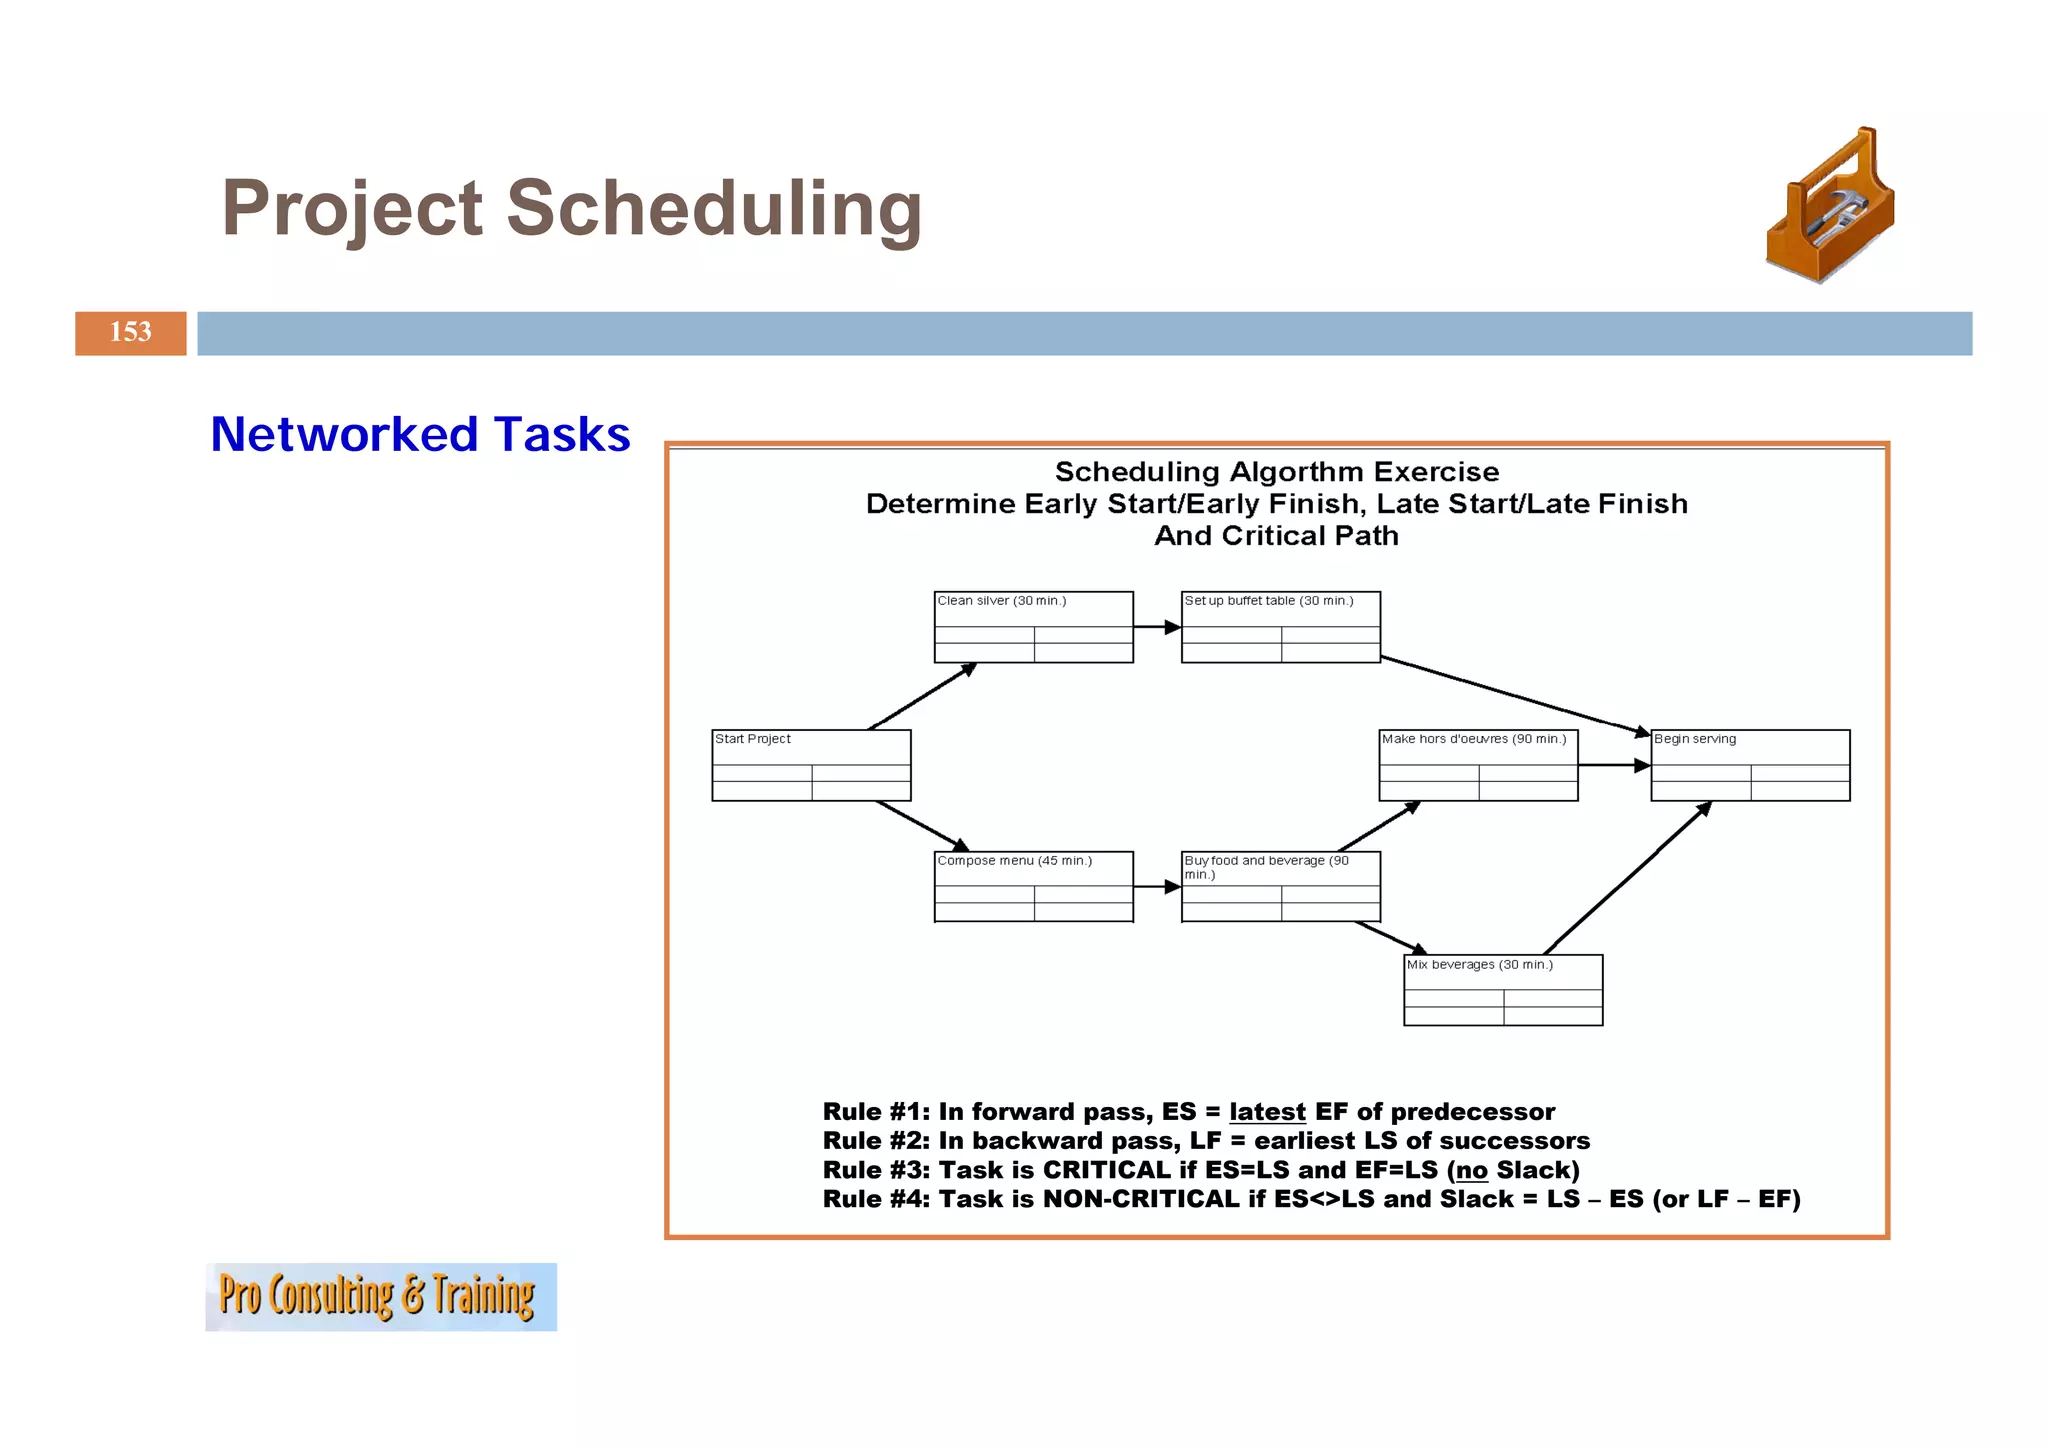
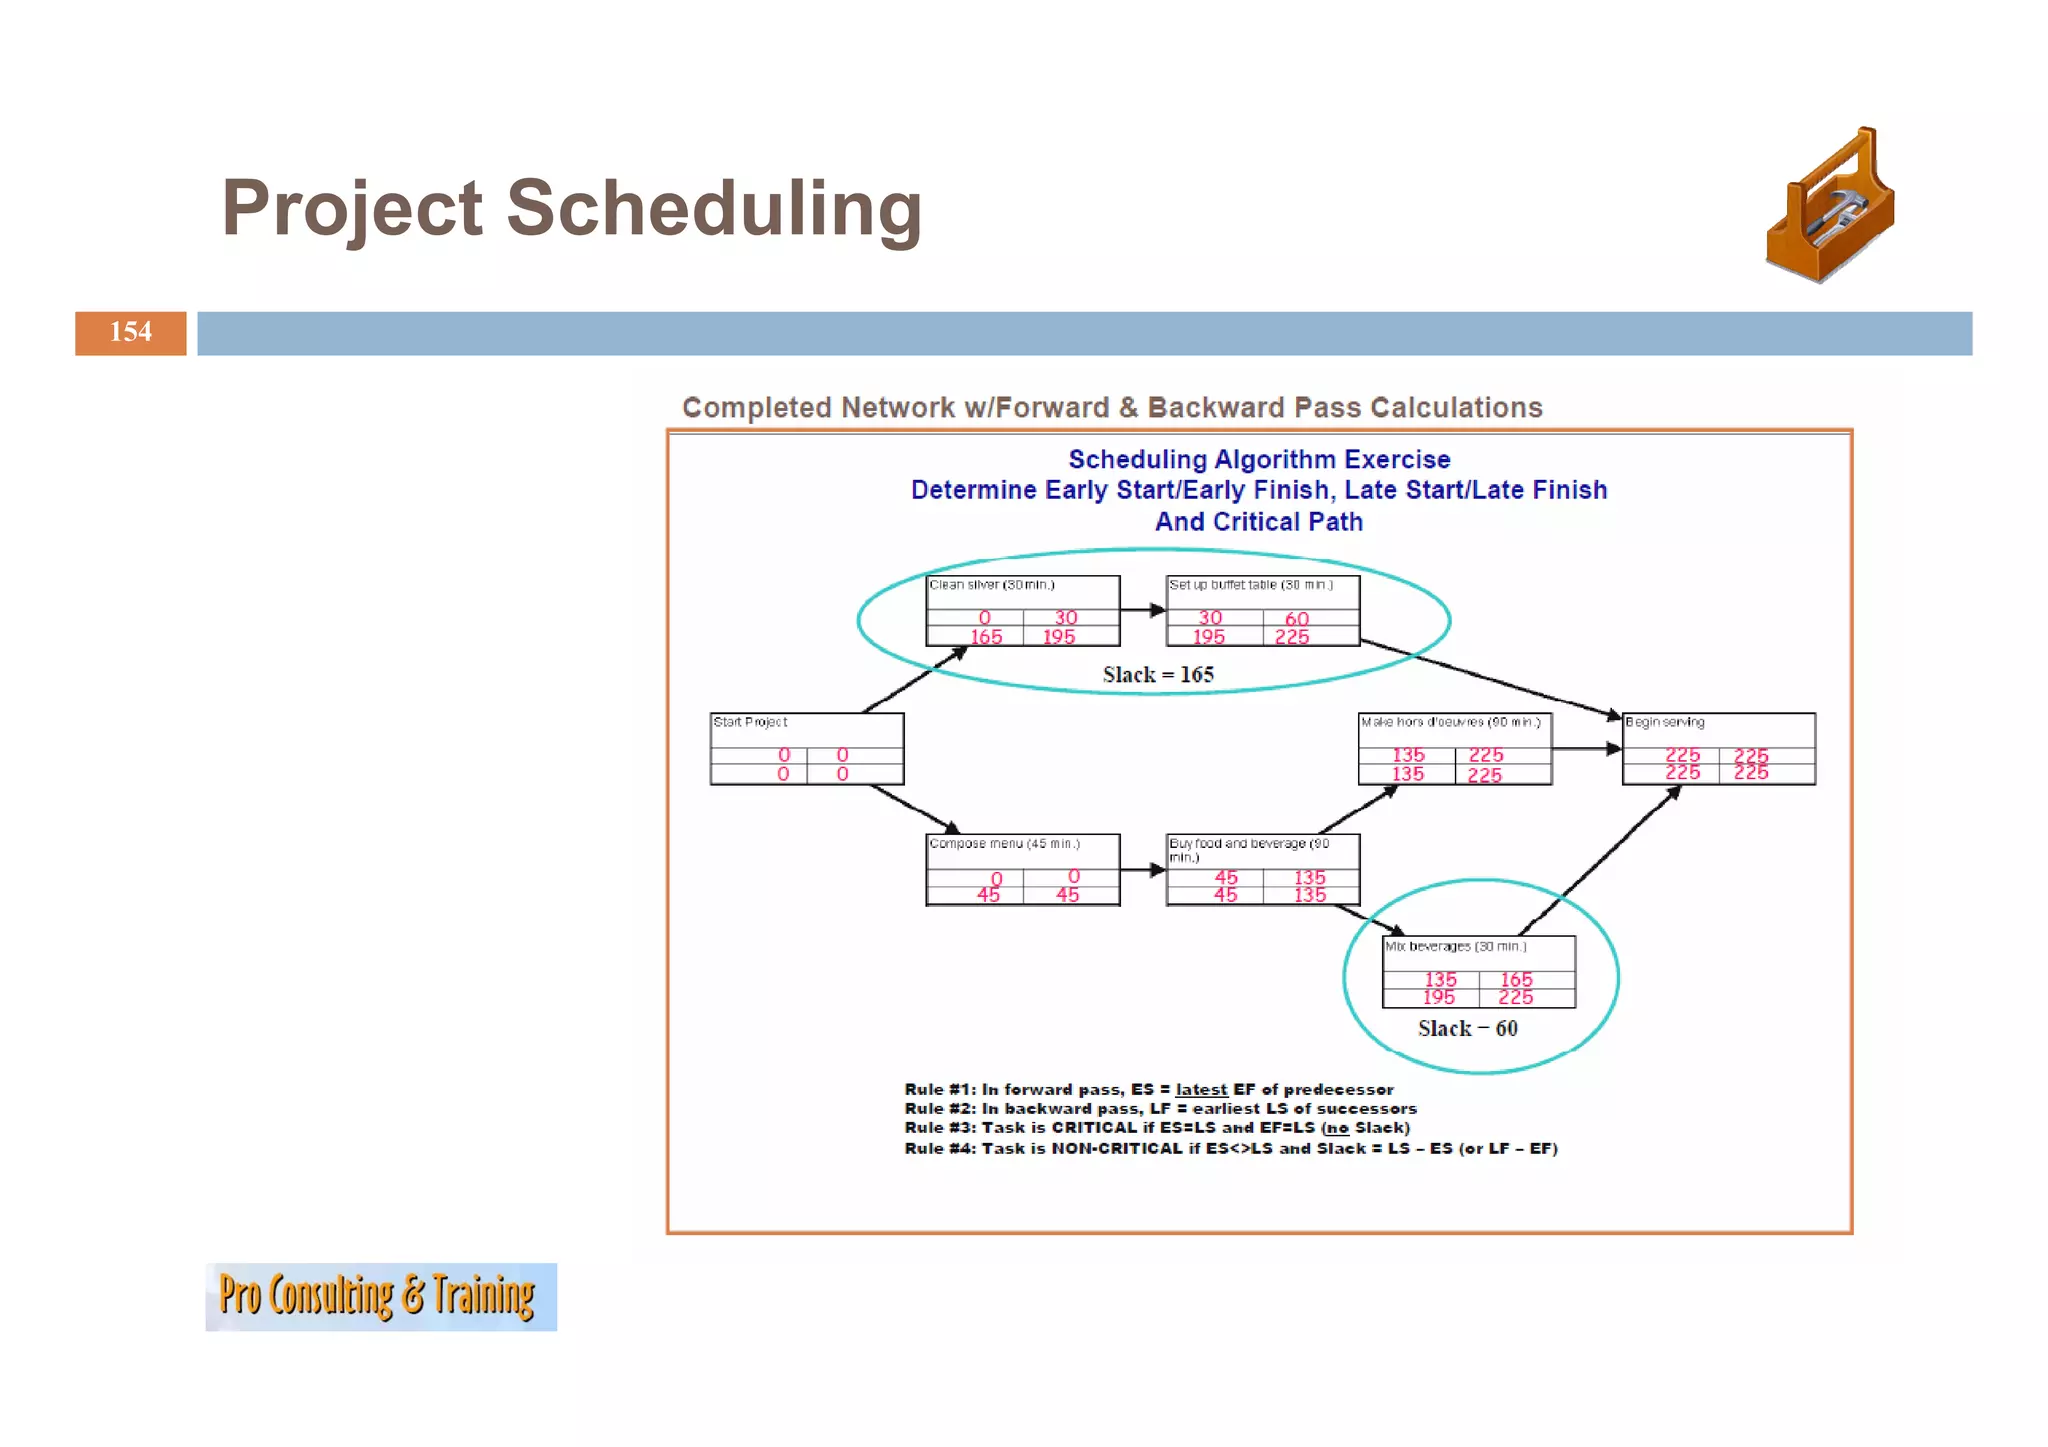
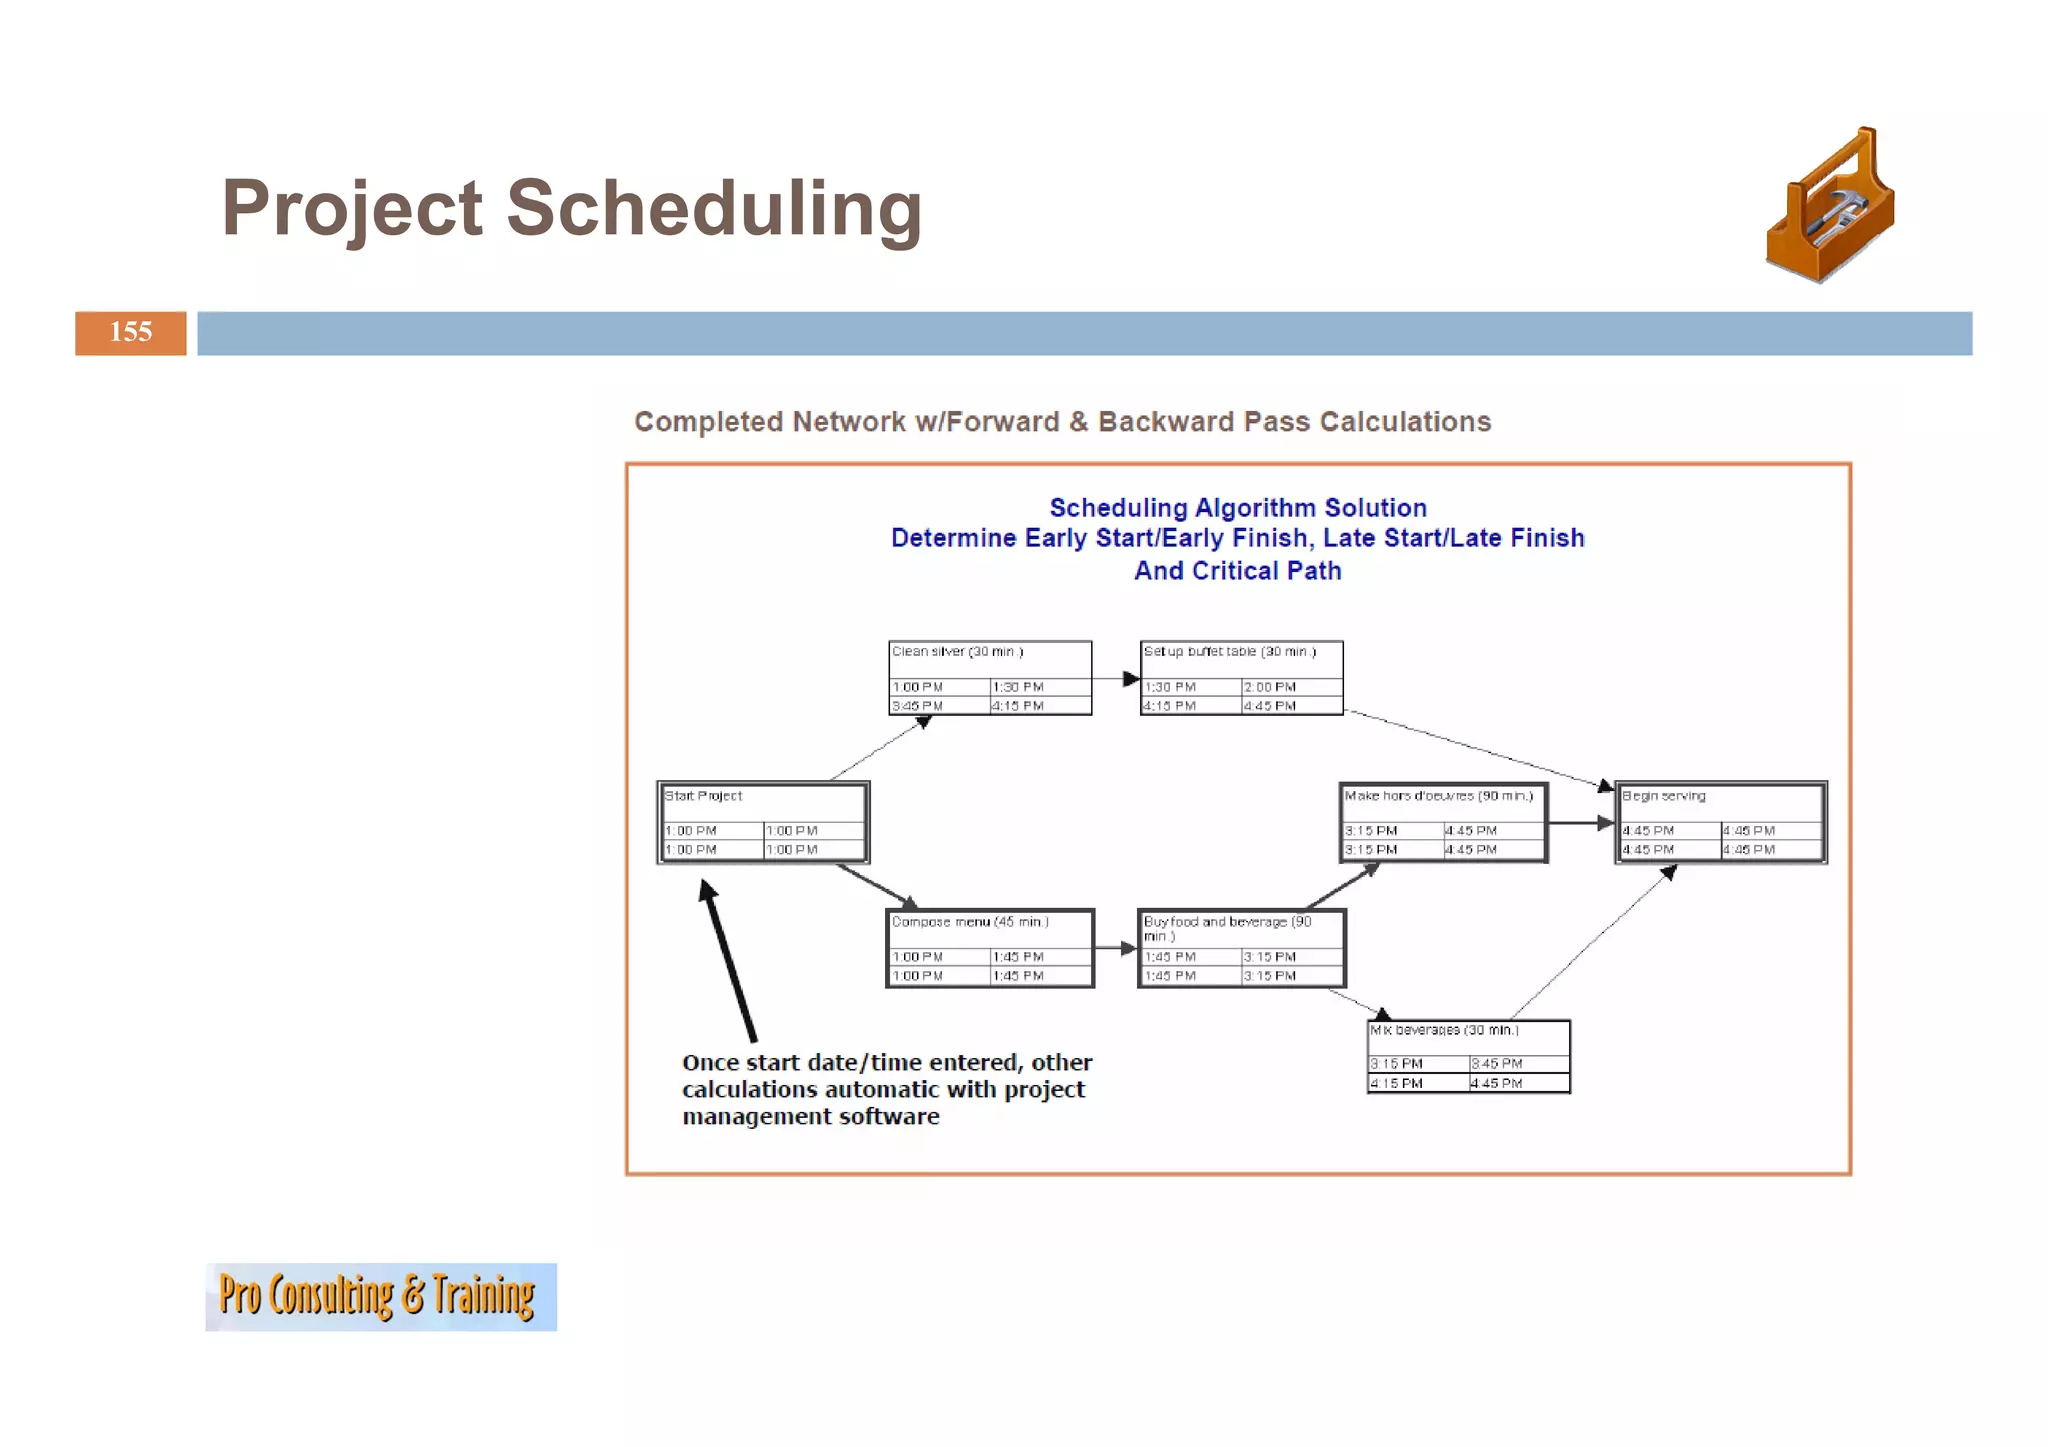
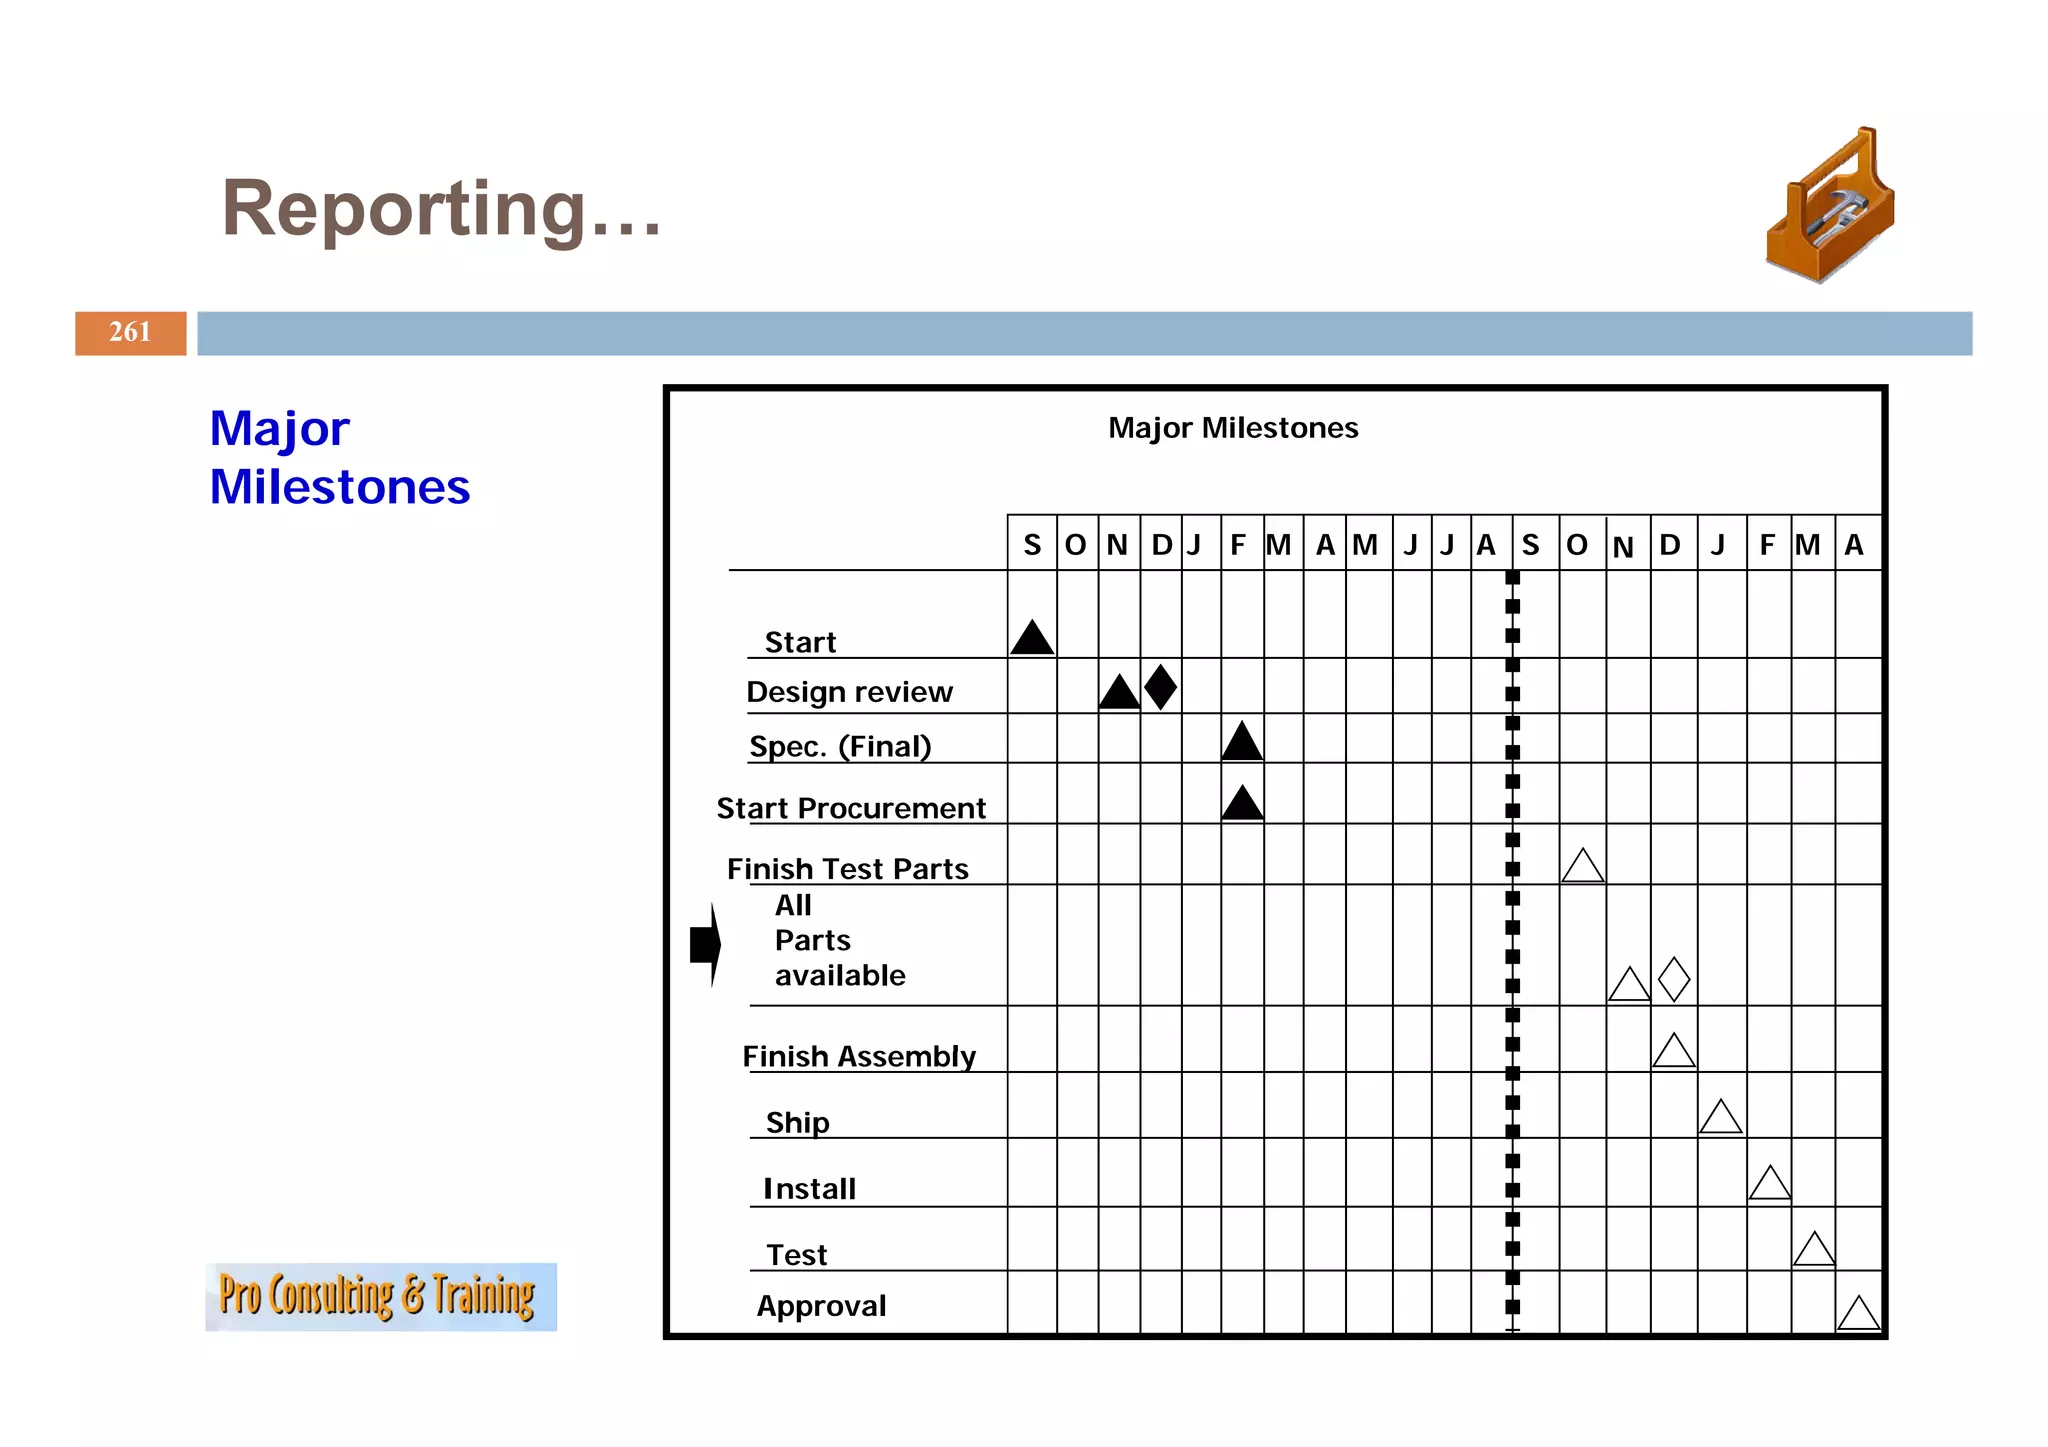
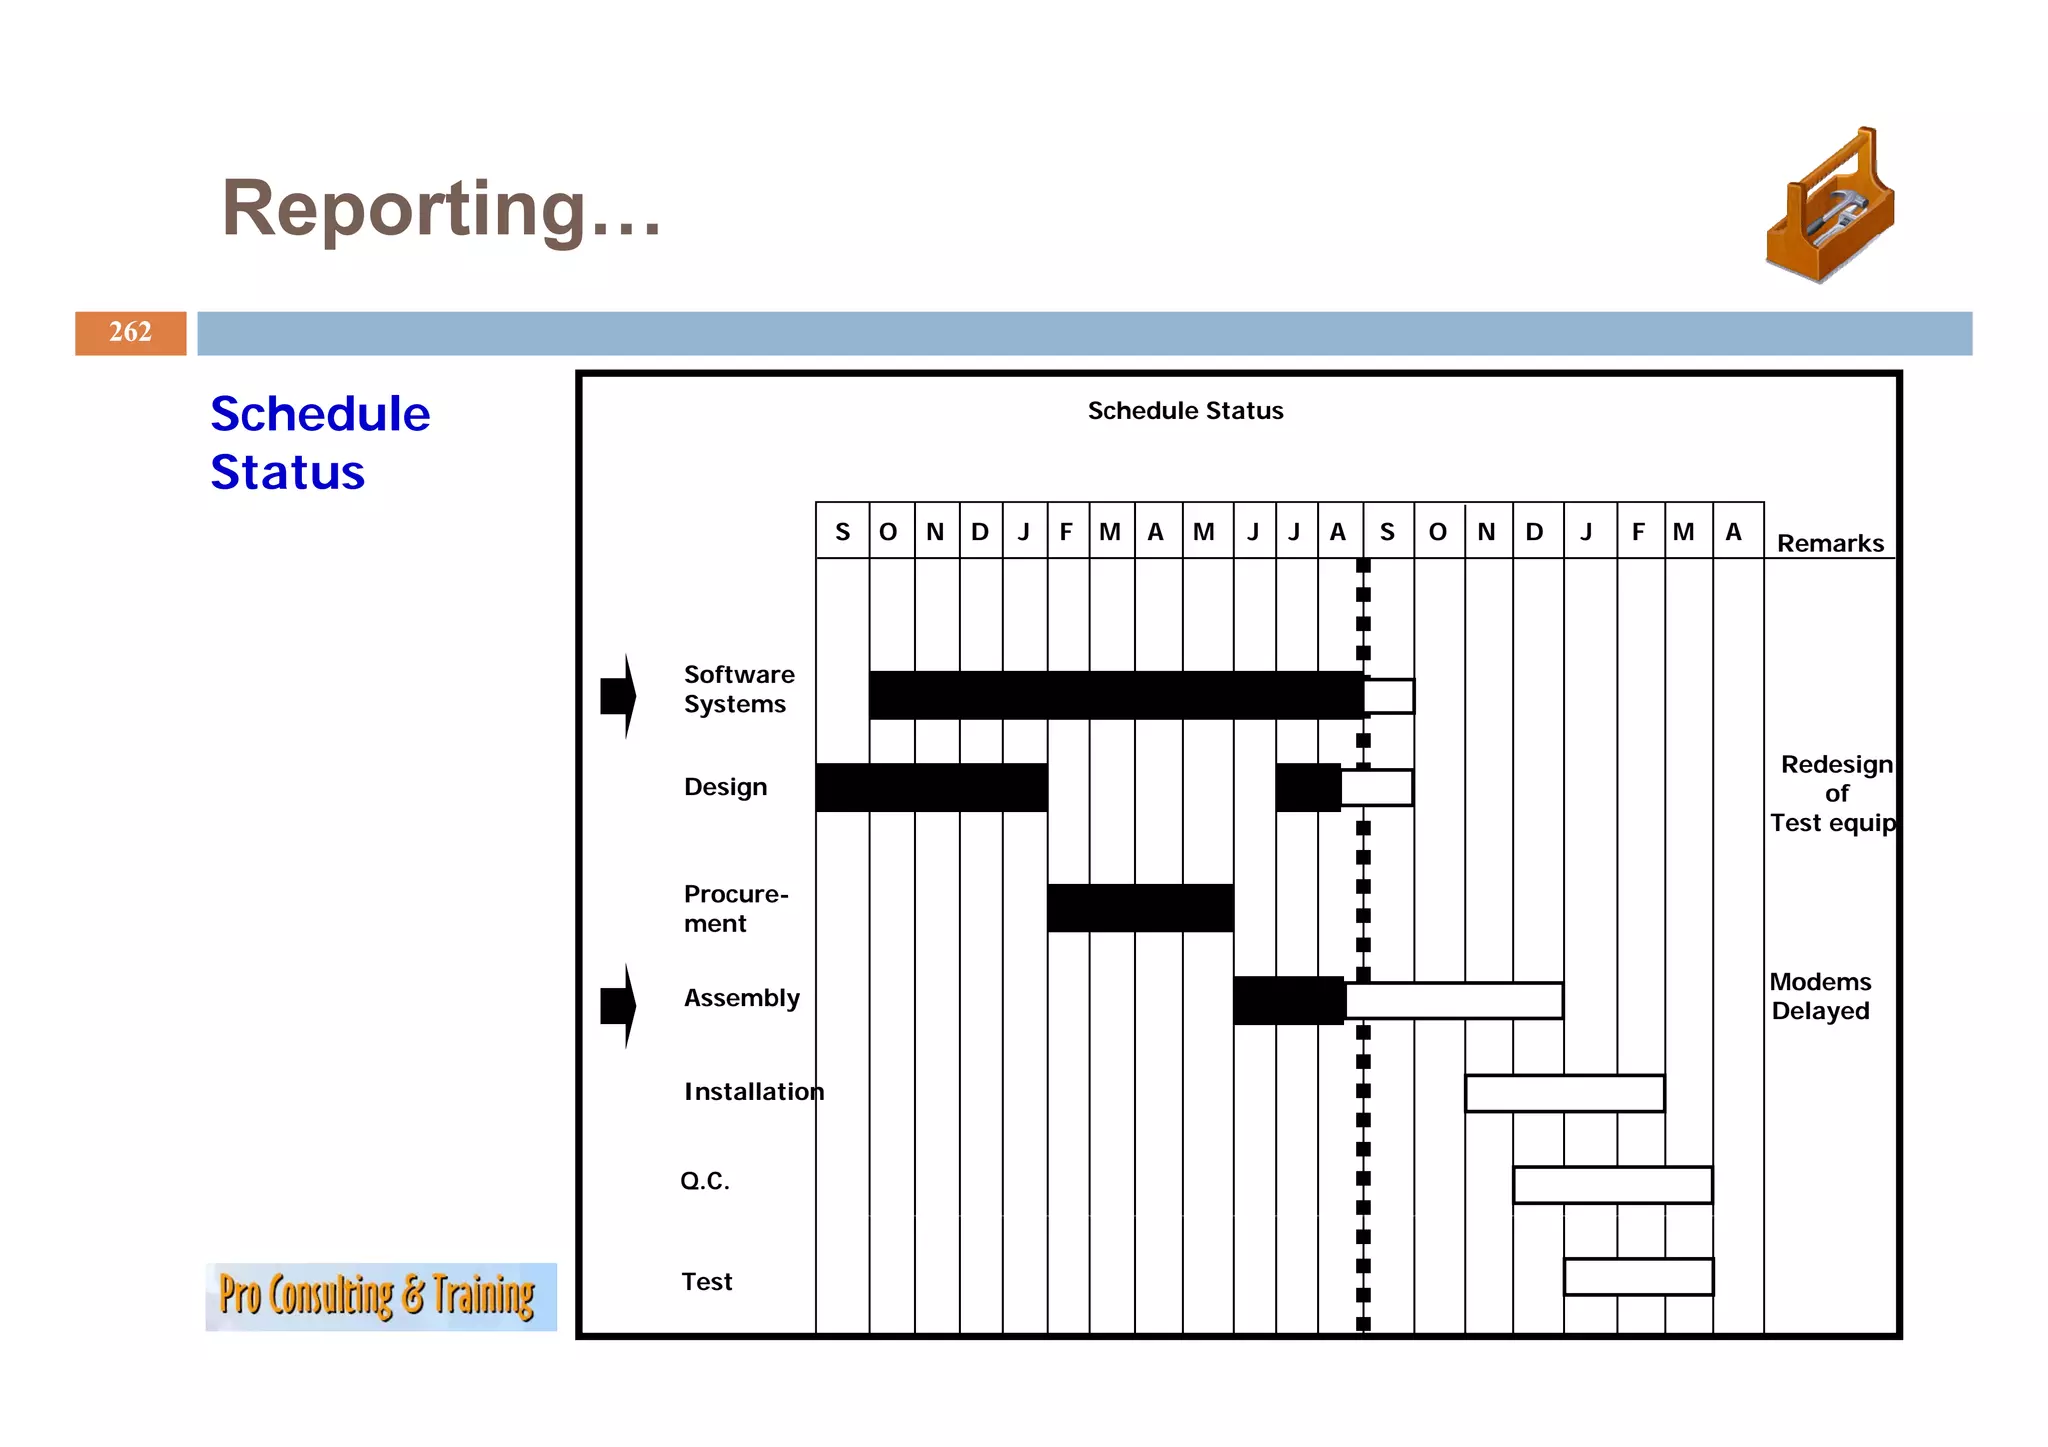
Introduction to project scheduling methods, focusing on PERT and Gantt charts.
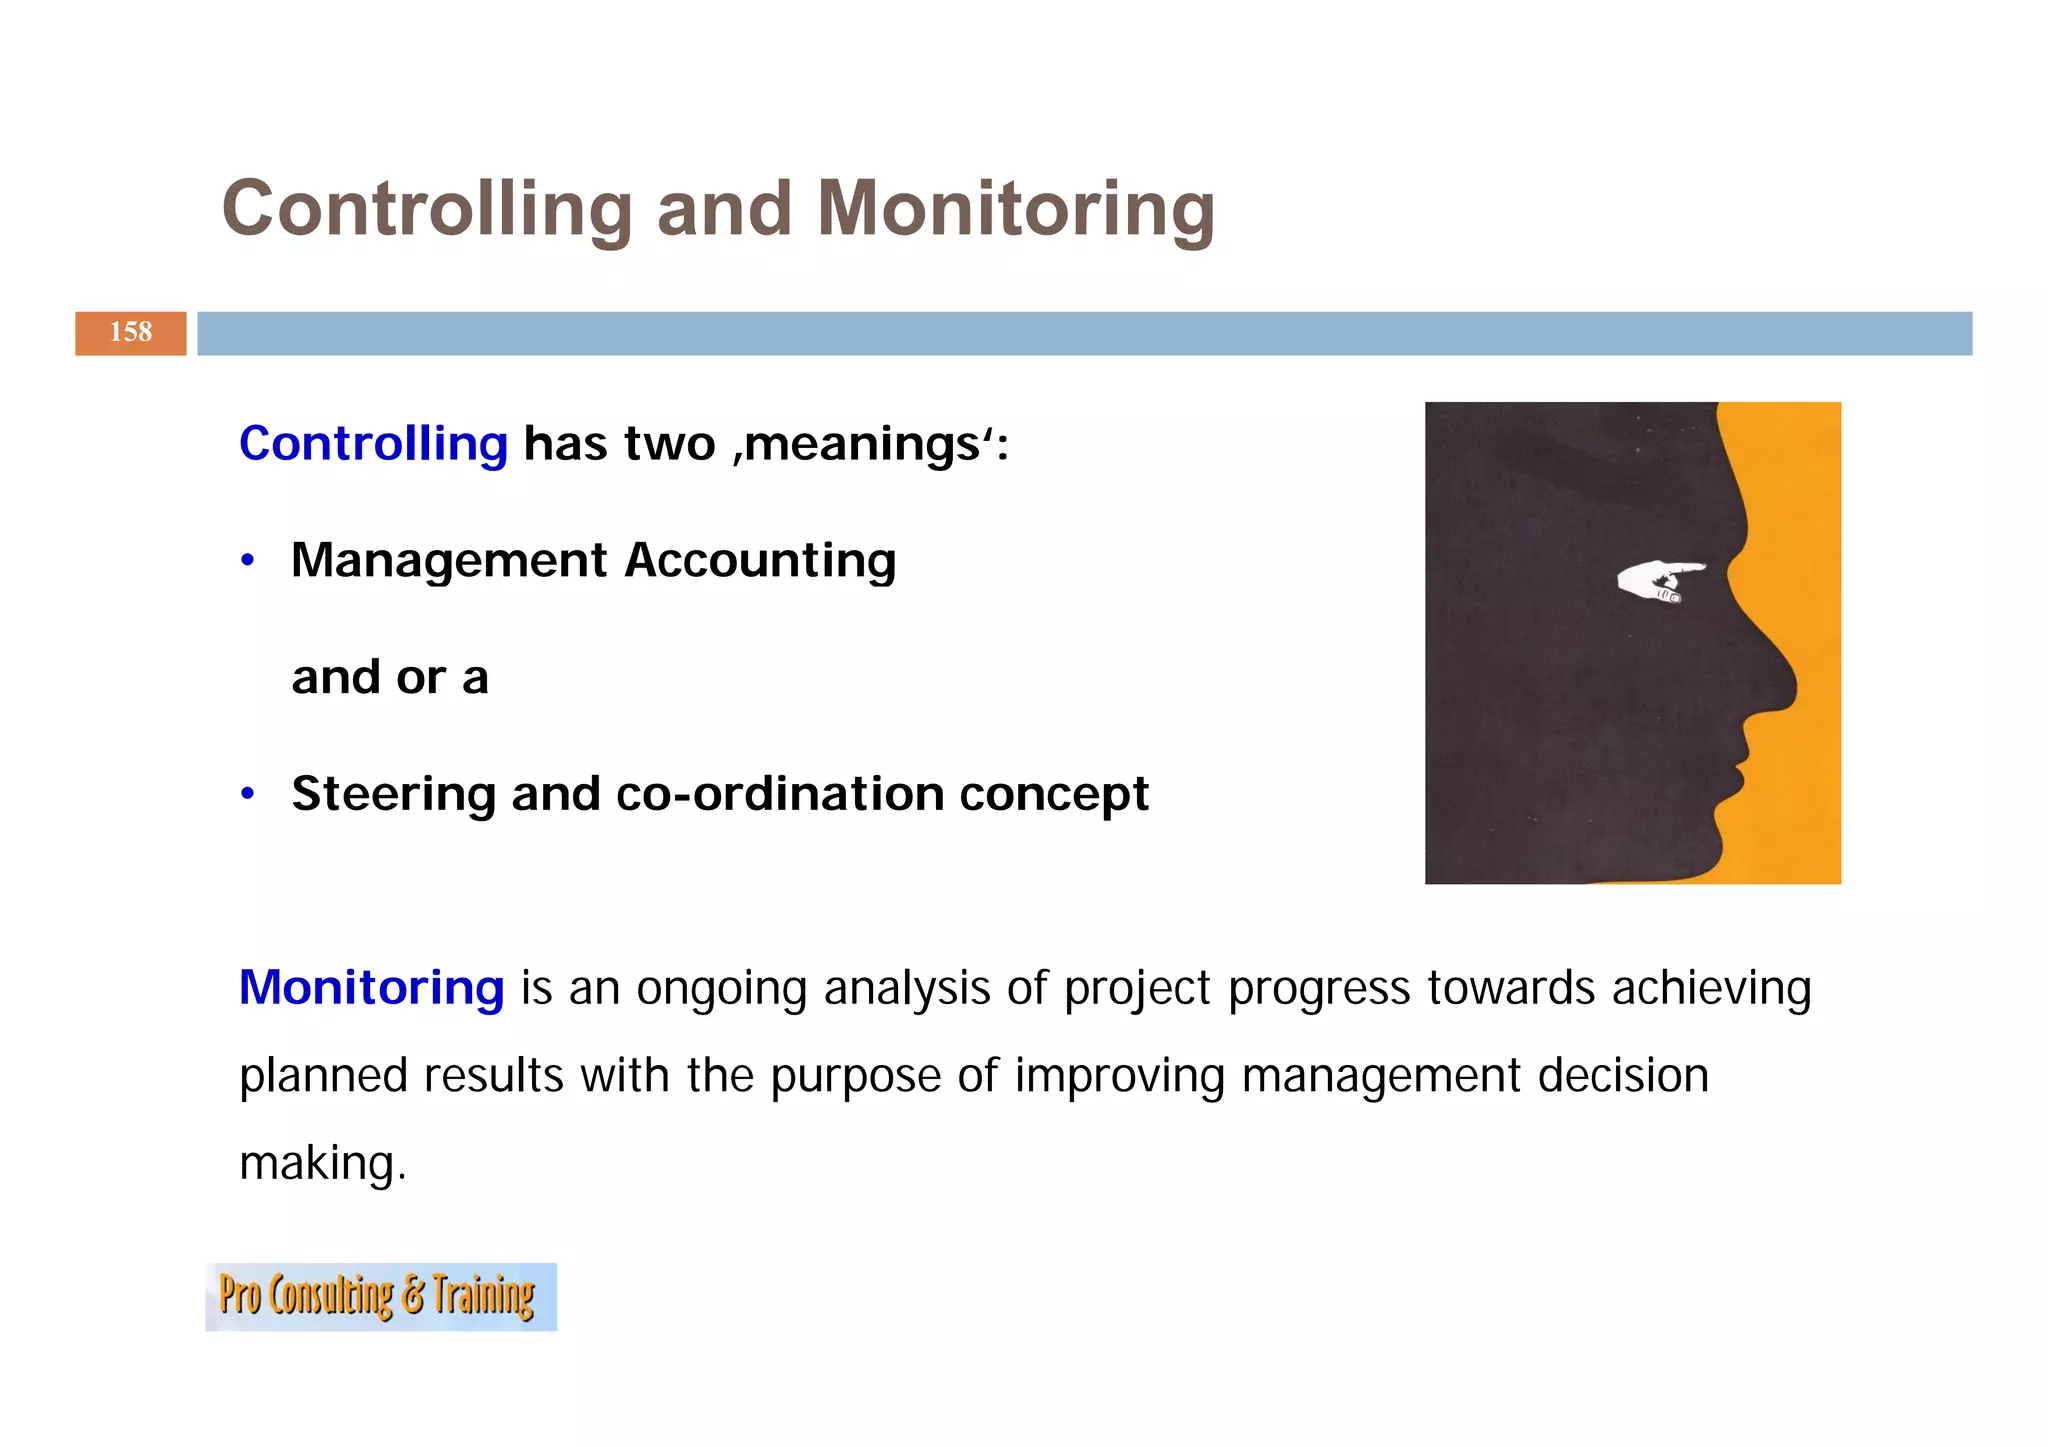
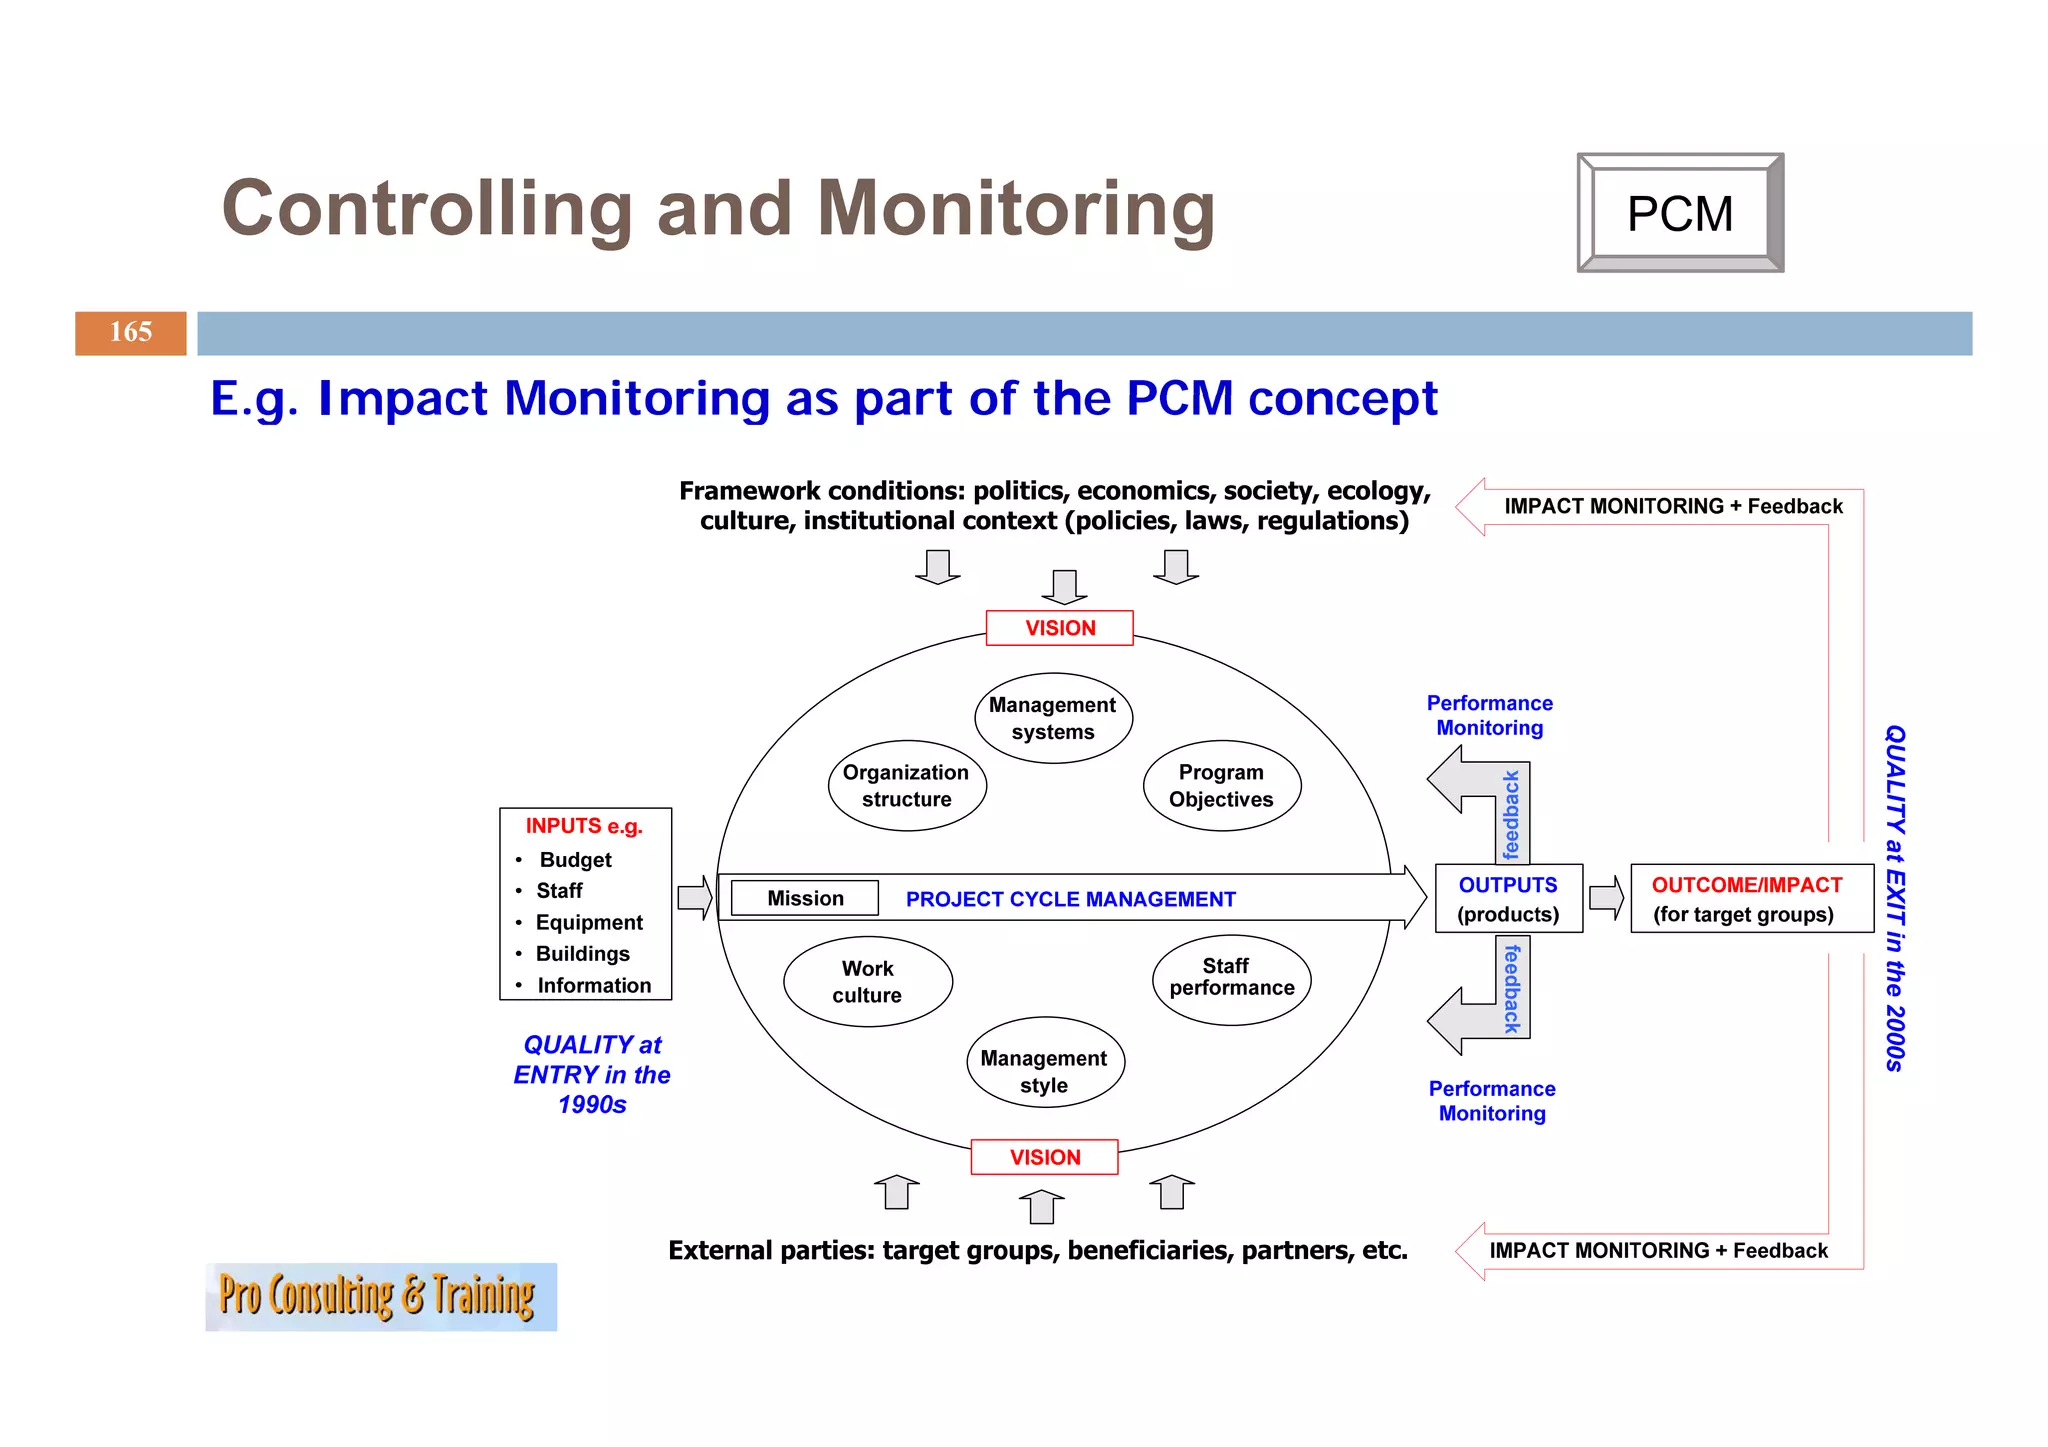
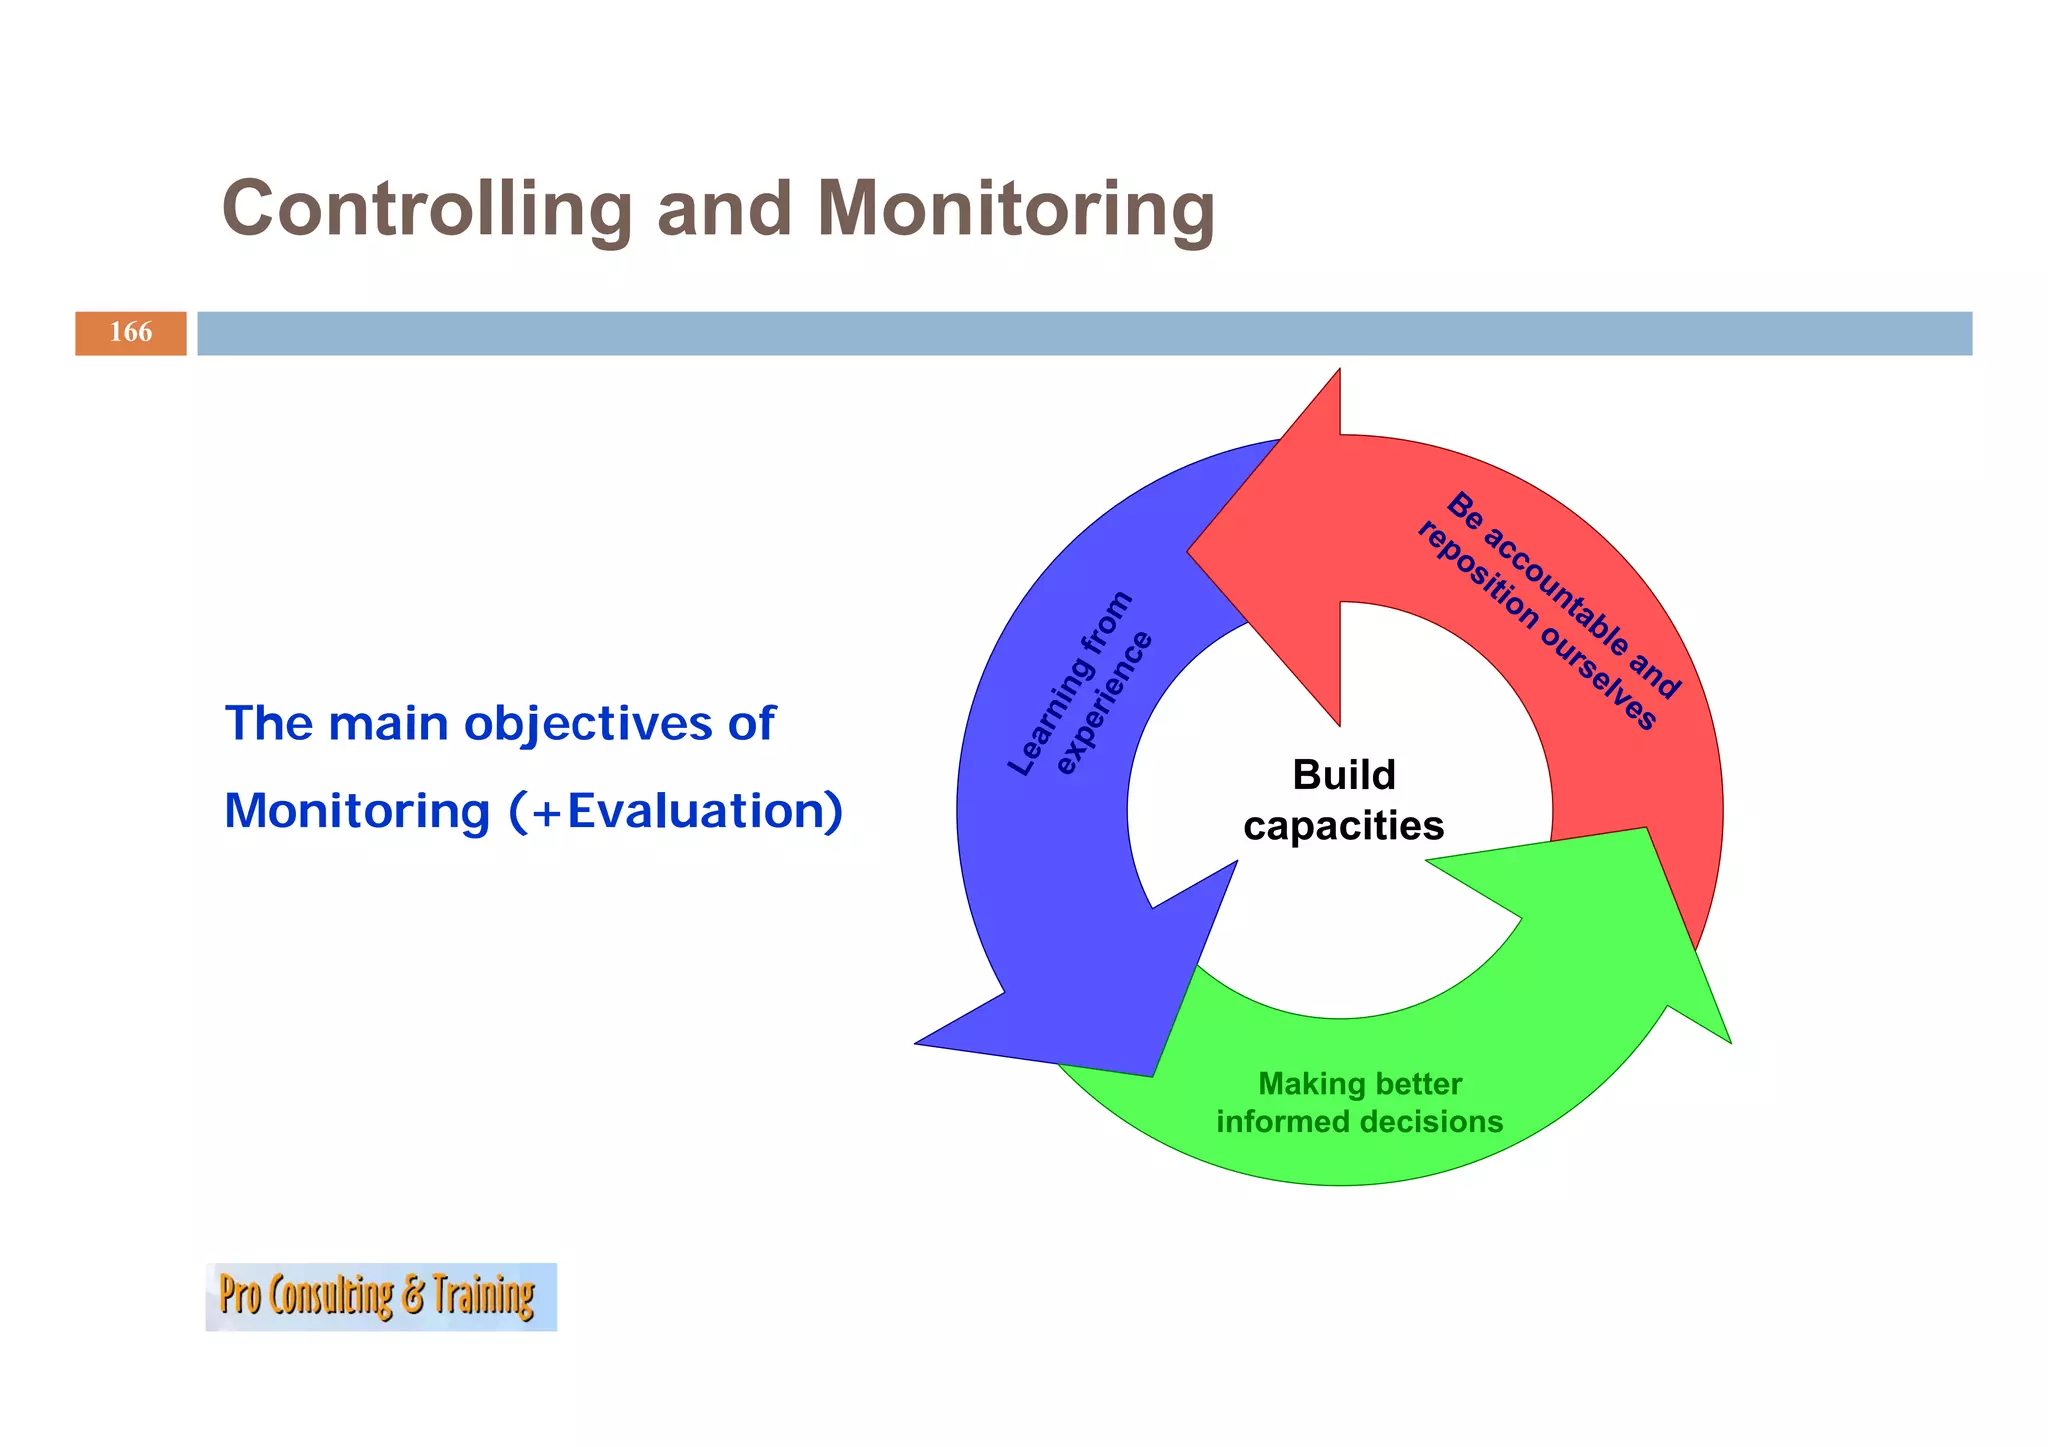
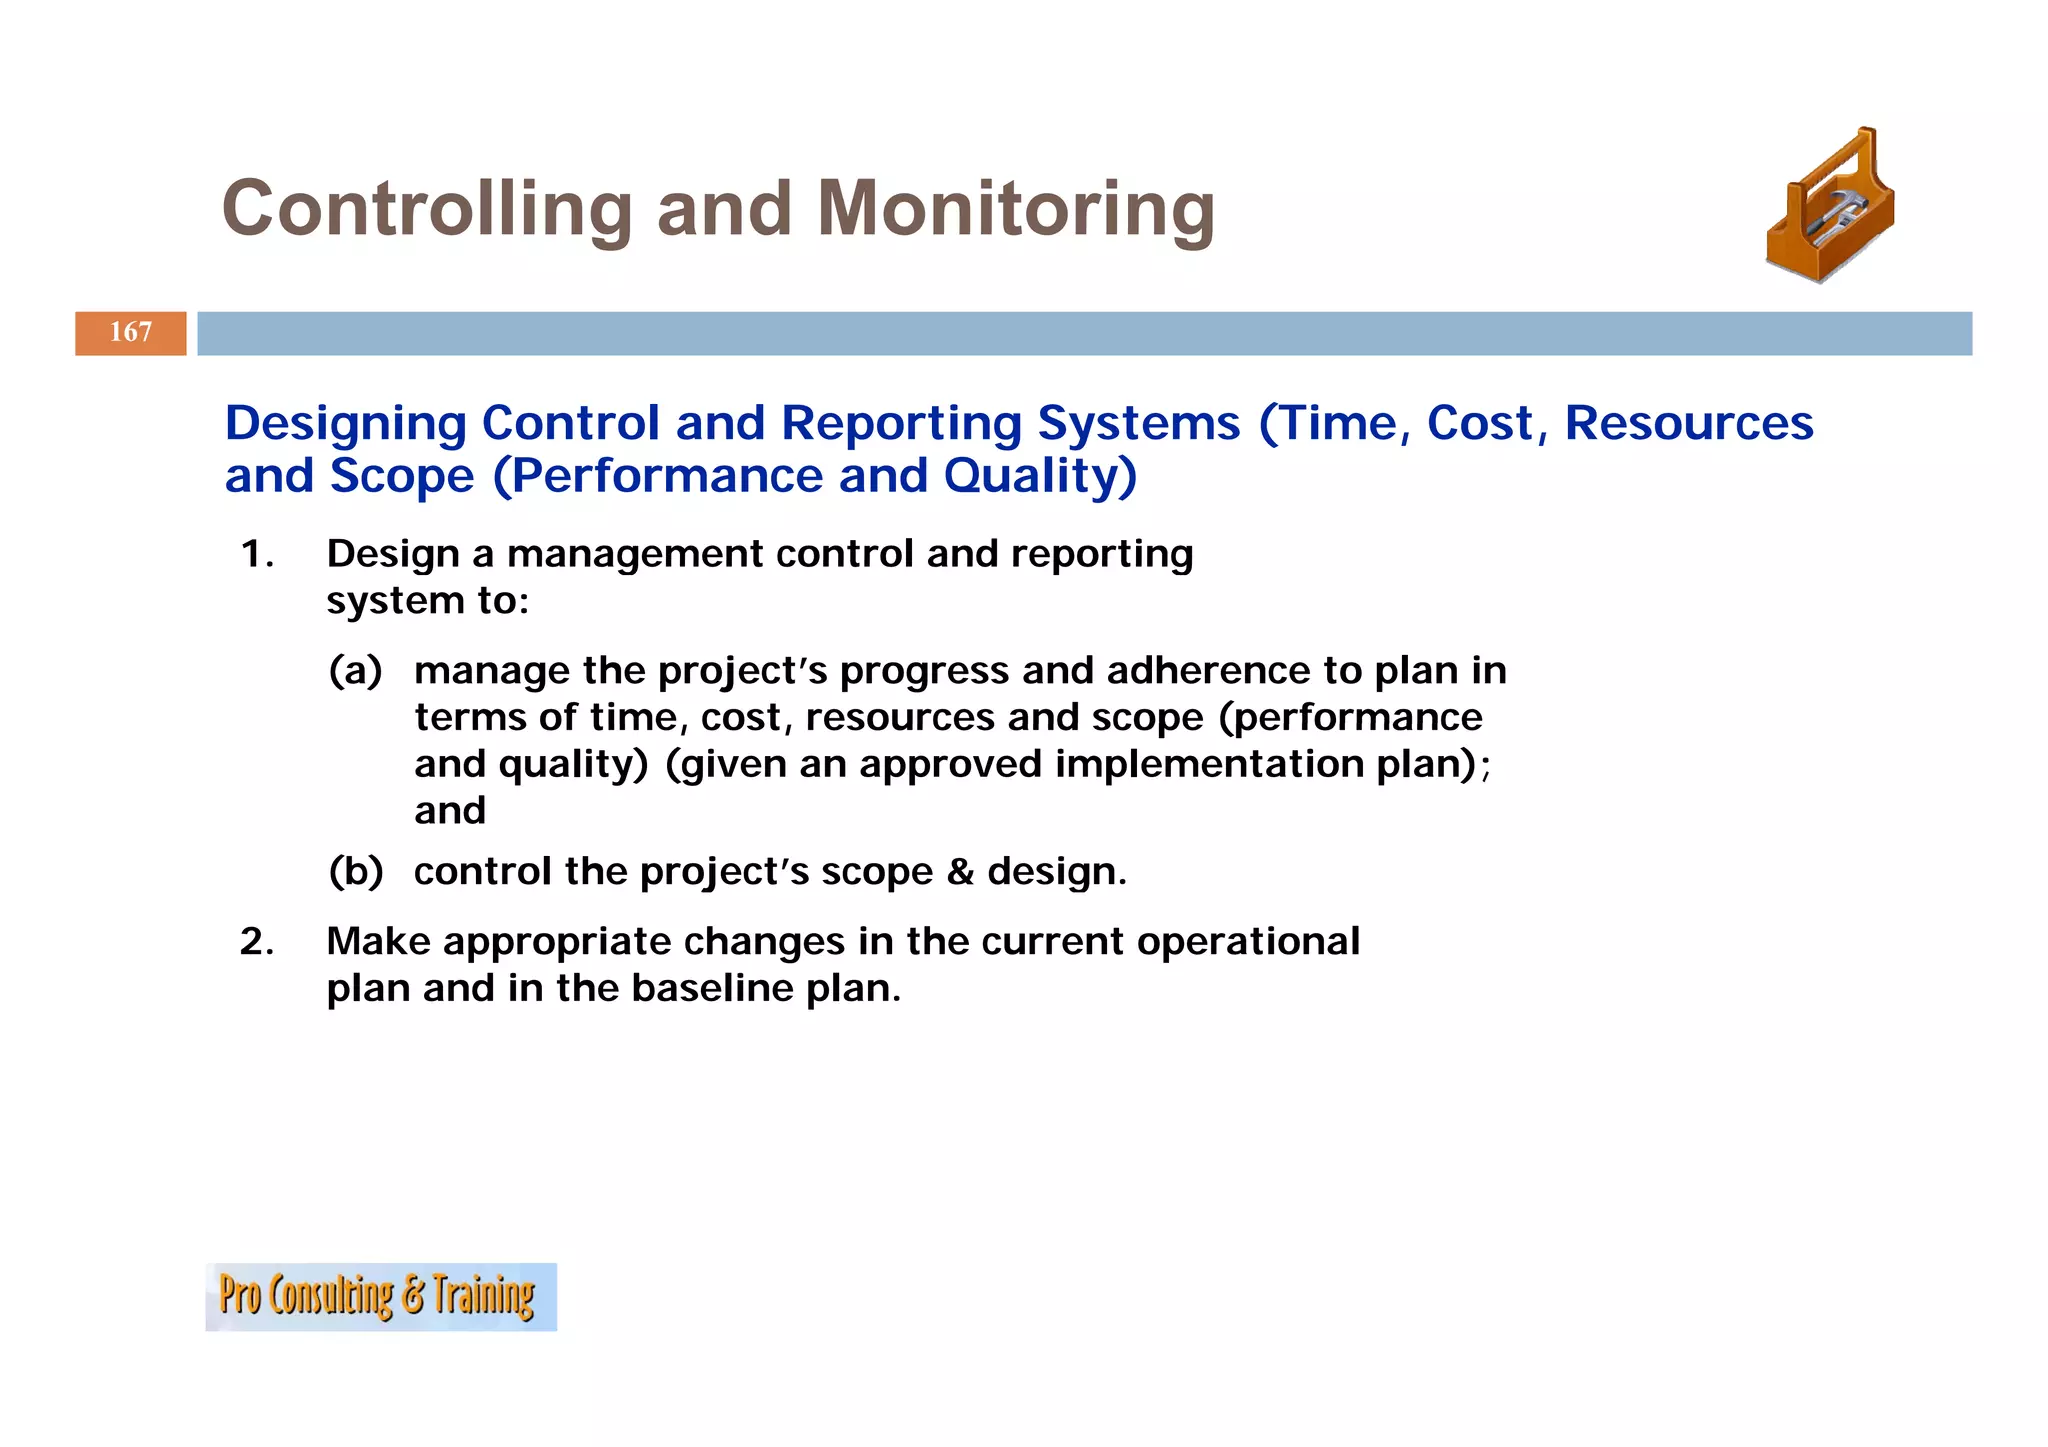
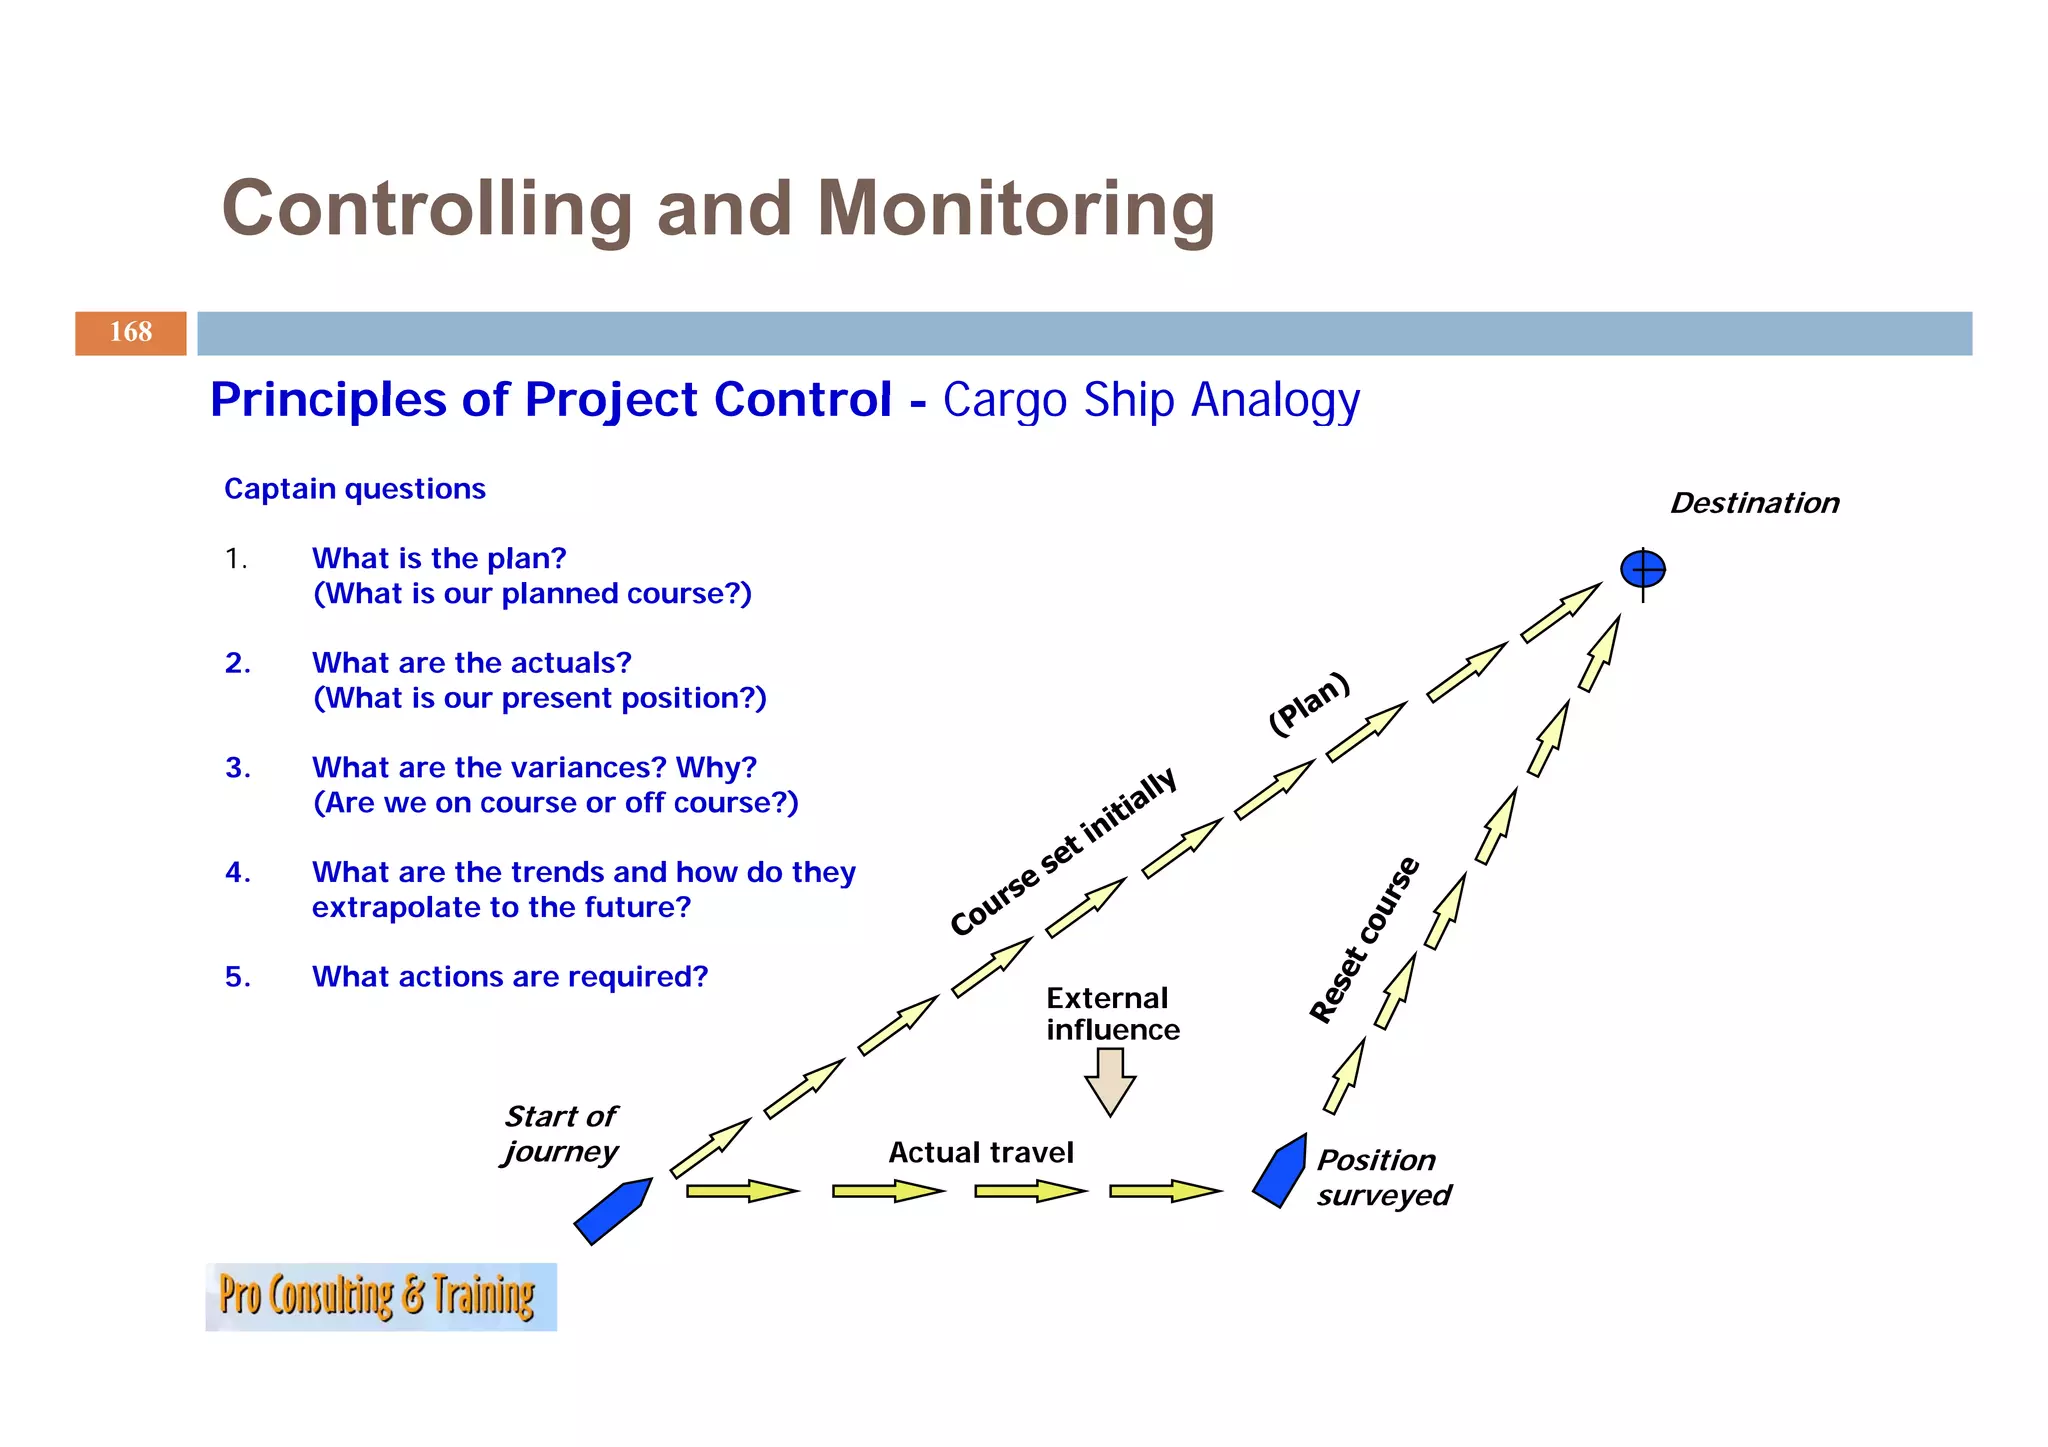
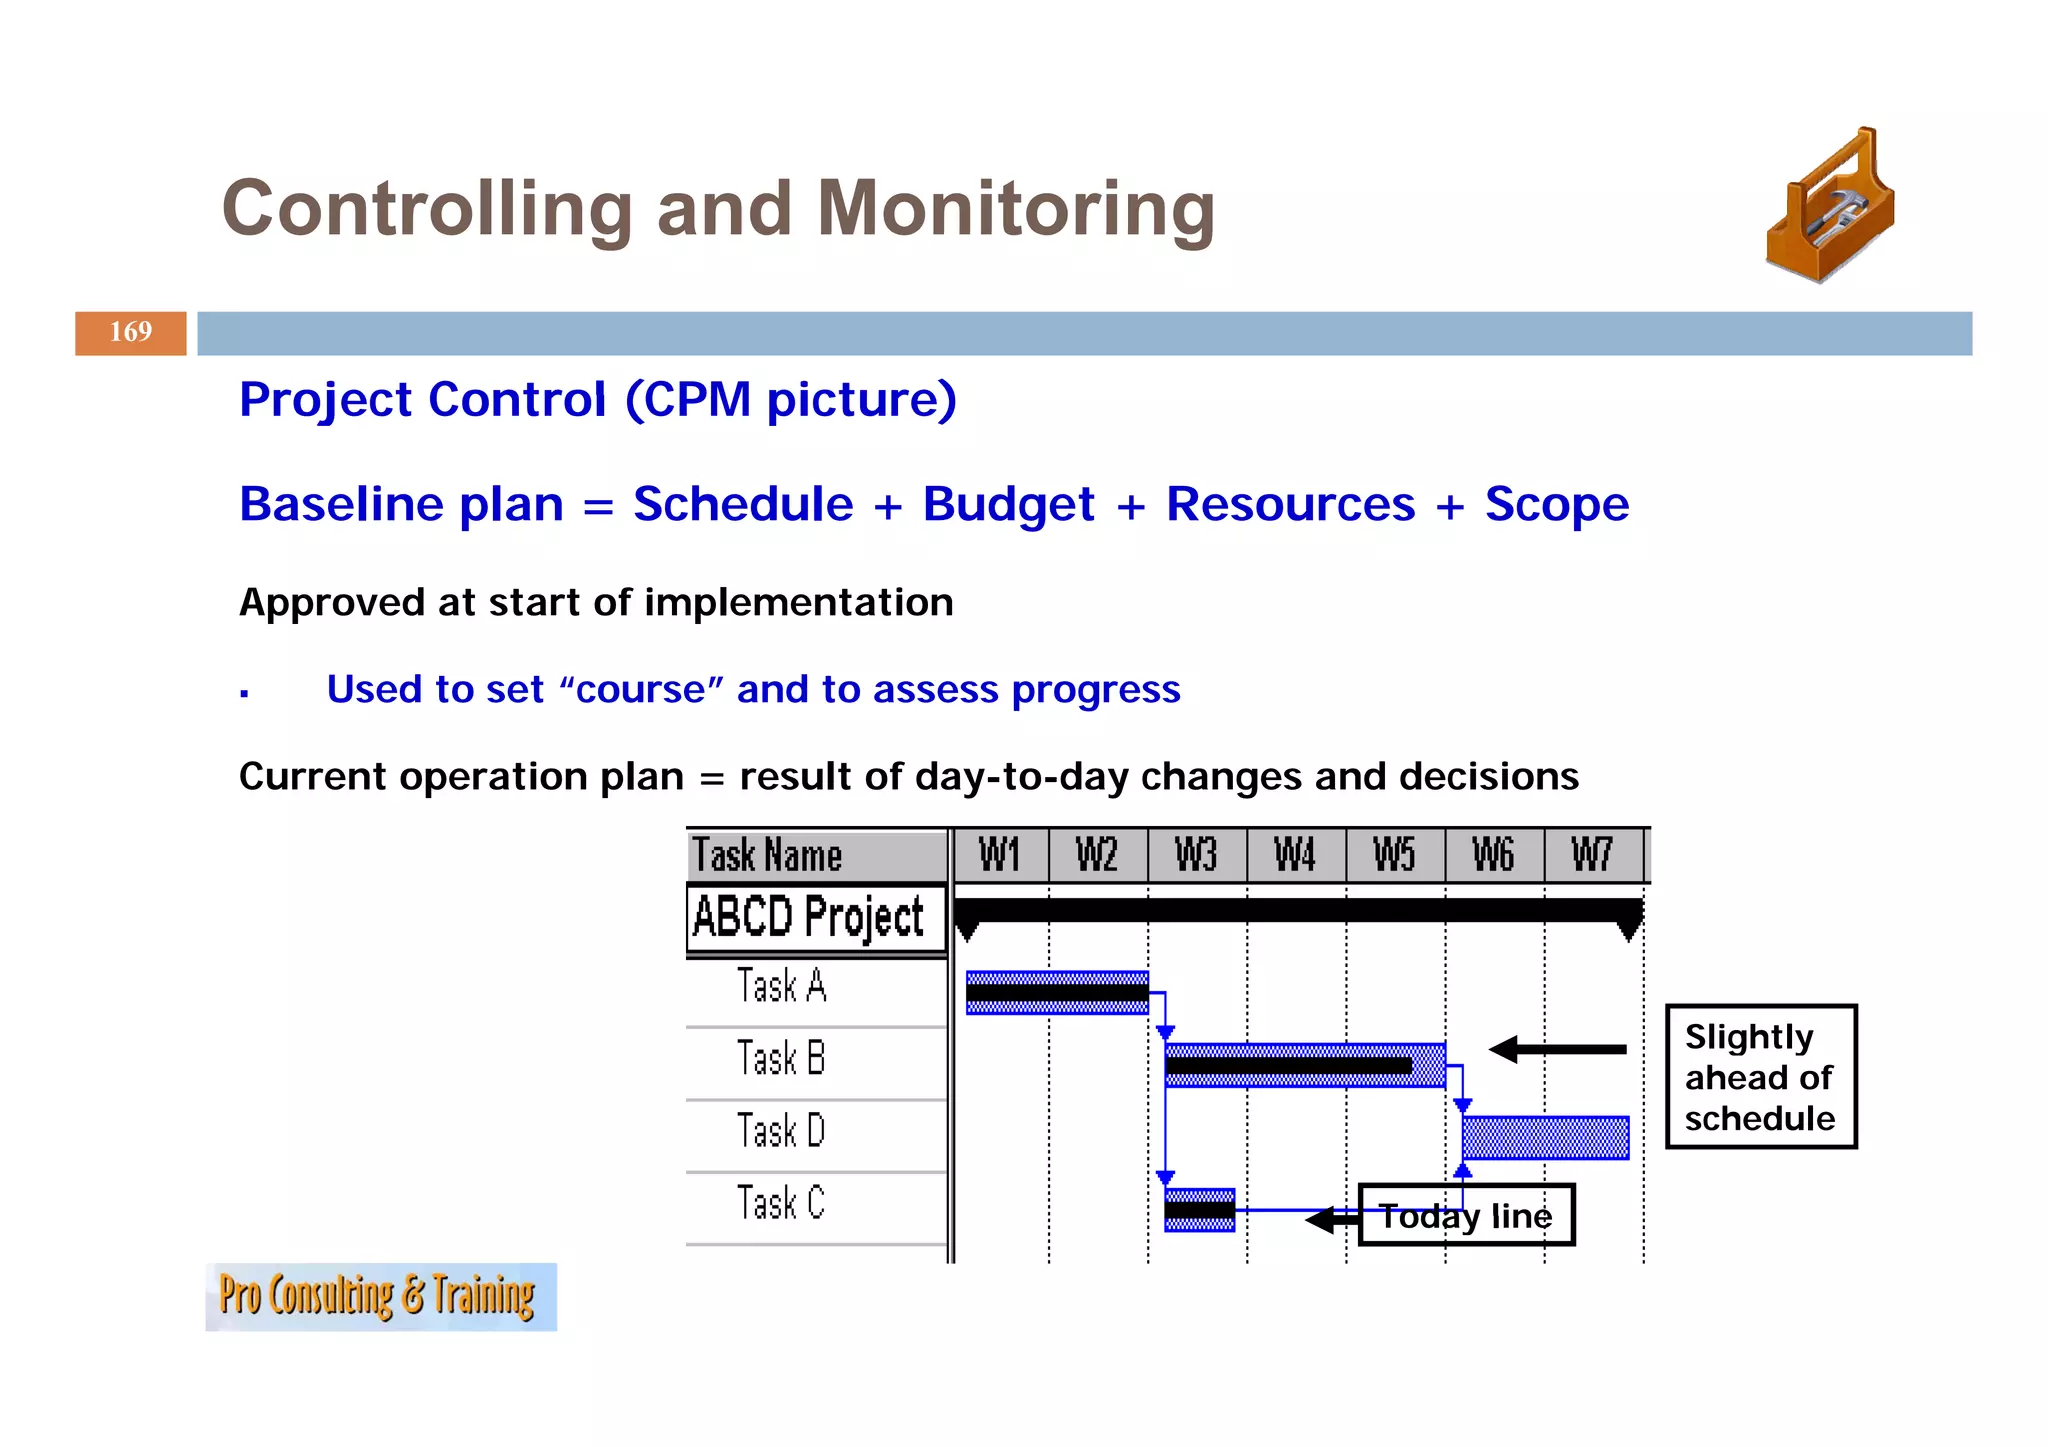
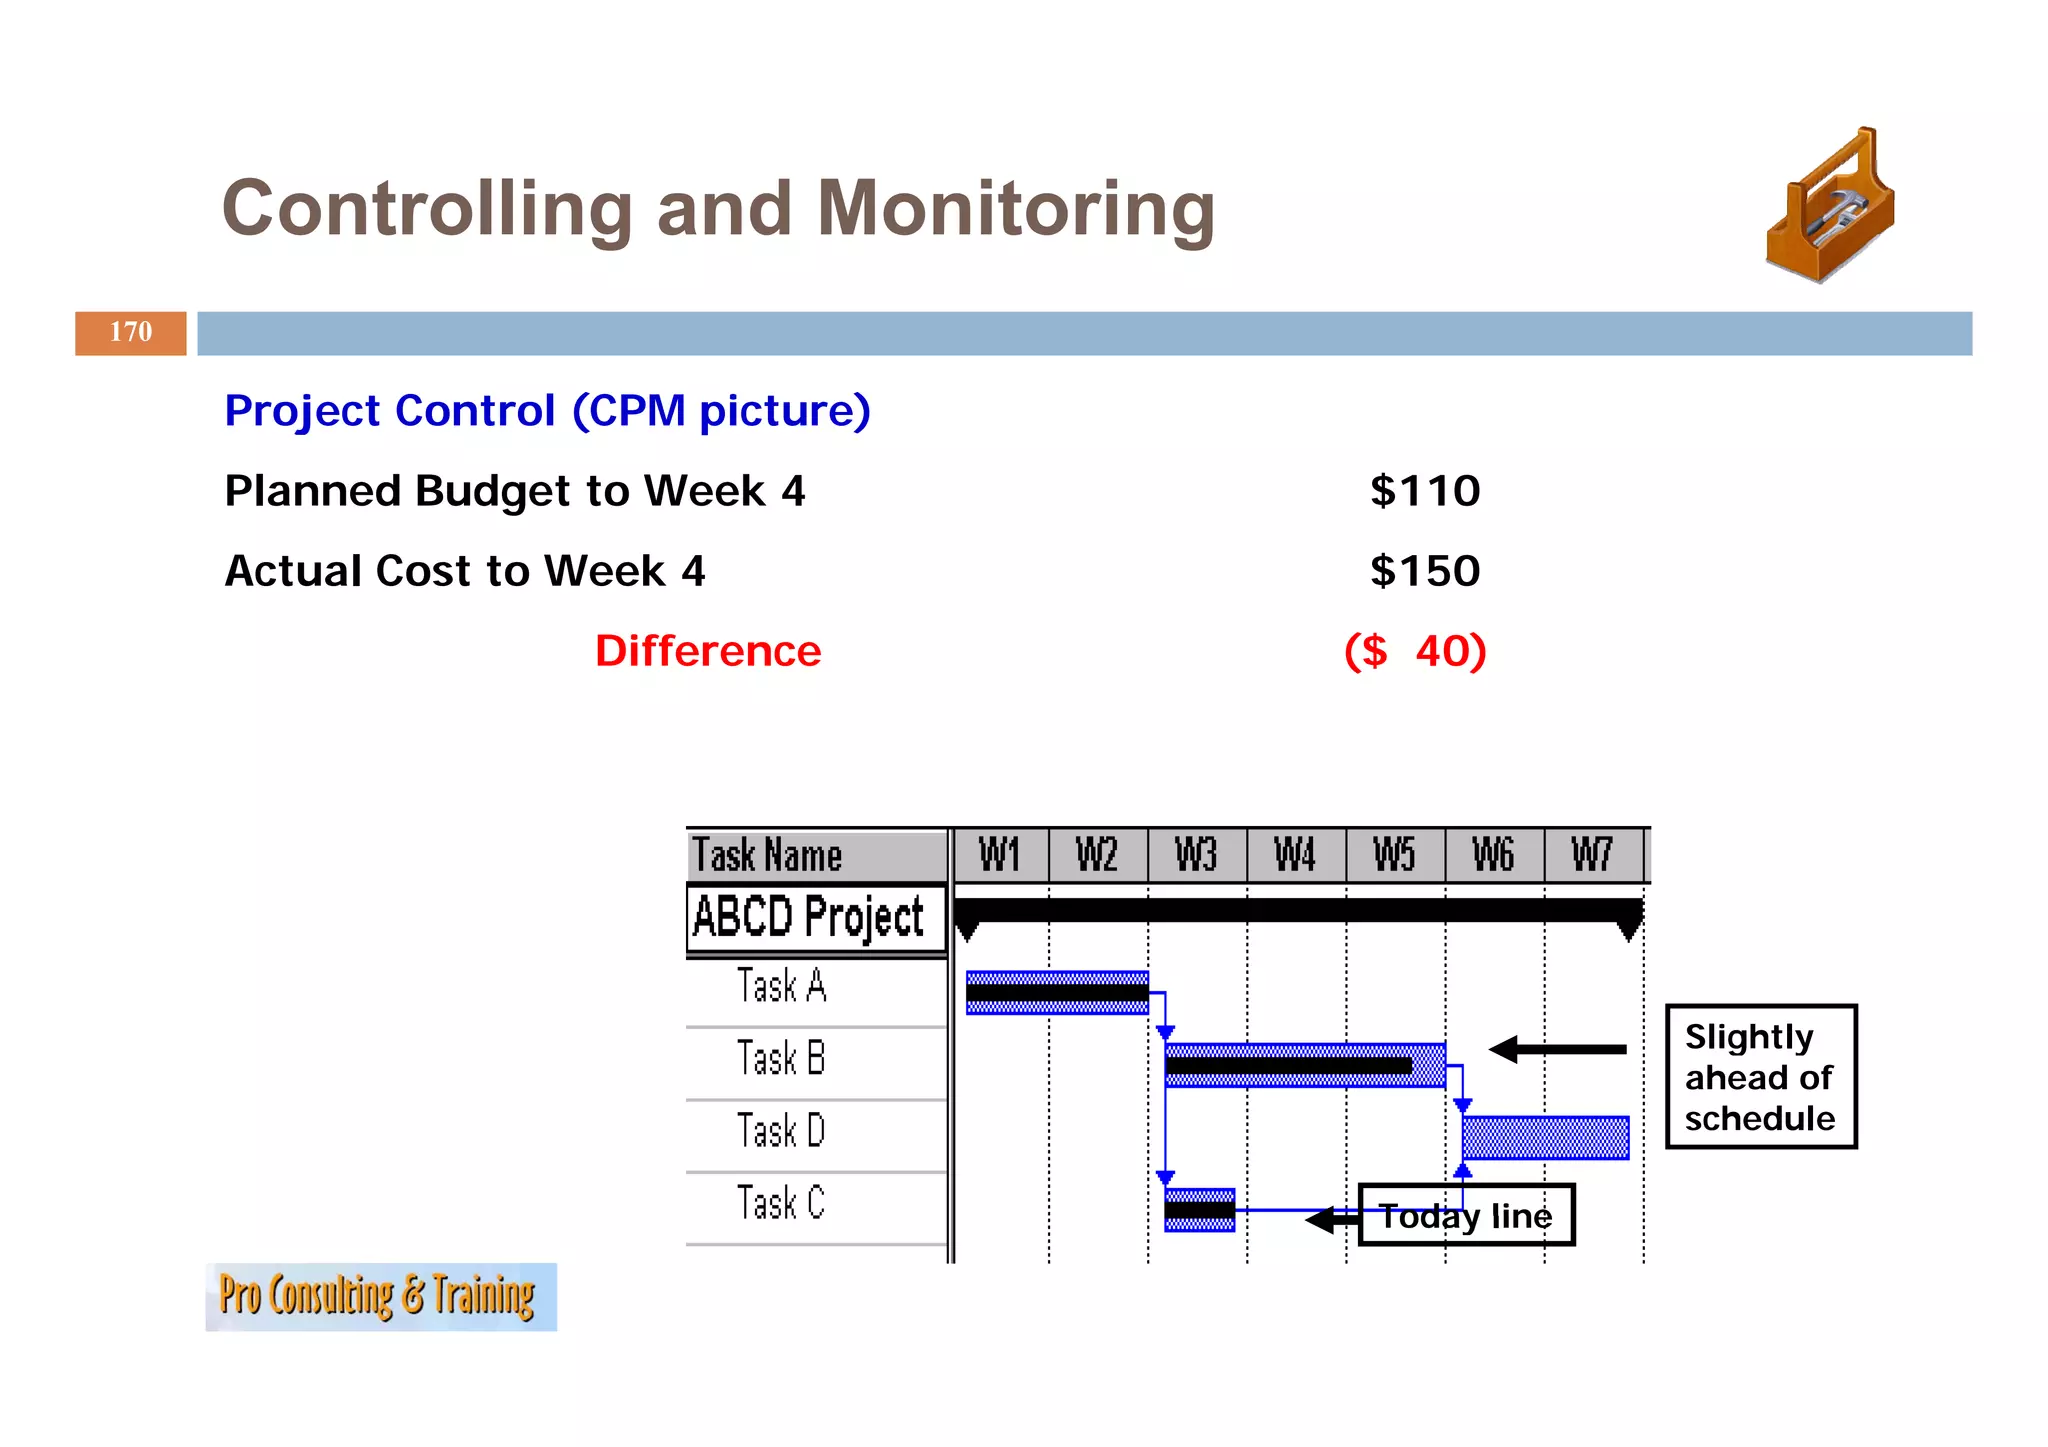
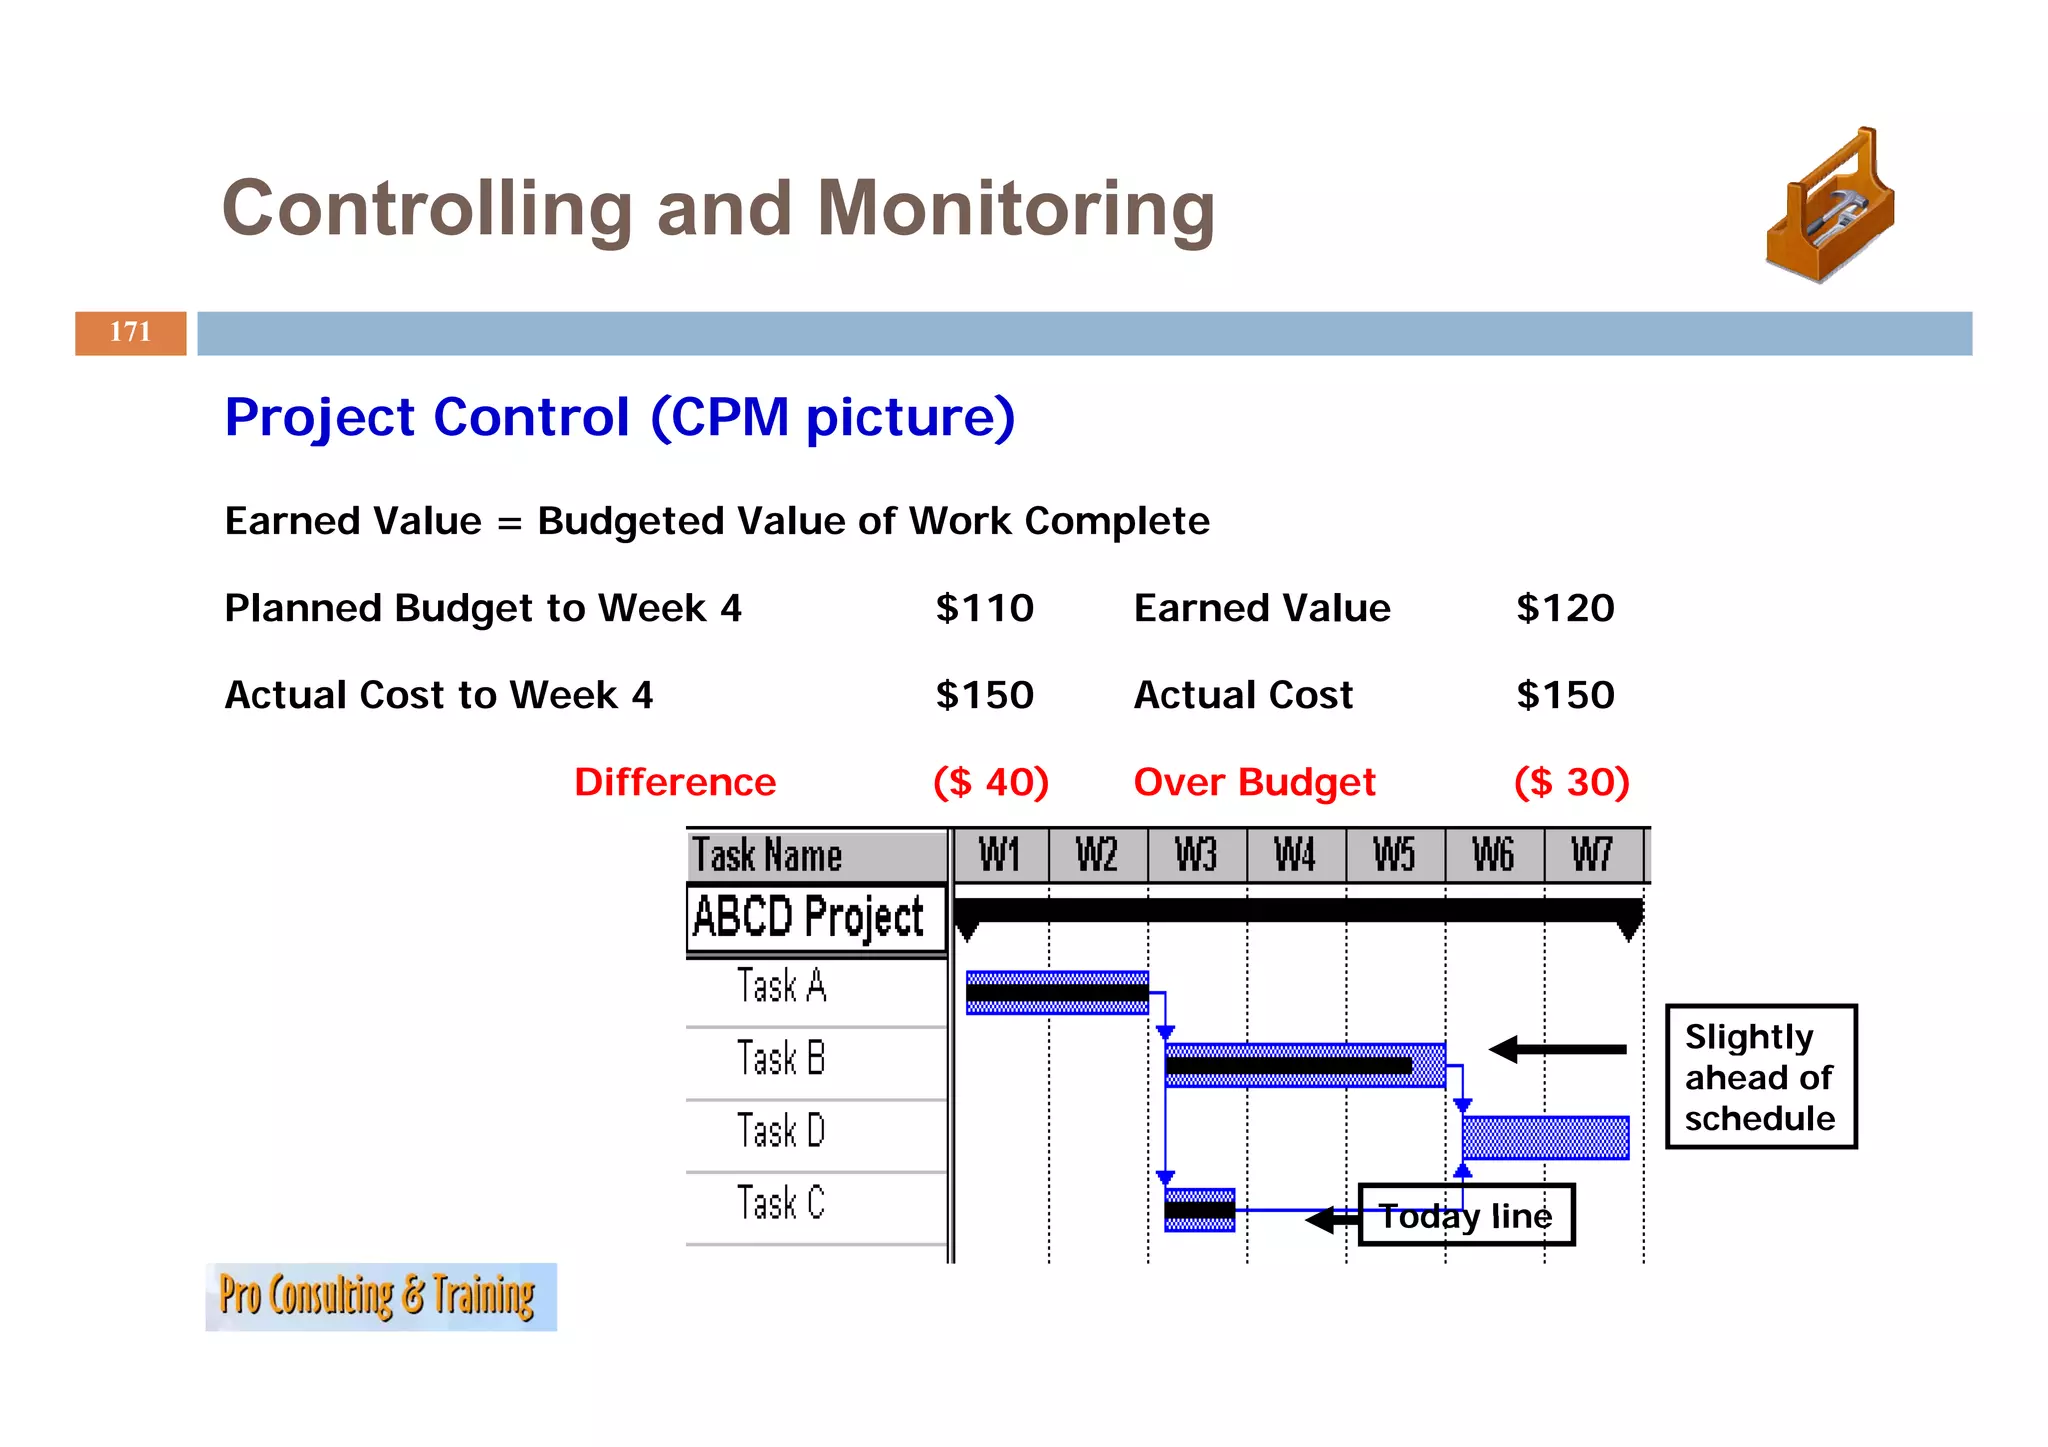
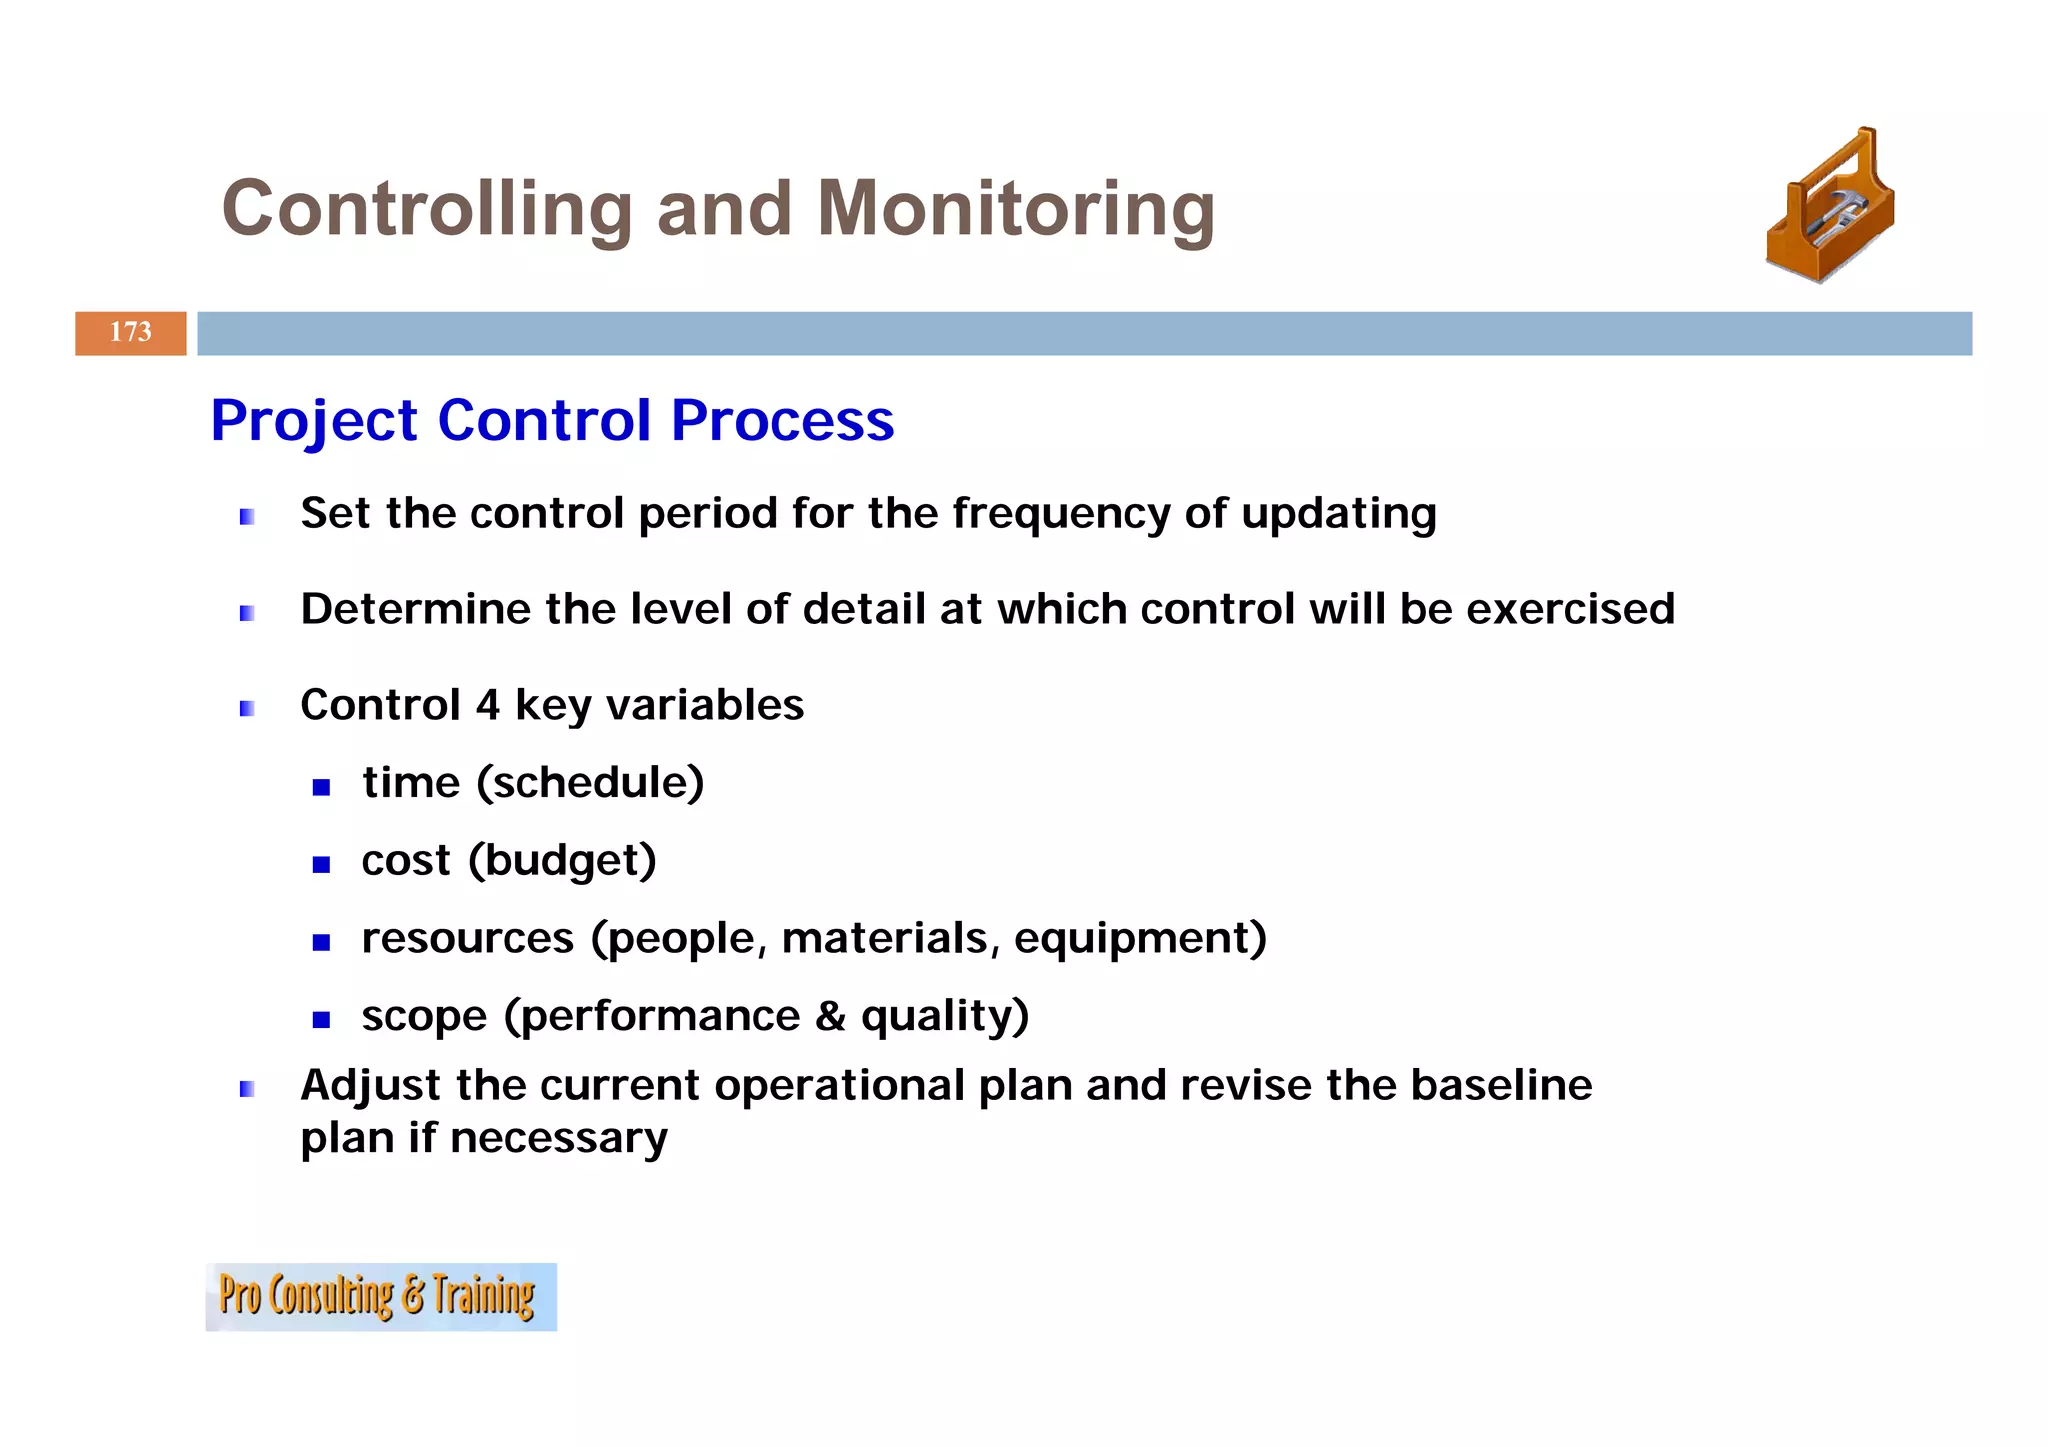
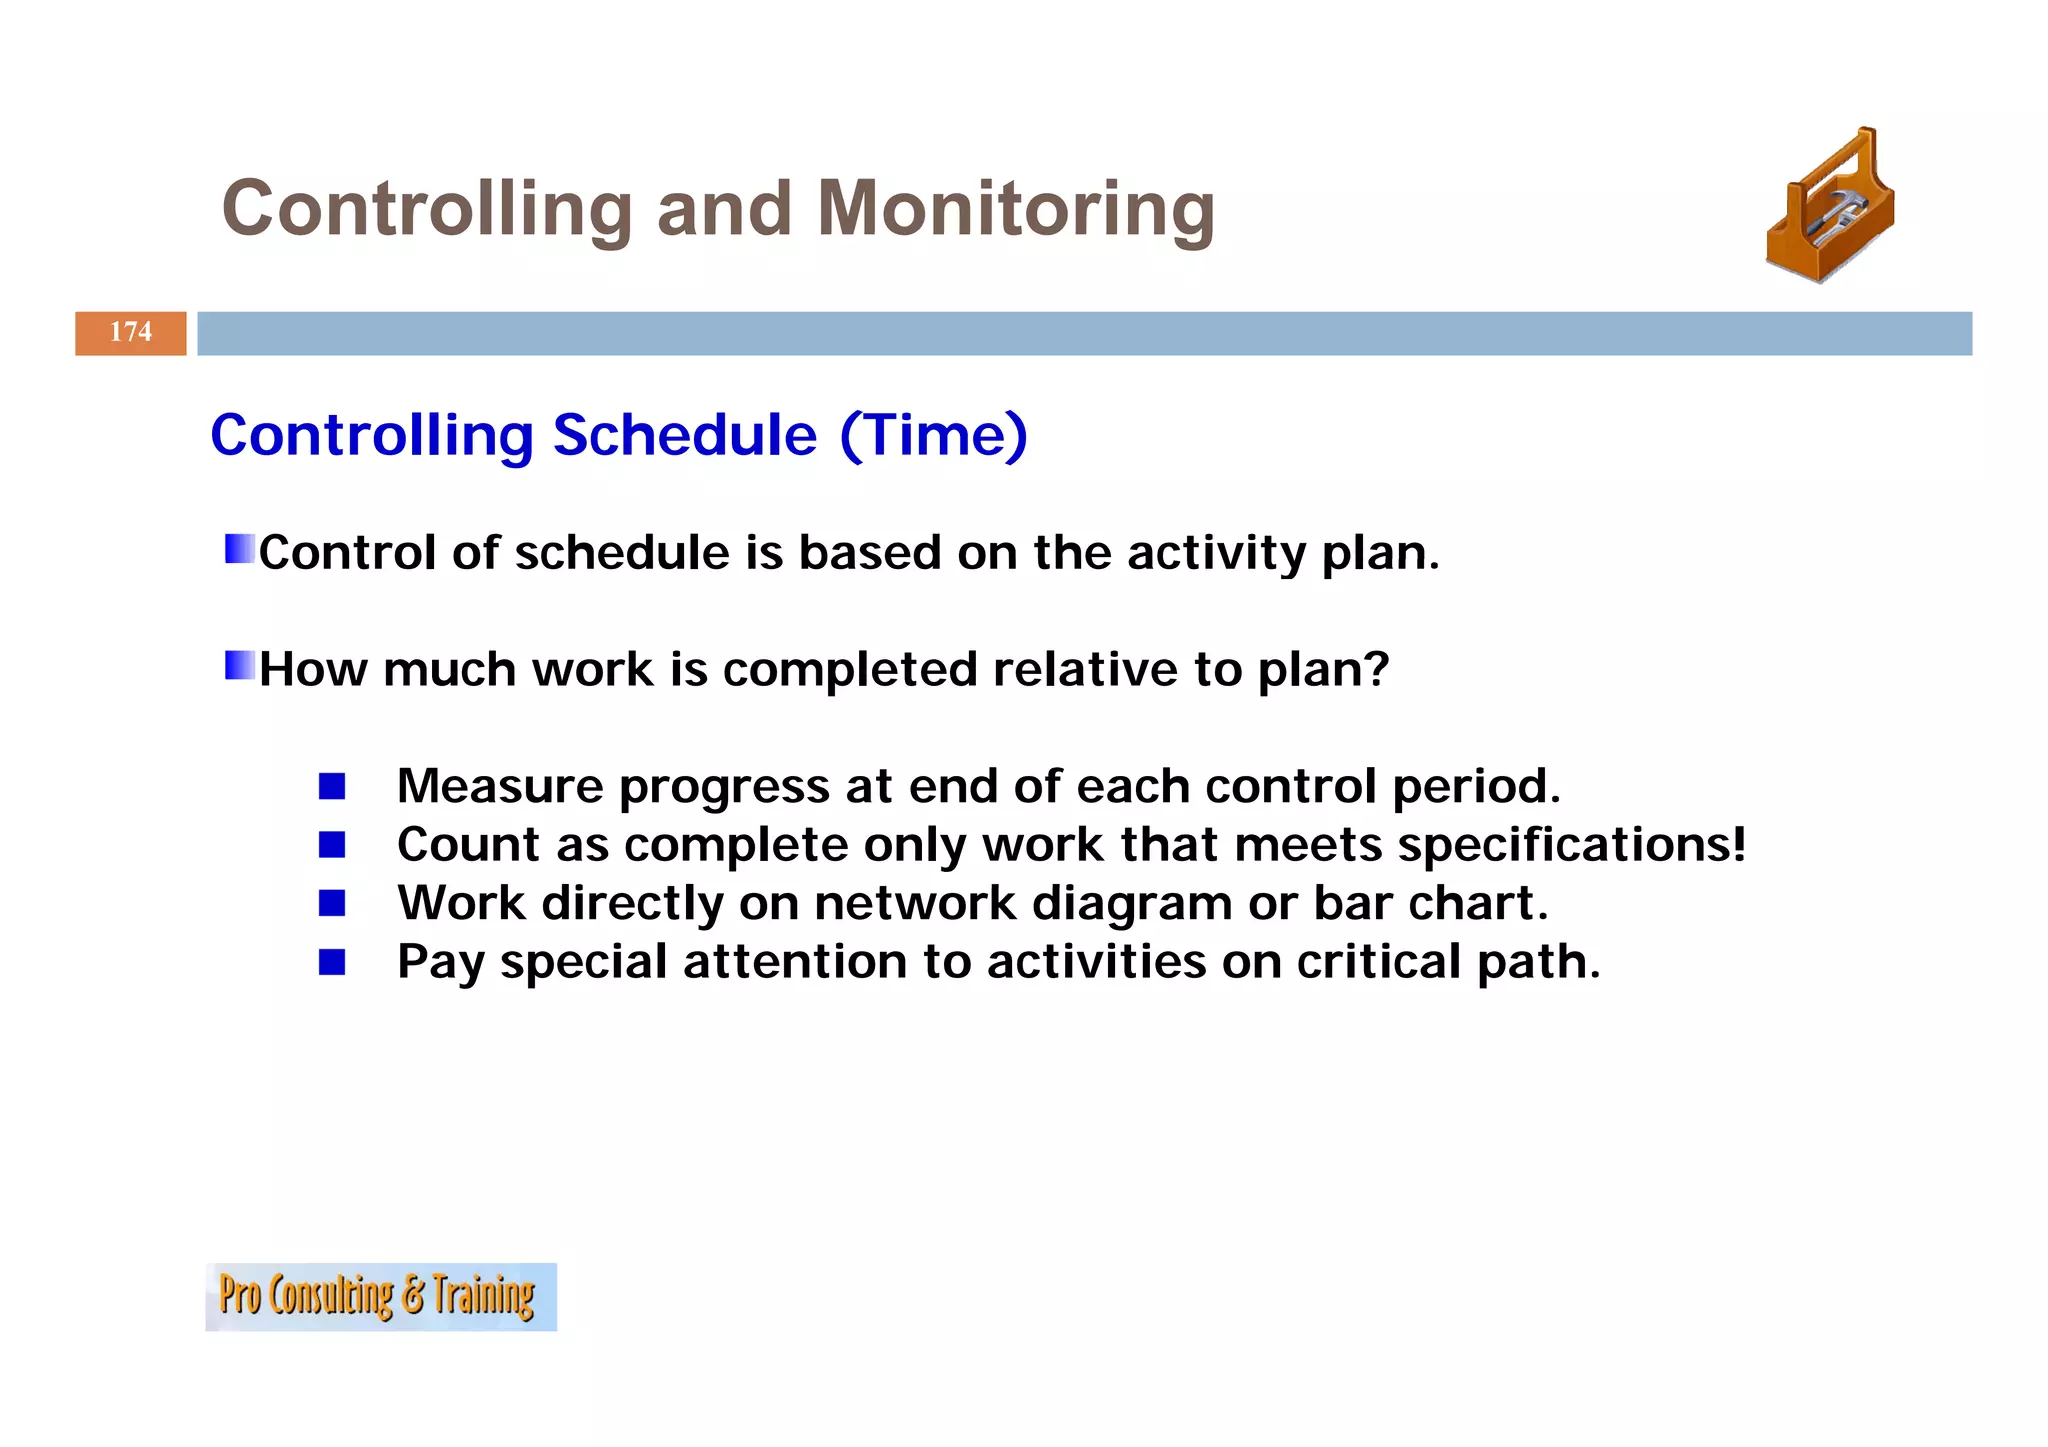
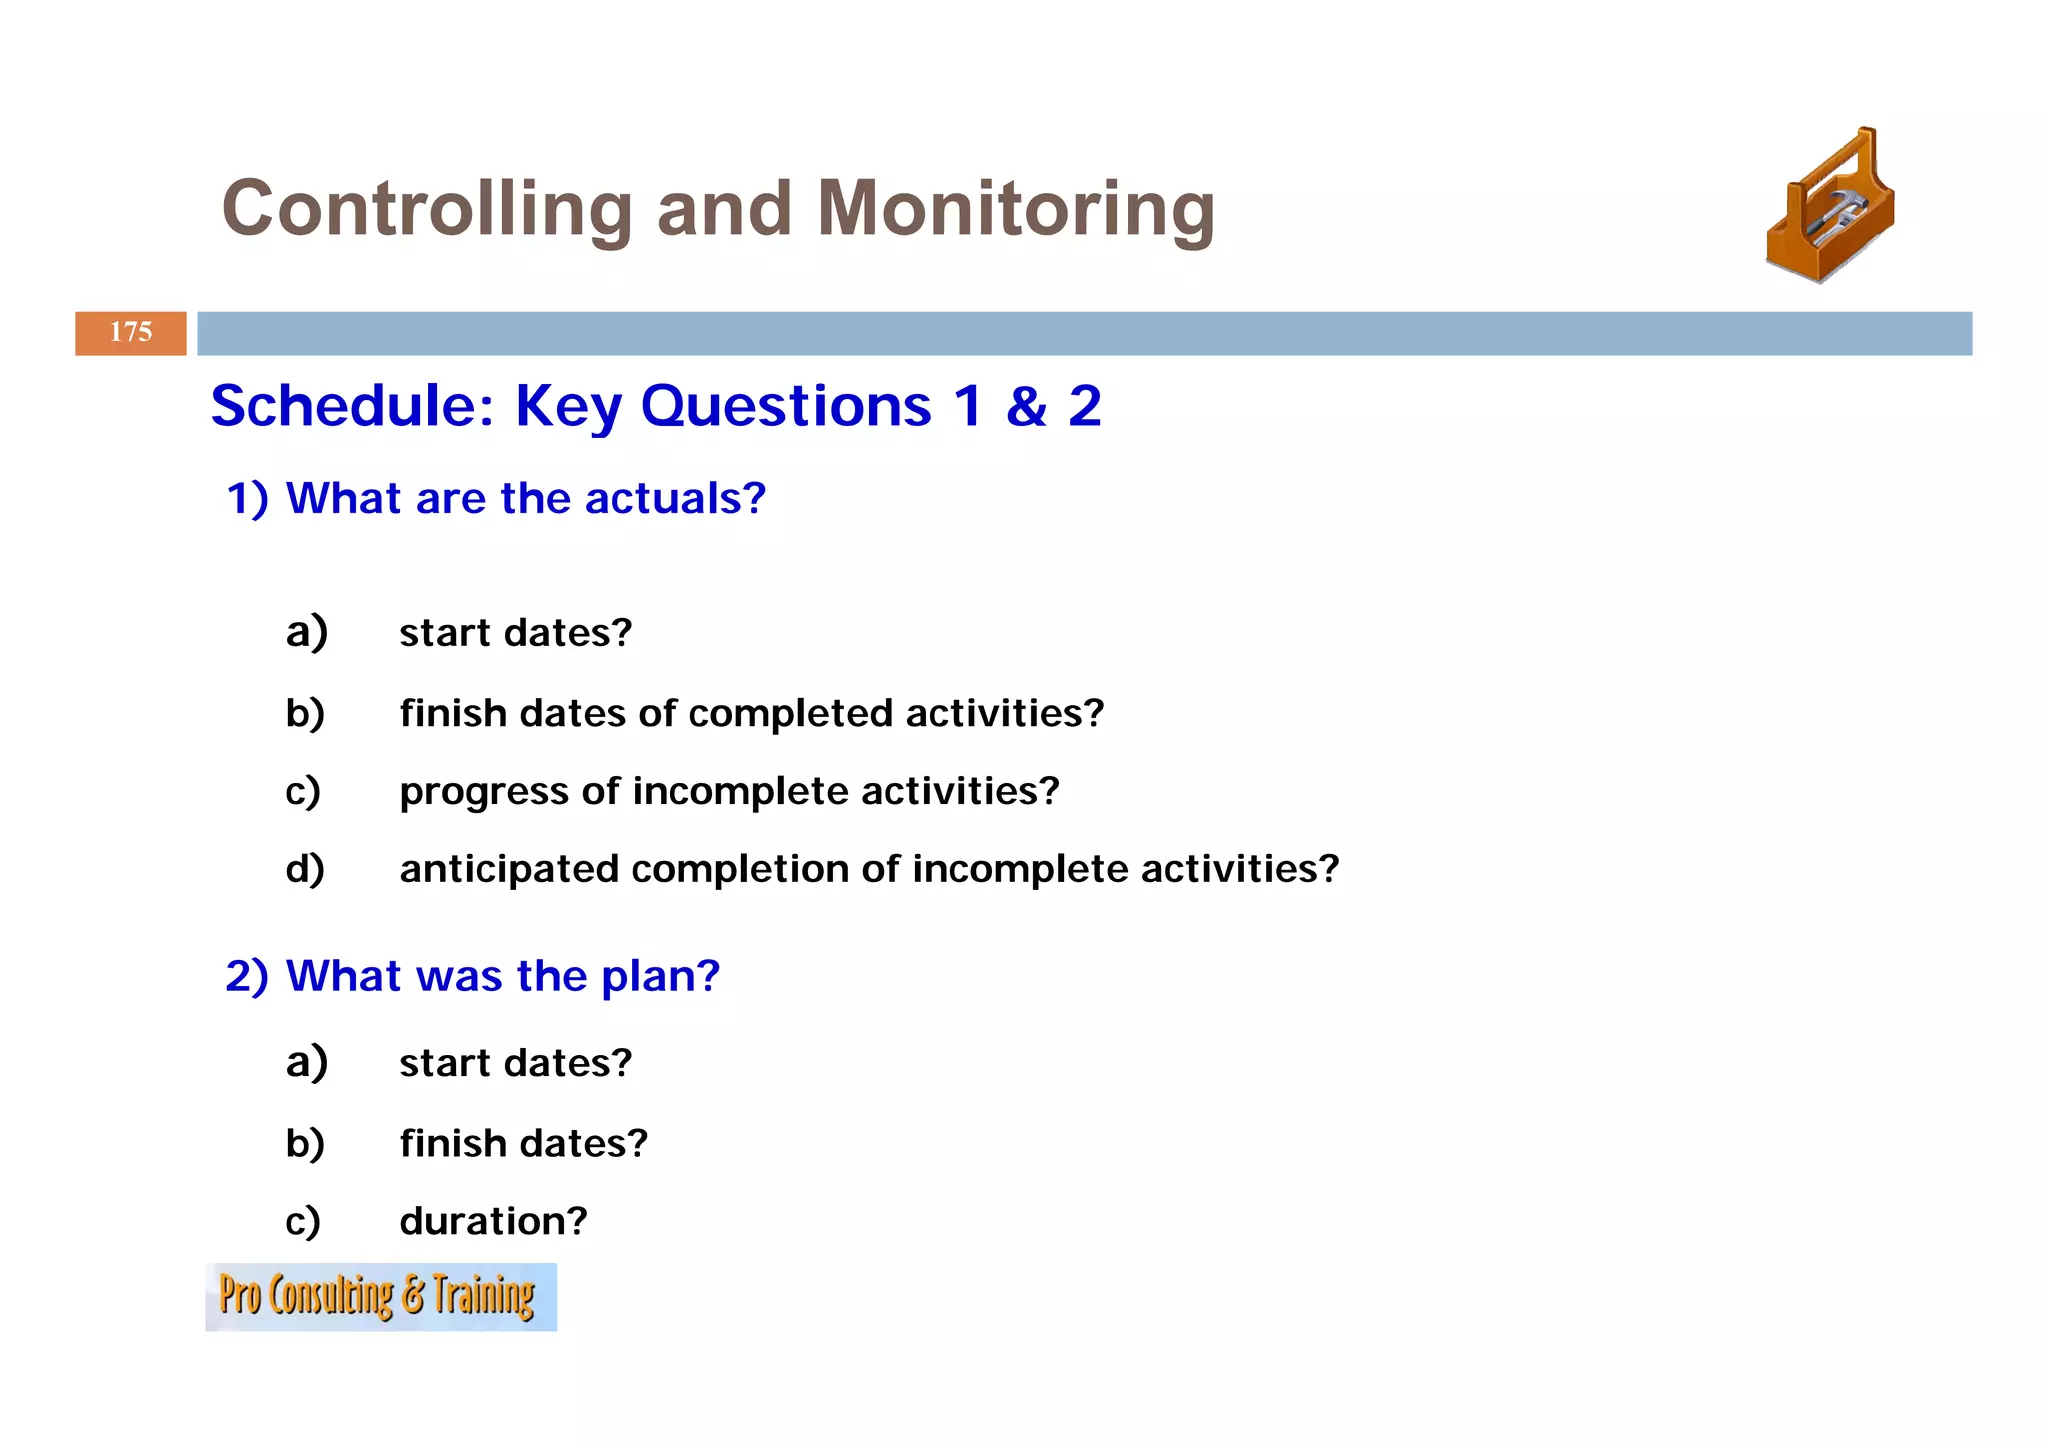
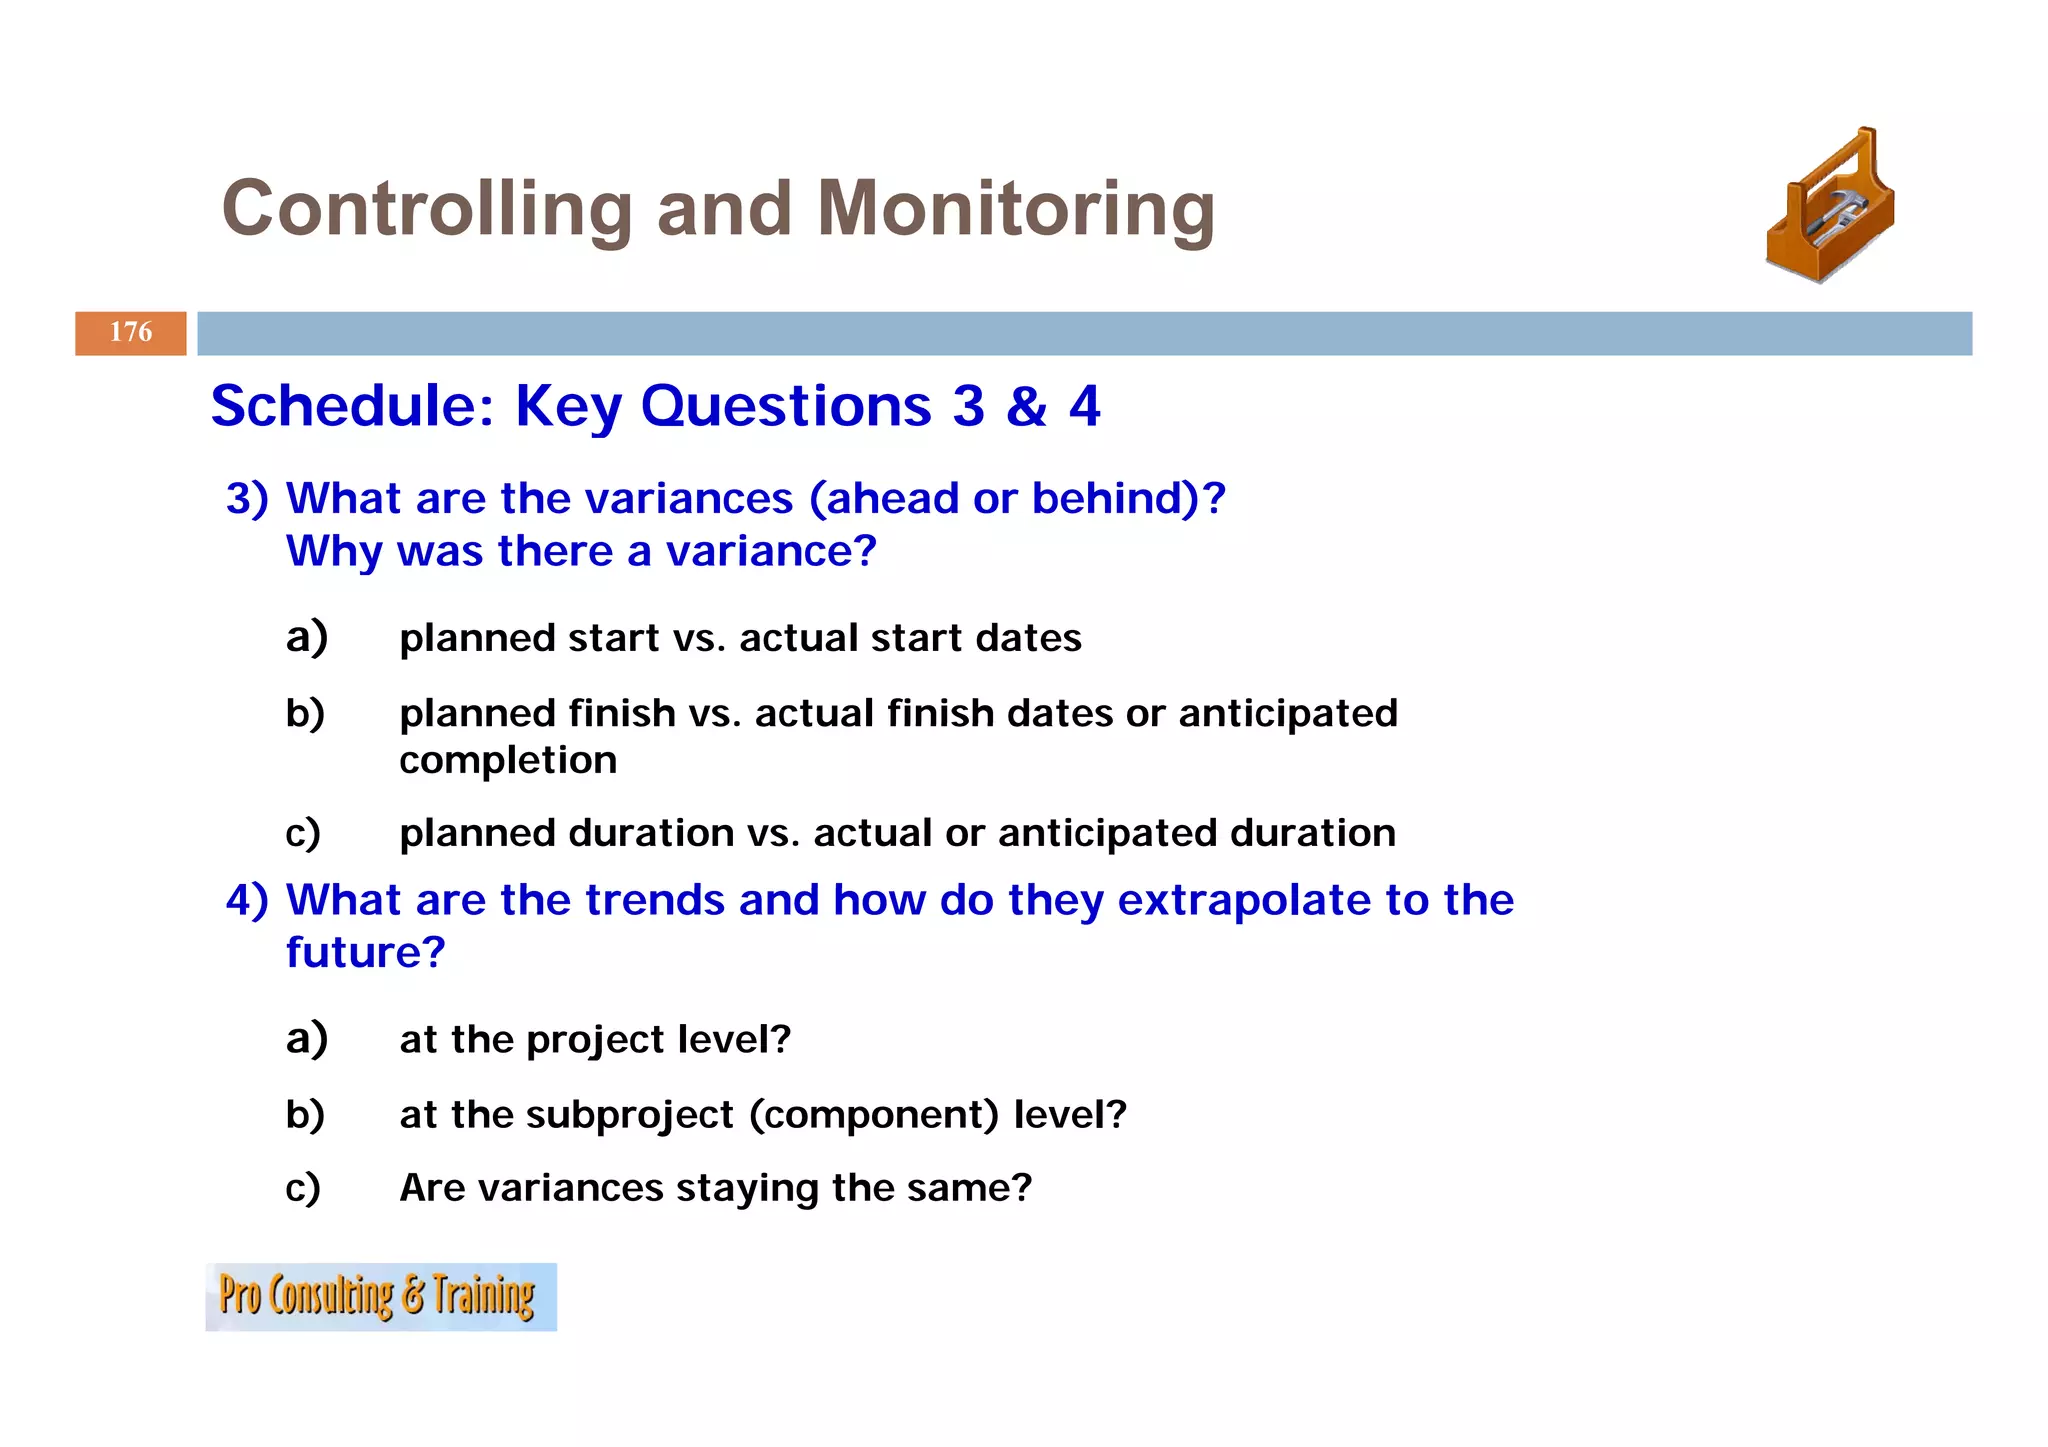
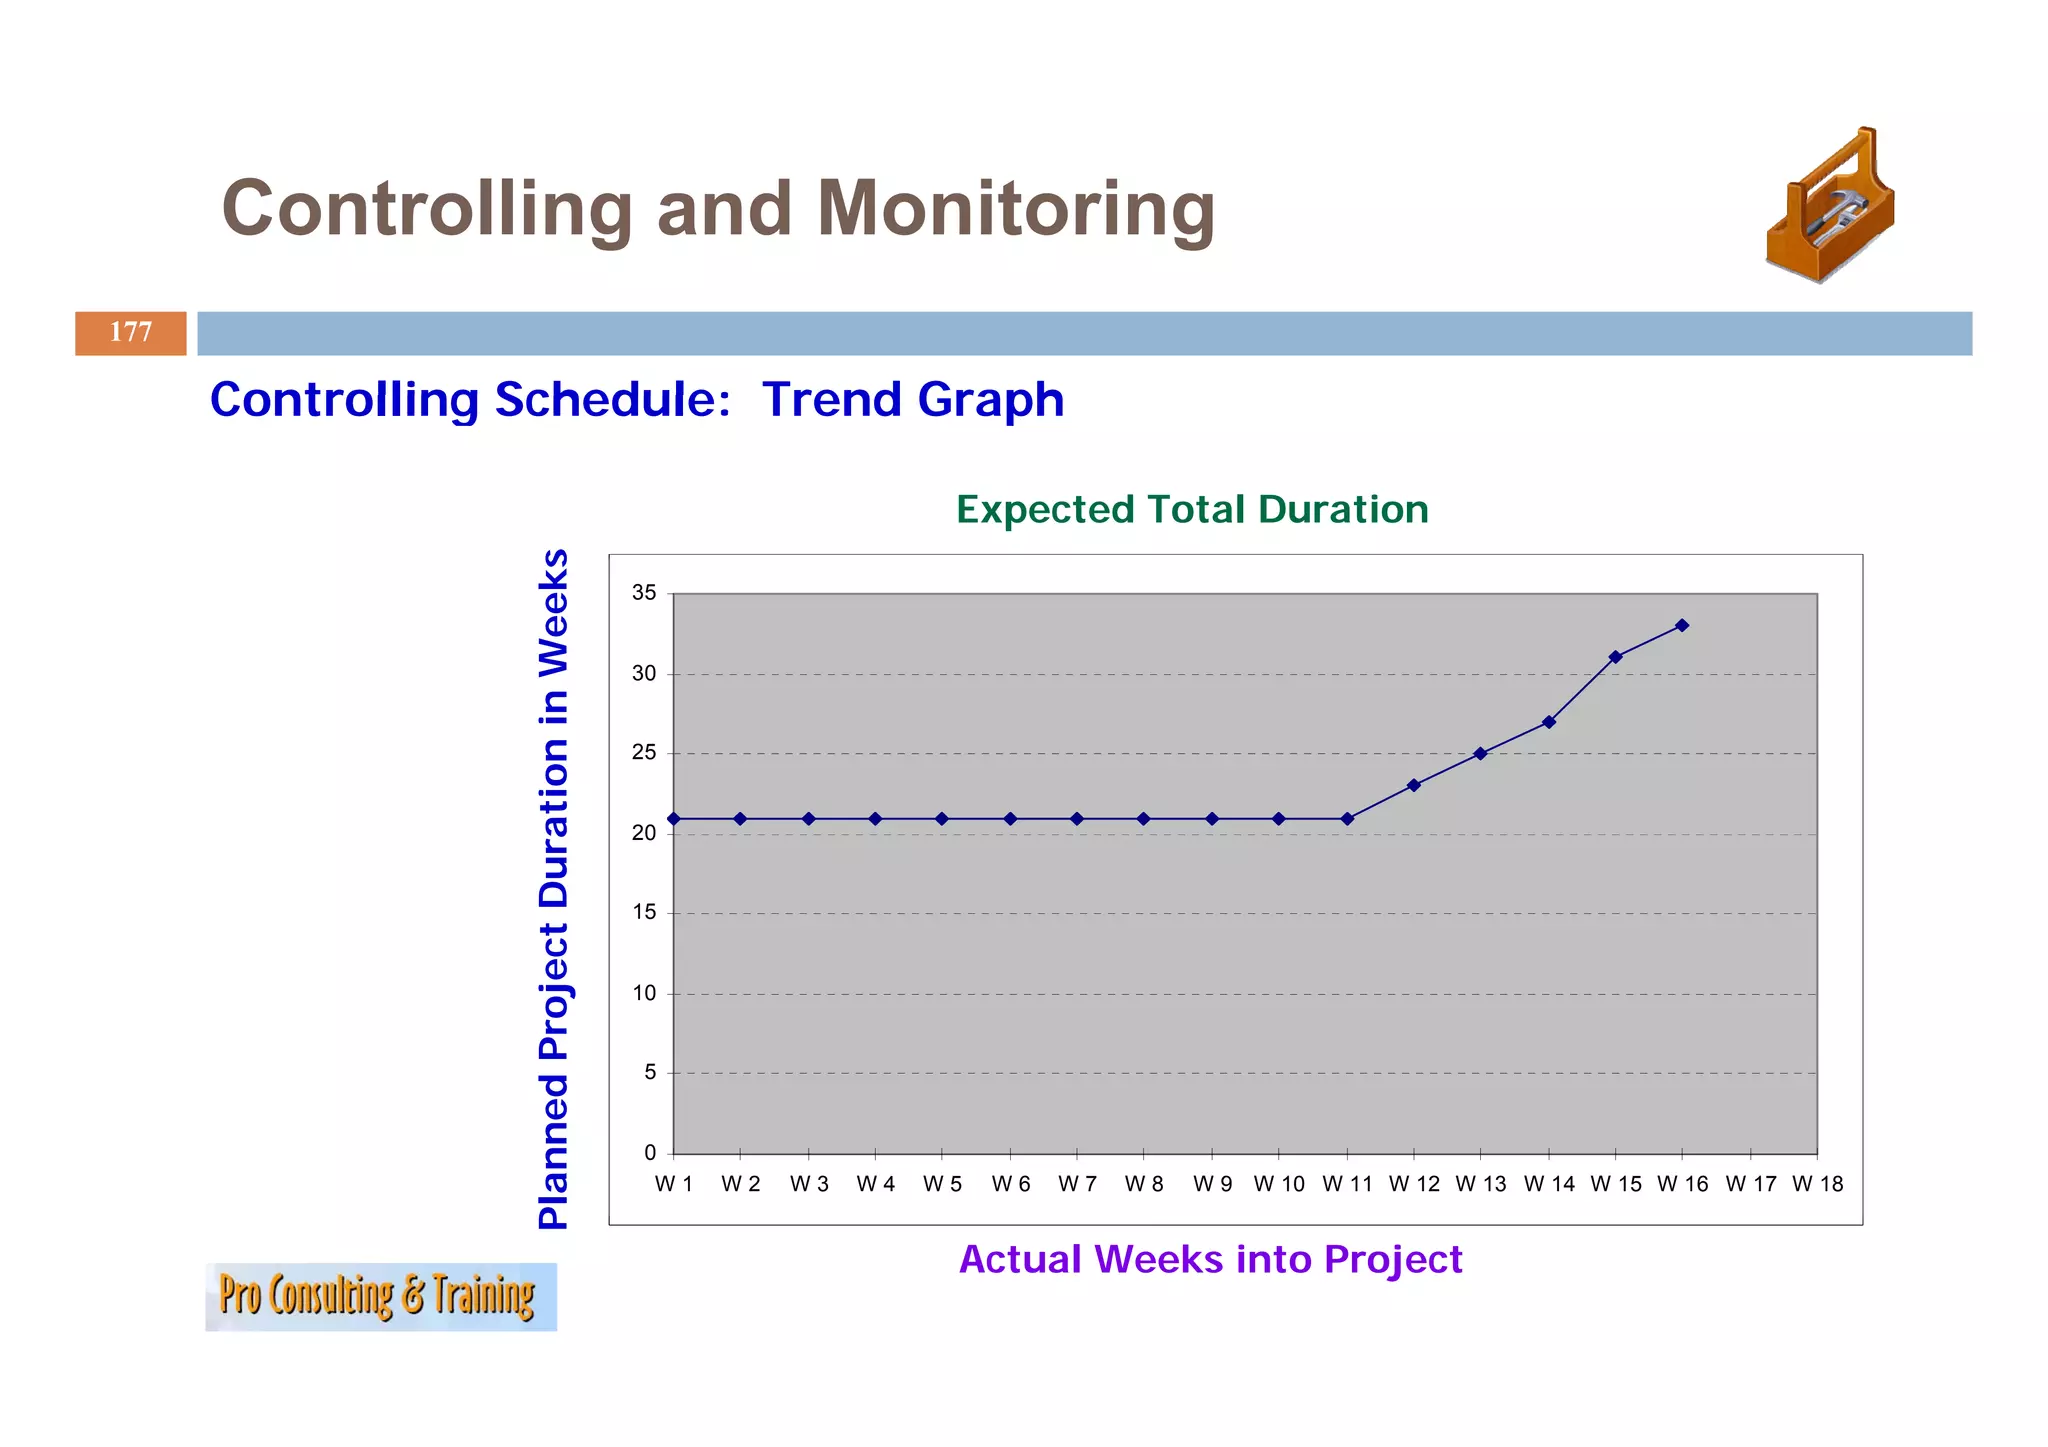
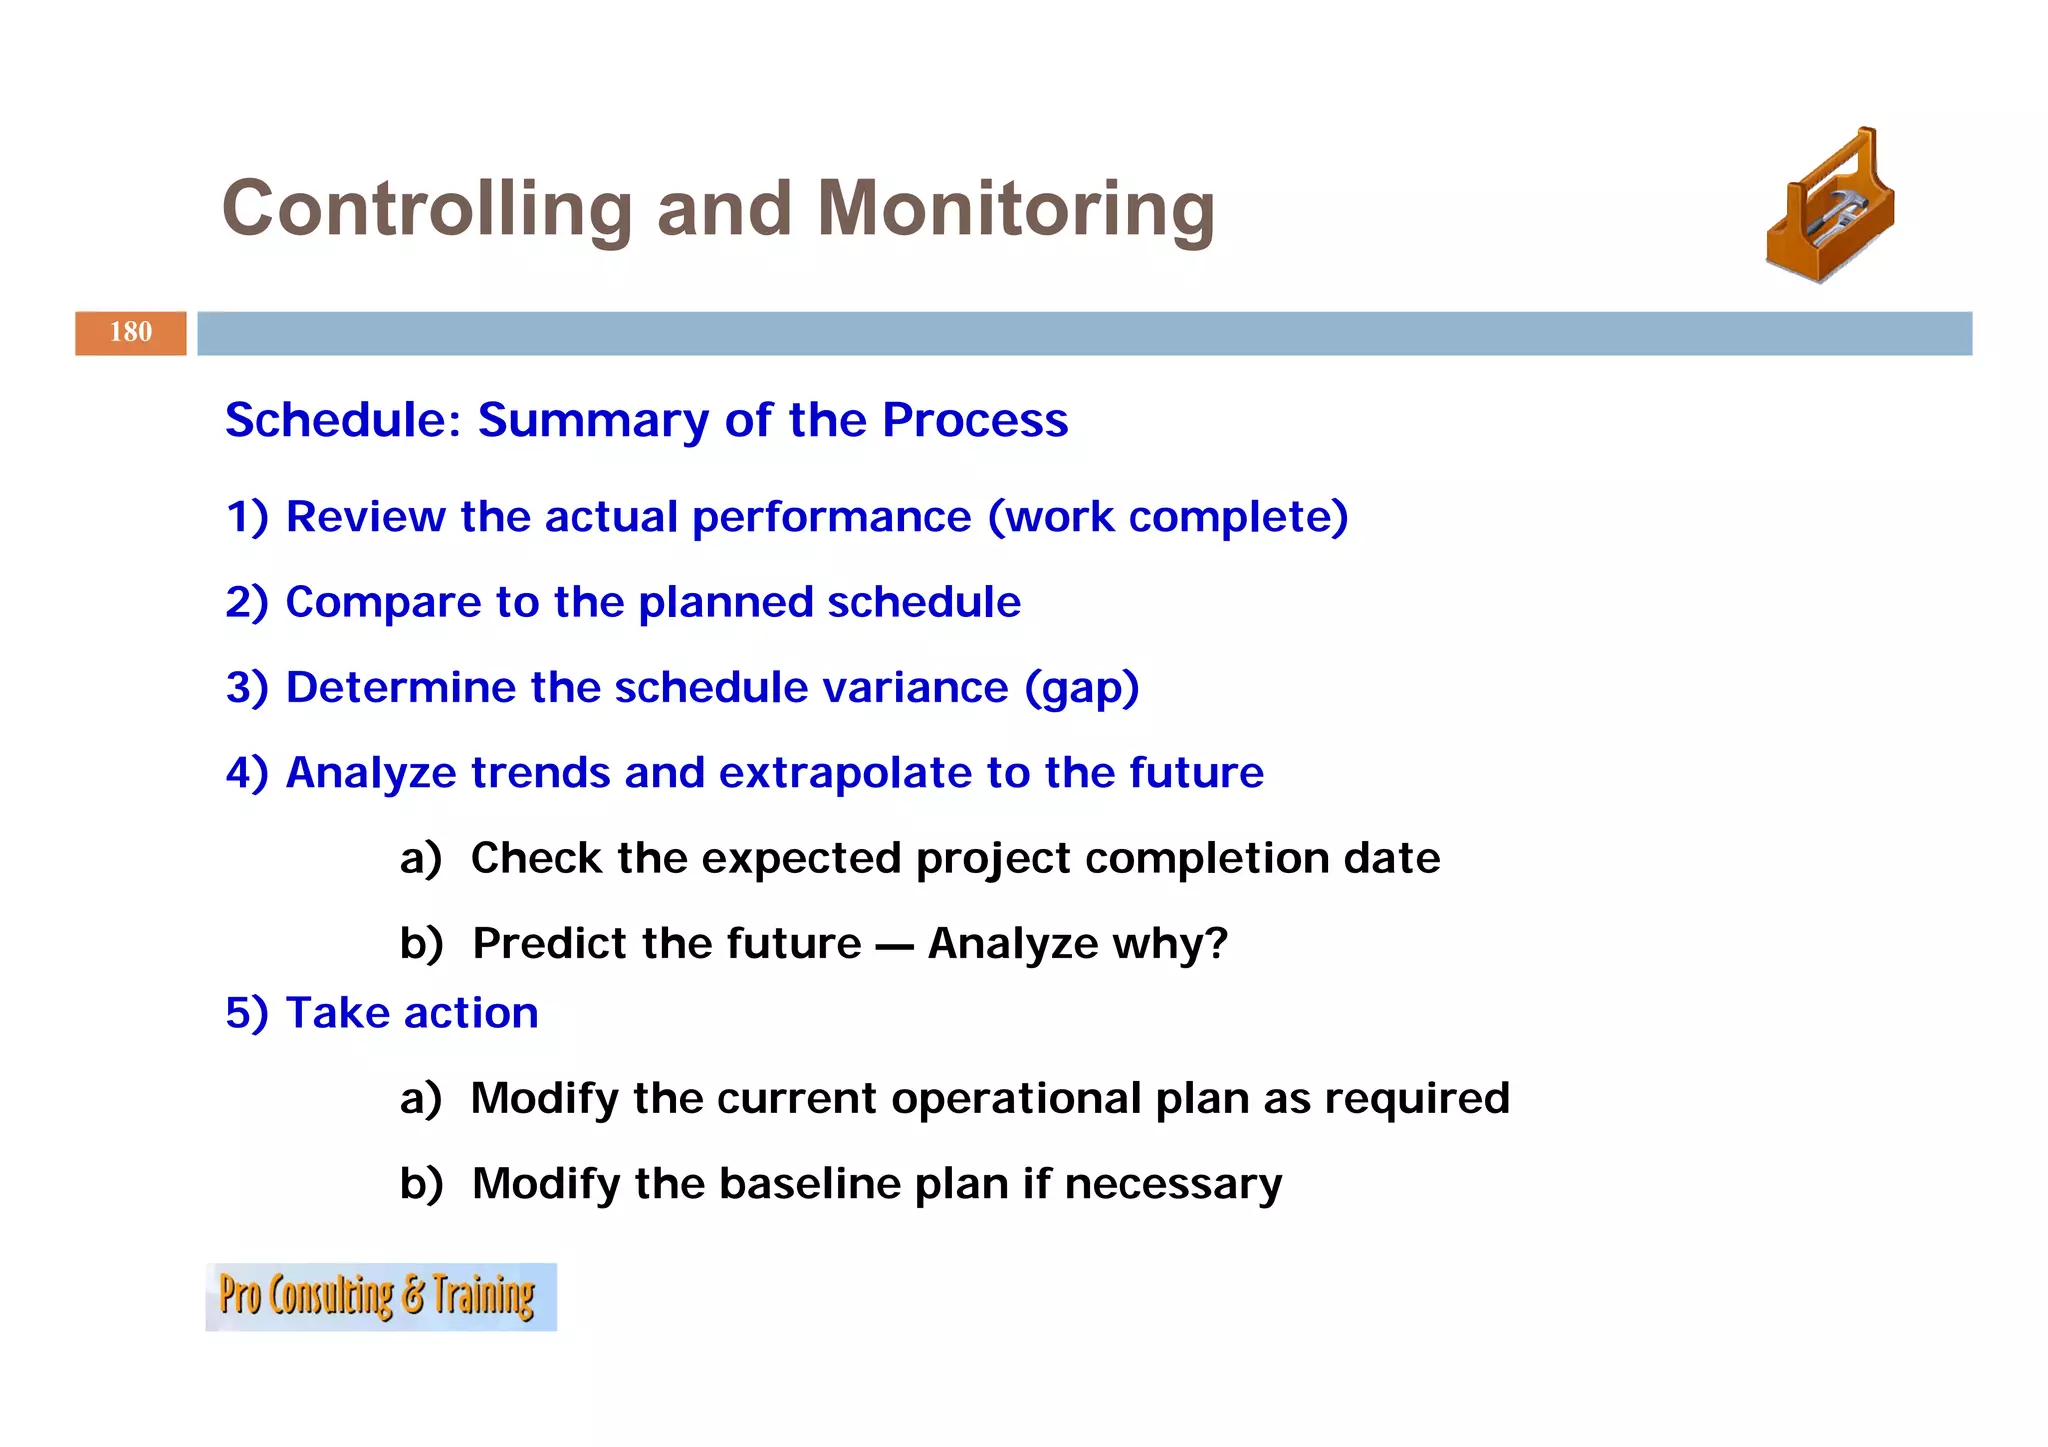
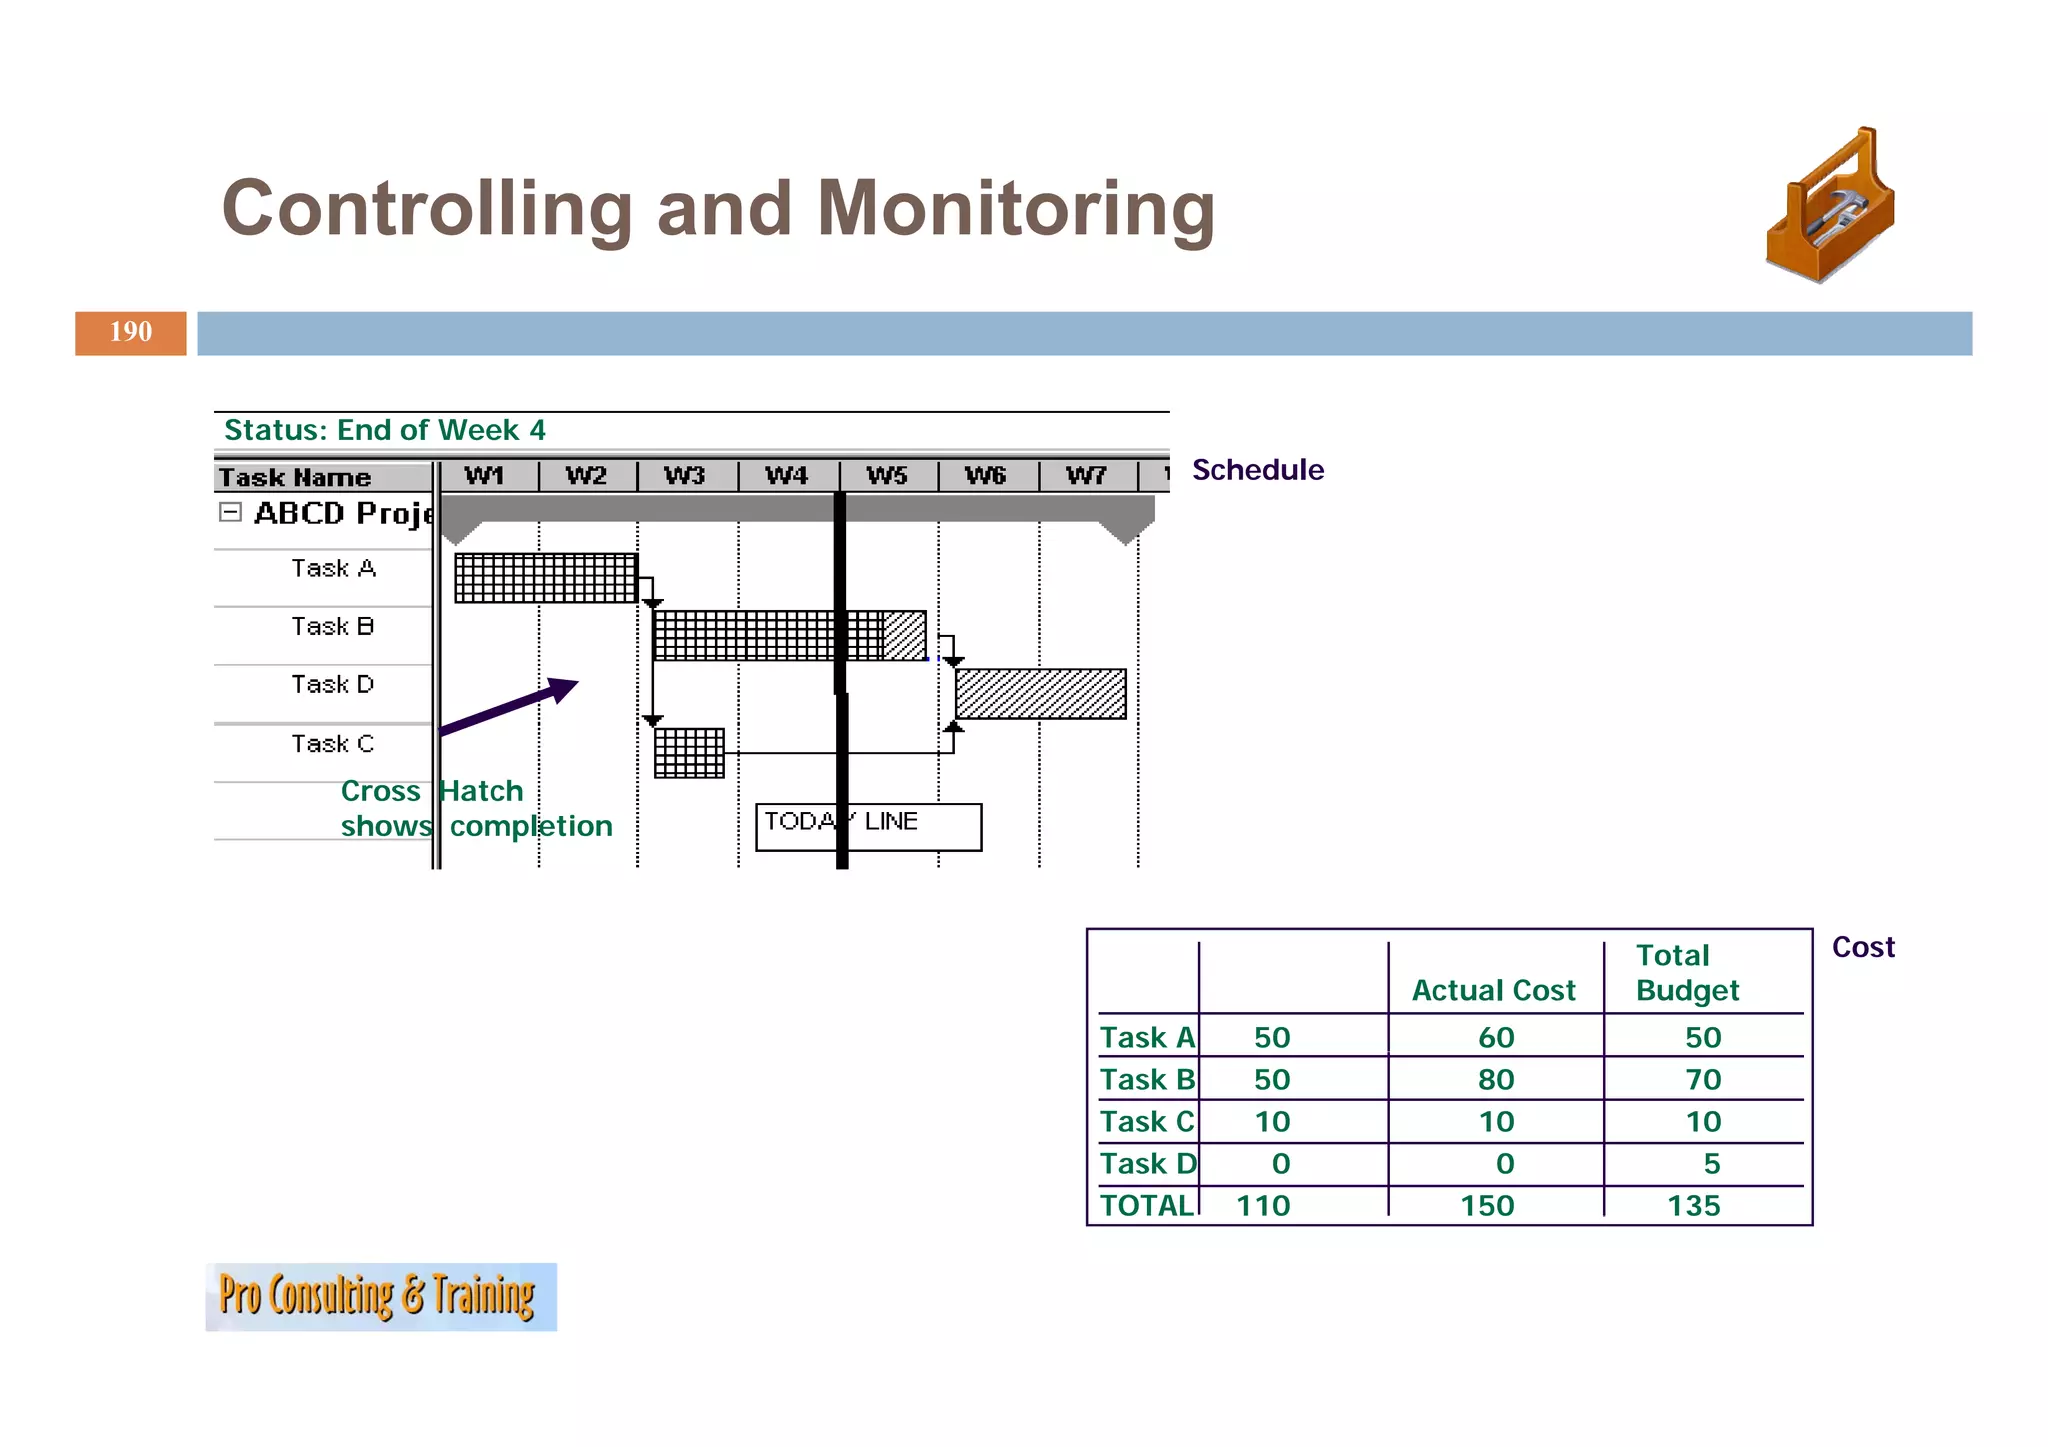
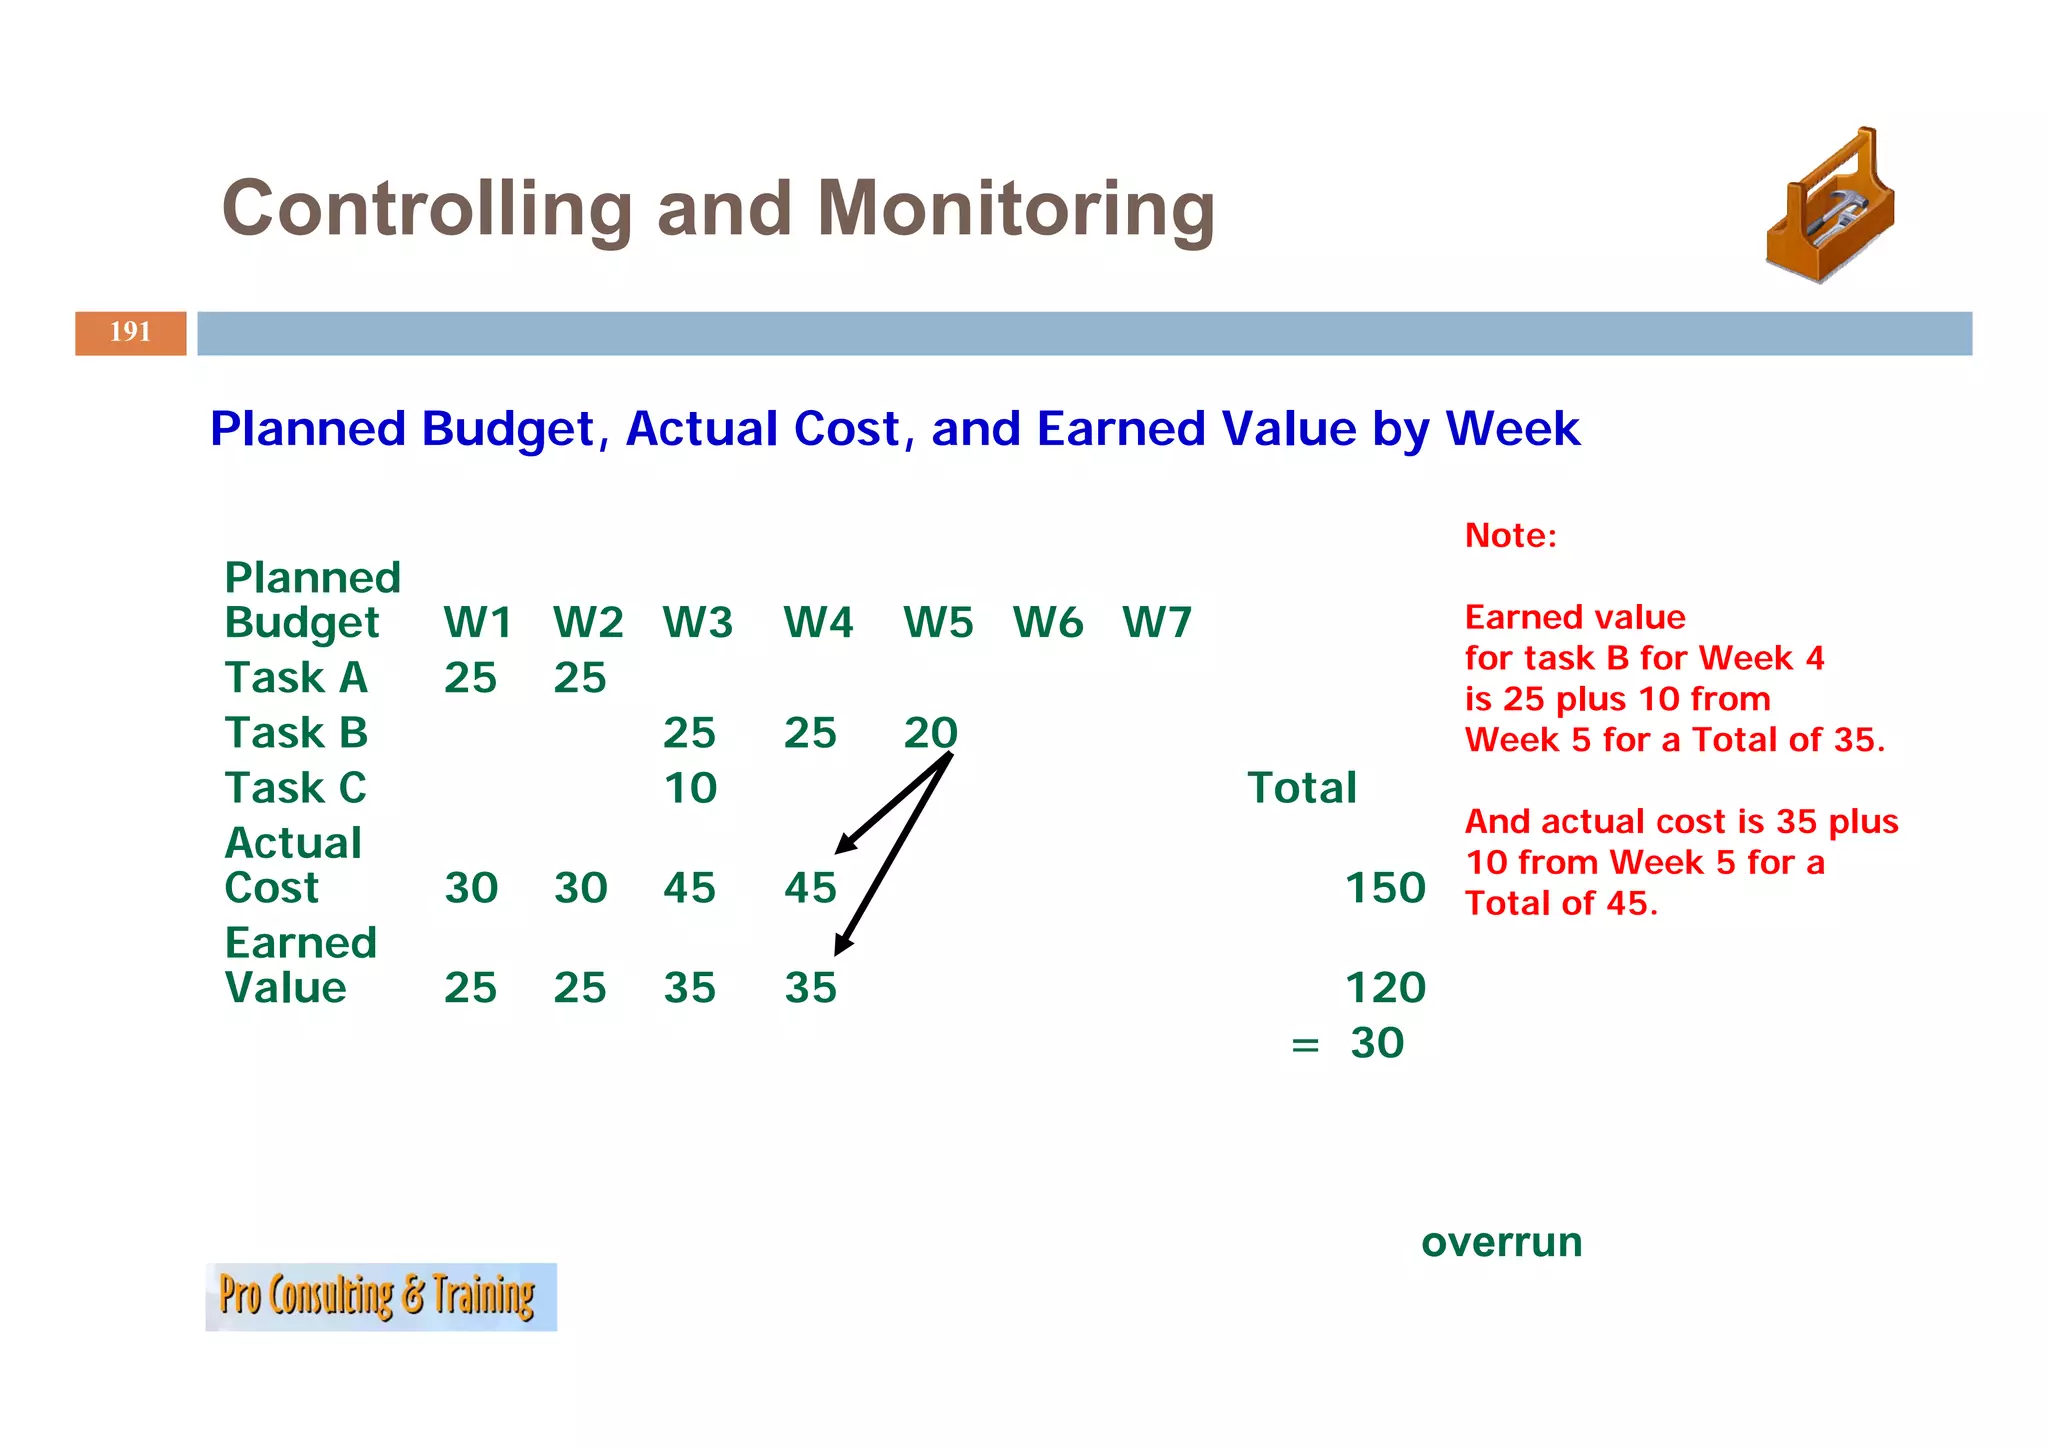
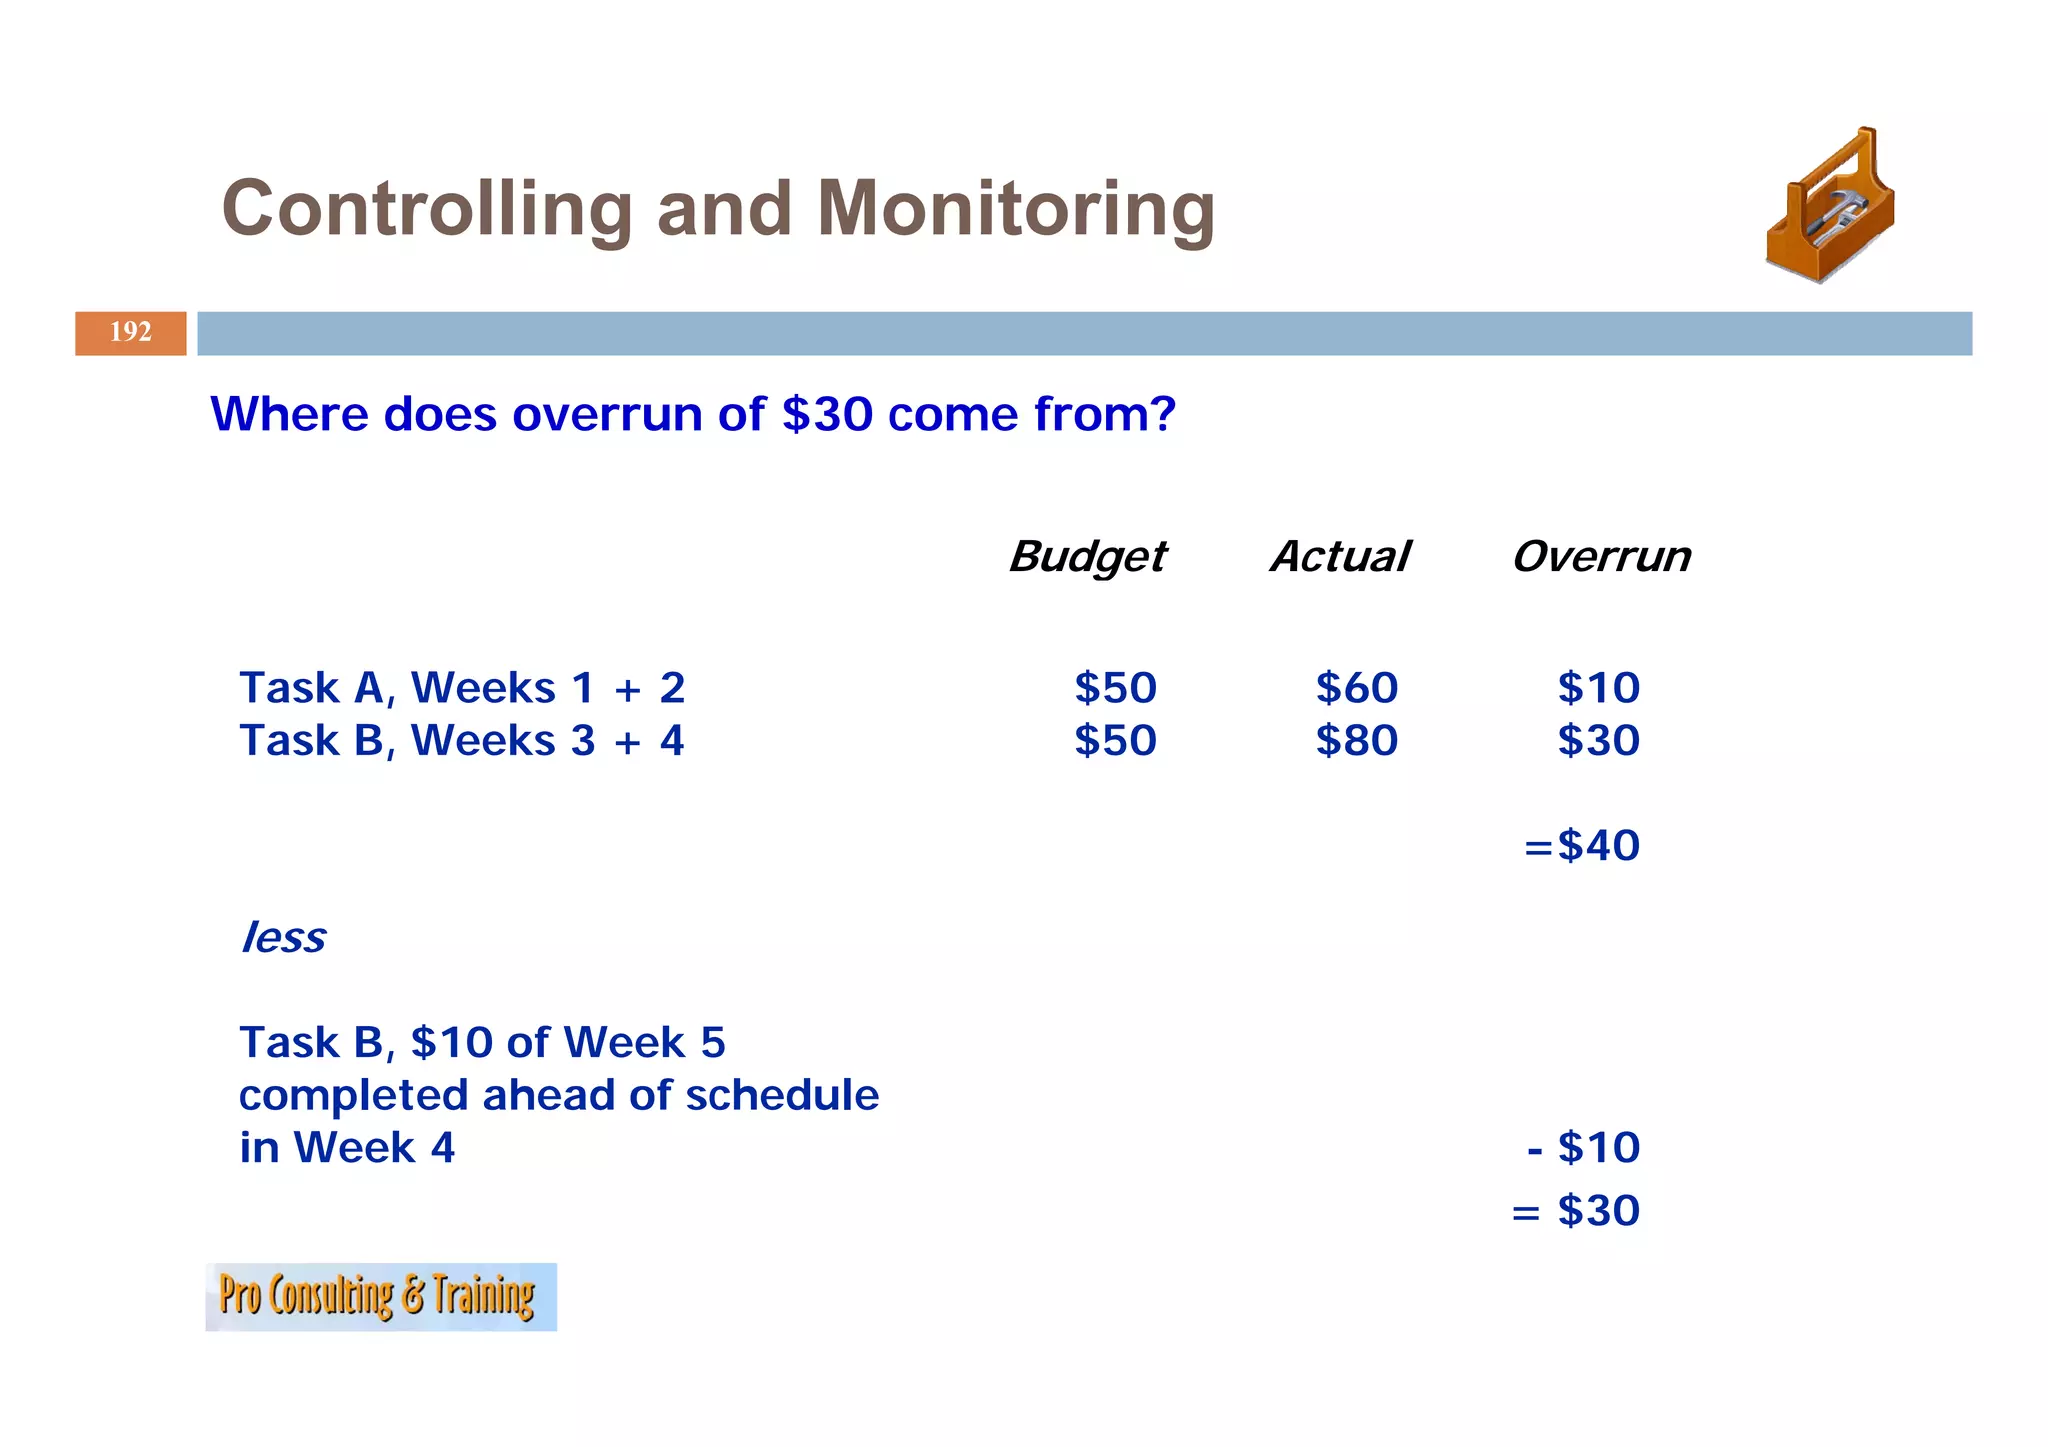
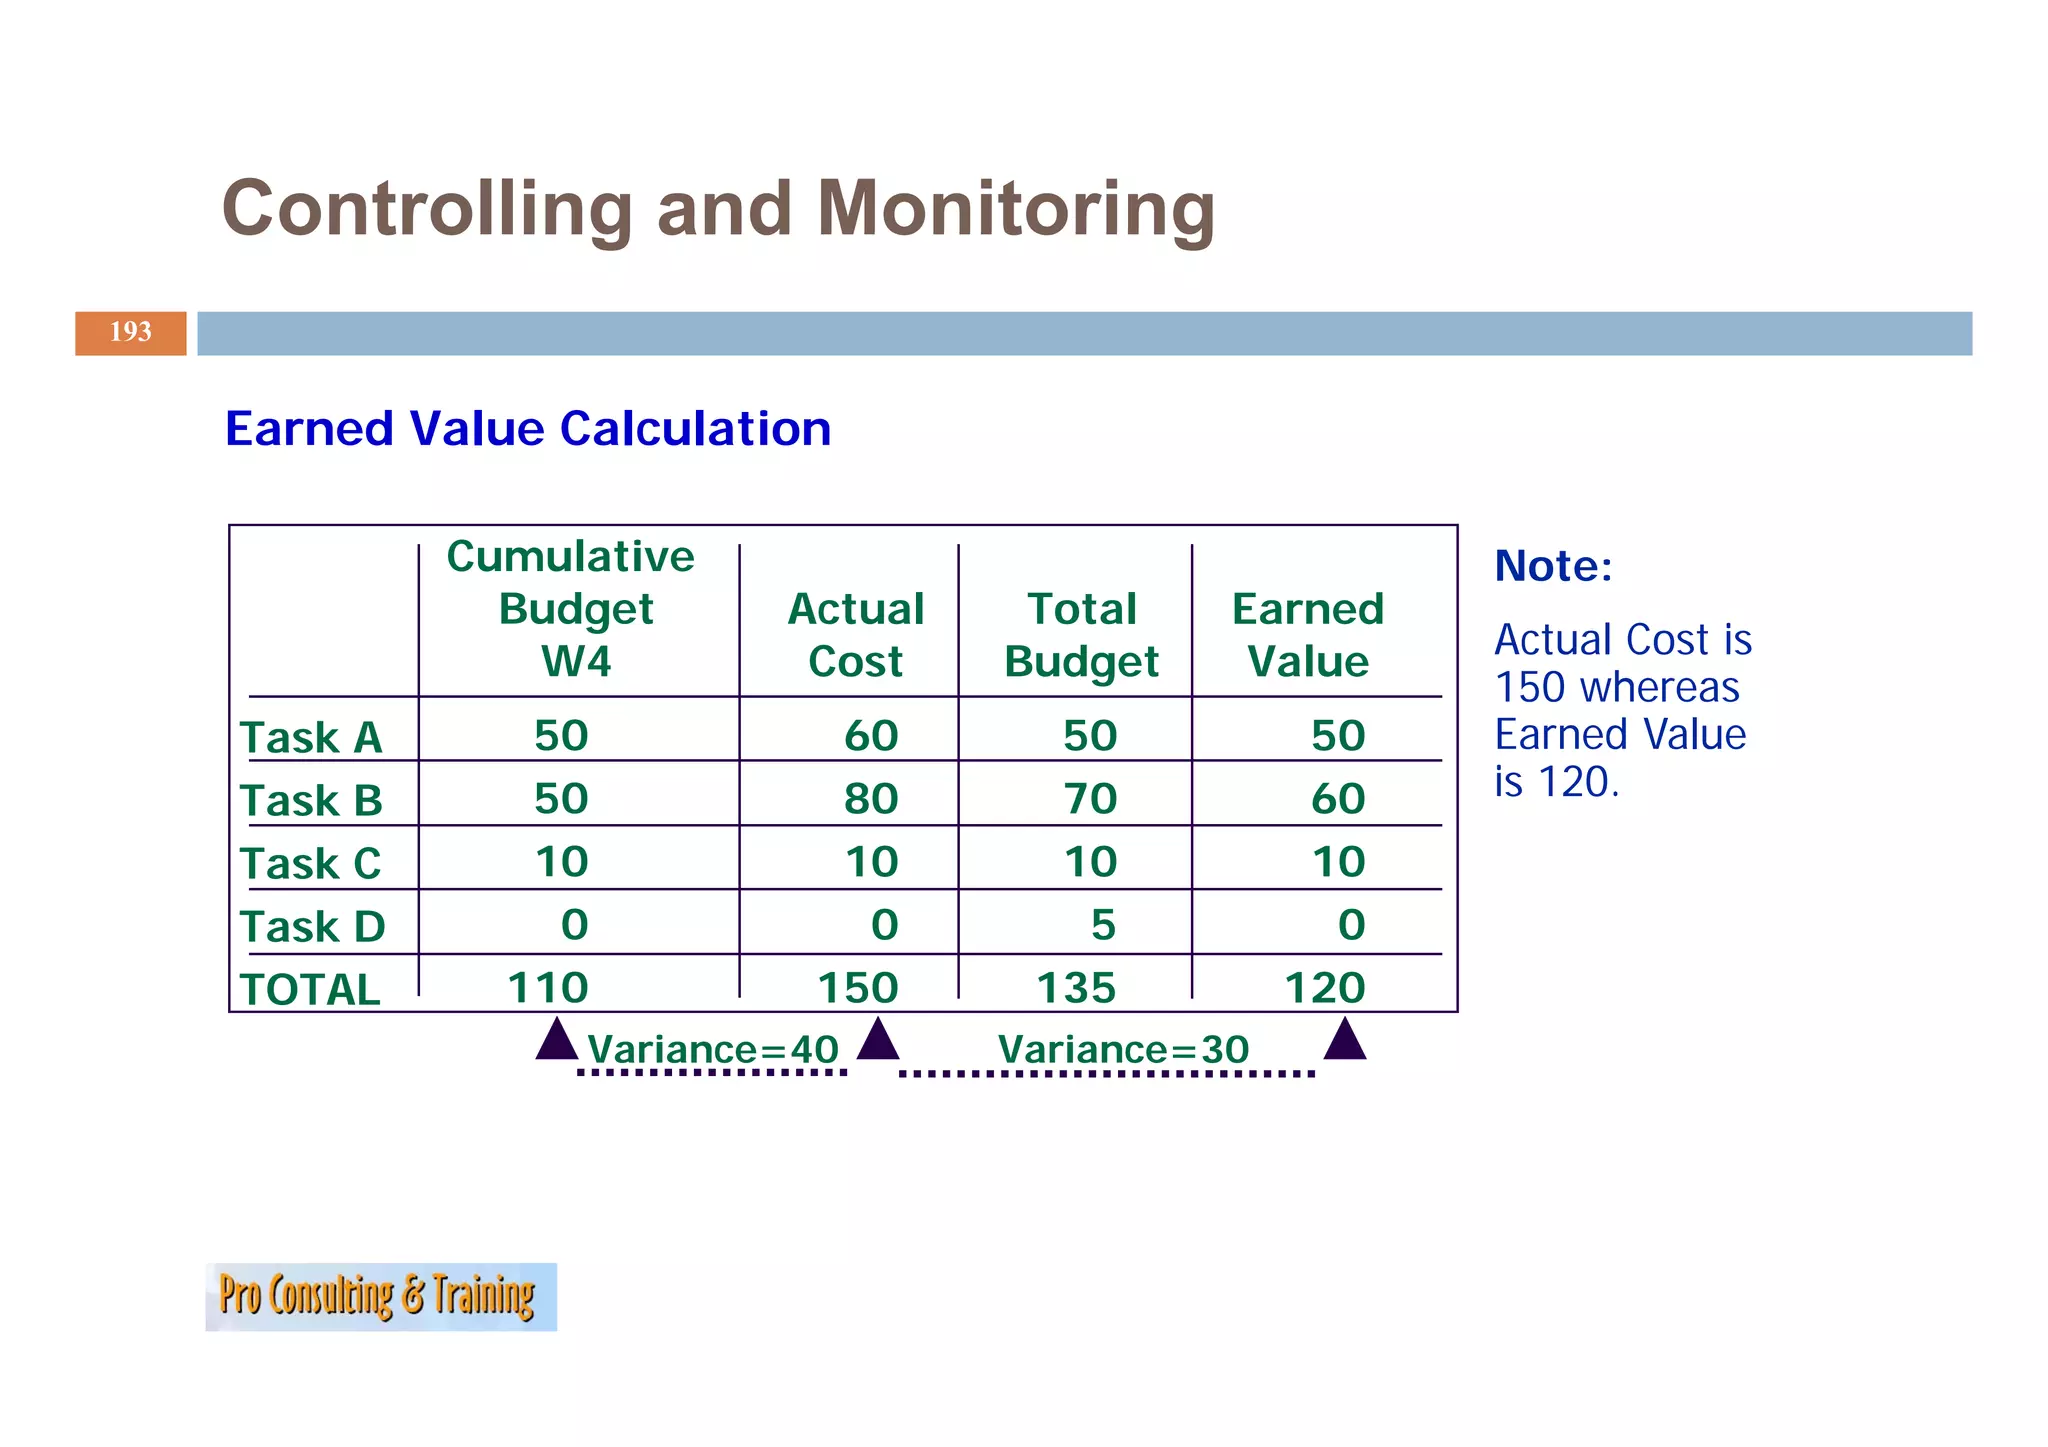
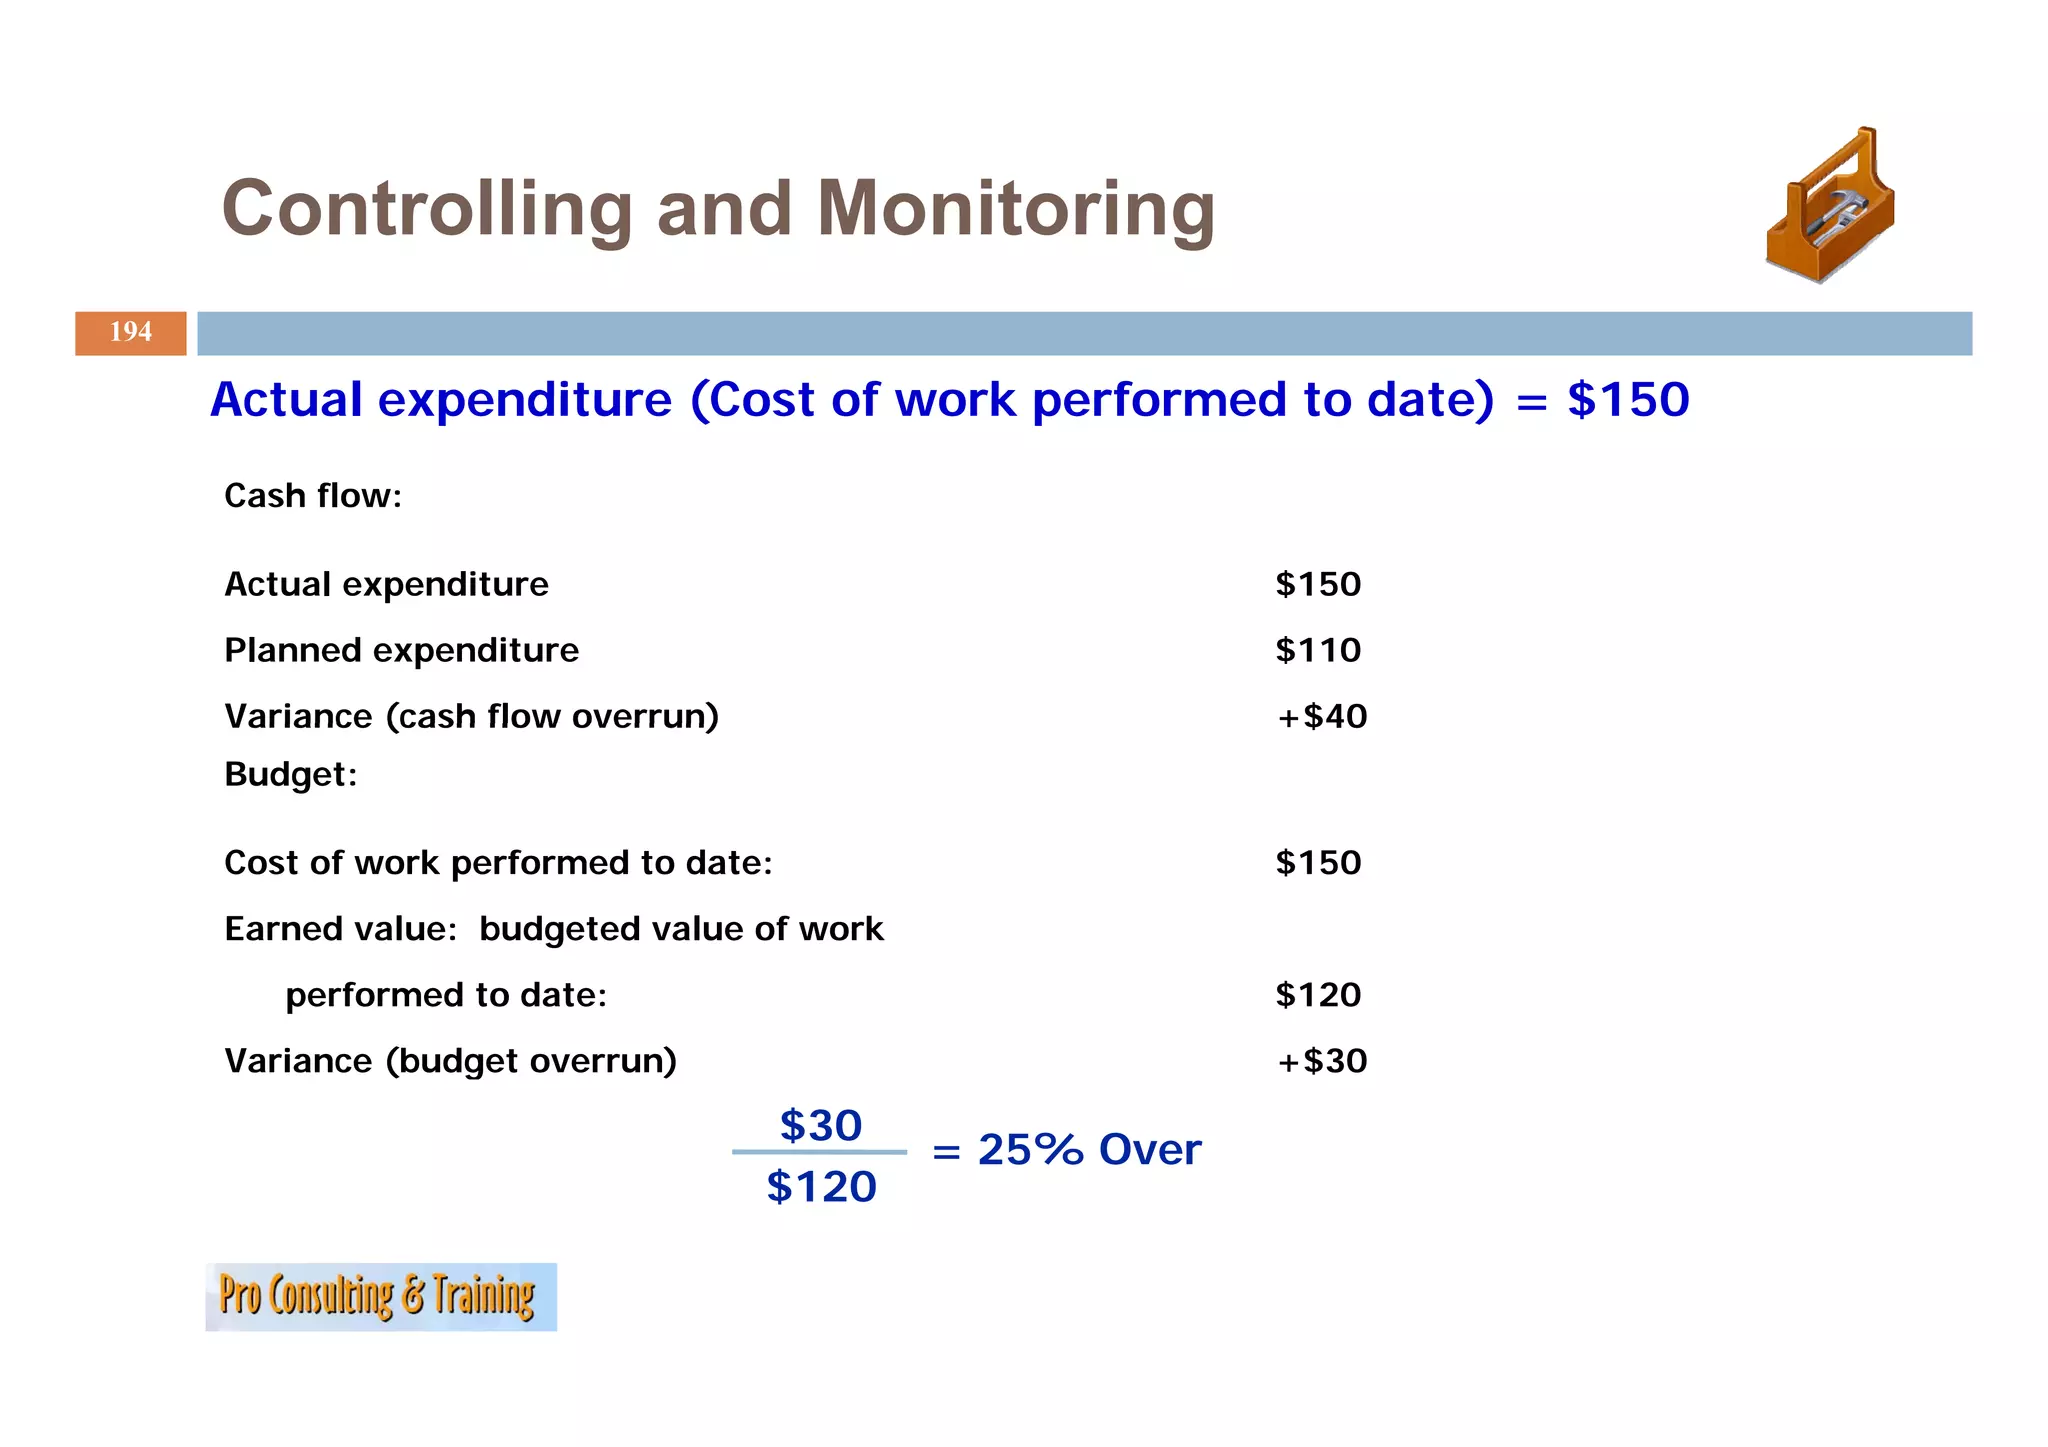
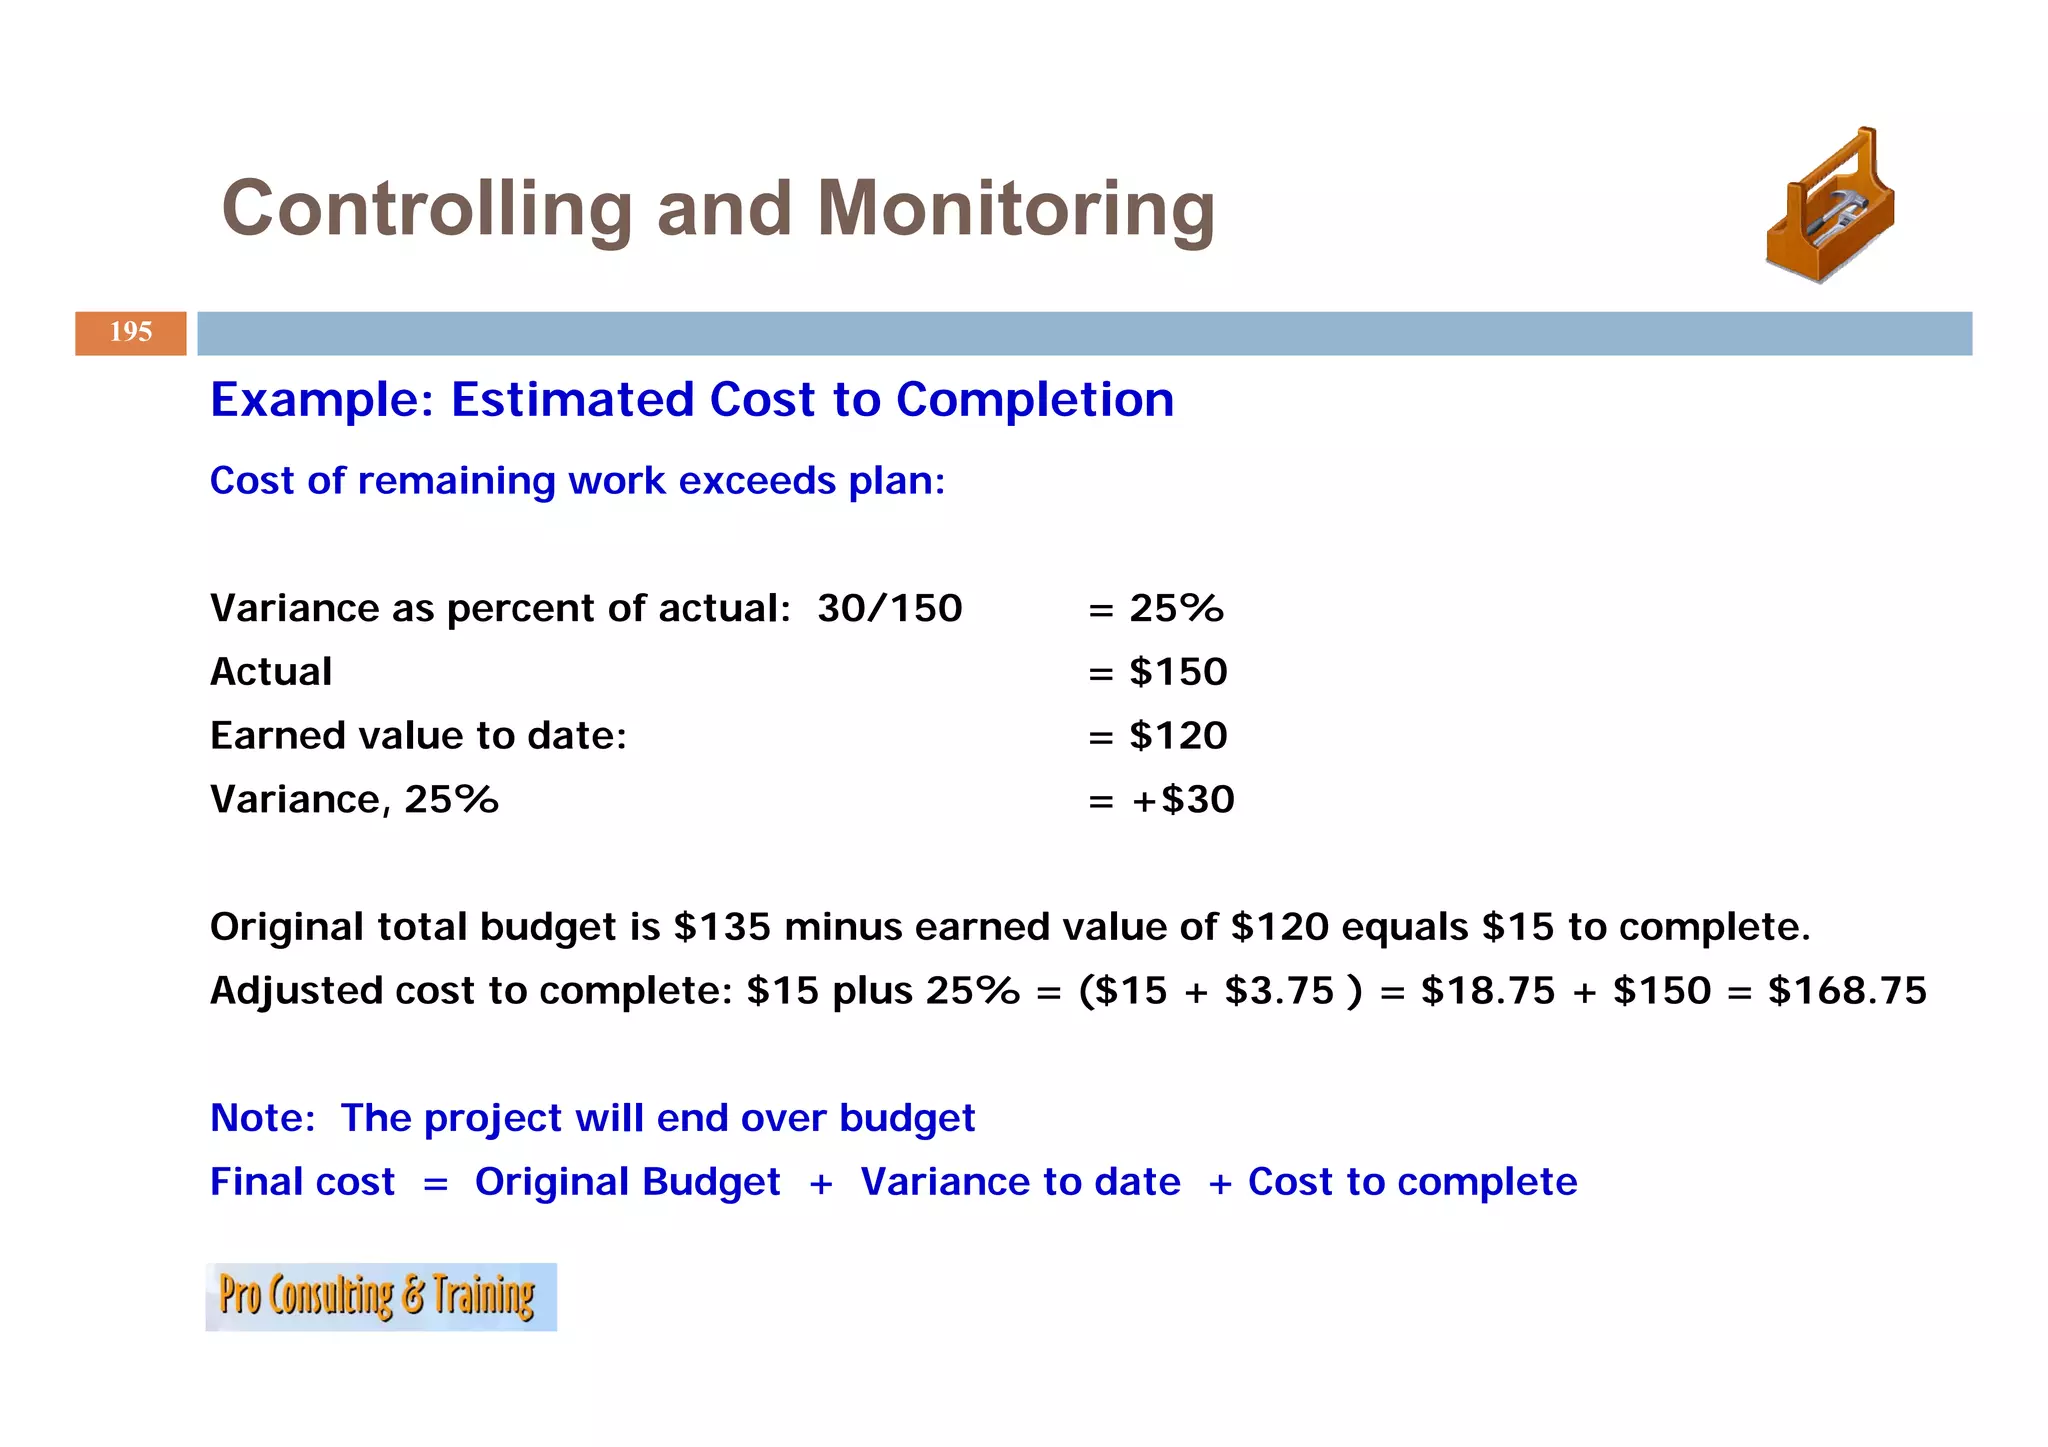
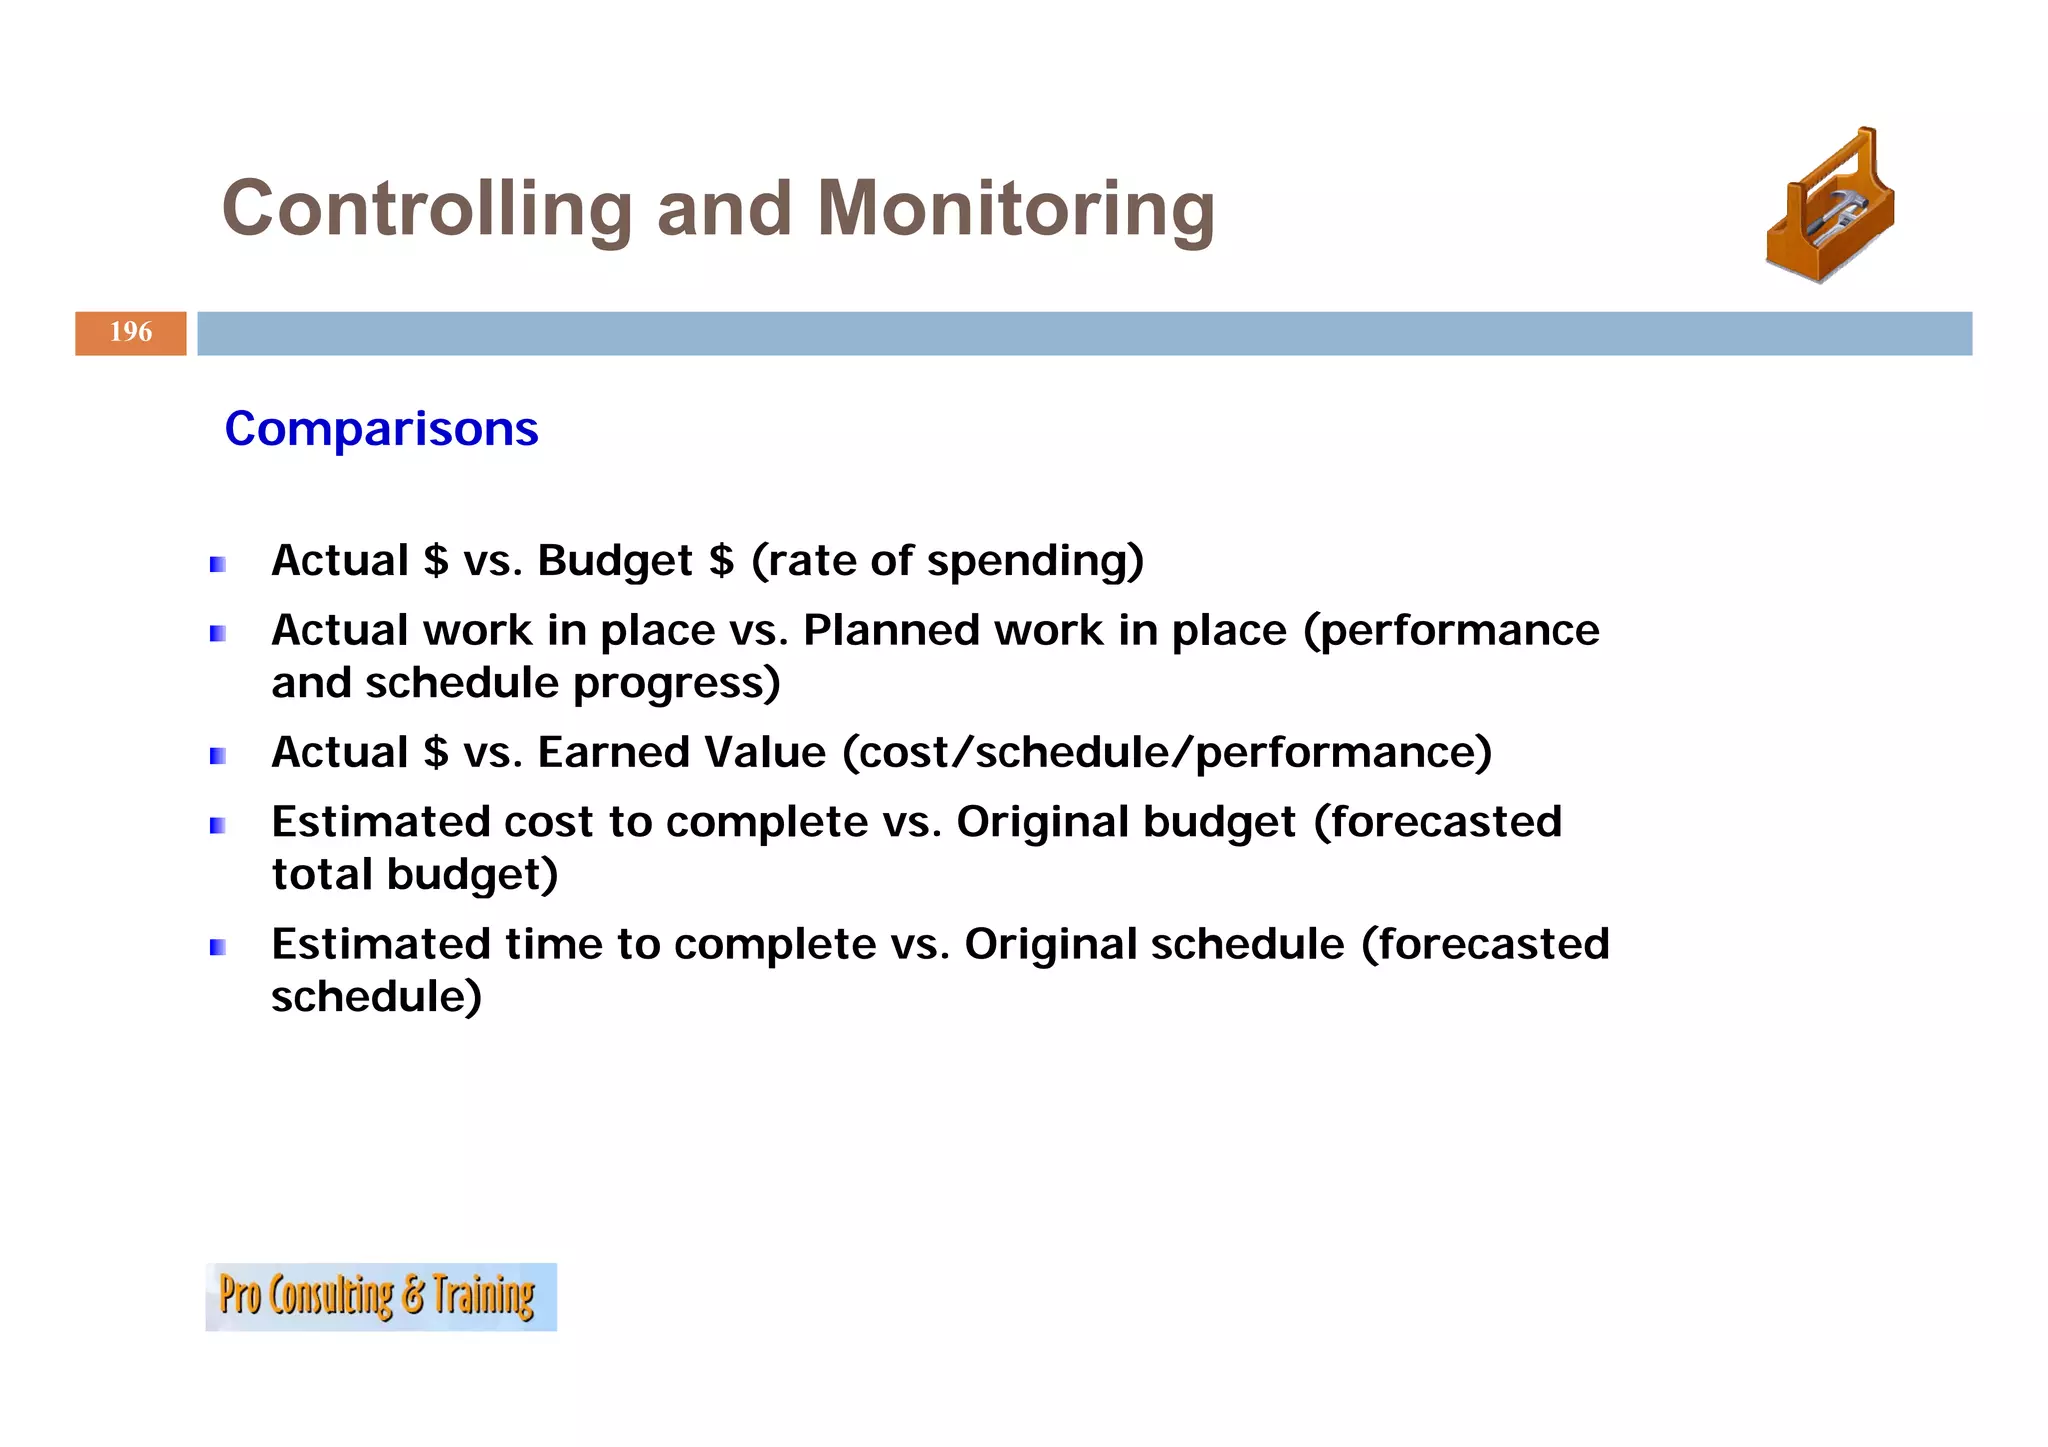
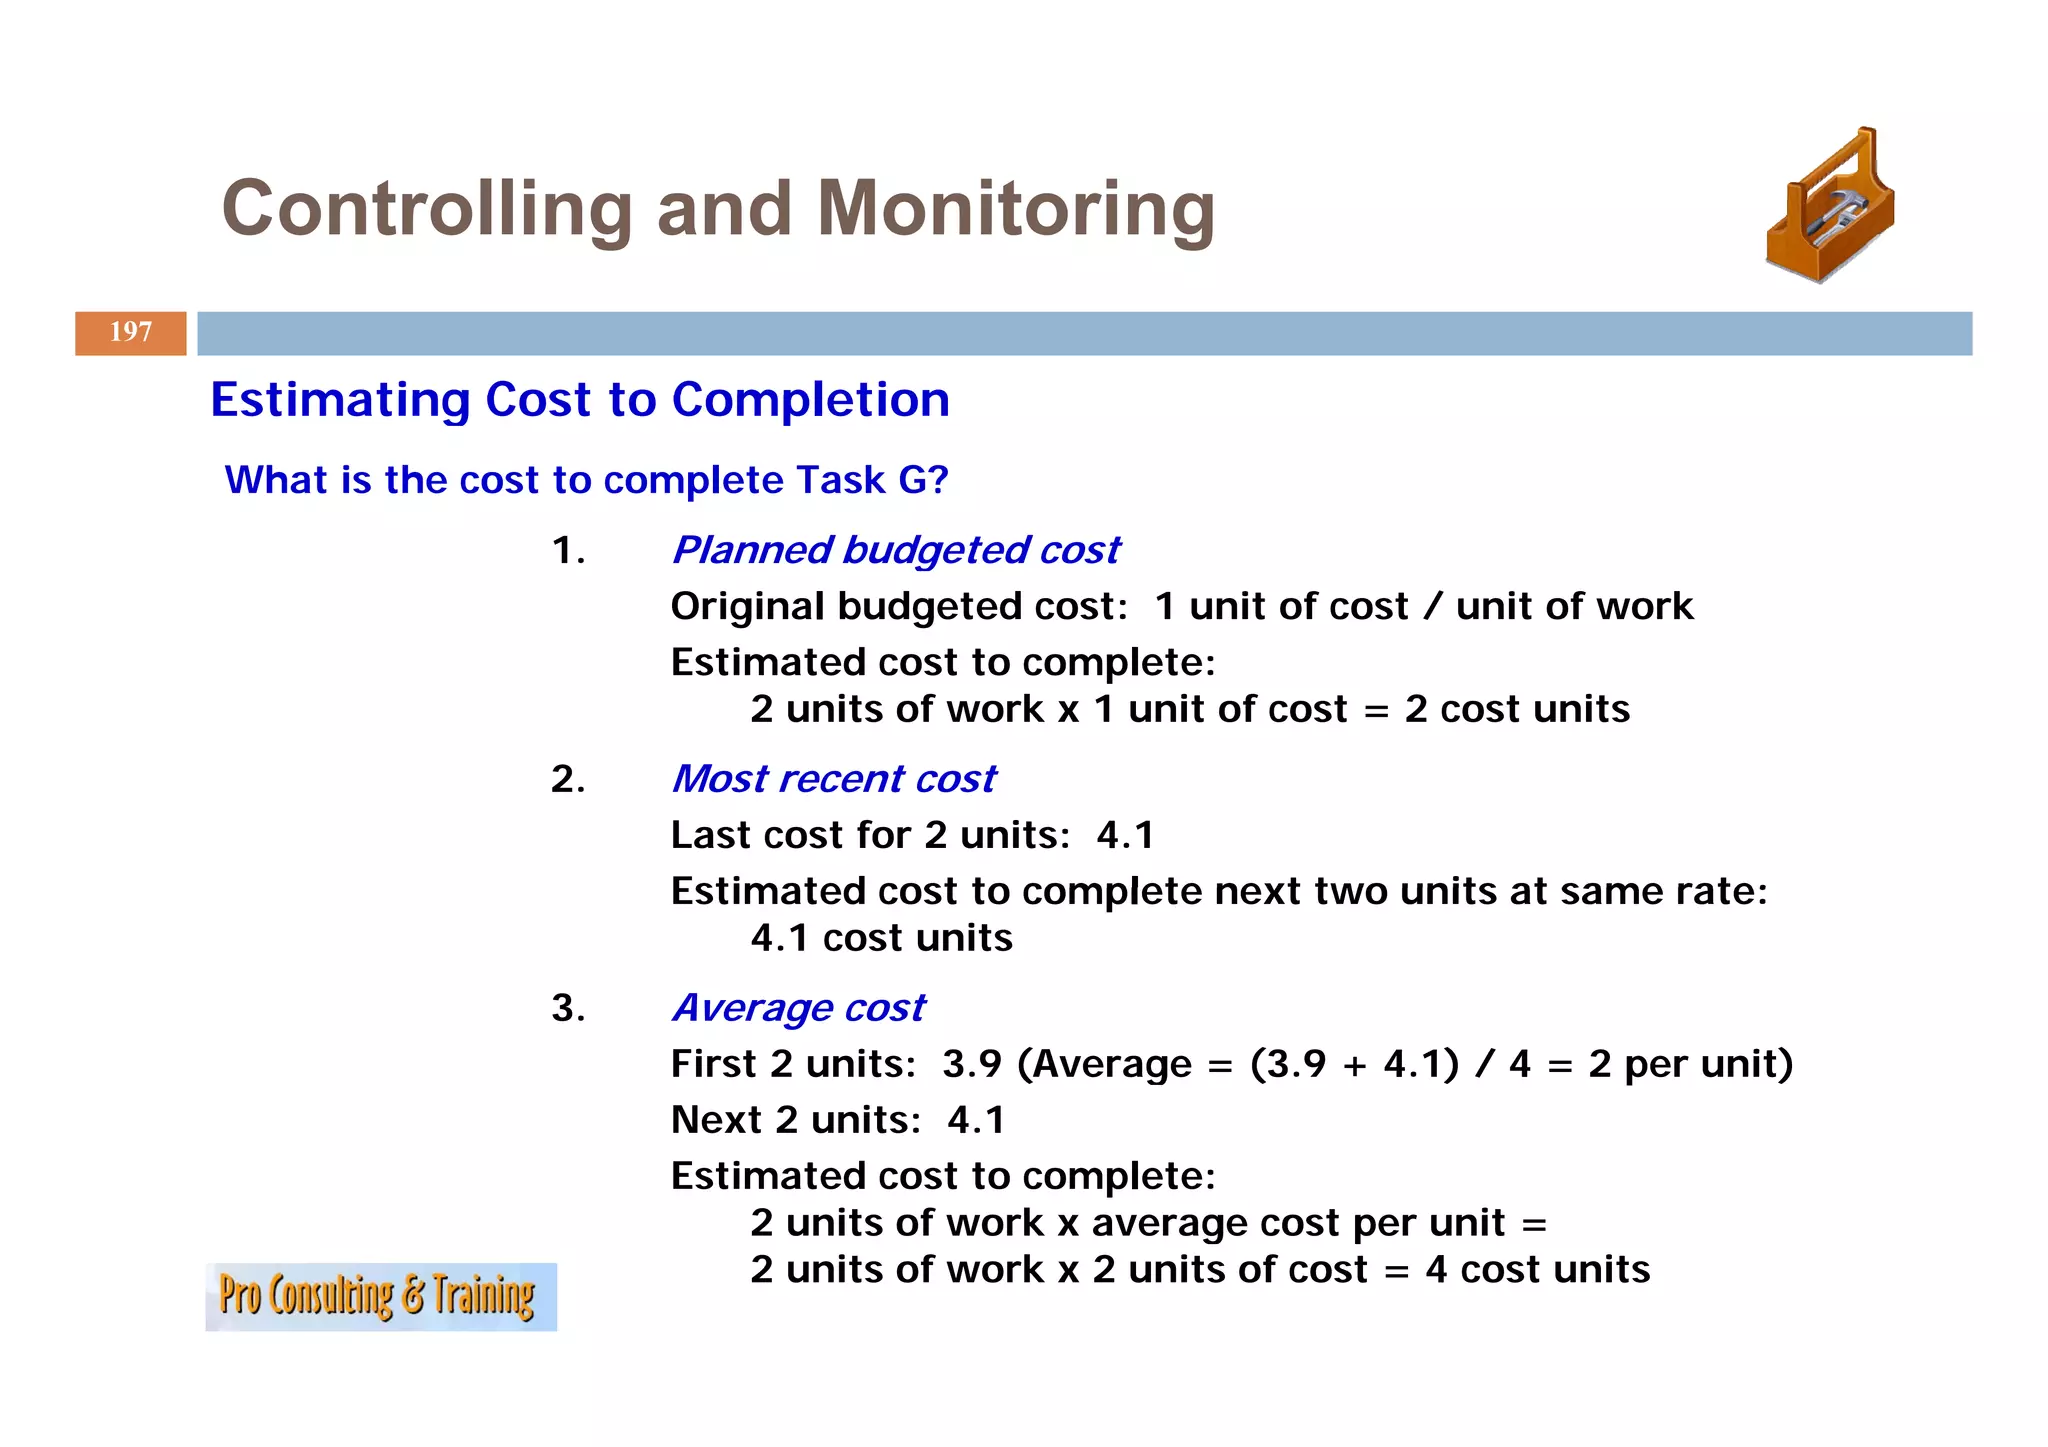
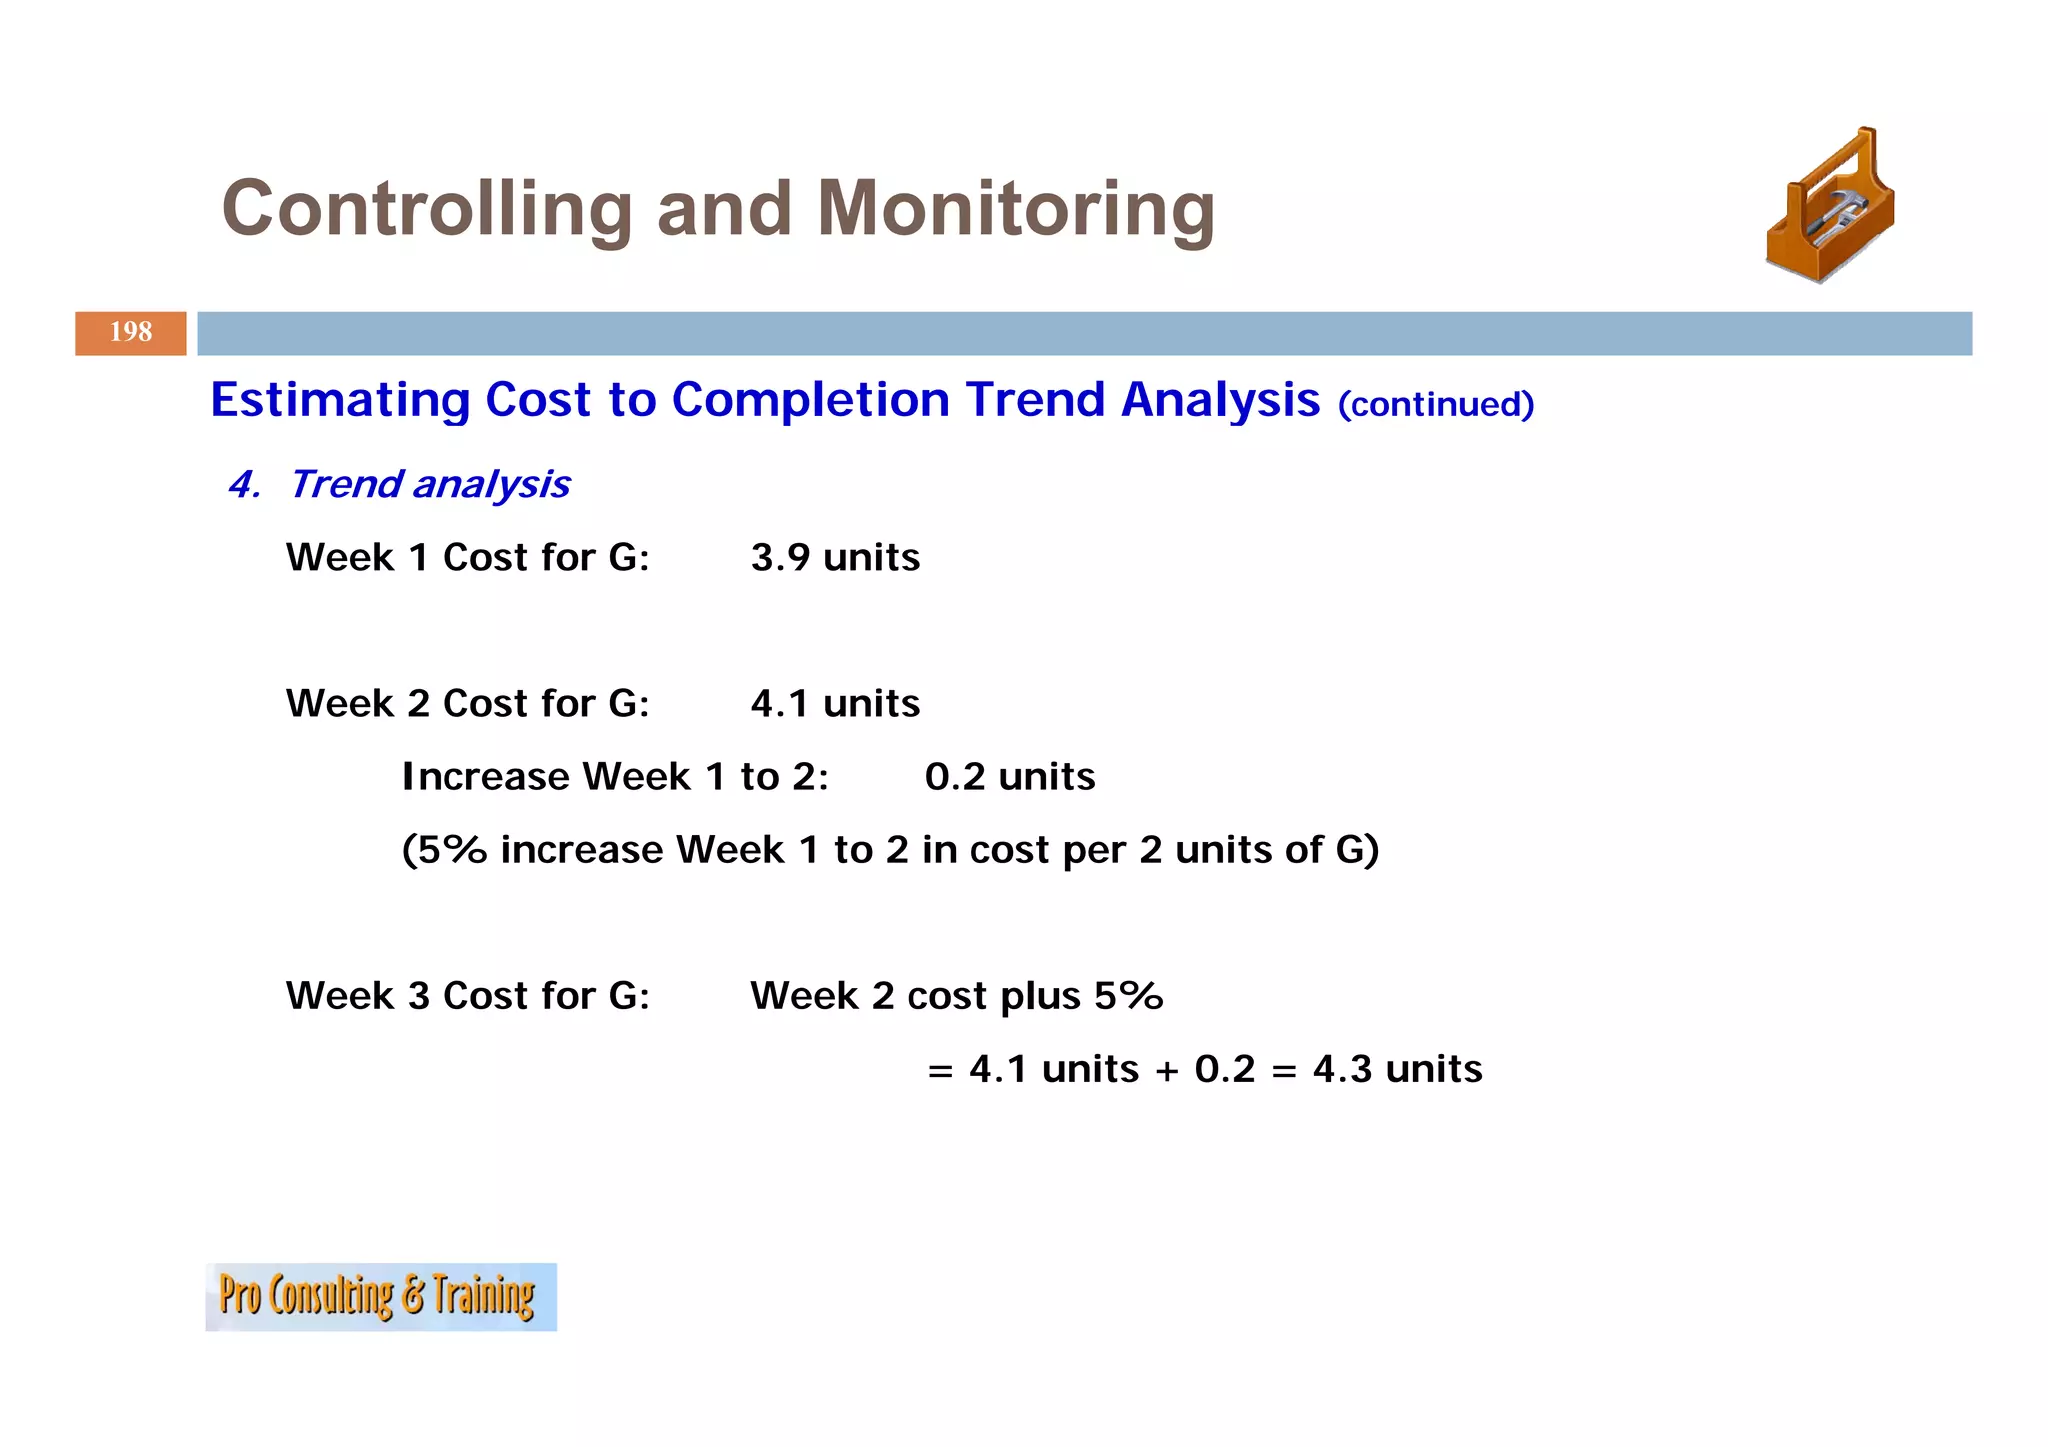
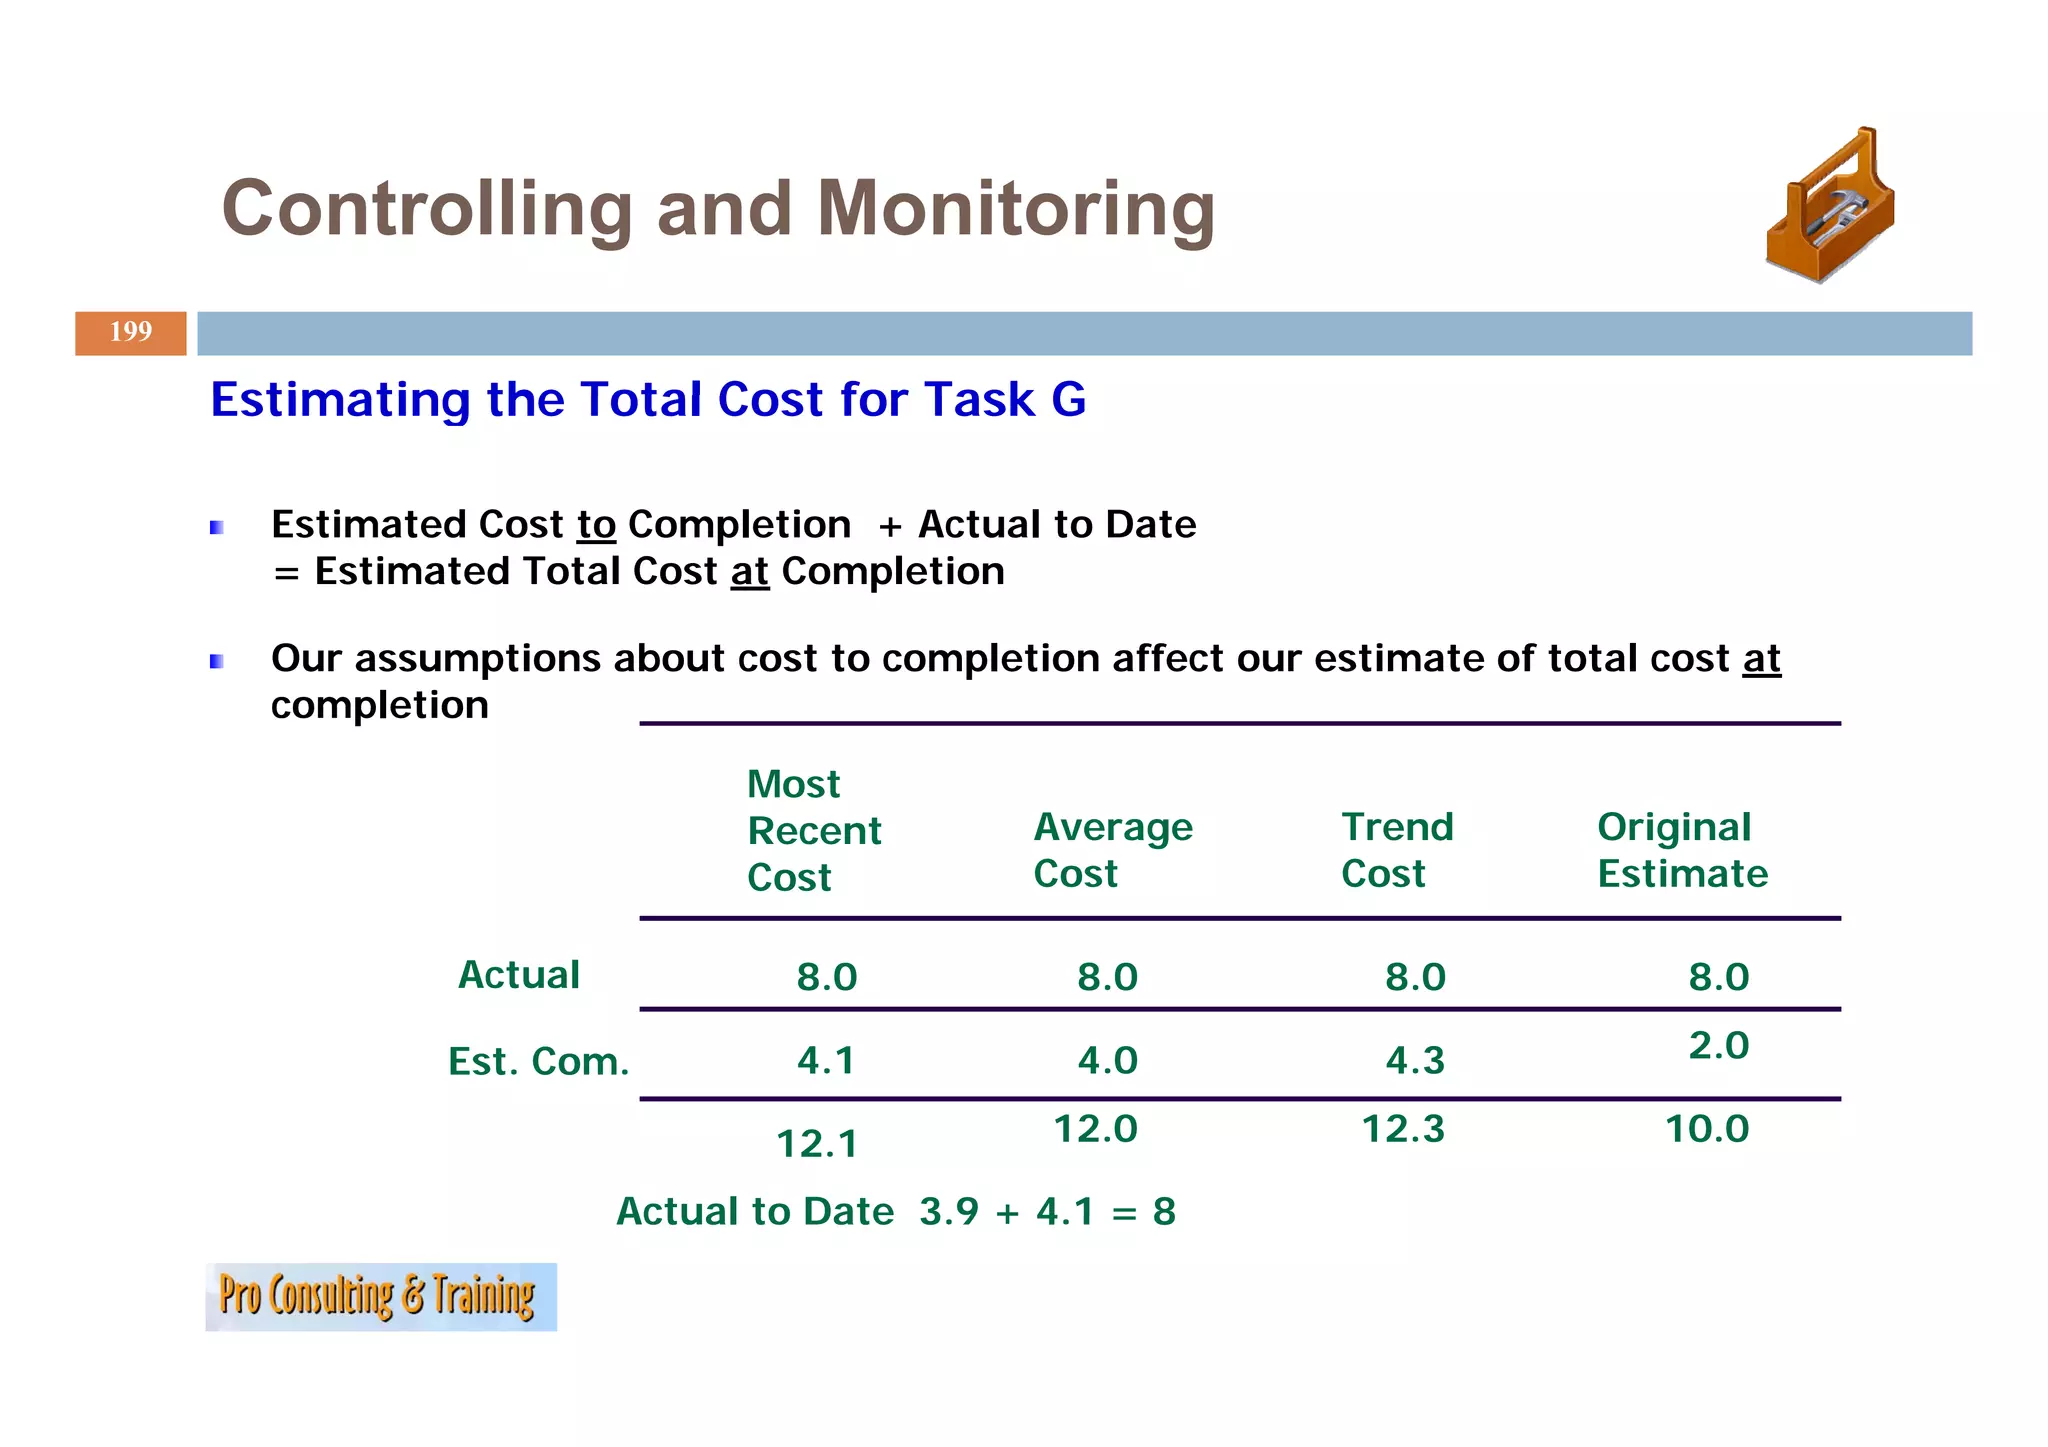
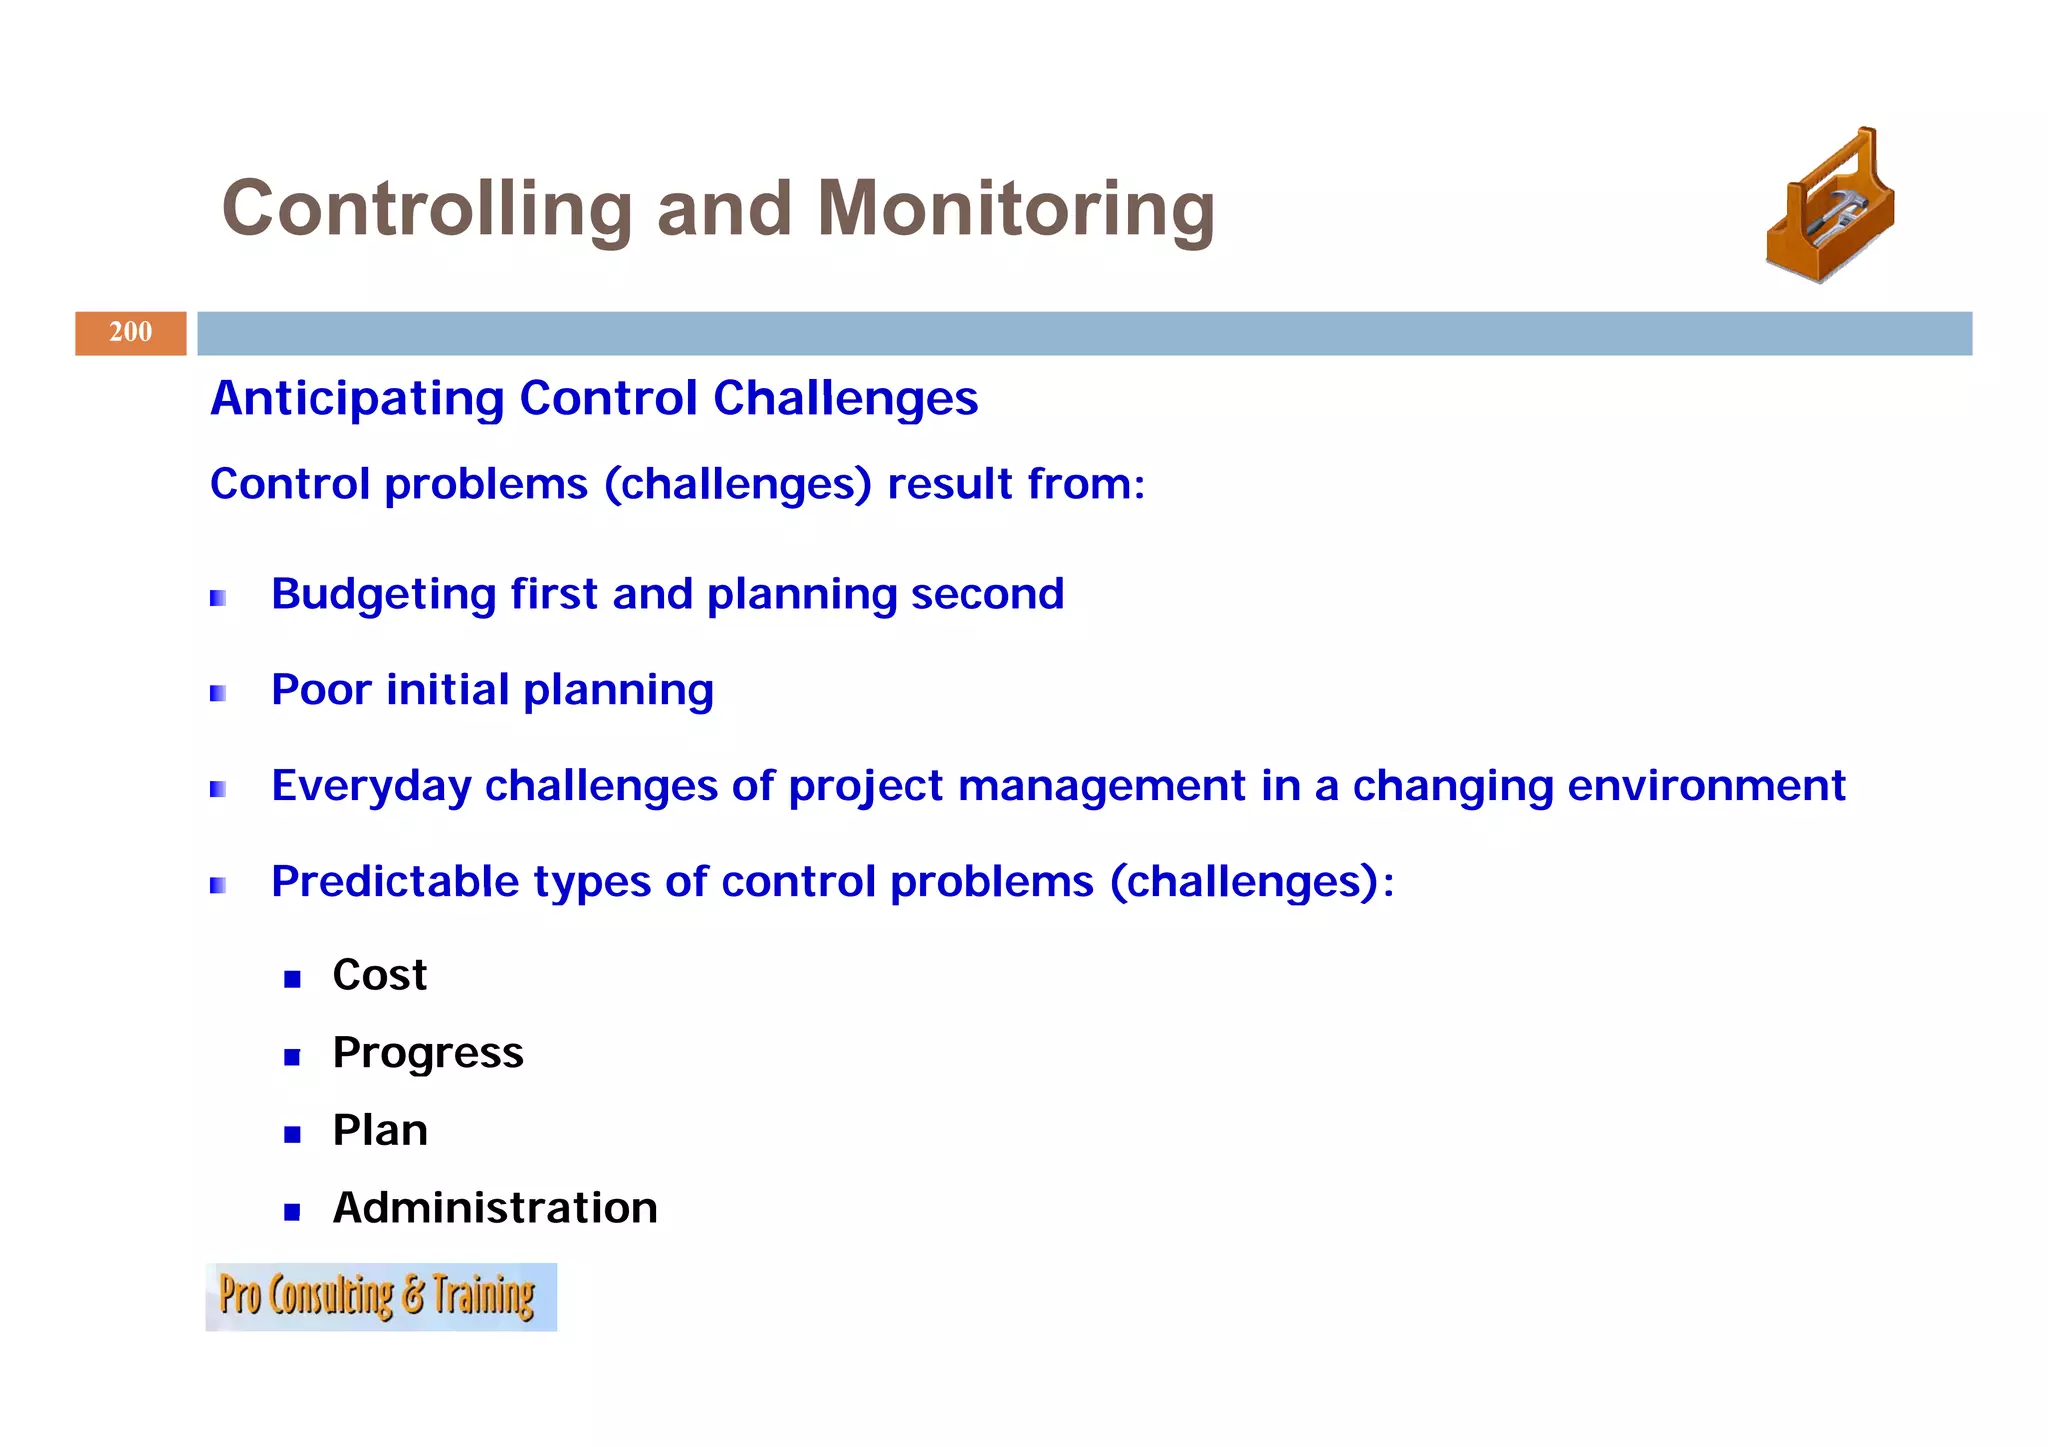
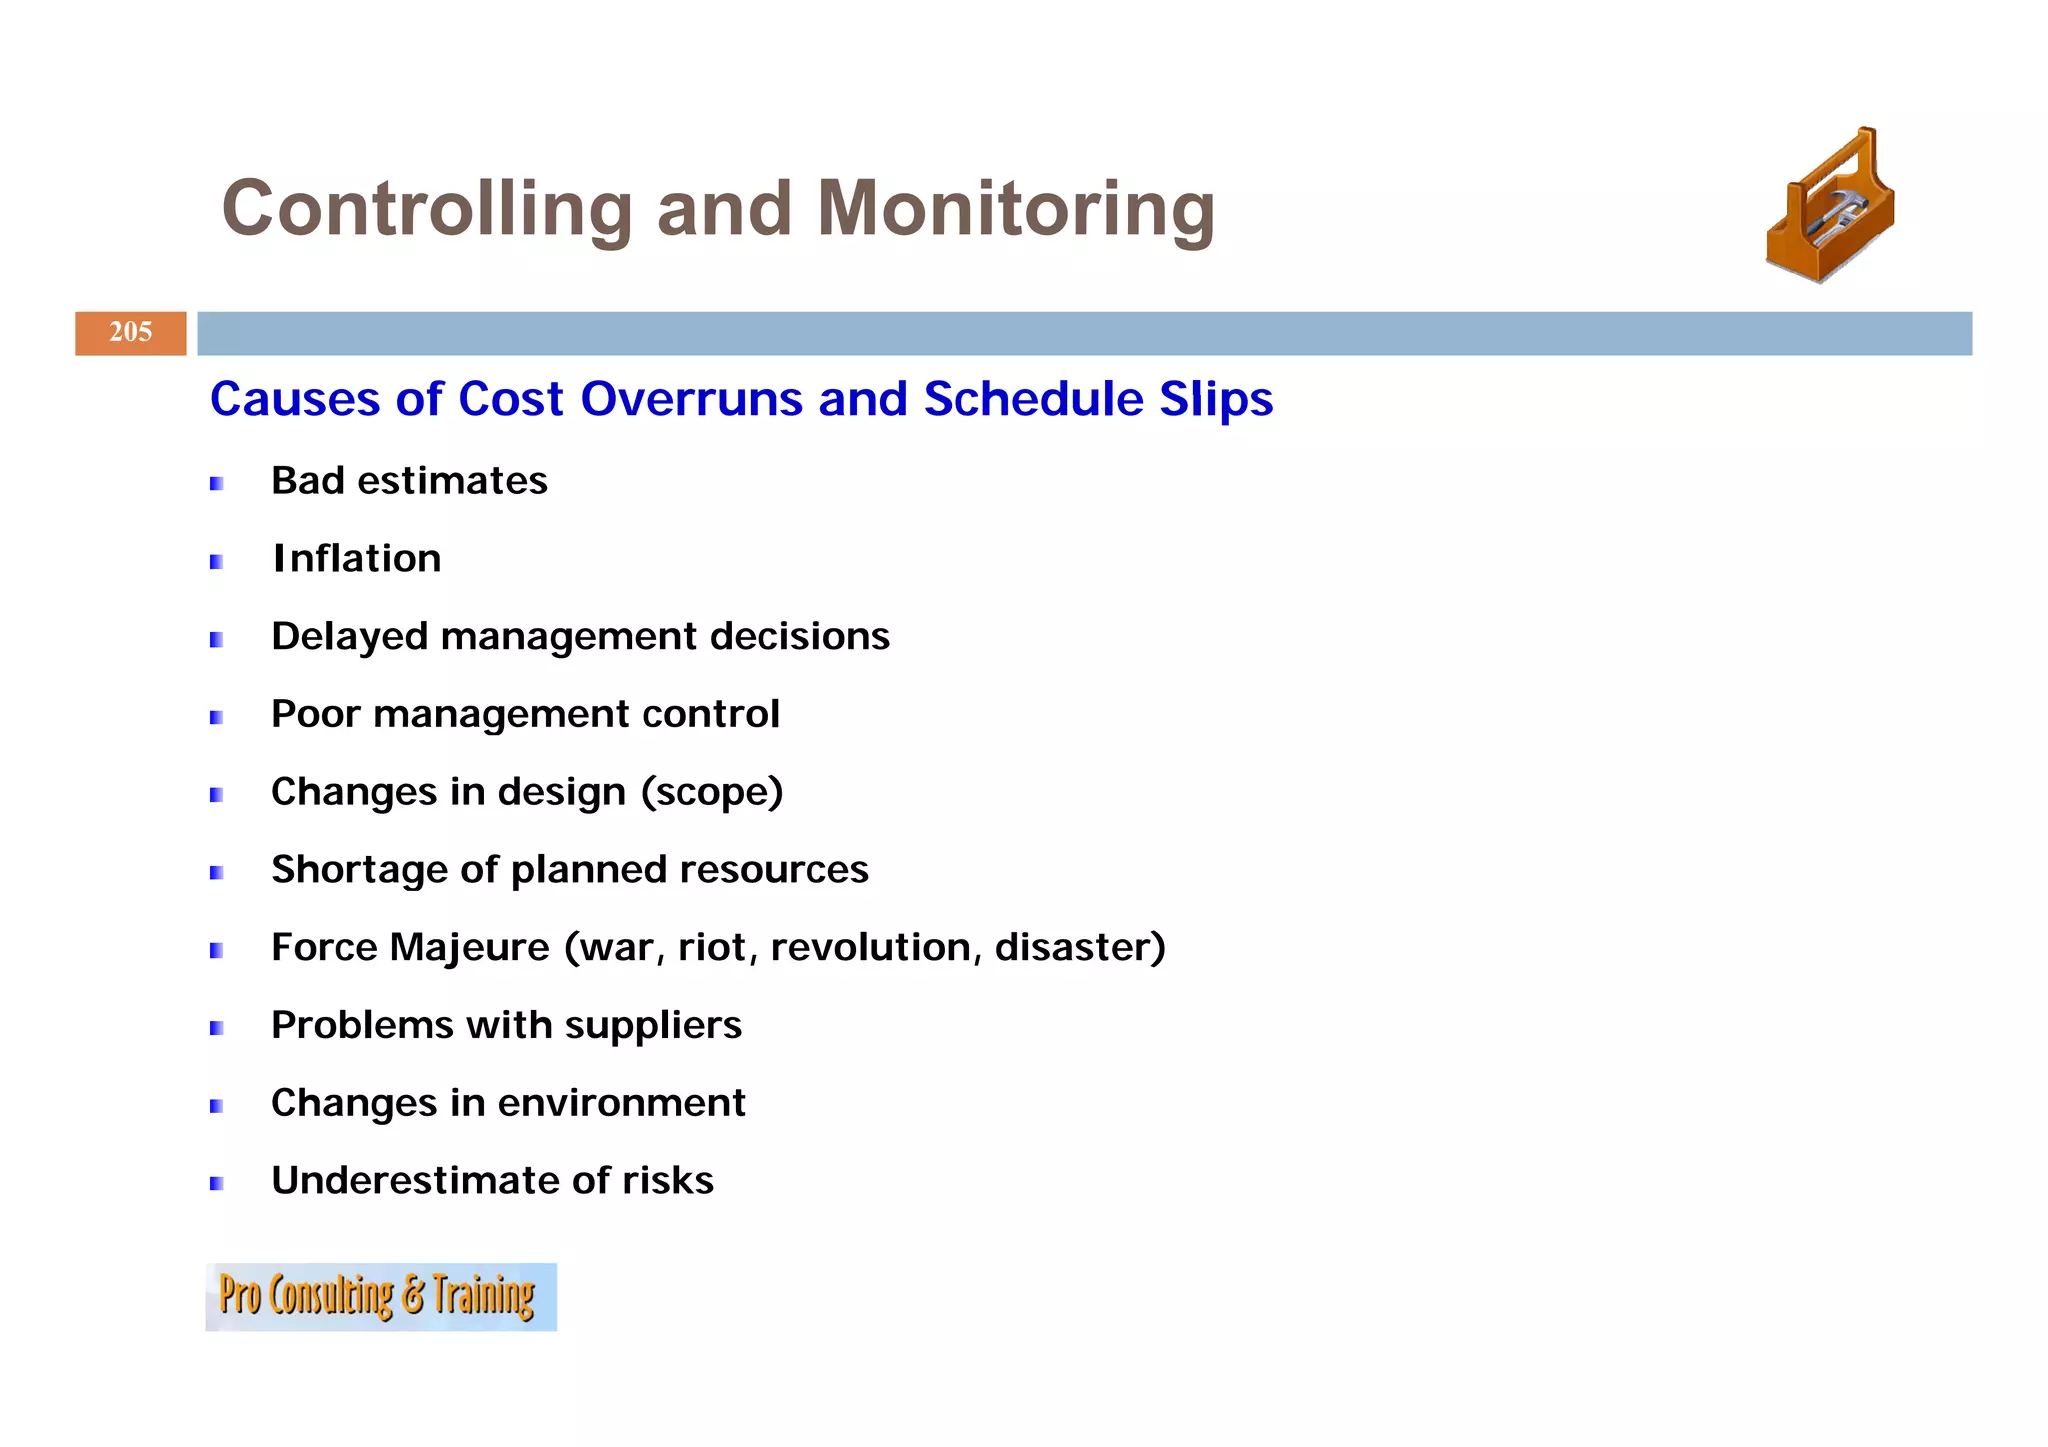
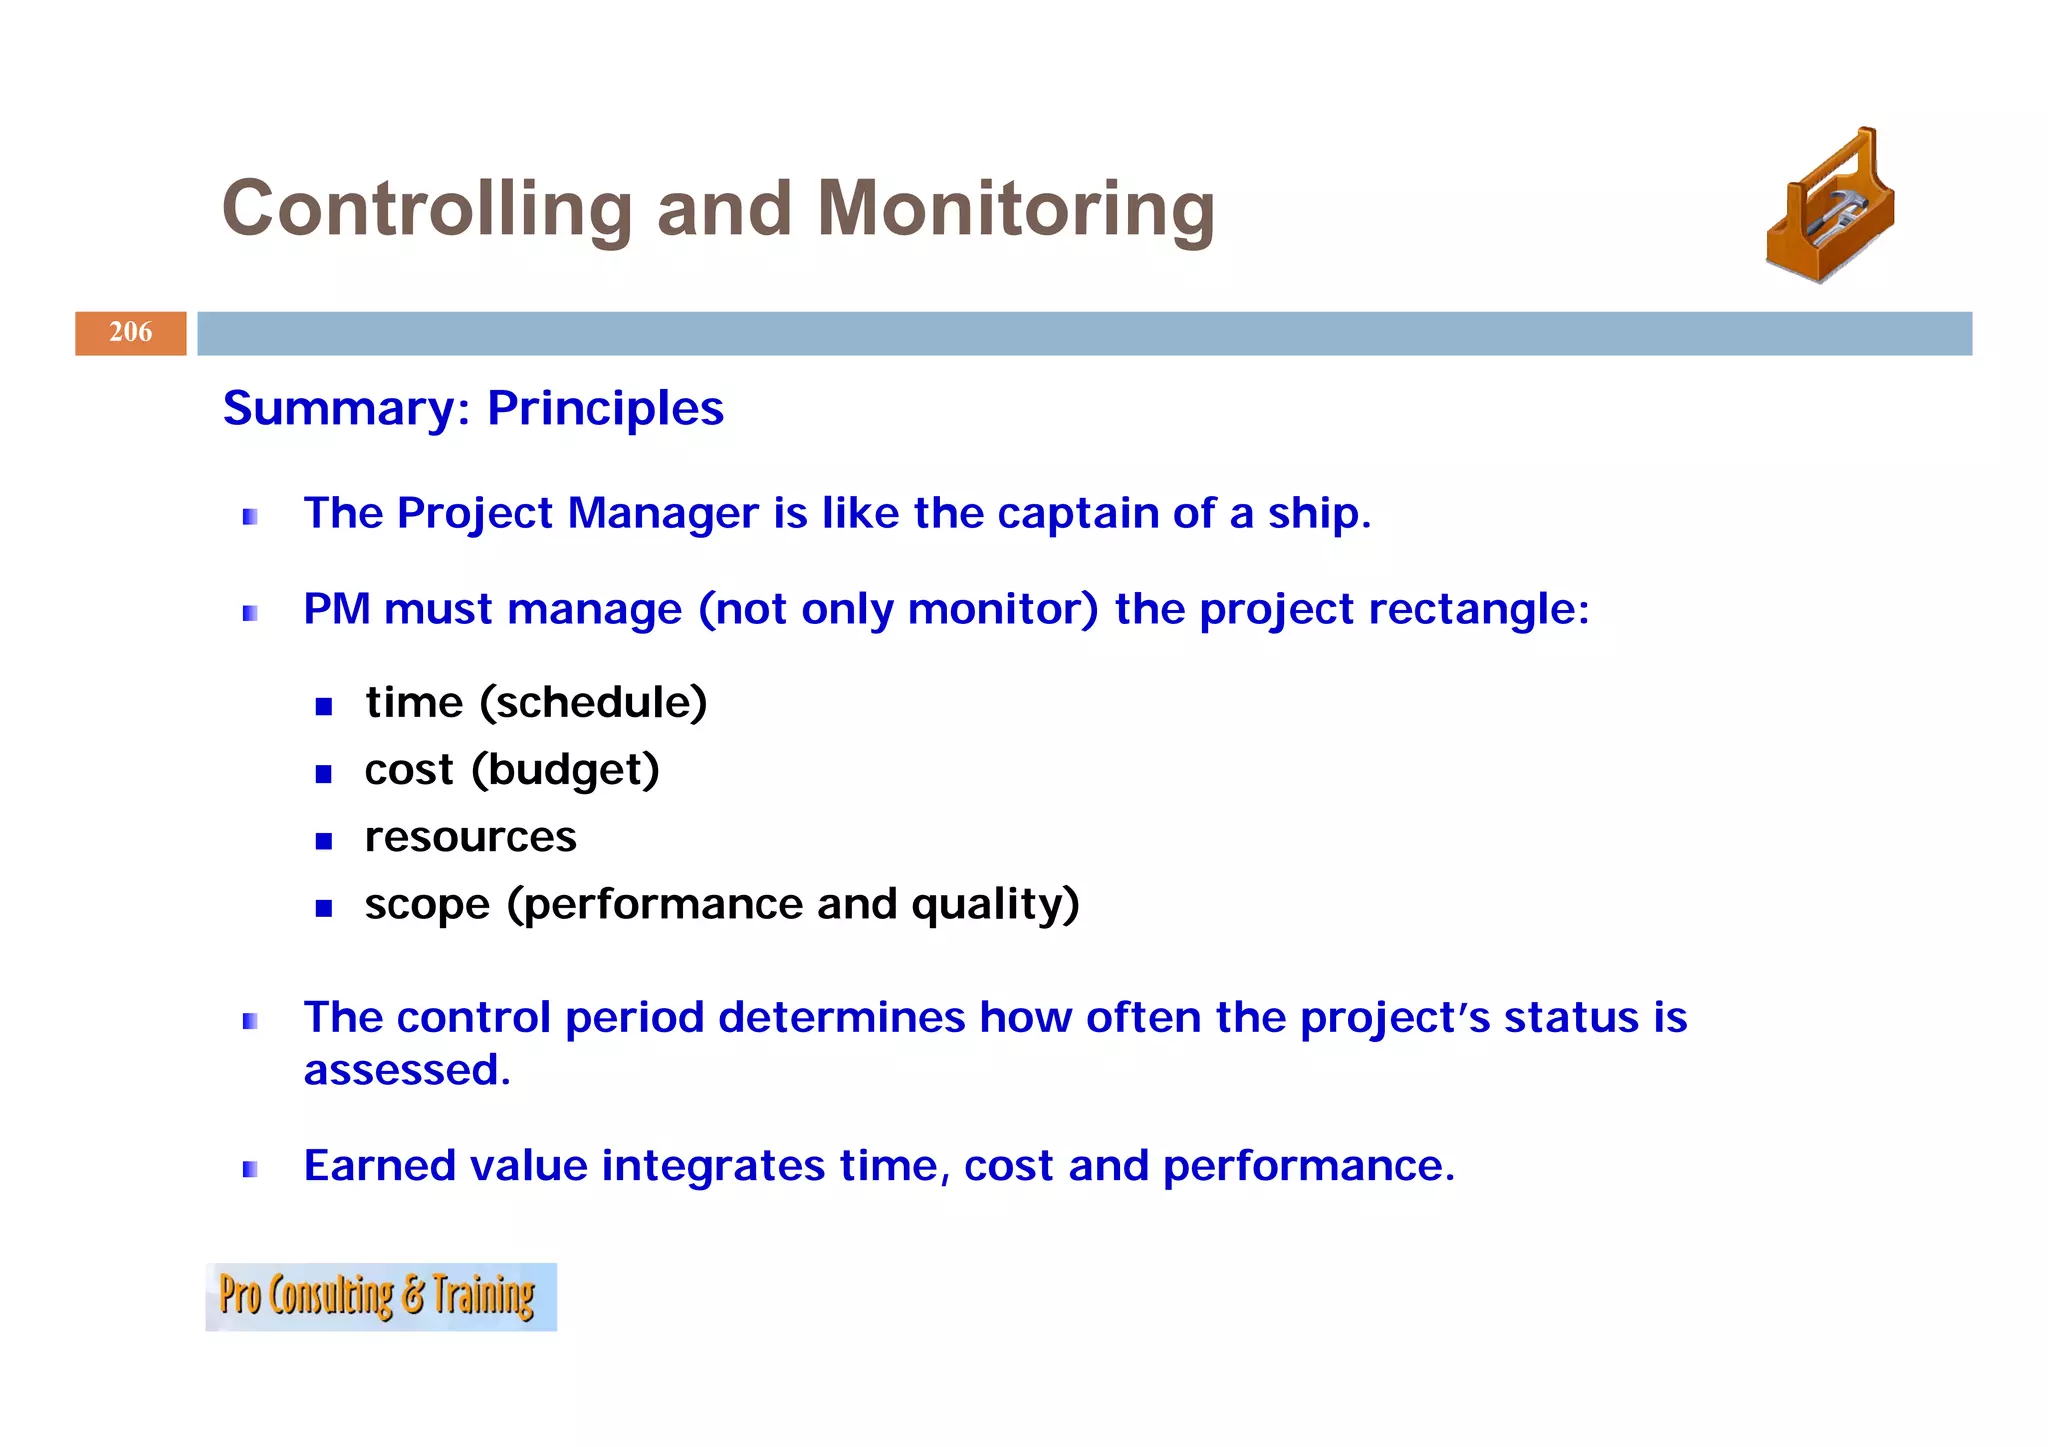
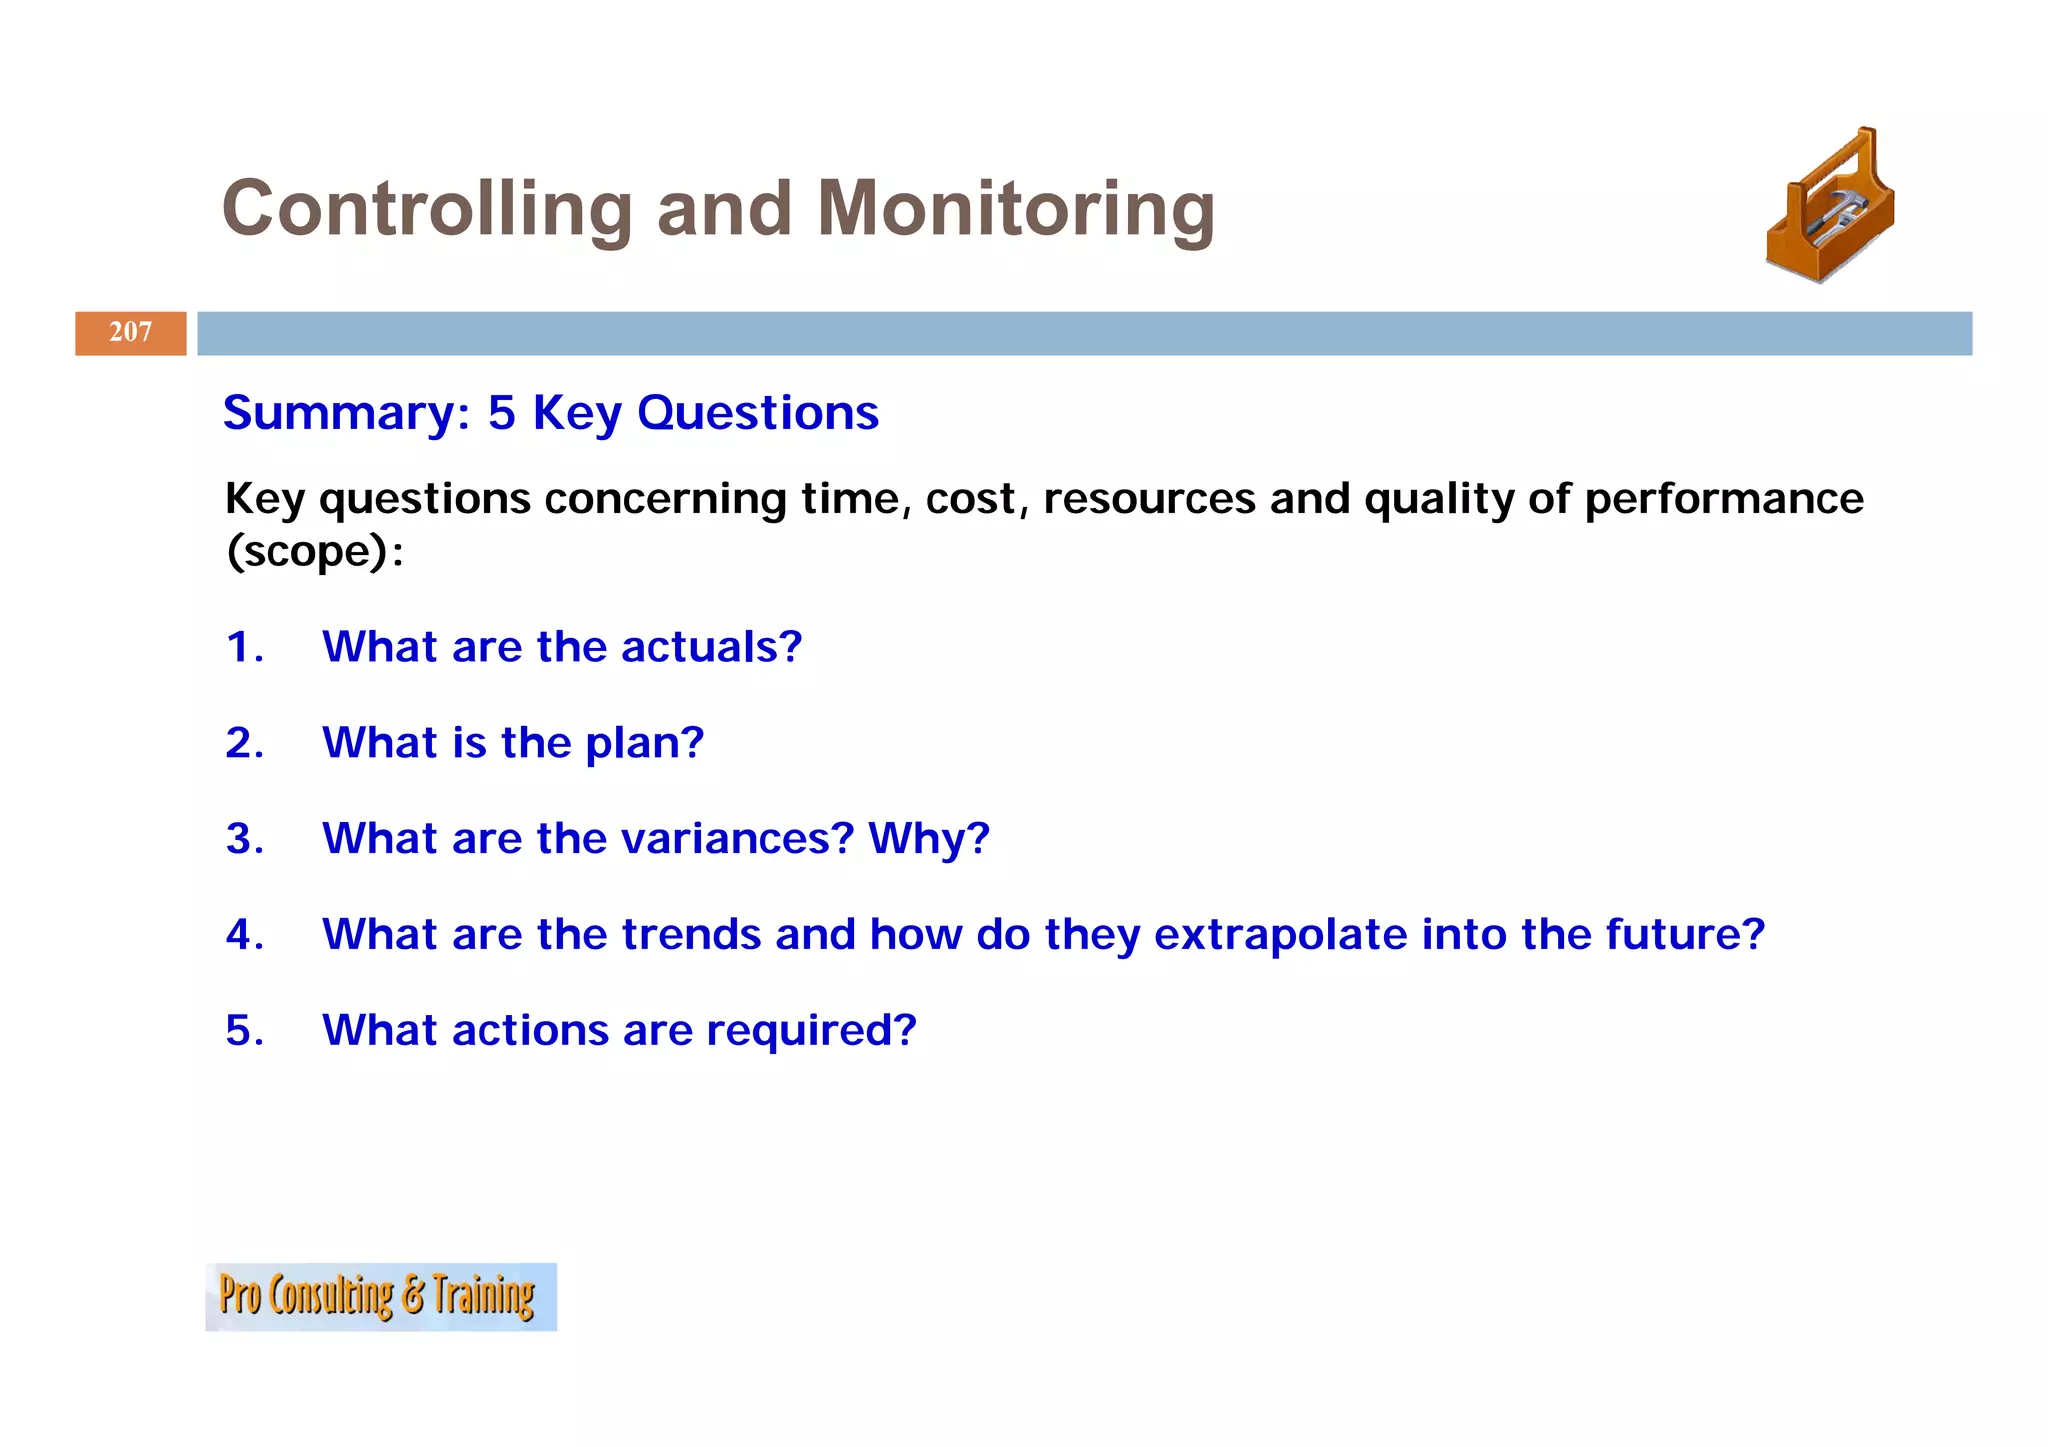
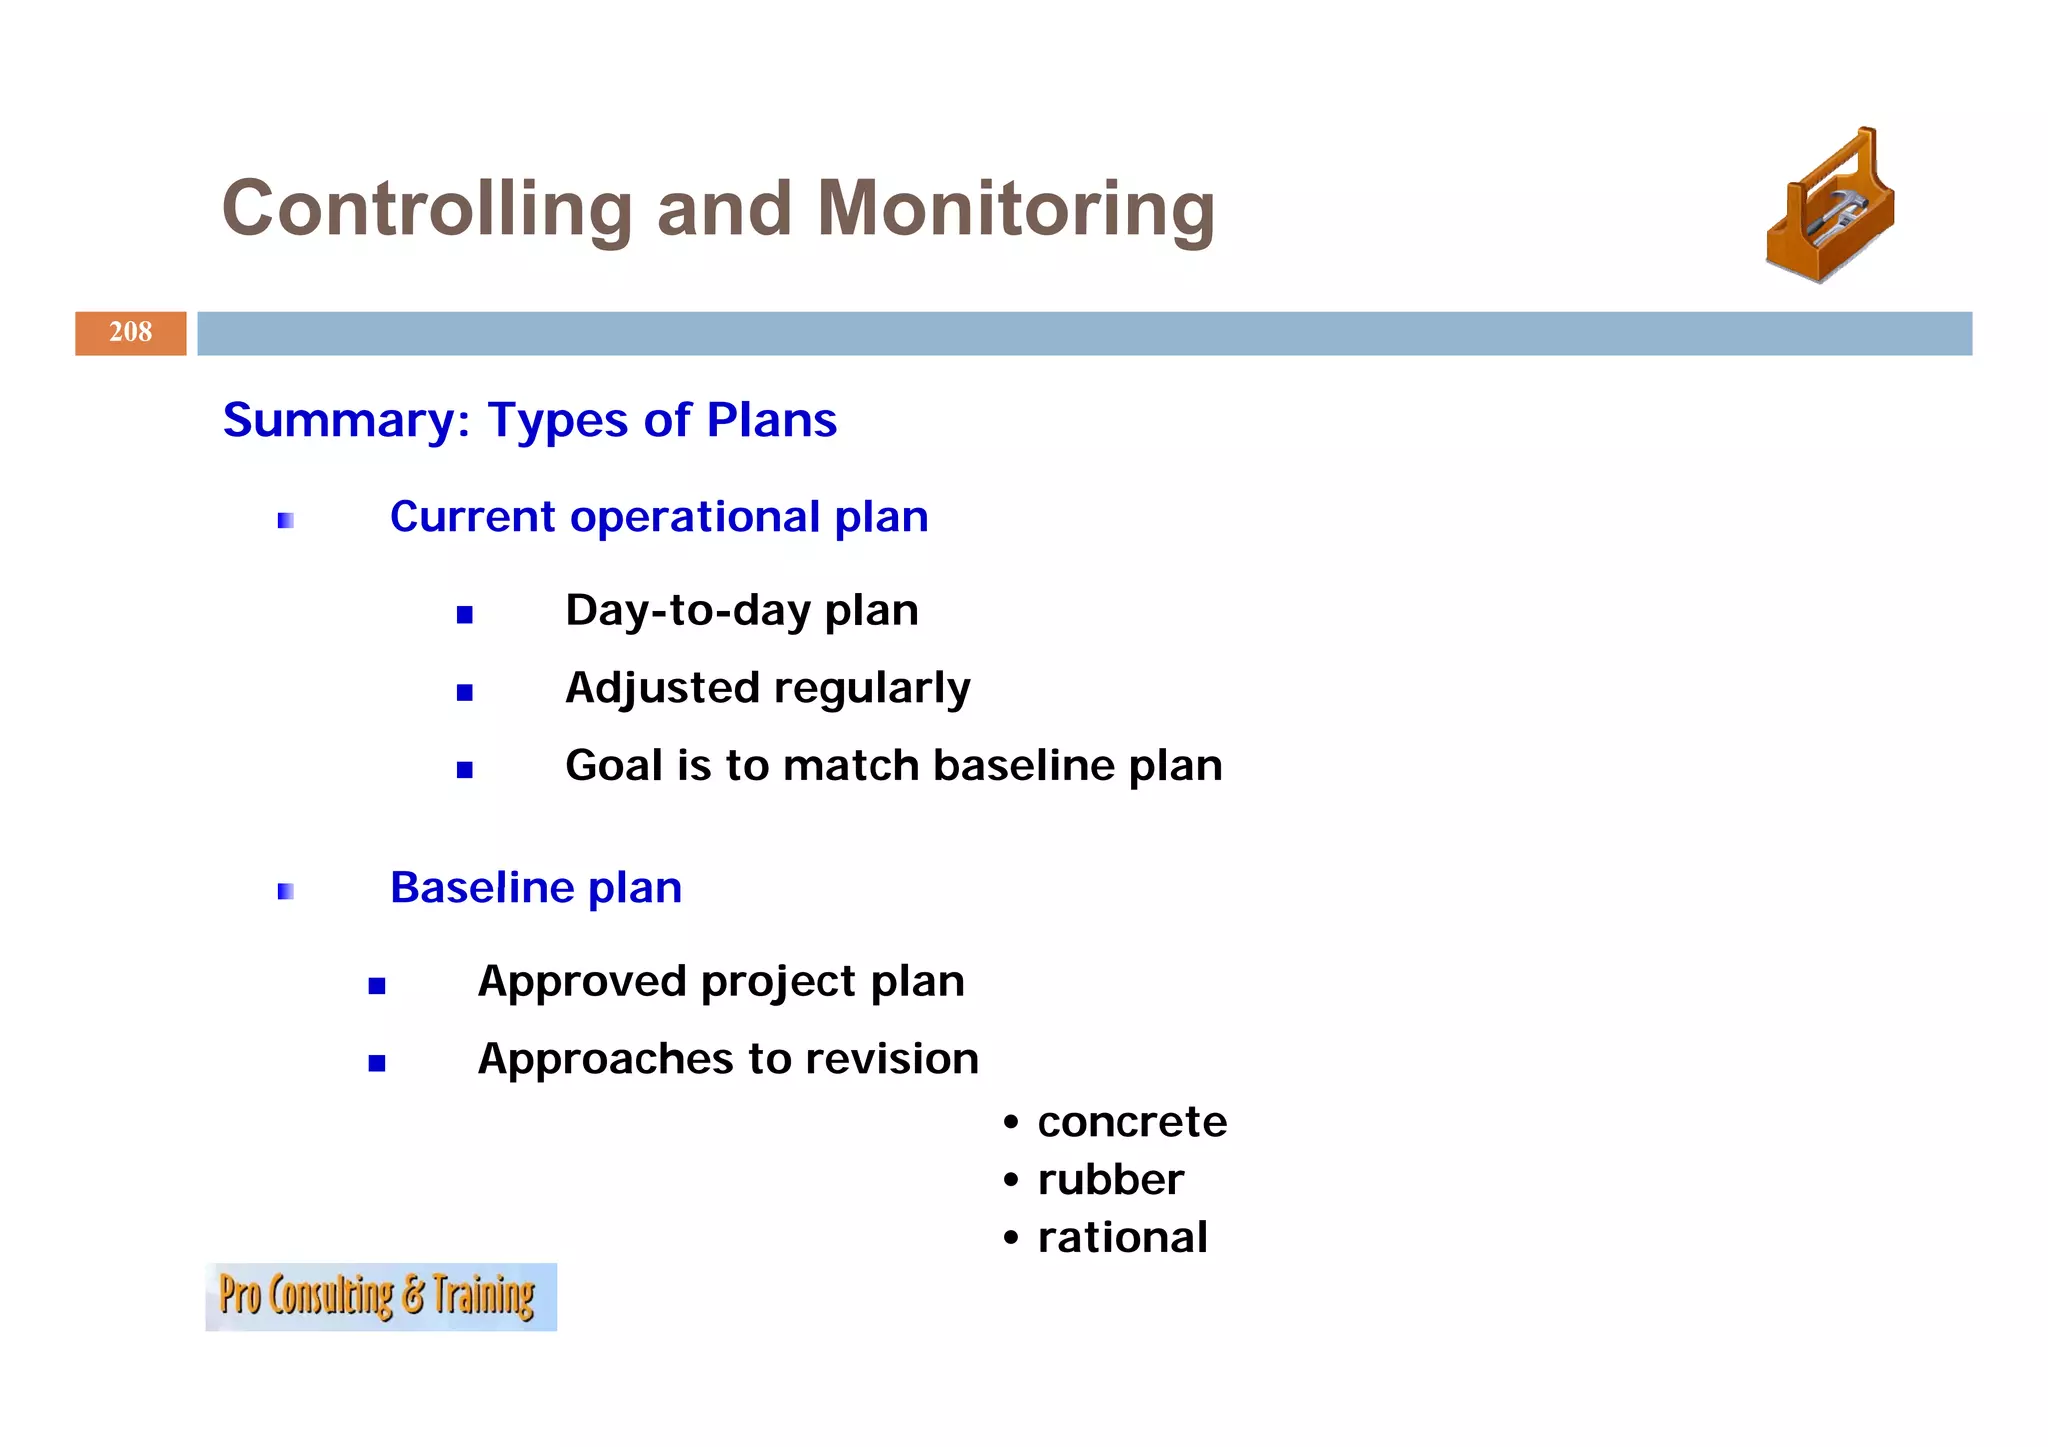
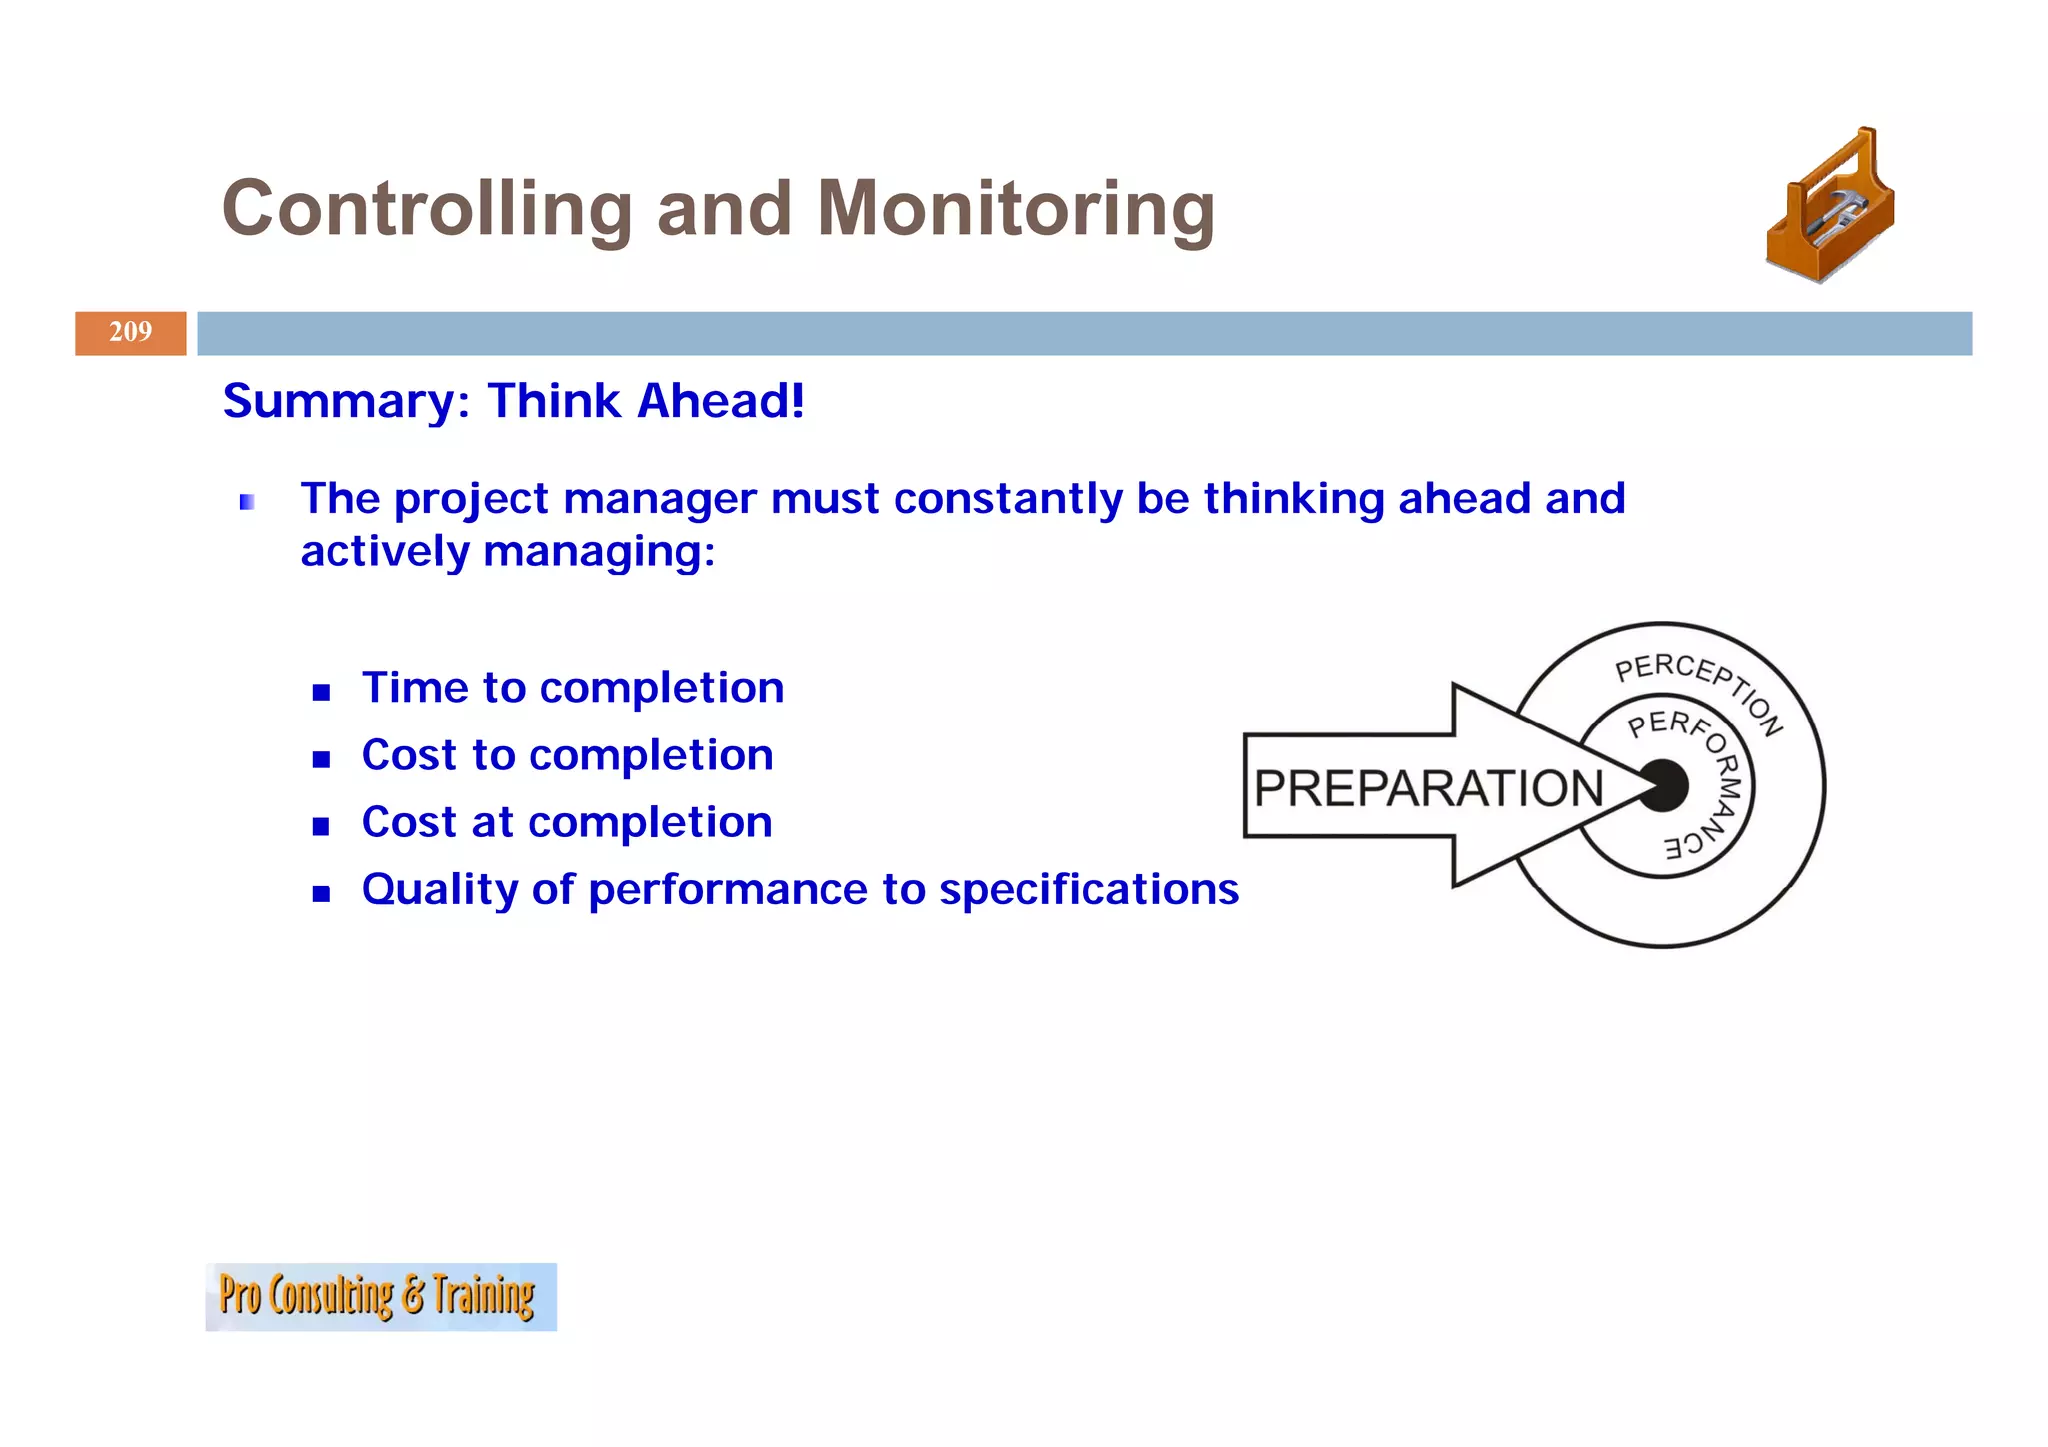
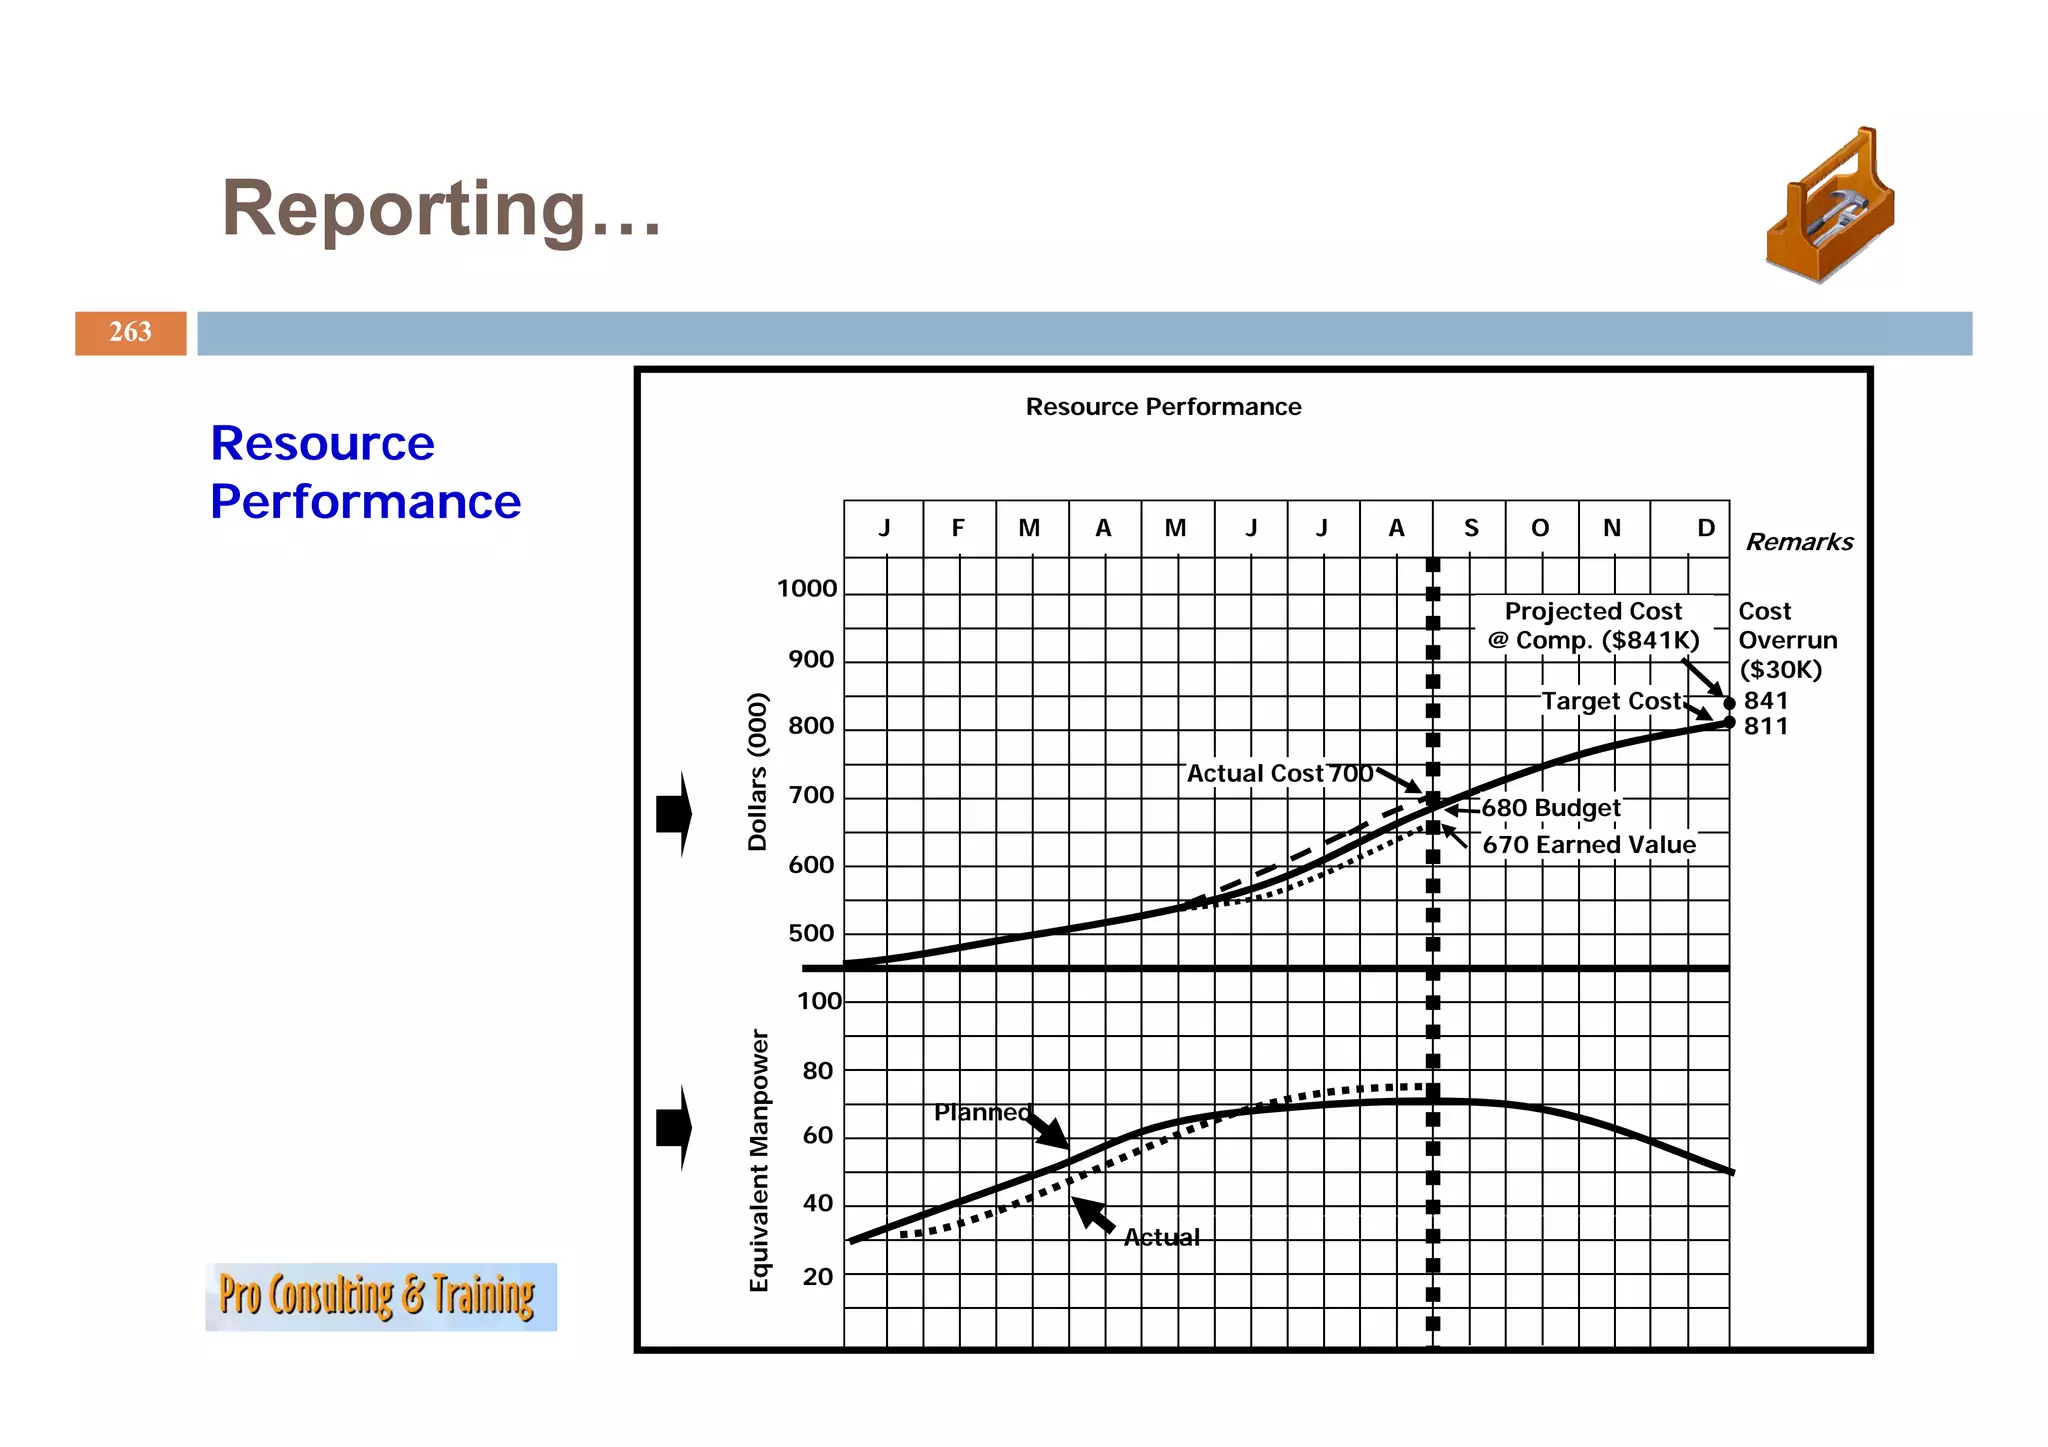
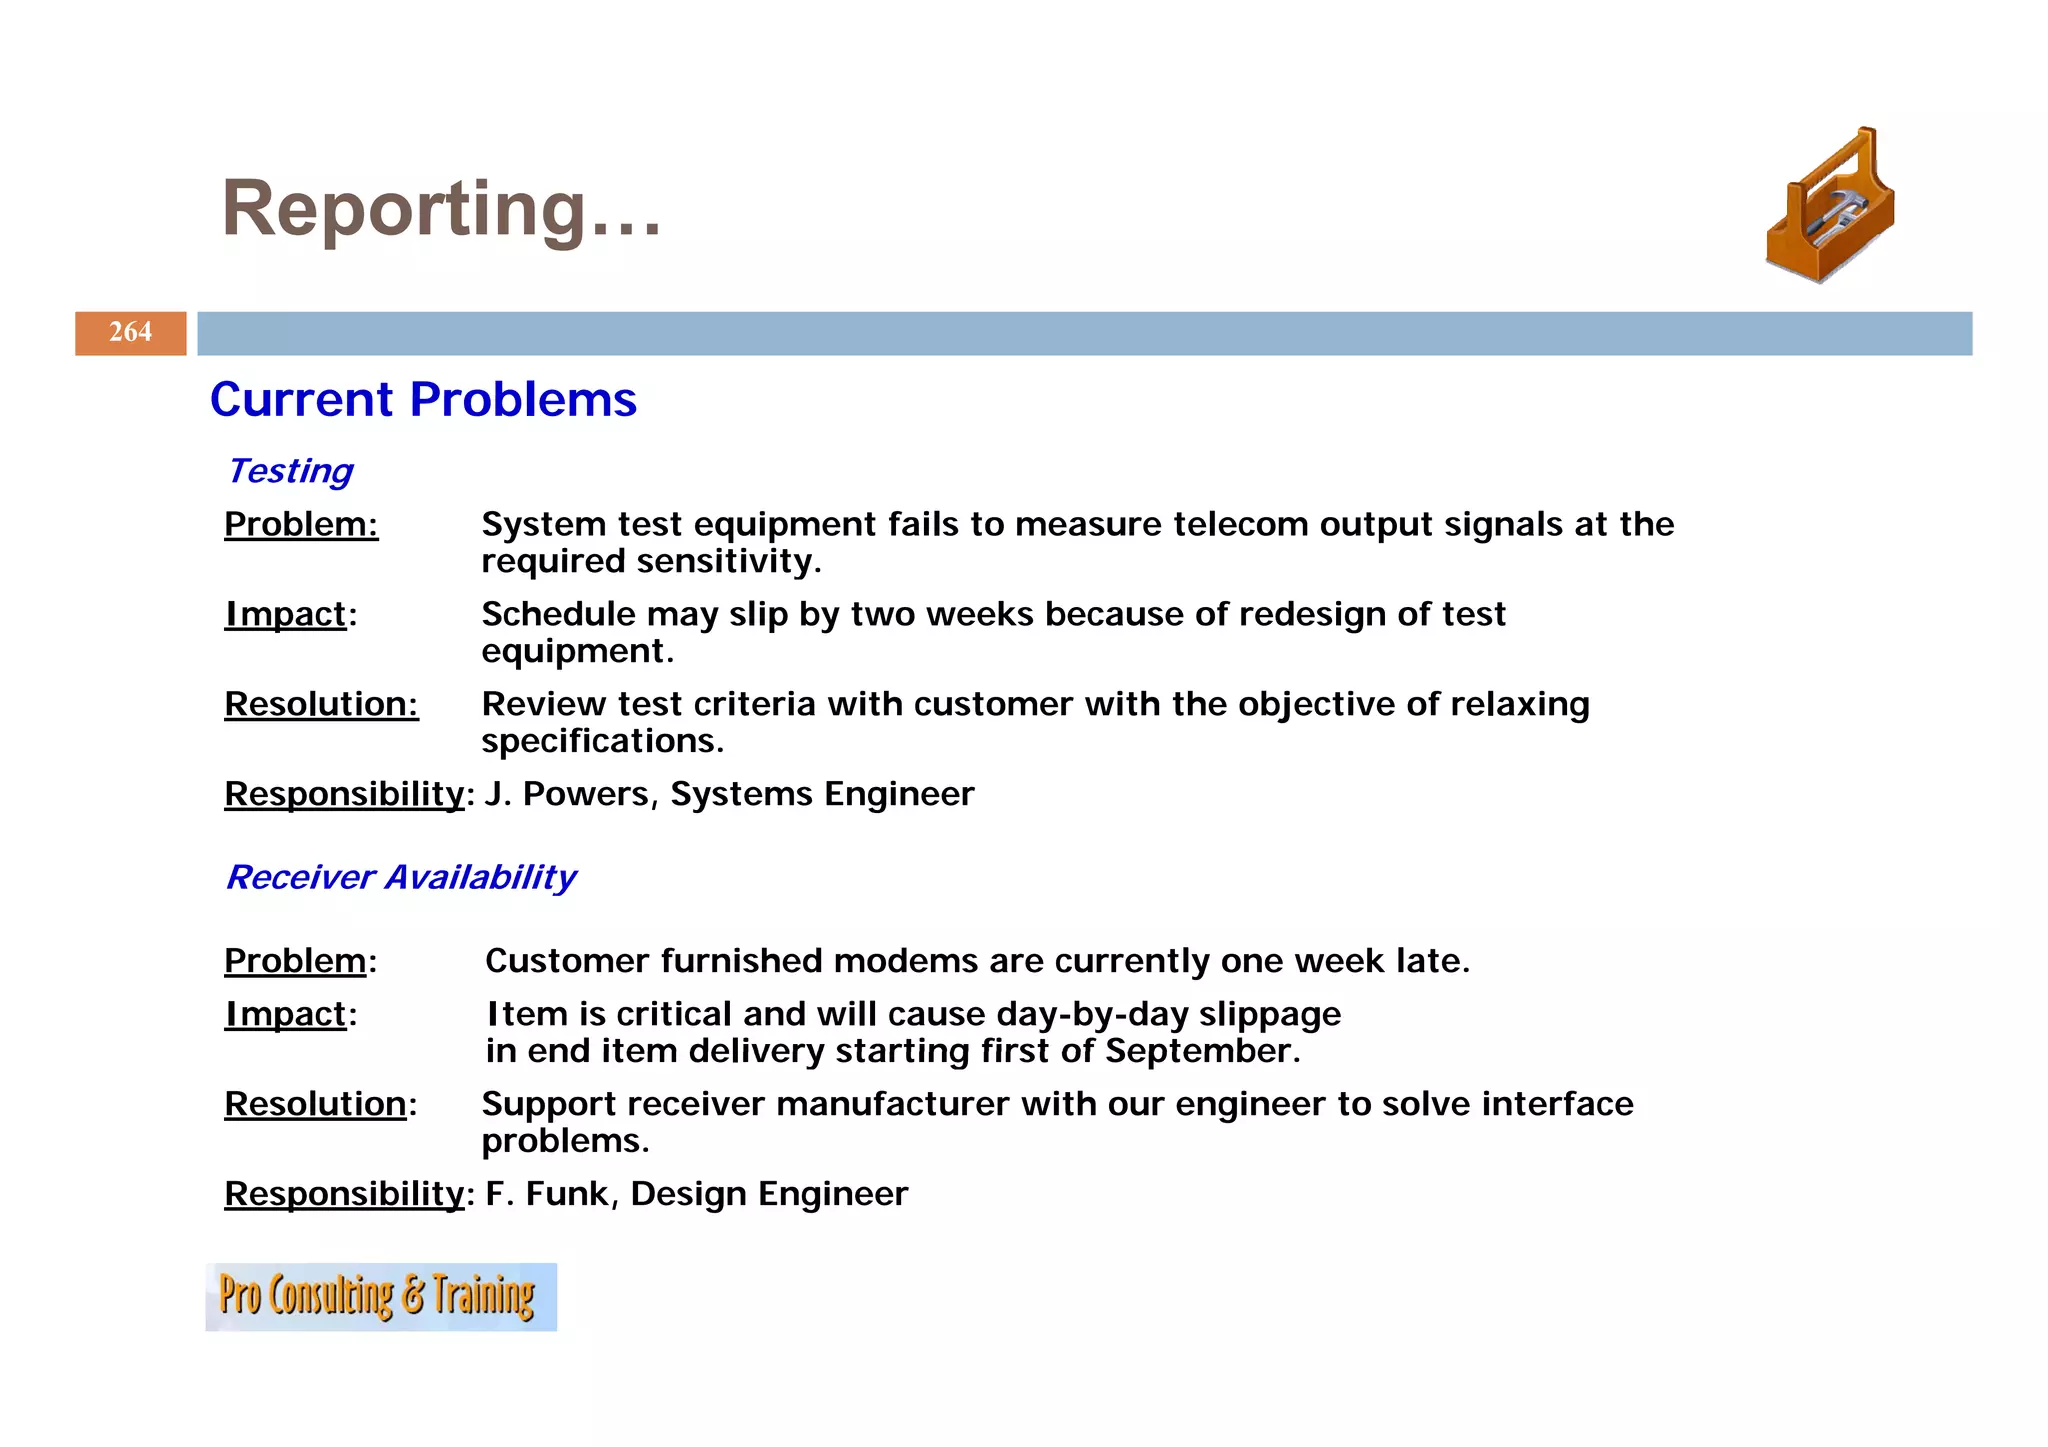
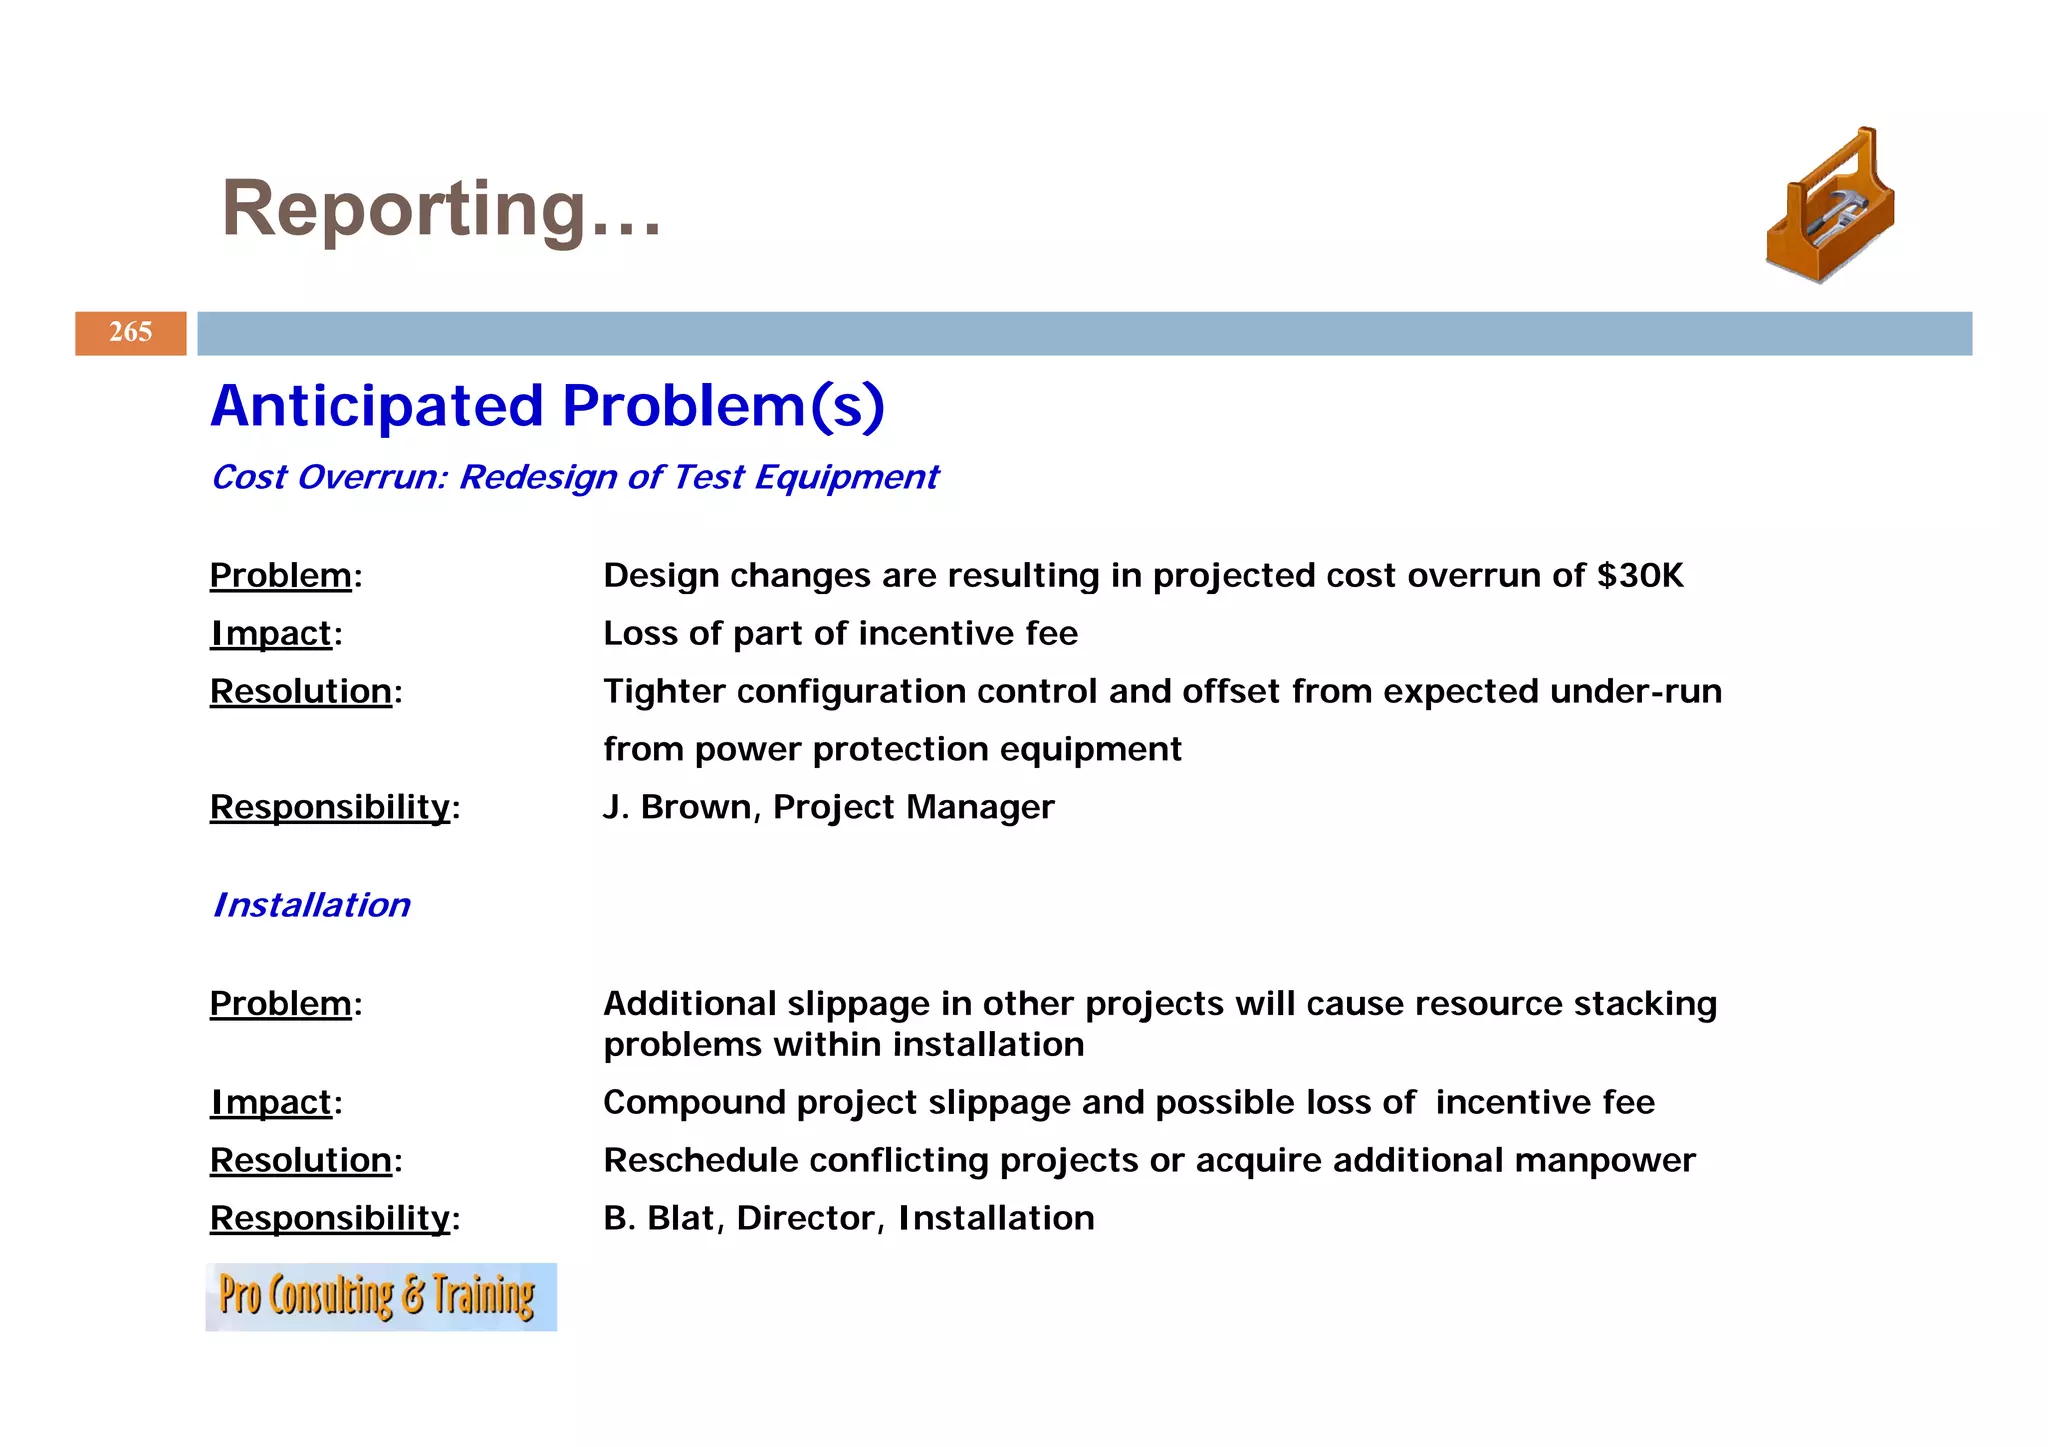
Detailed discussion on controlling and monitoring of projects, with emphasis on performance measures.
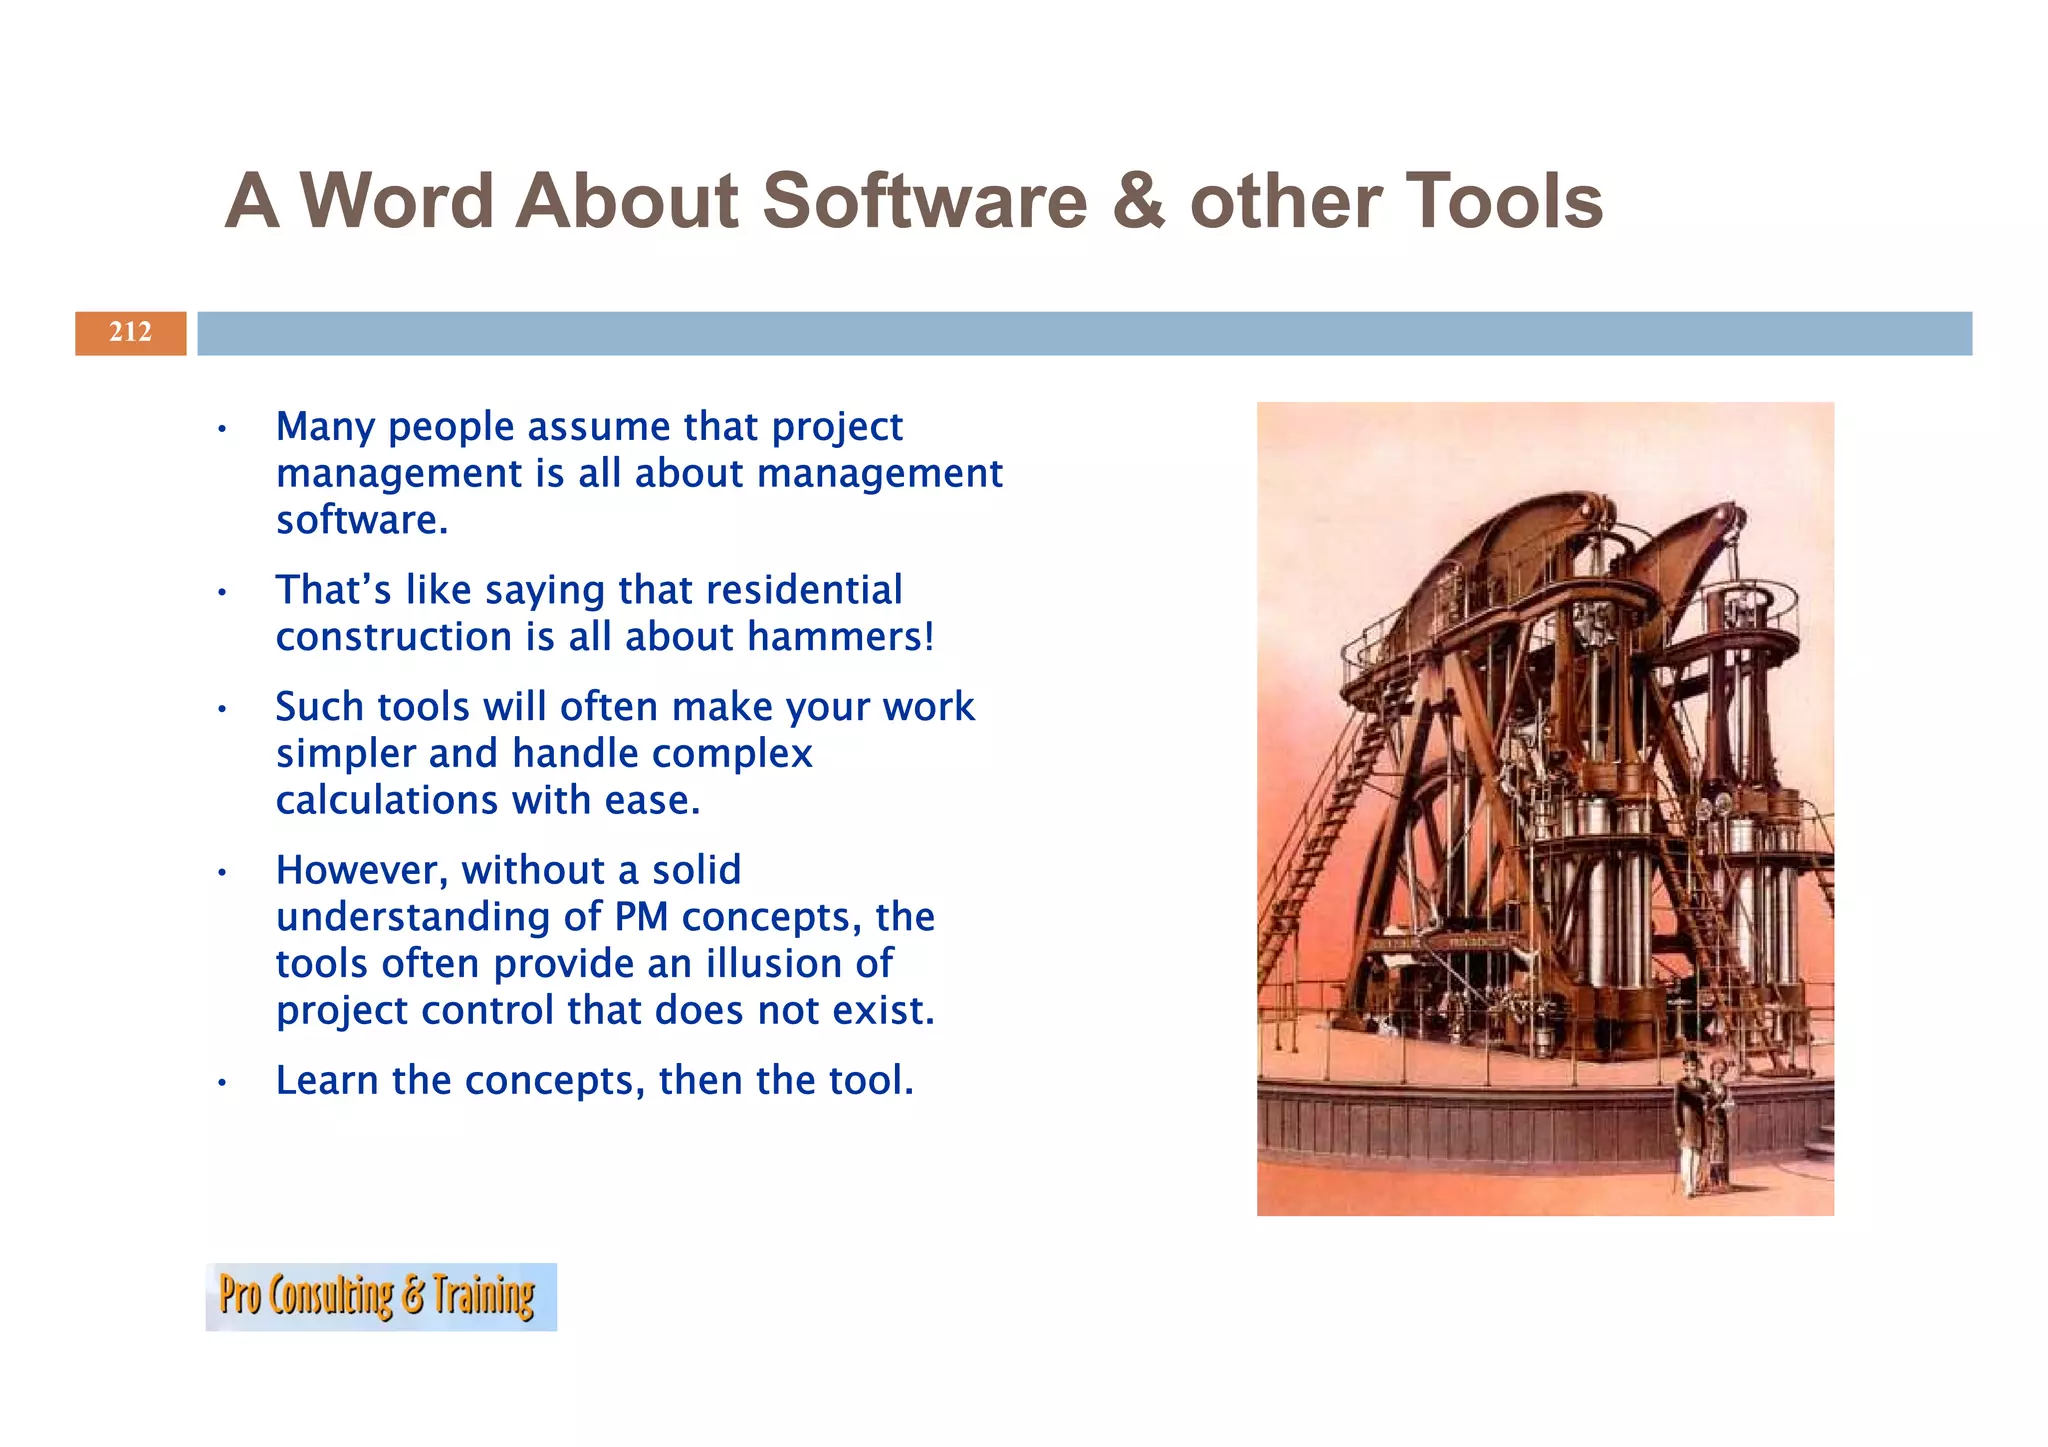
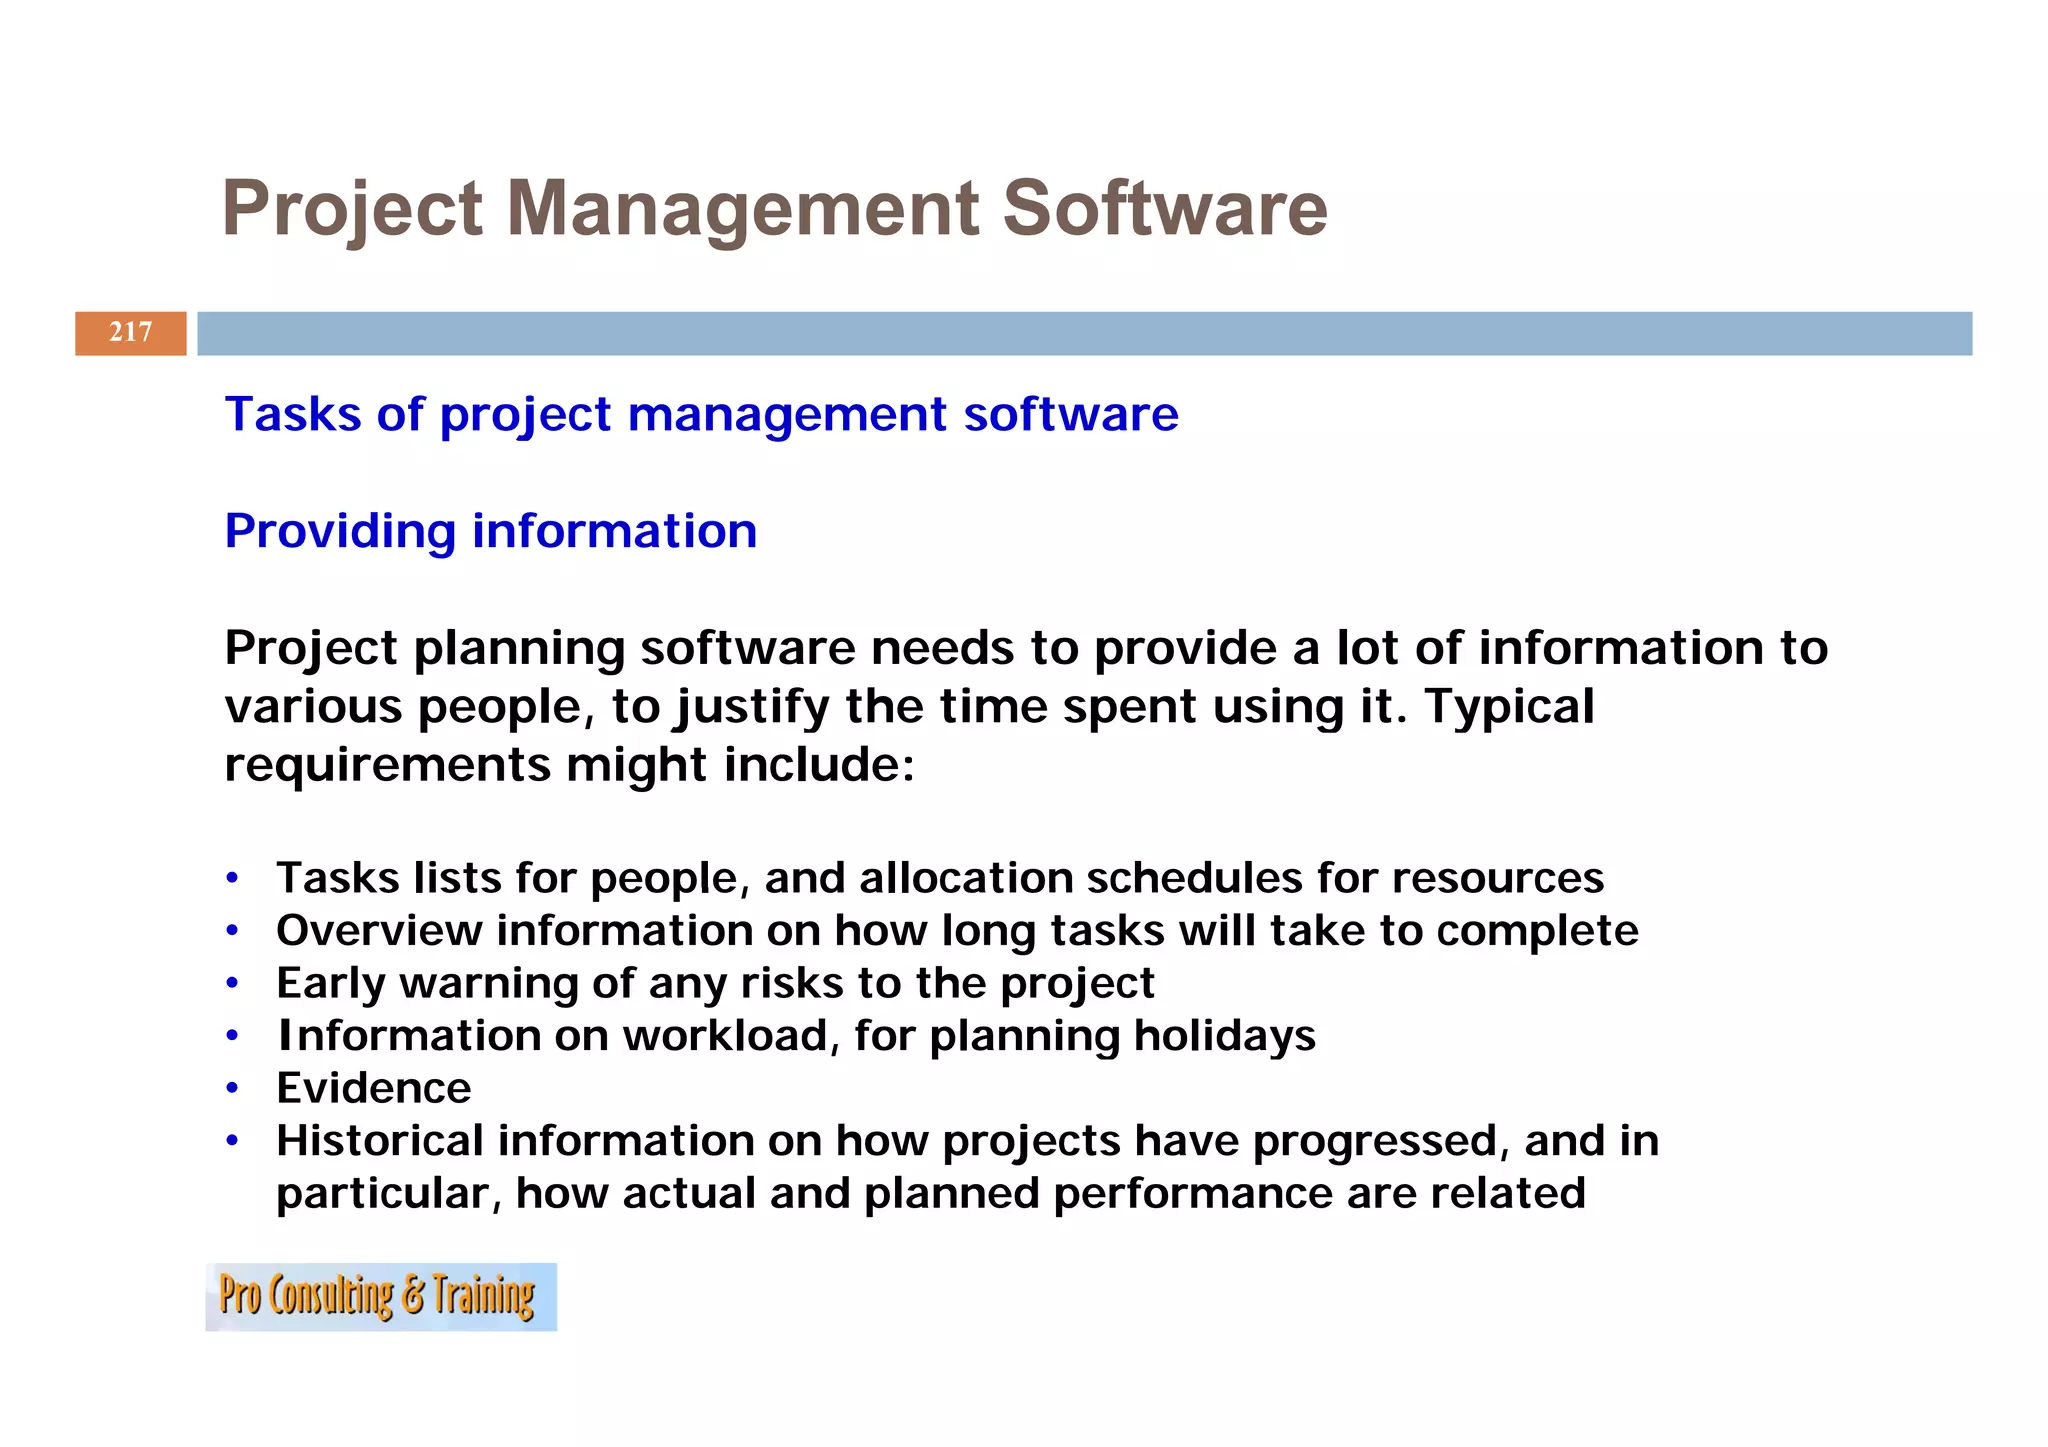
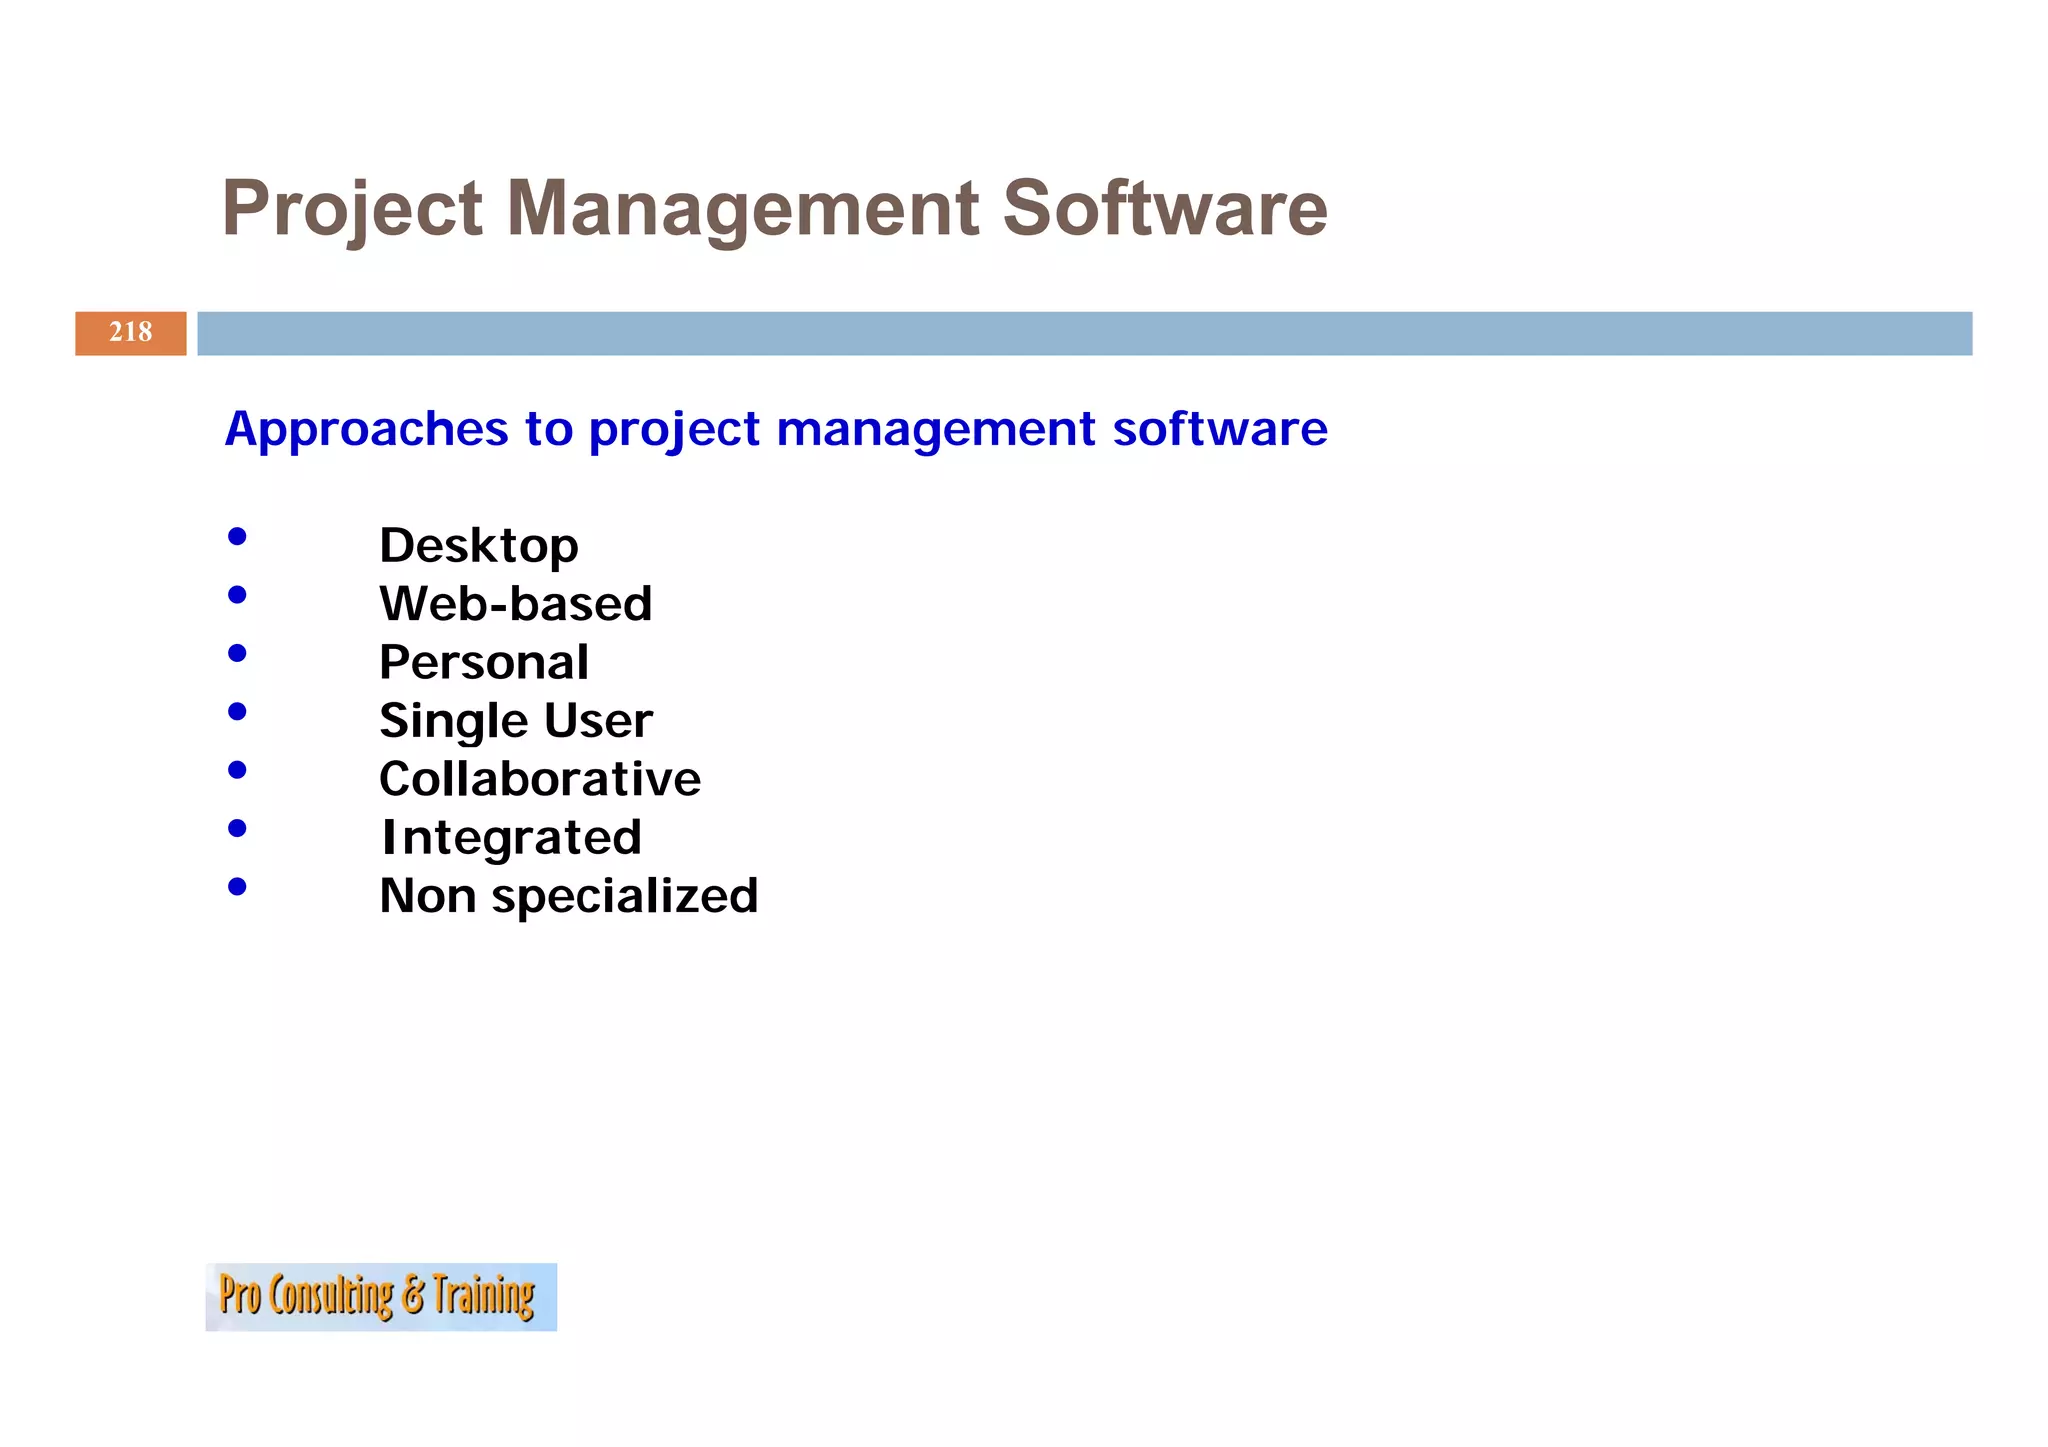
Exploration of different software tools and their roles in project management.
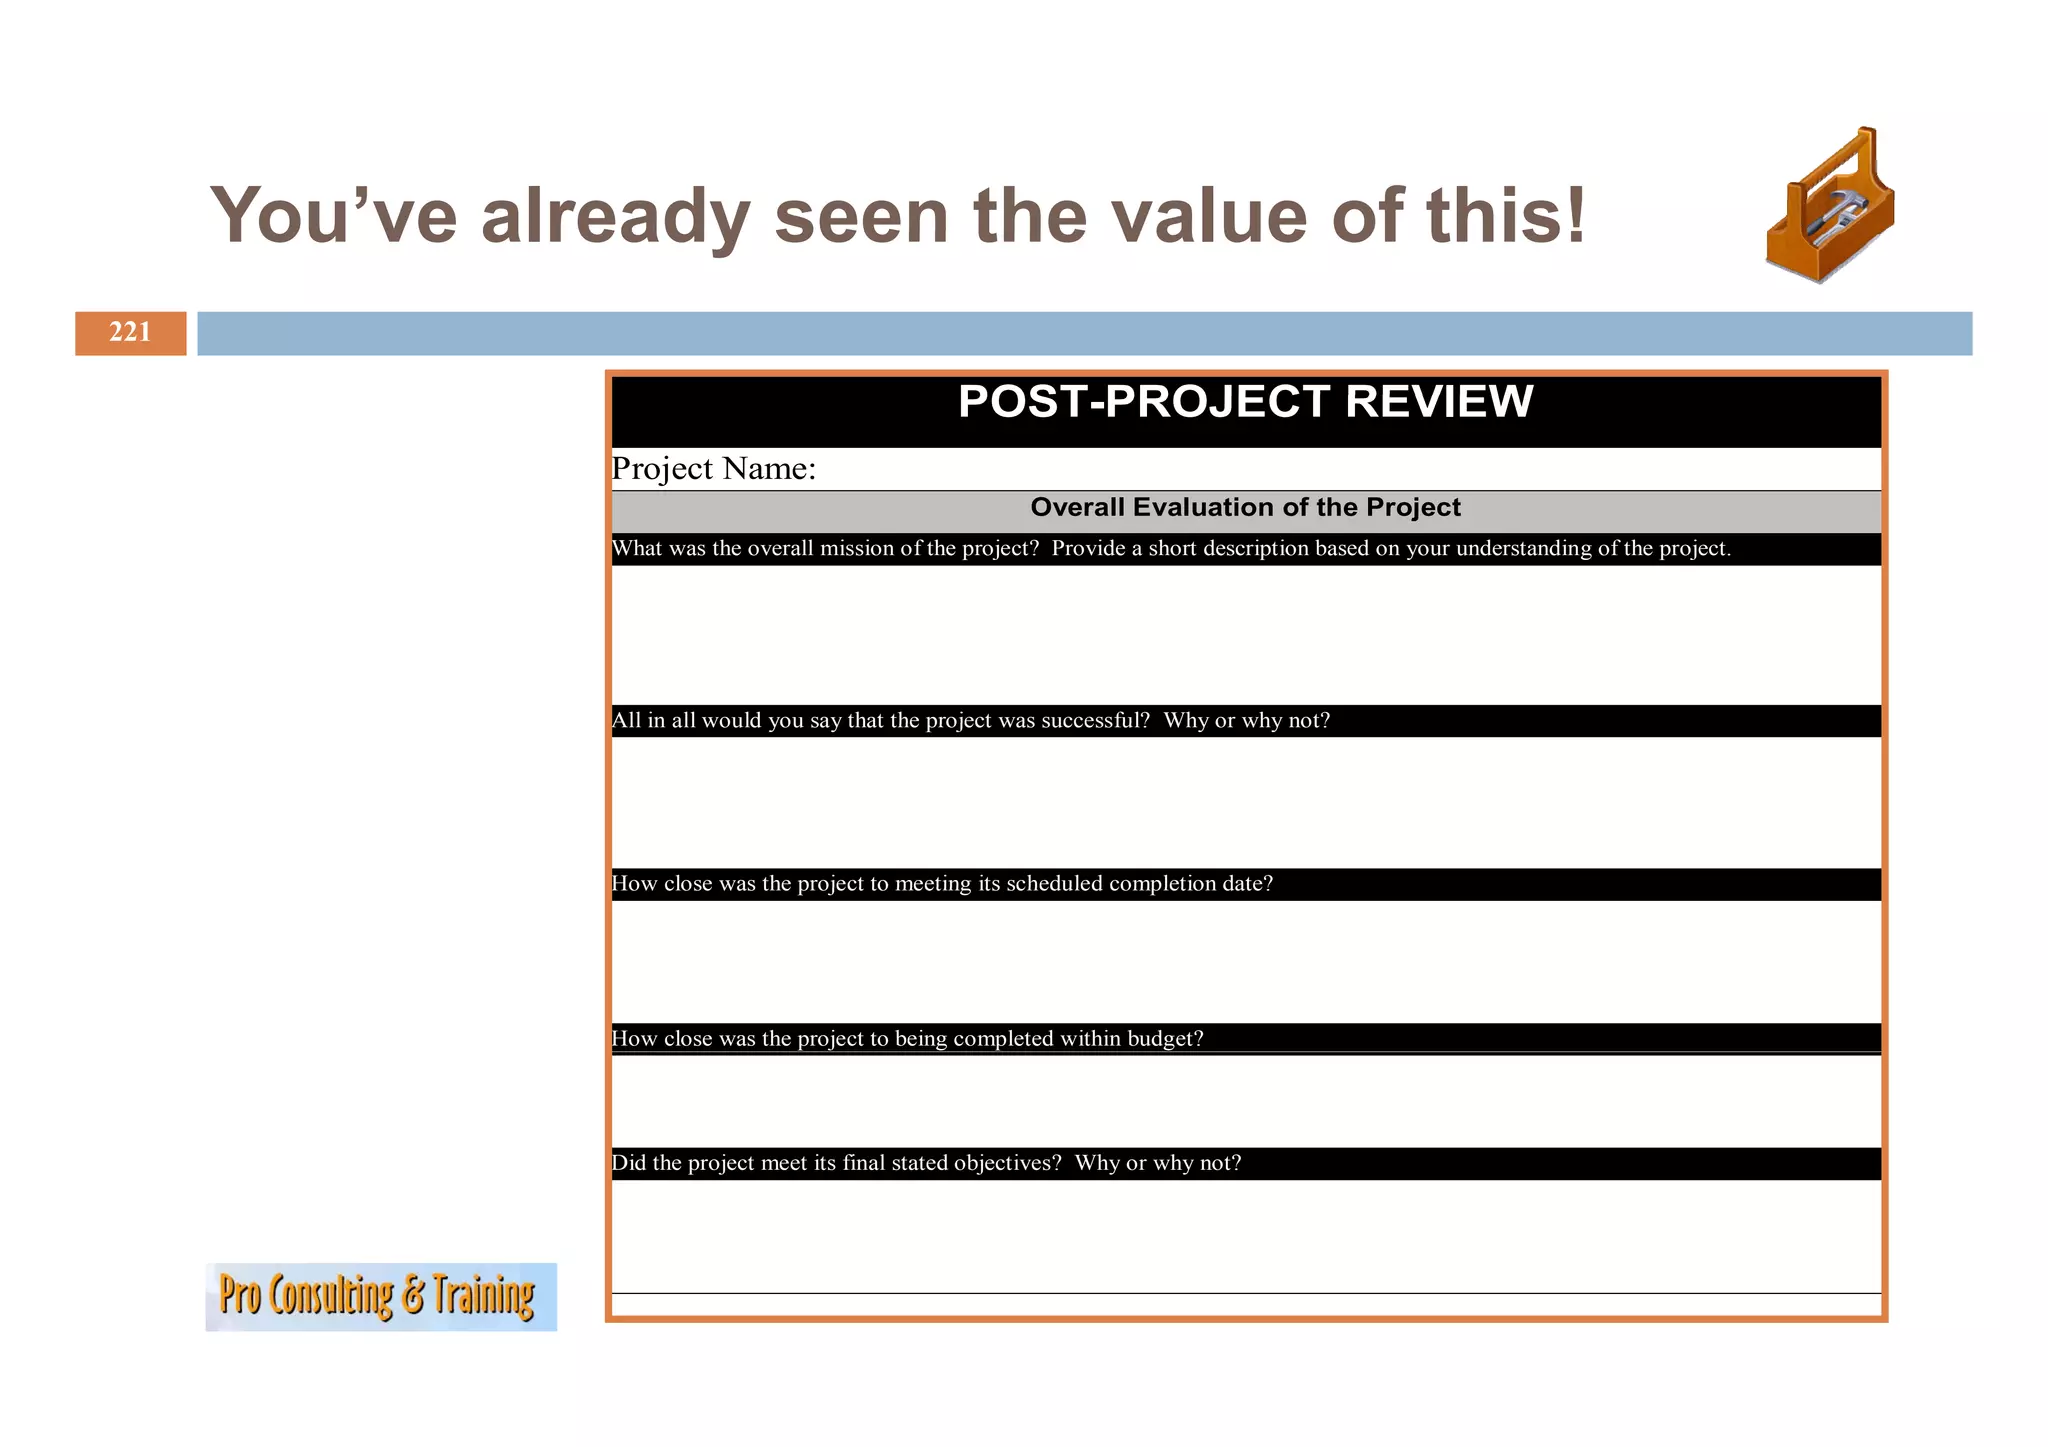
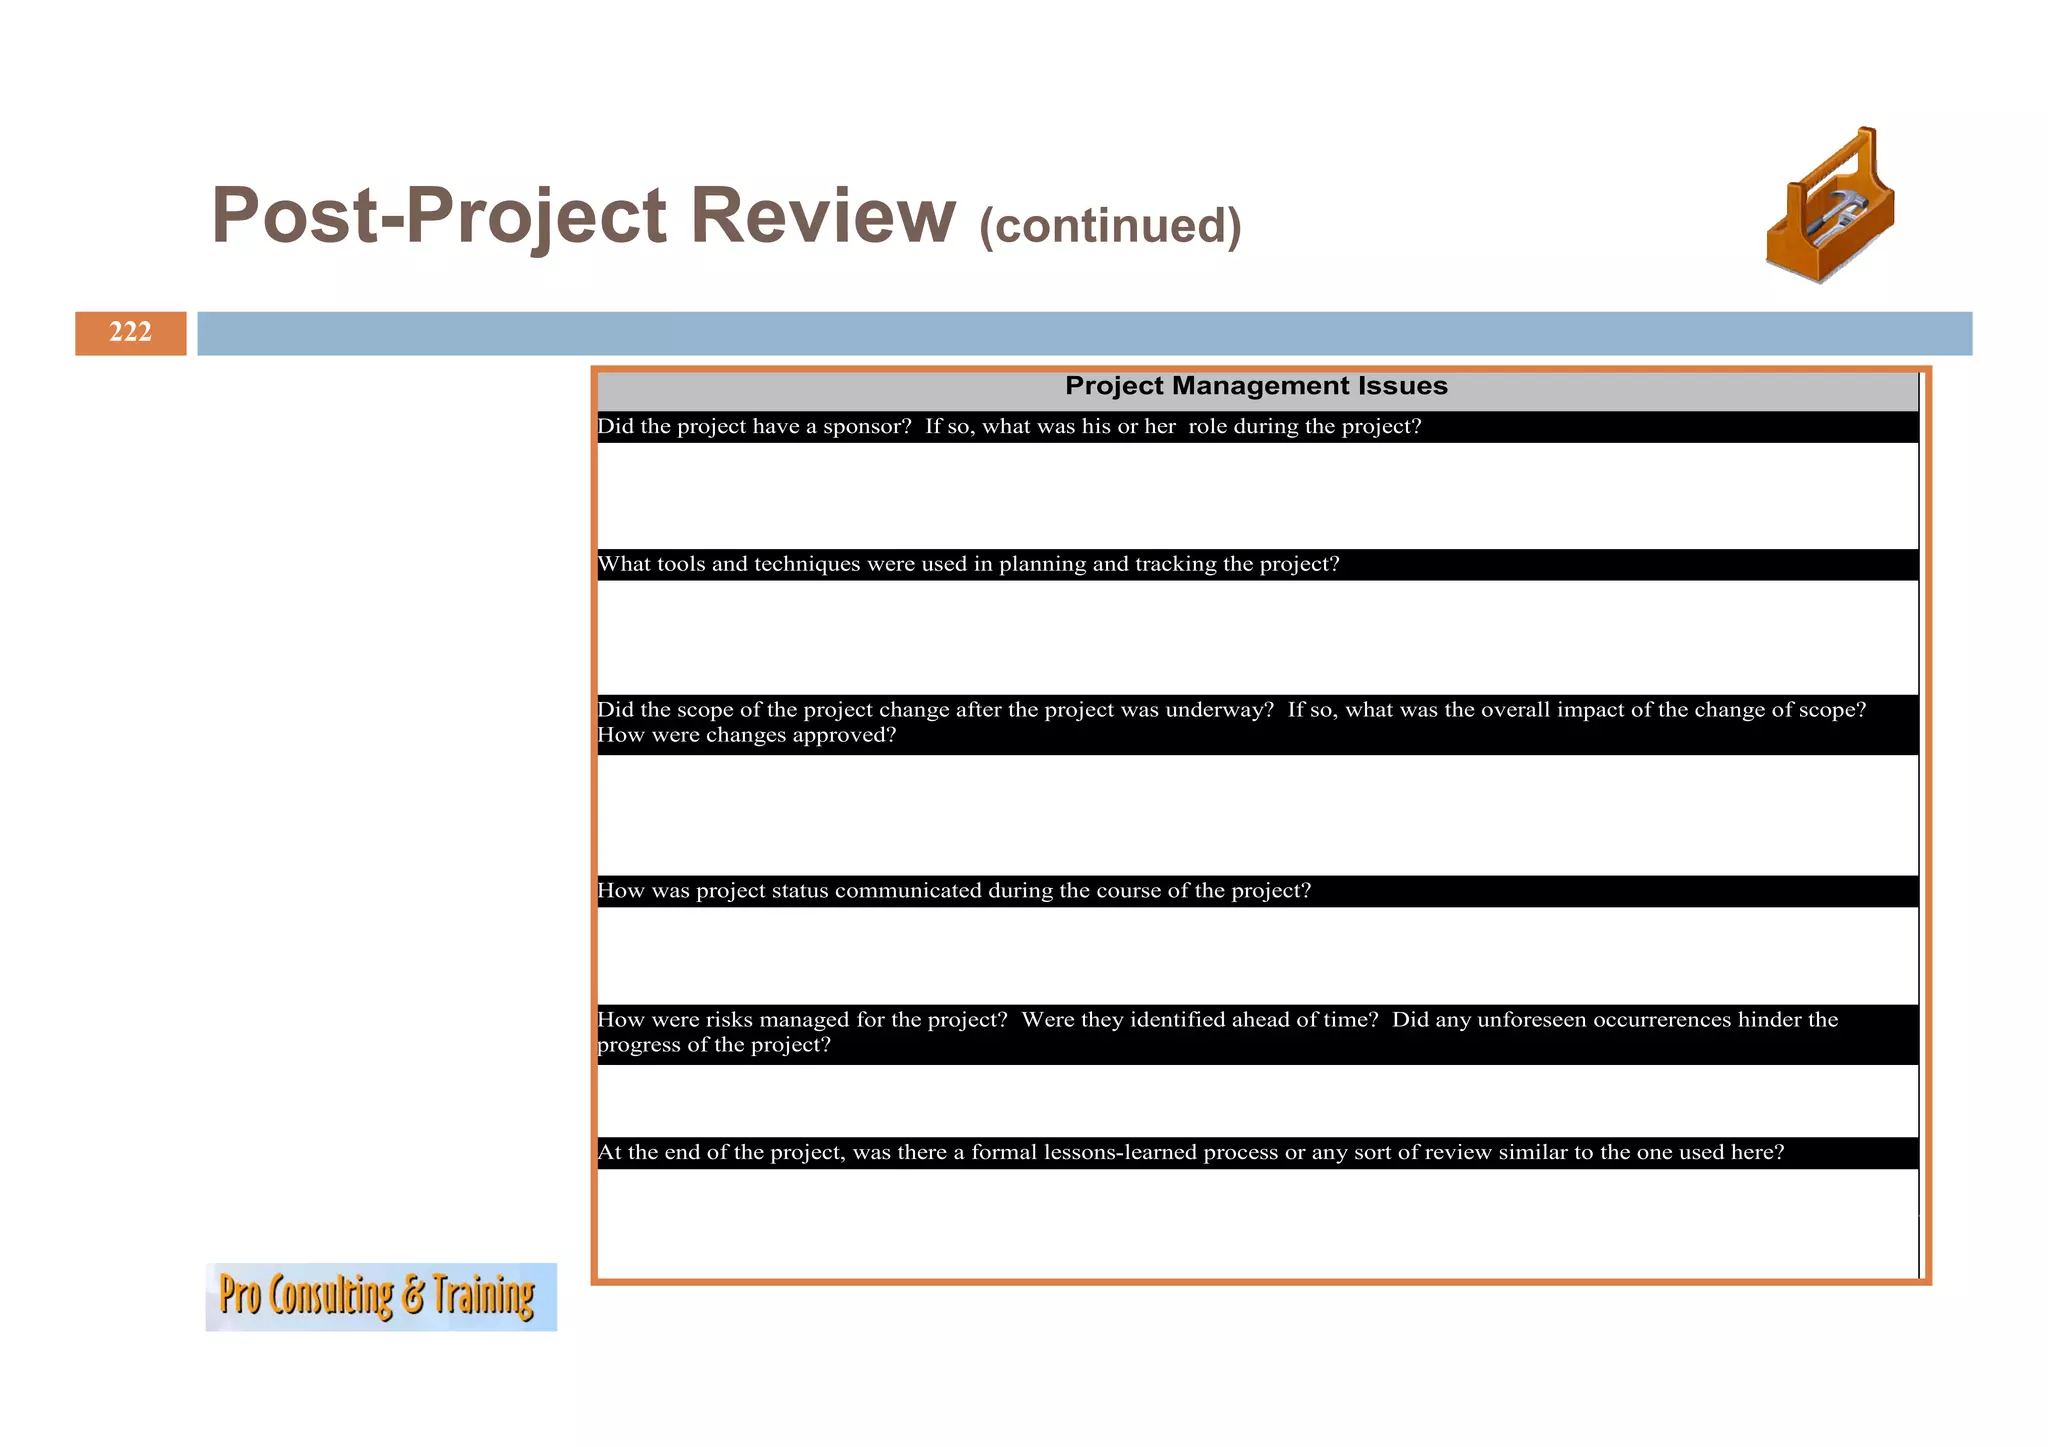
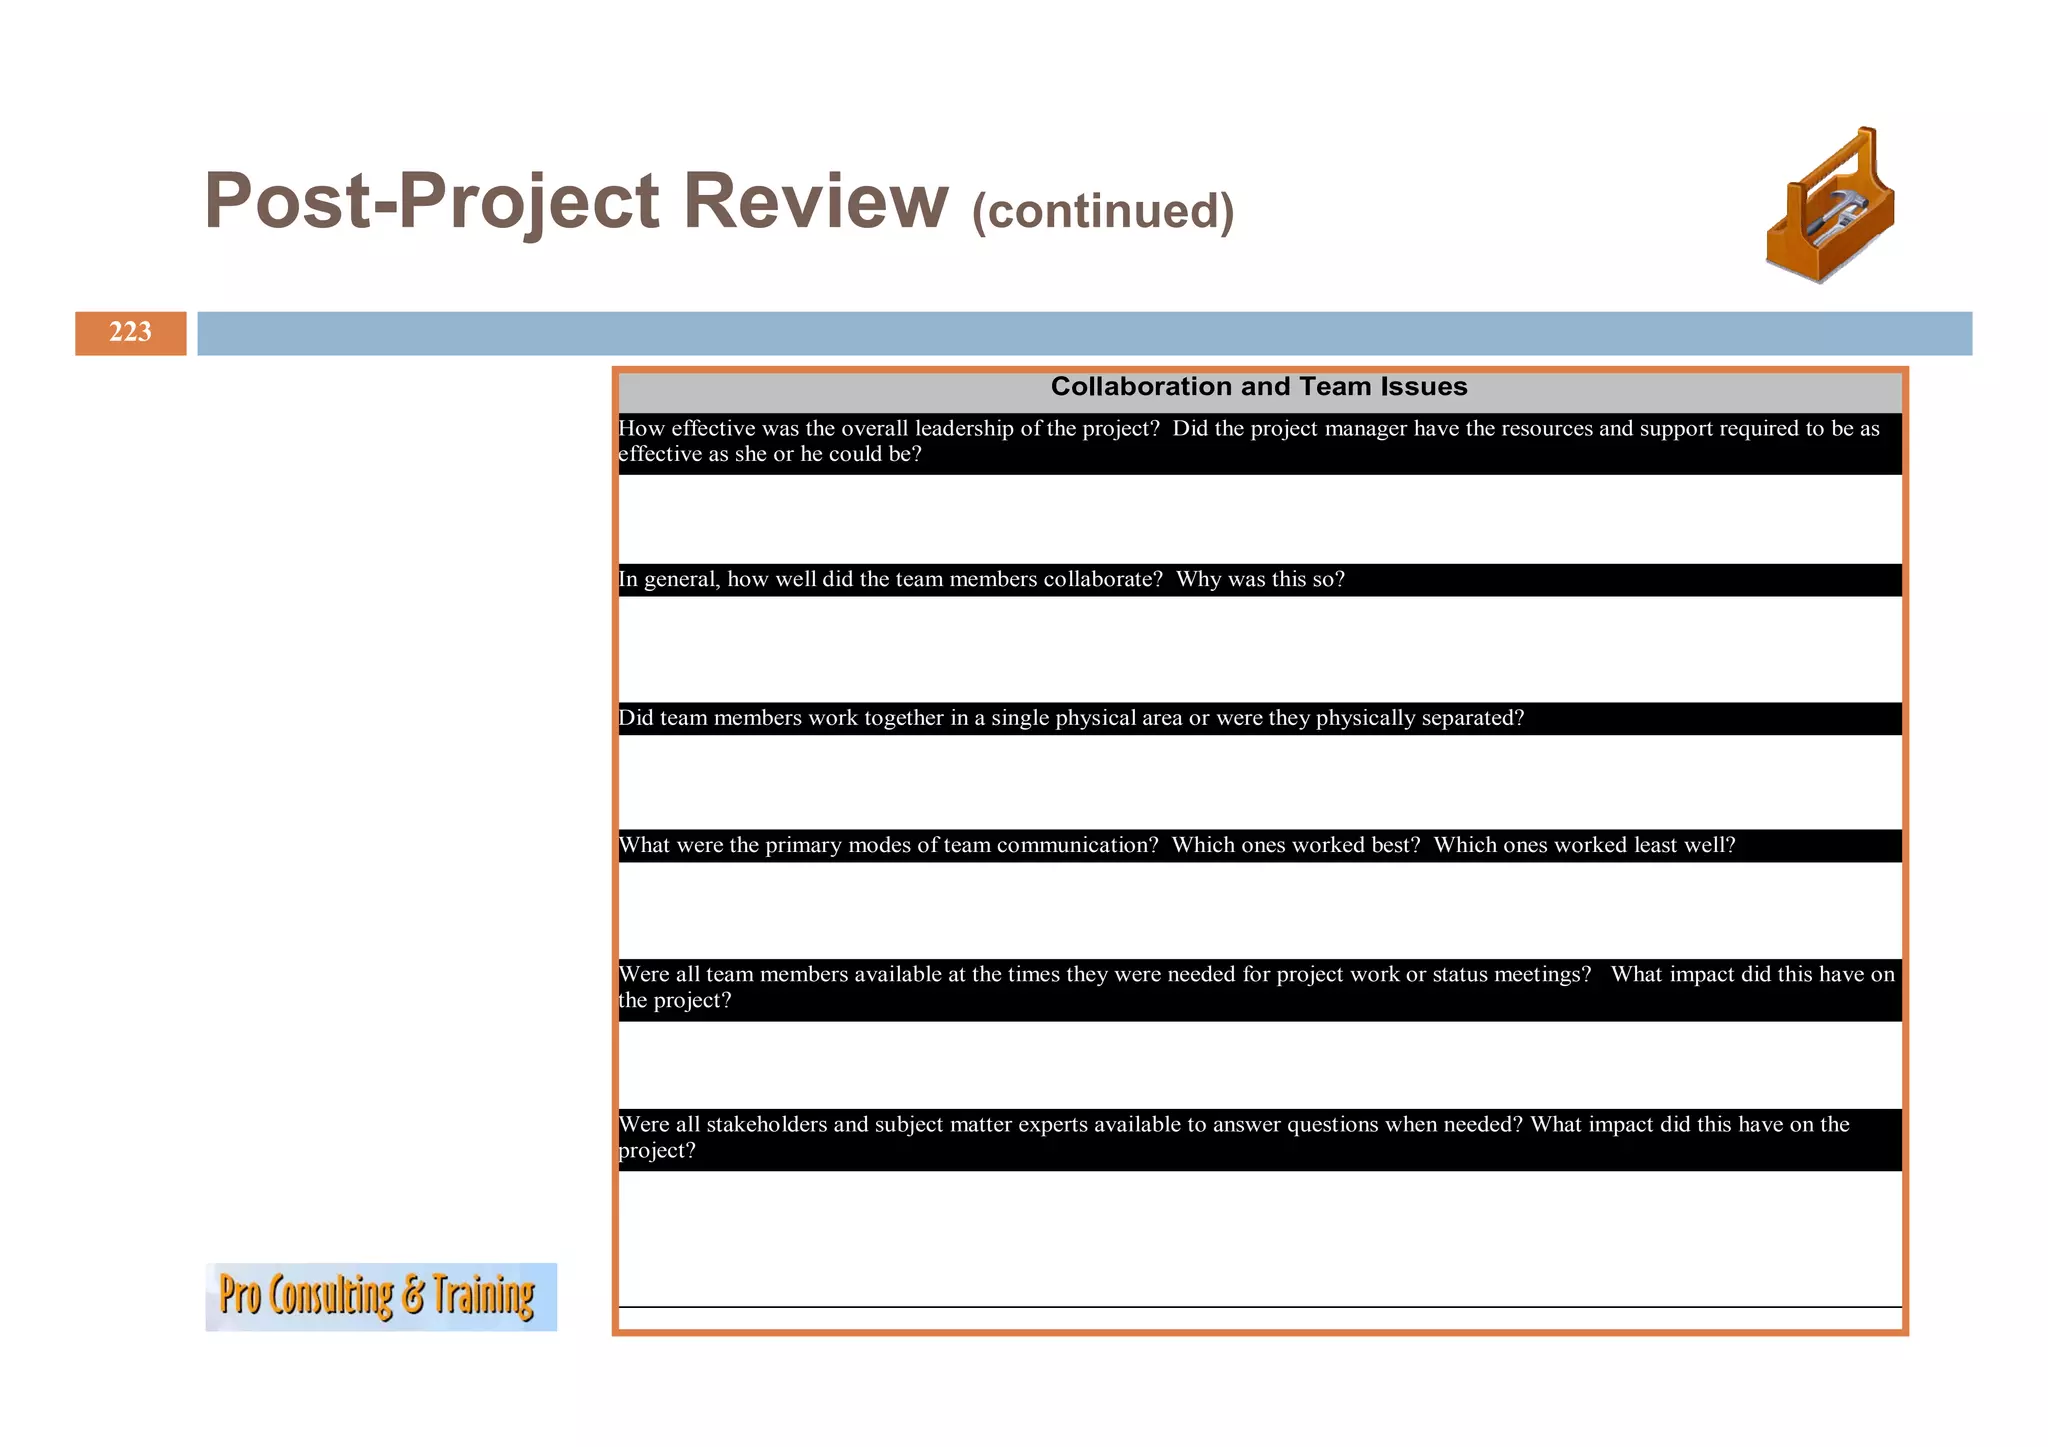
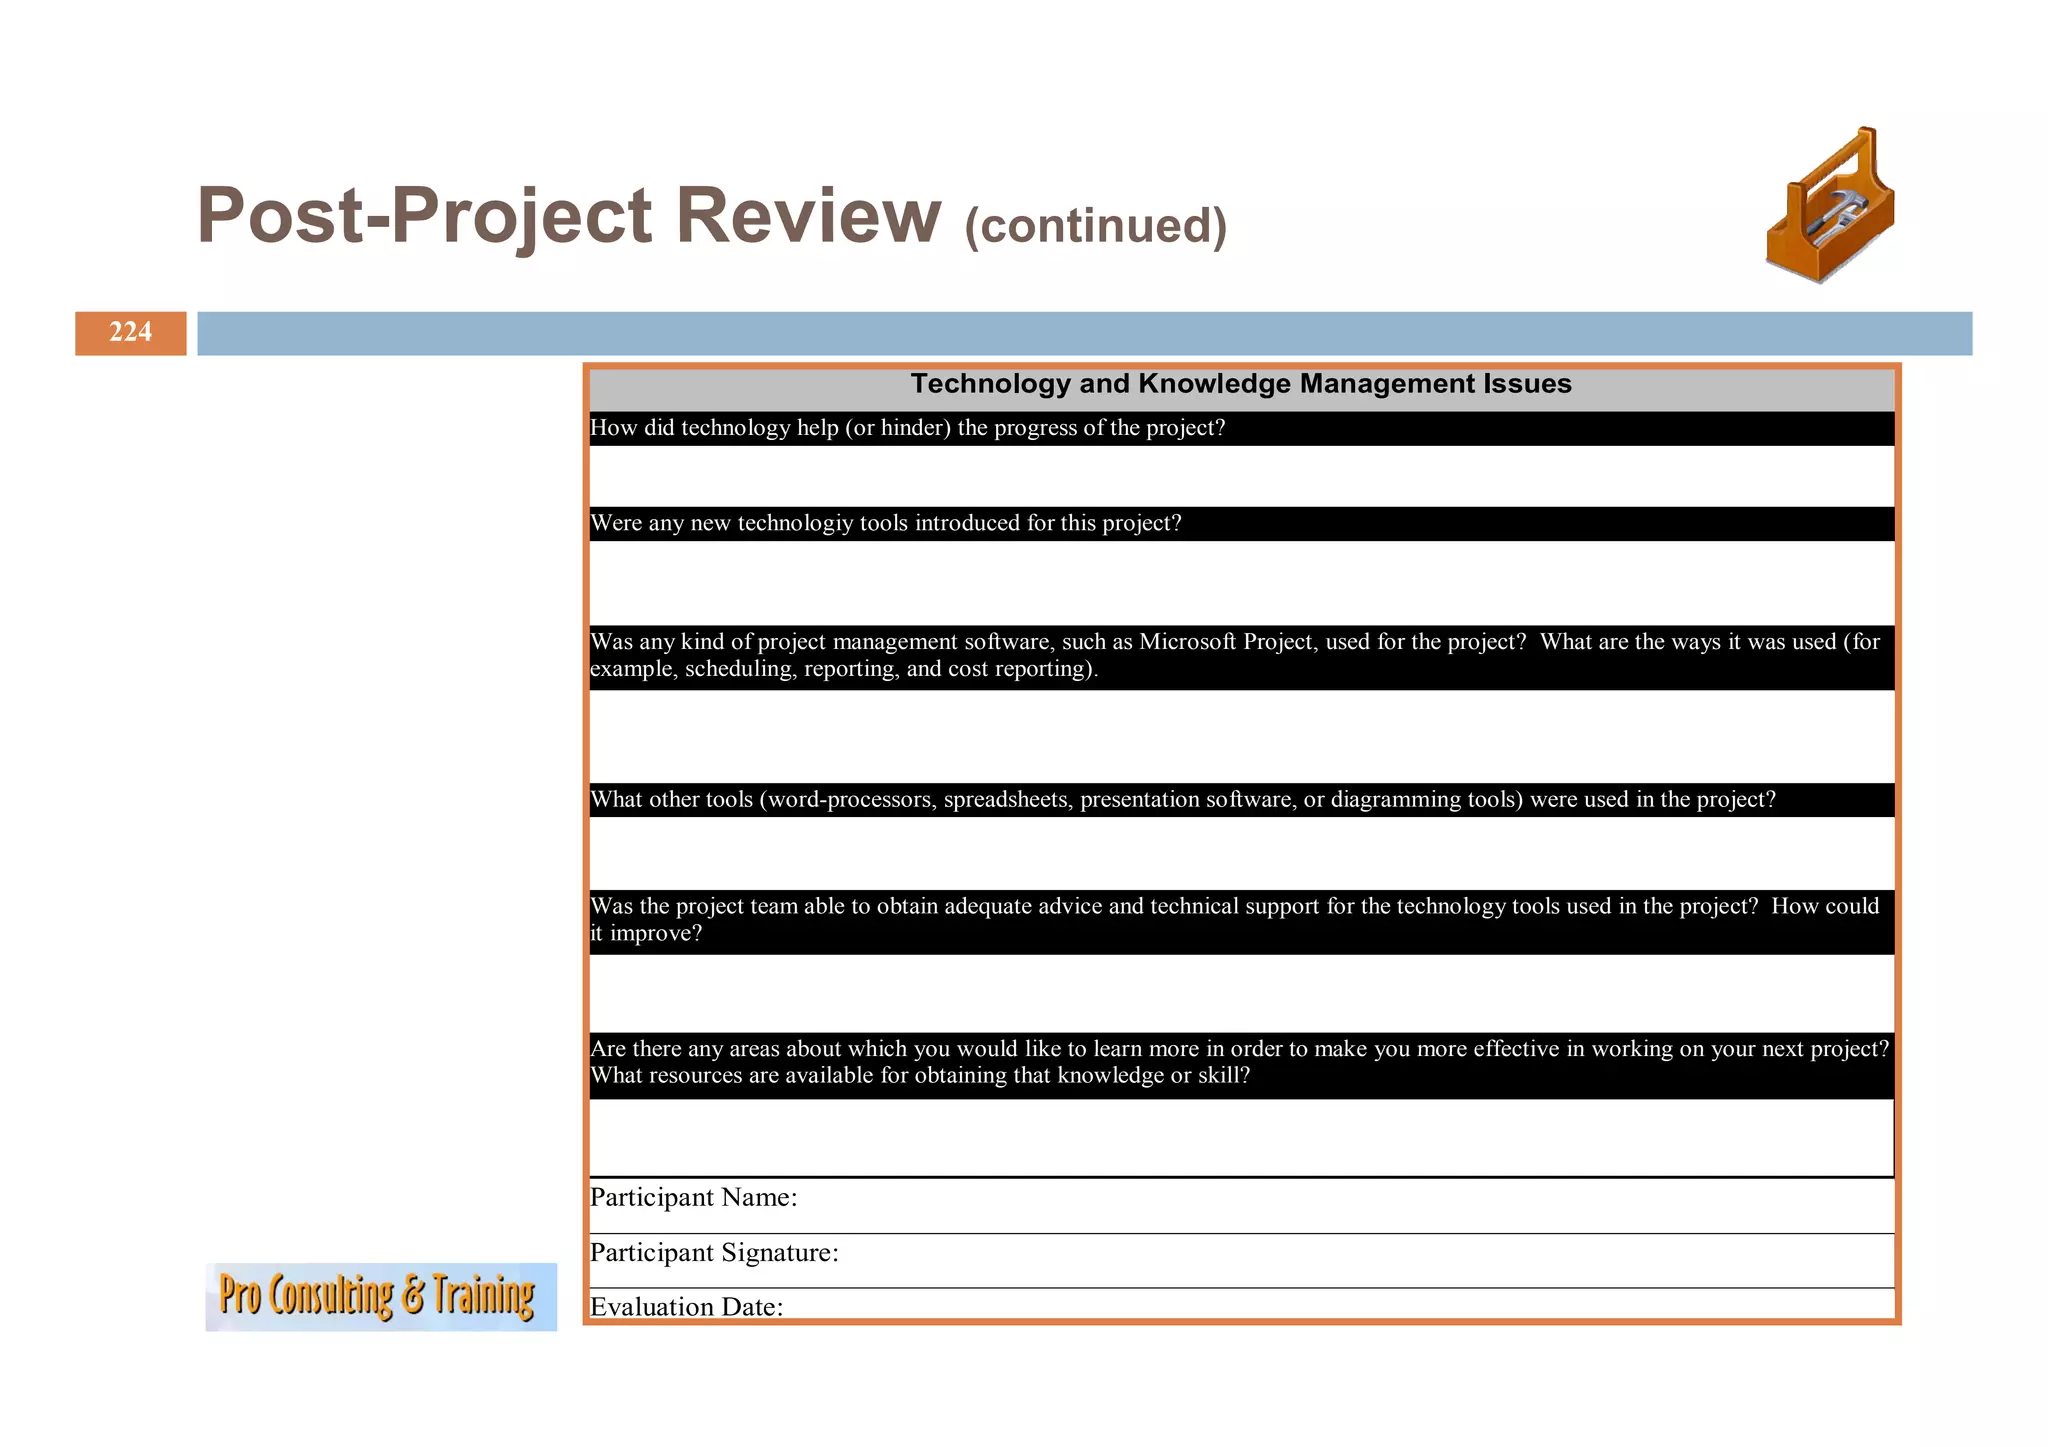
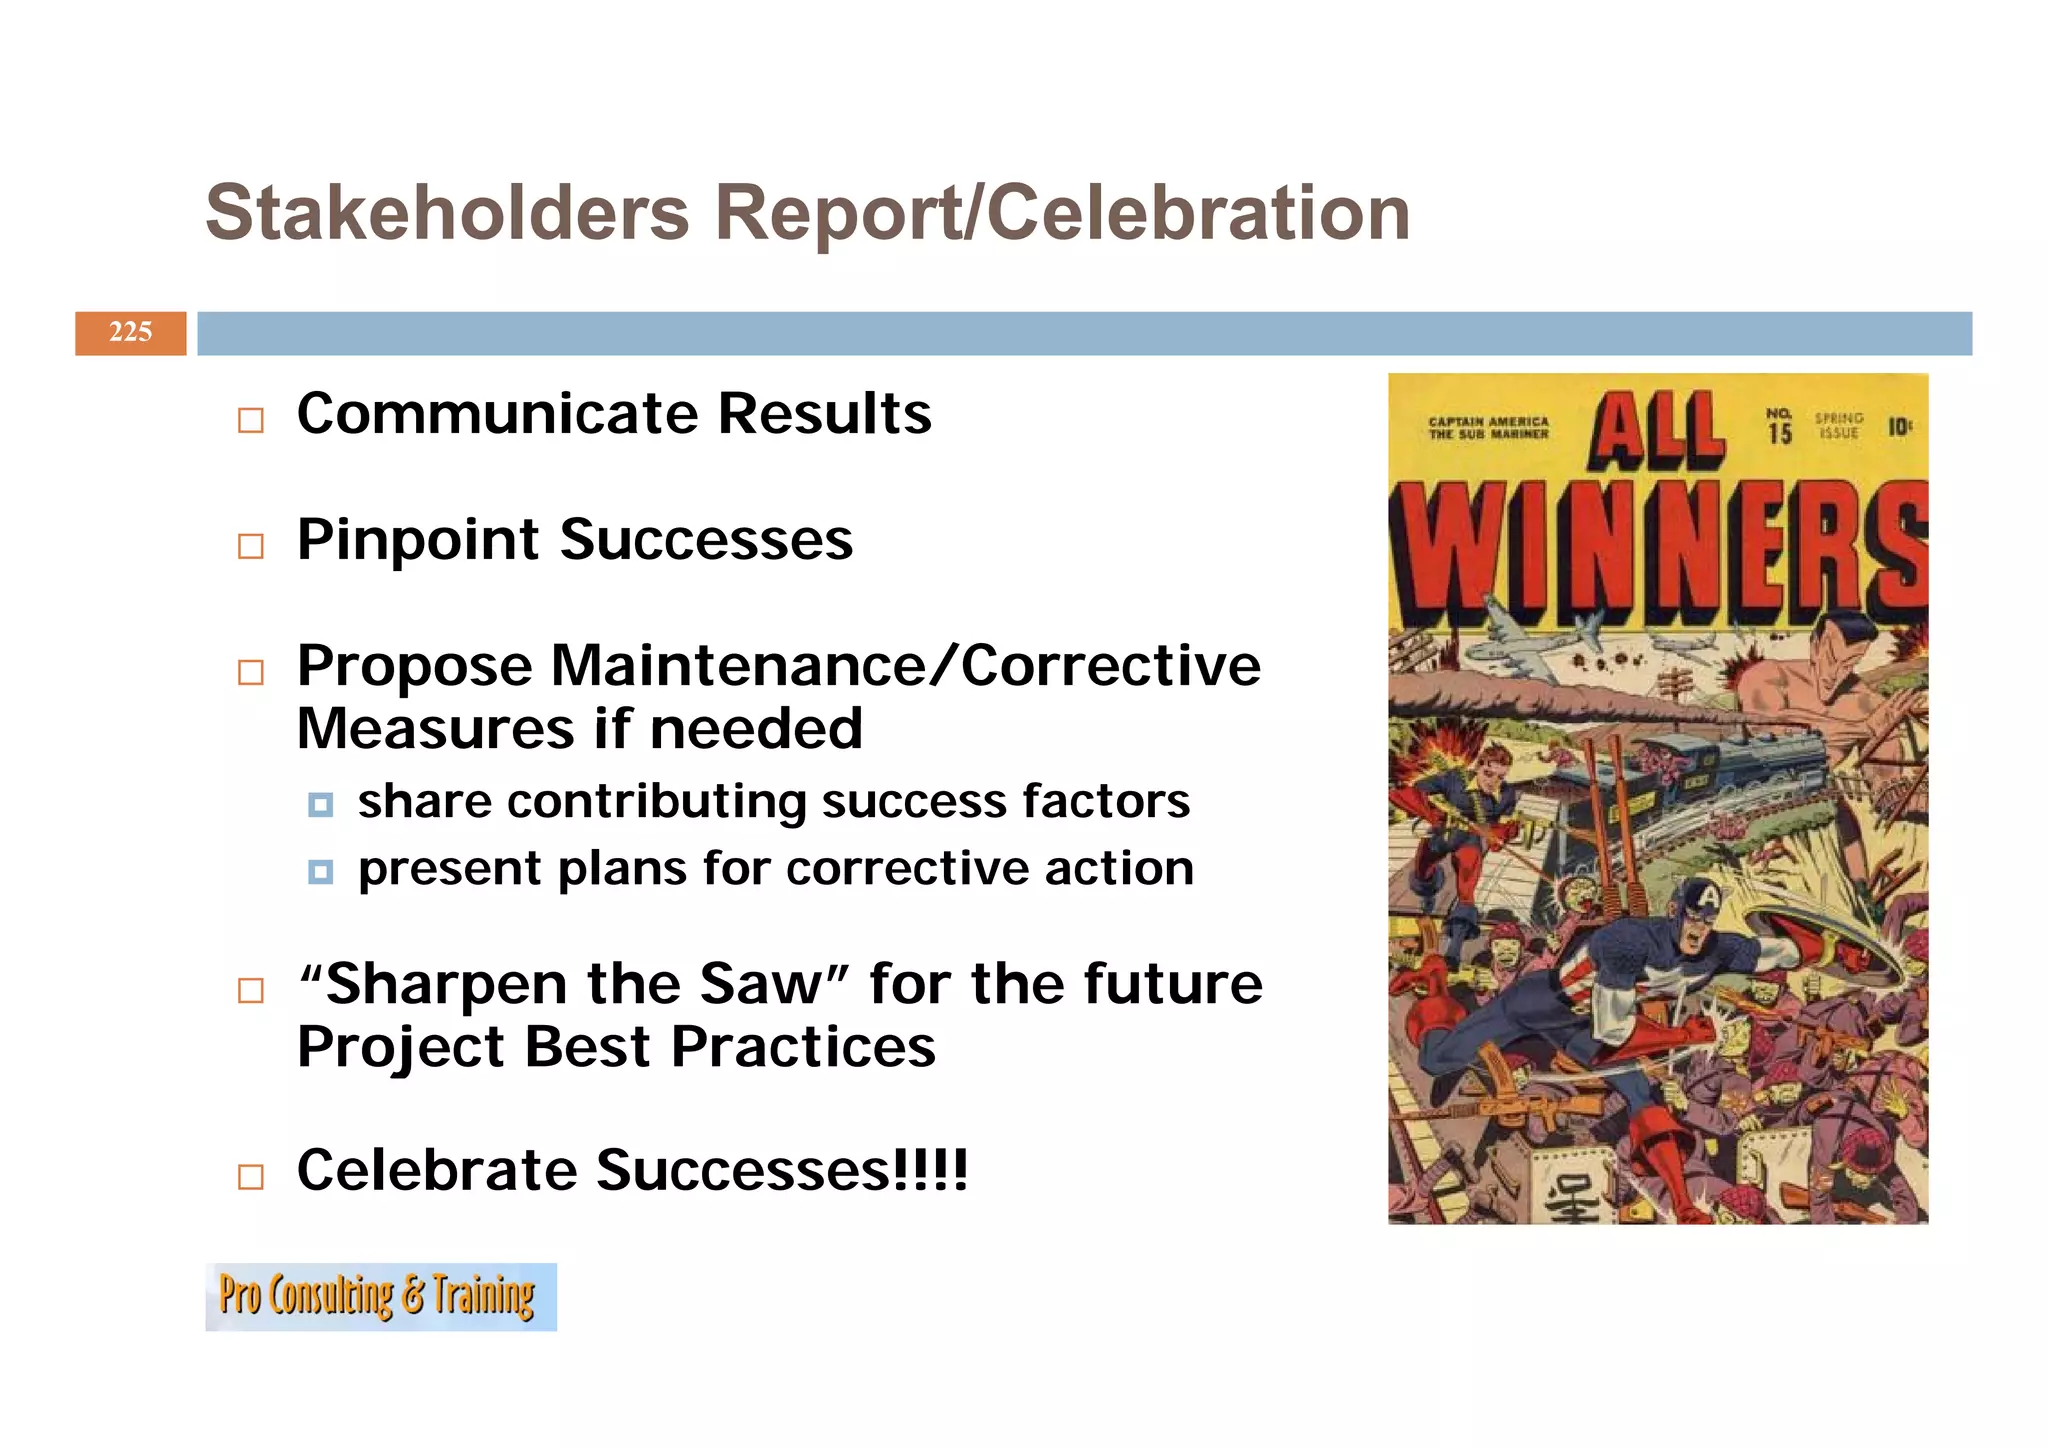
Discussion on best practices in project closing and conducting evaluations.
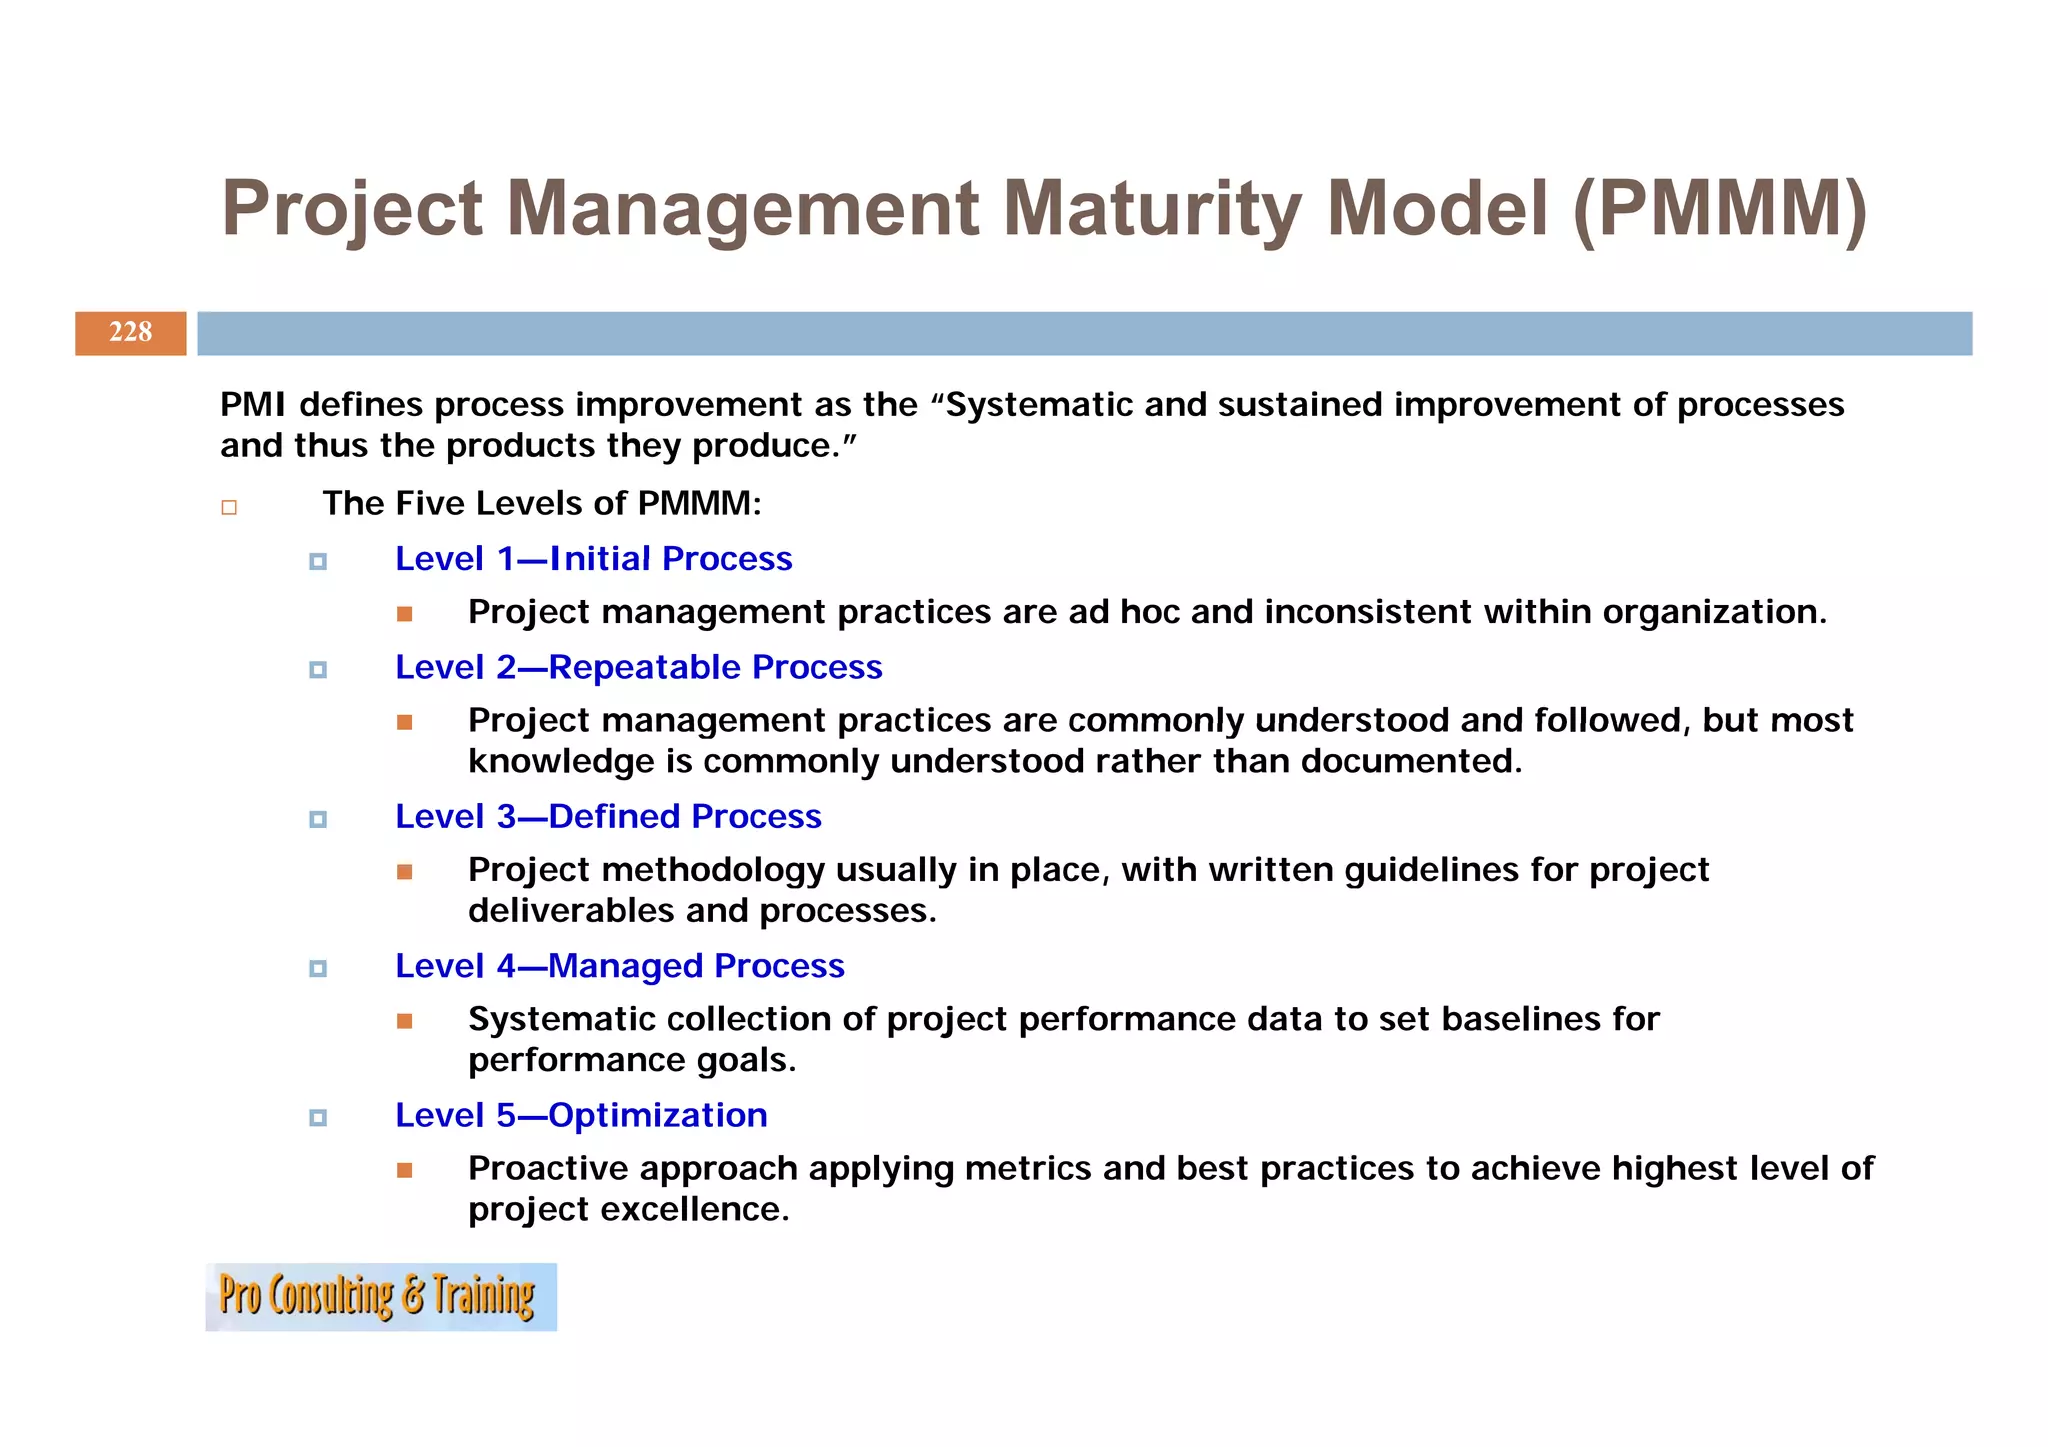
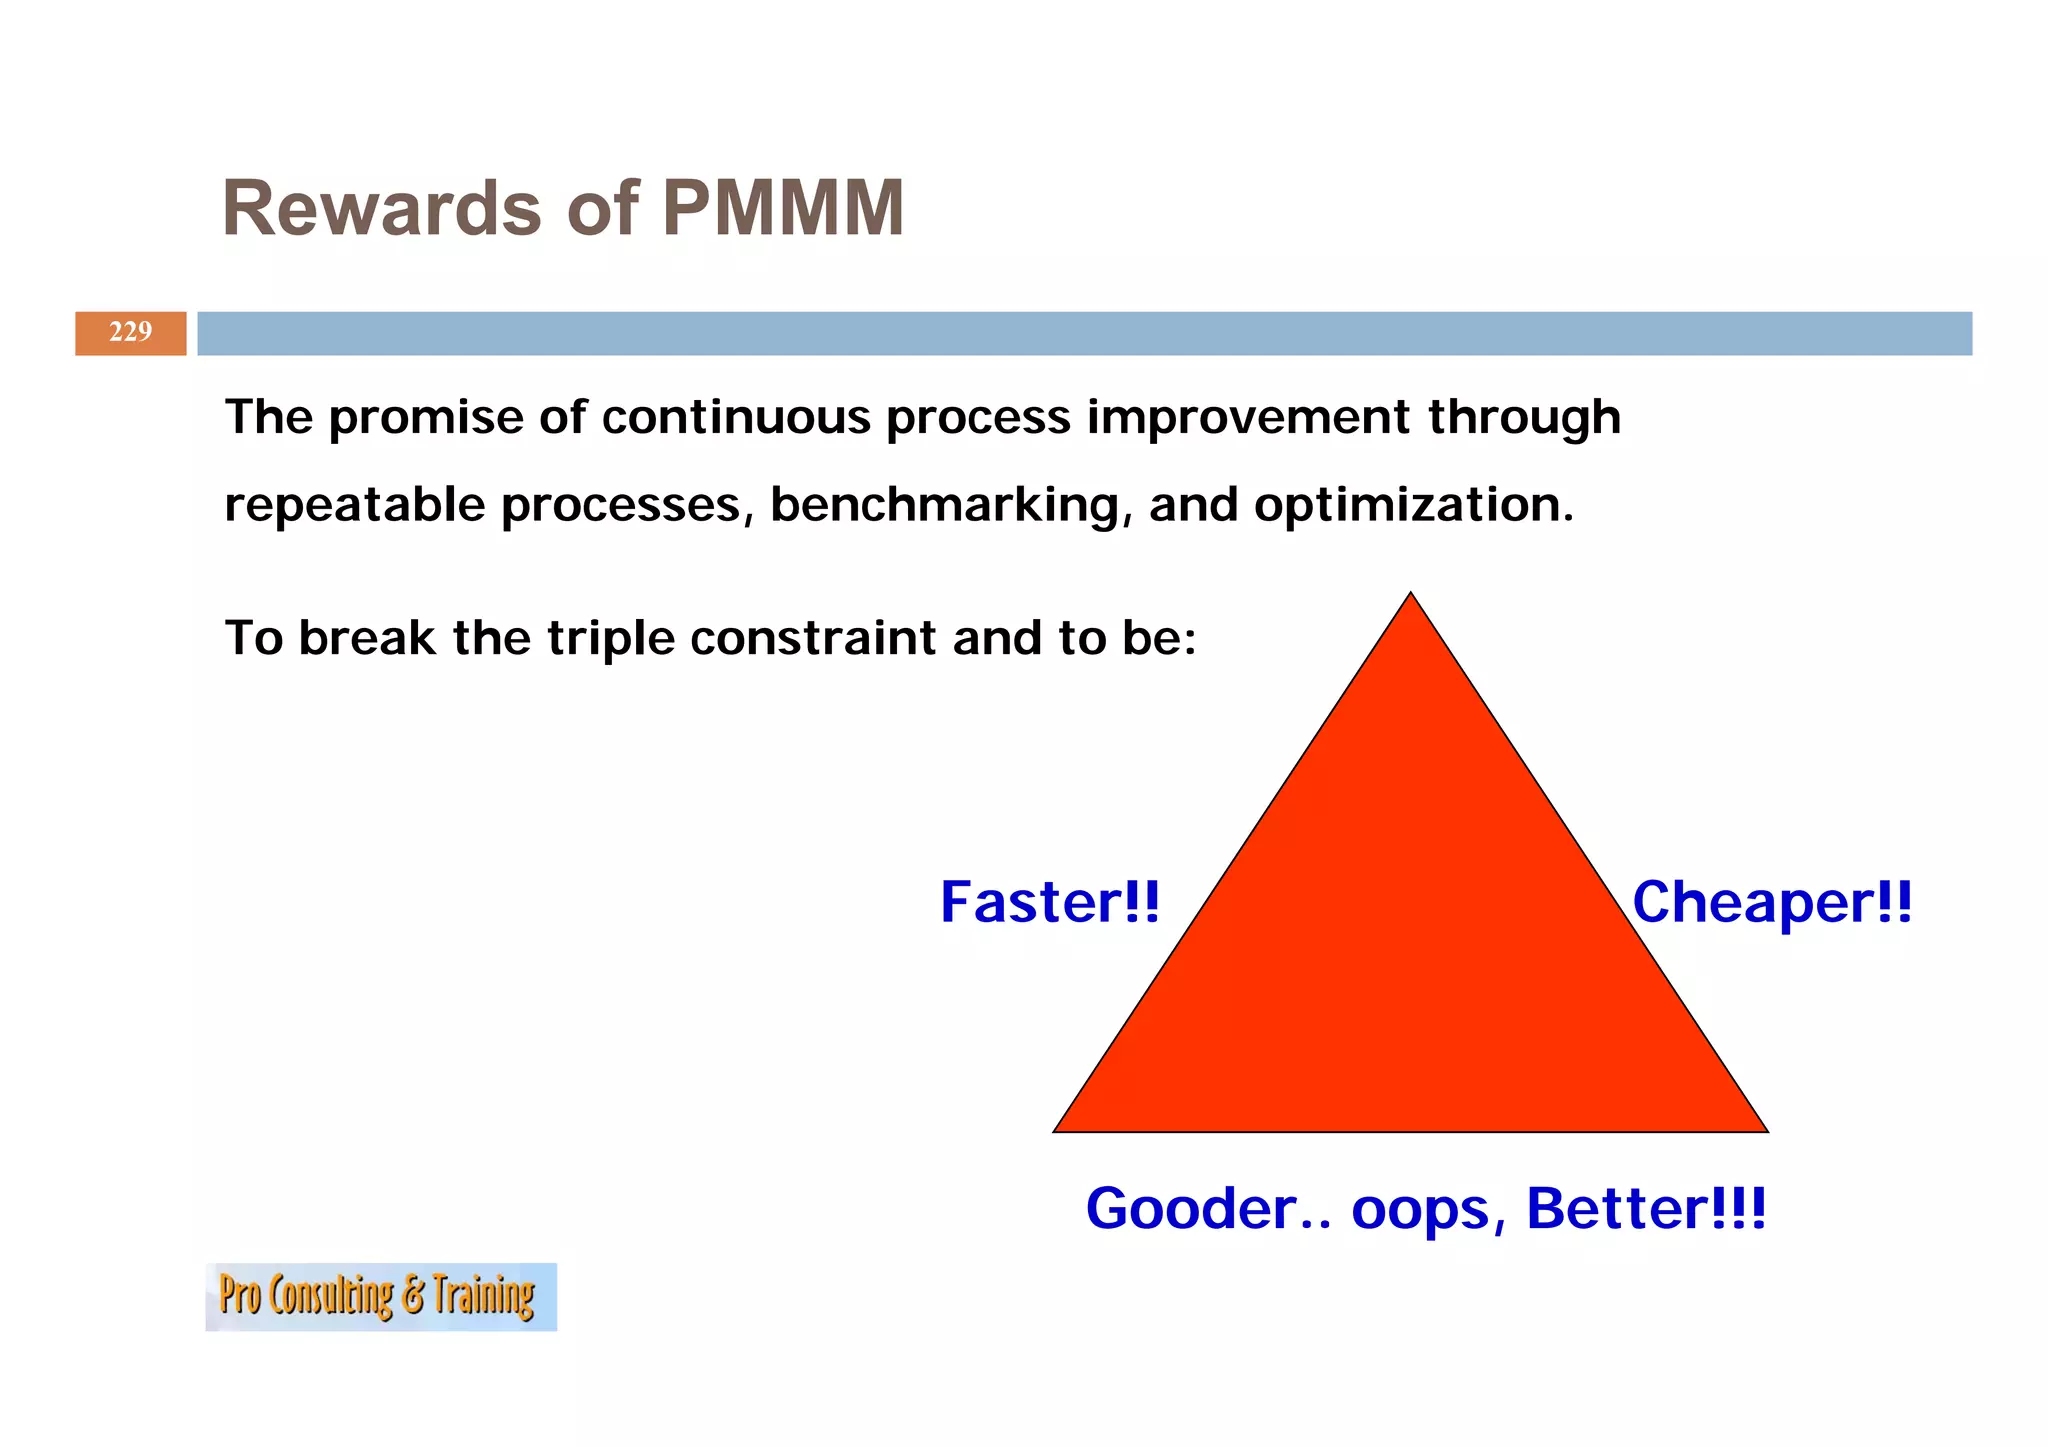
The stages of the Project Management Maturity Model with a focus on continuous improvement.
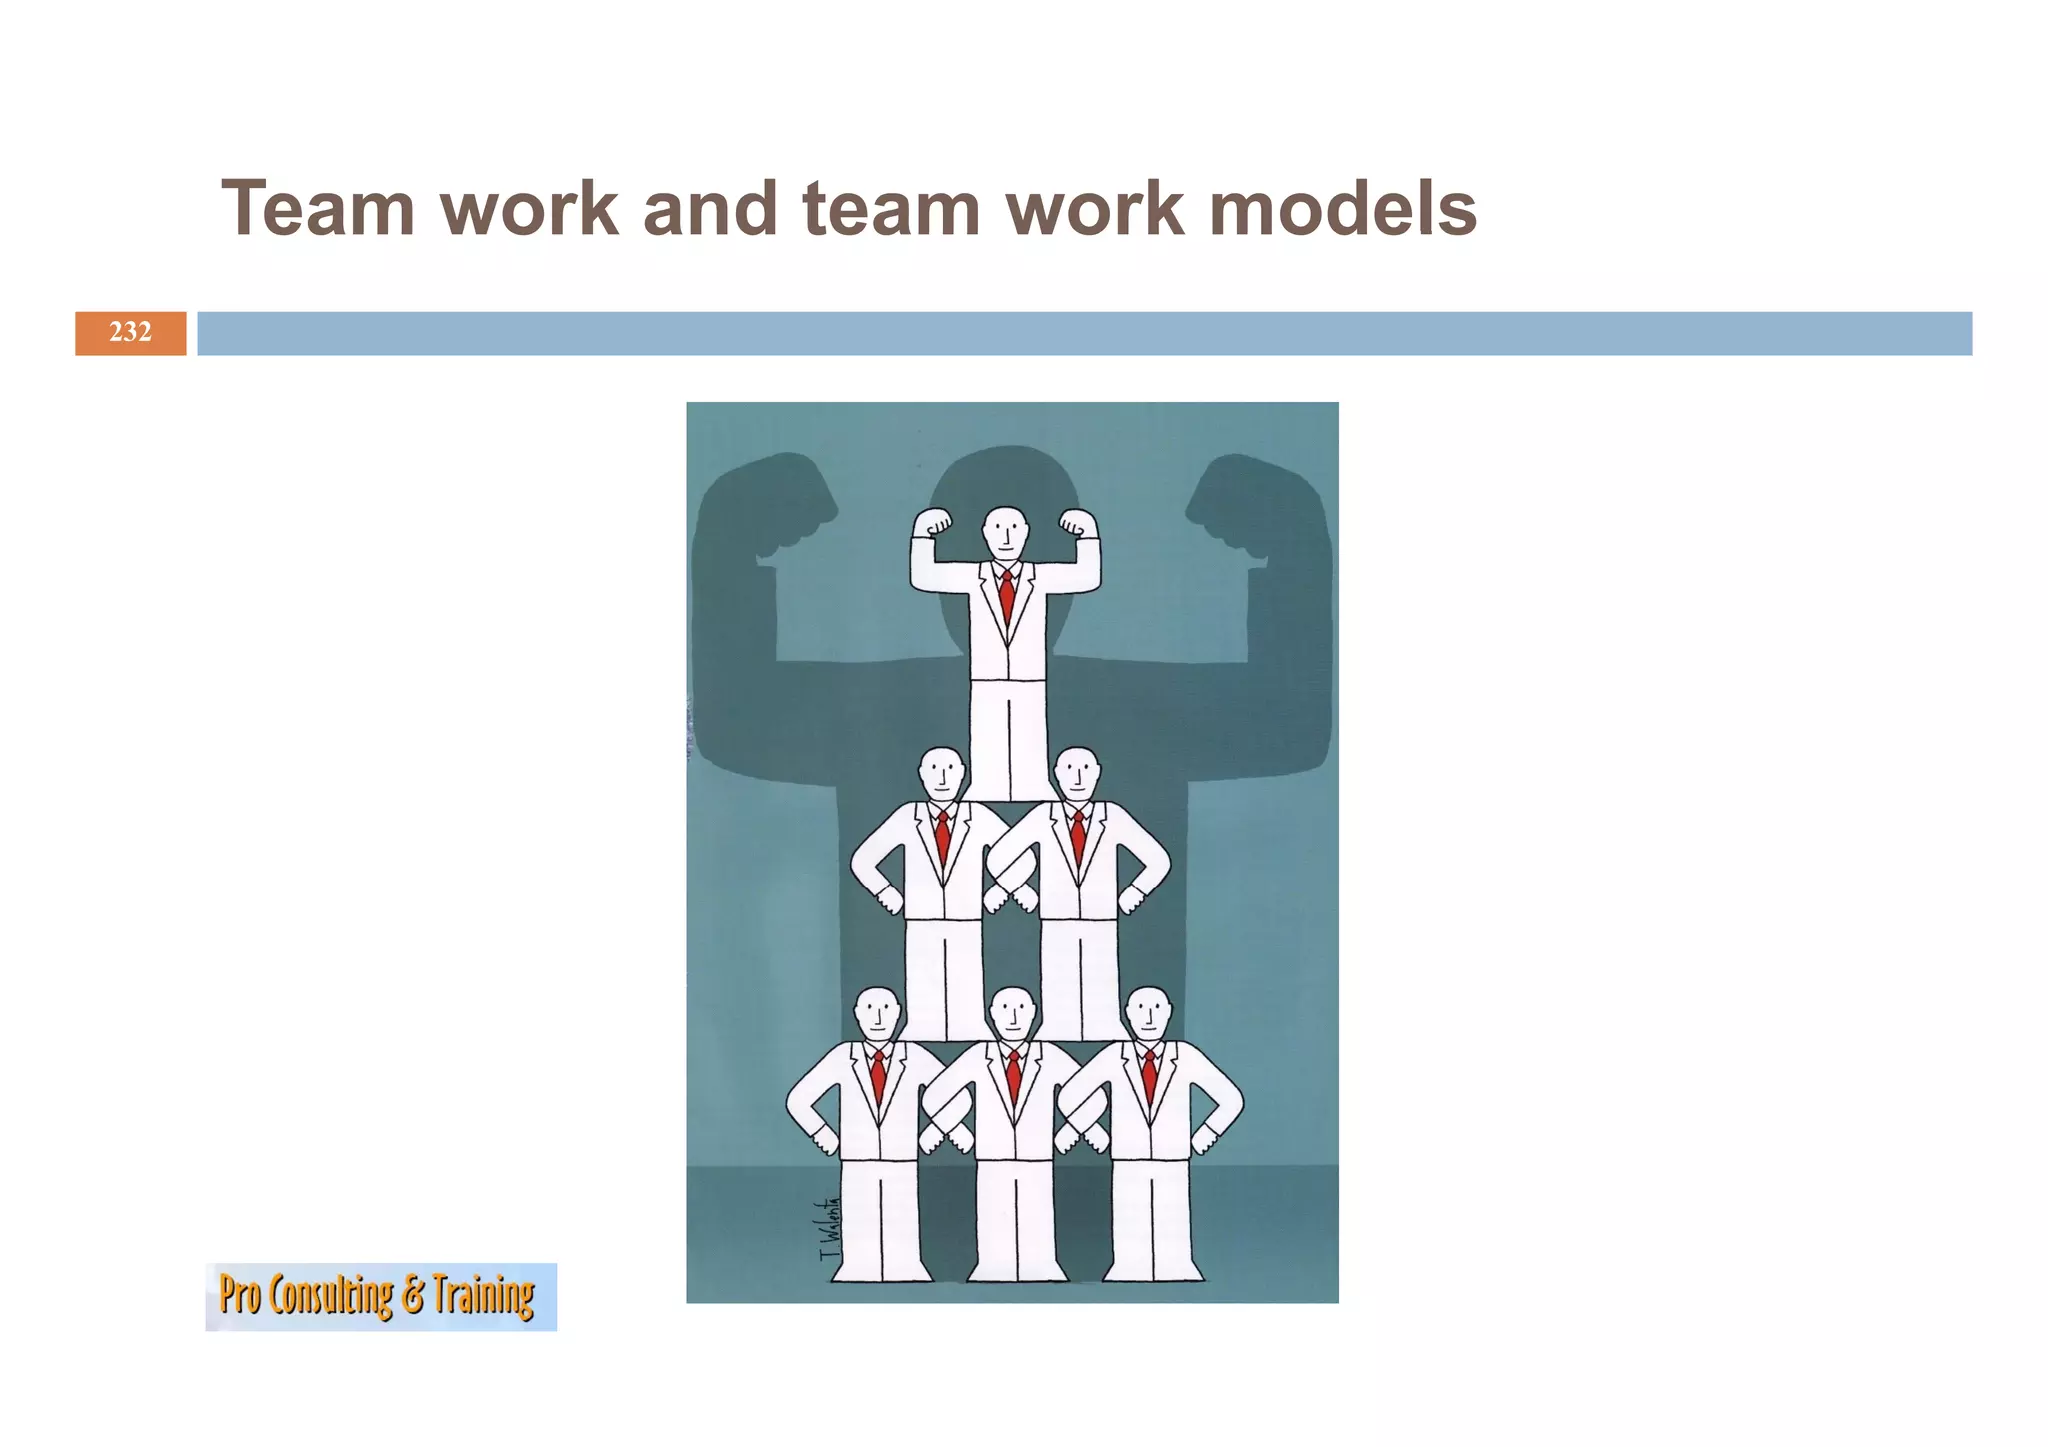
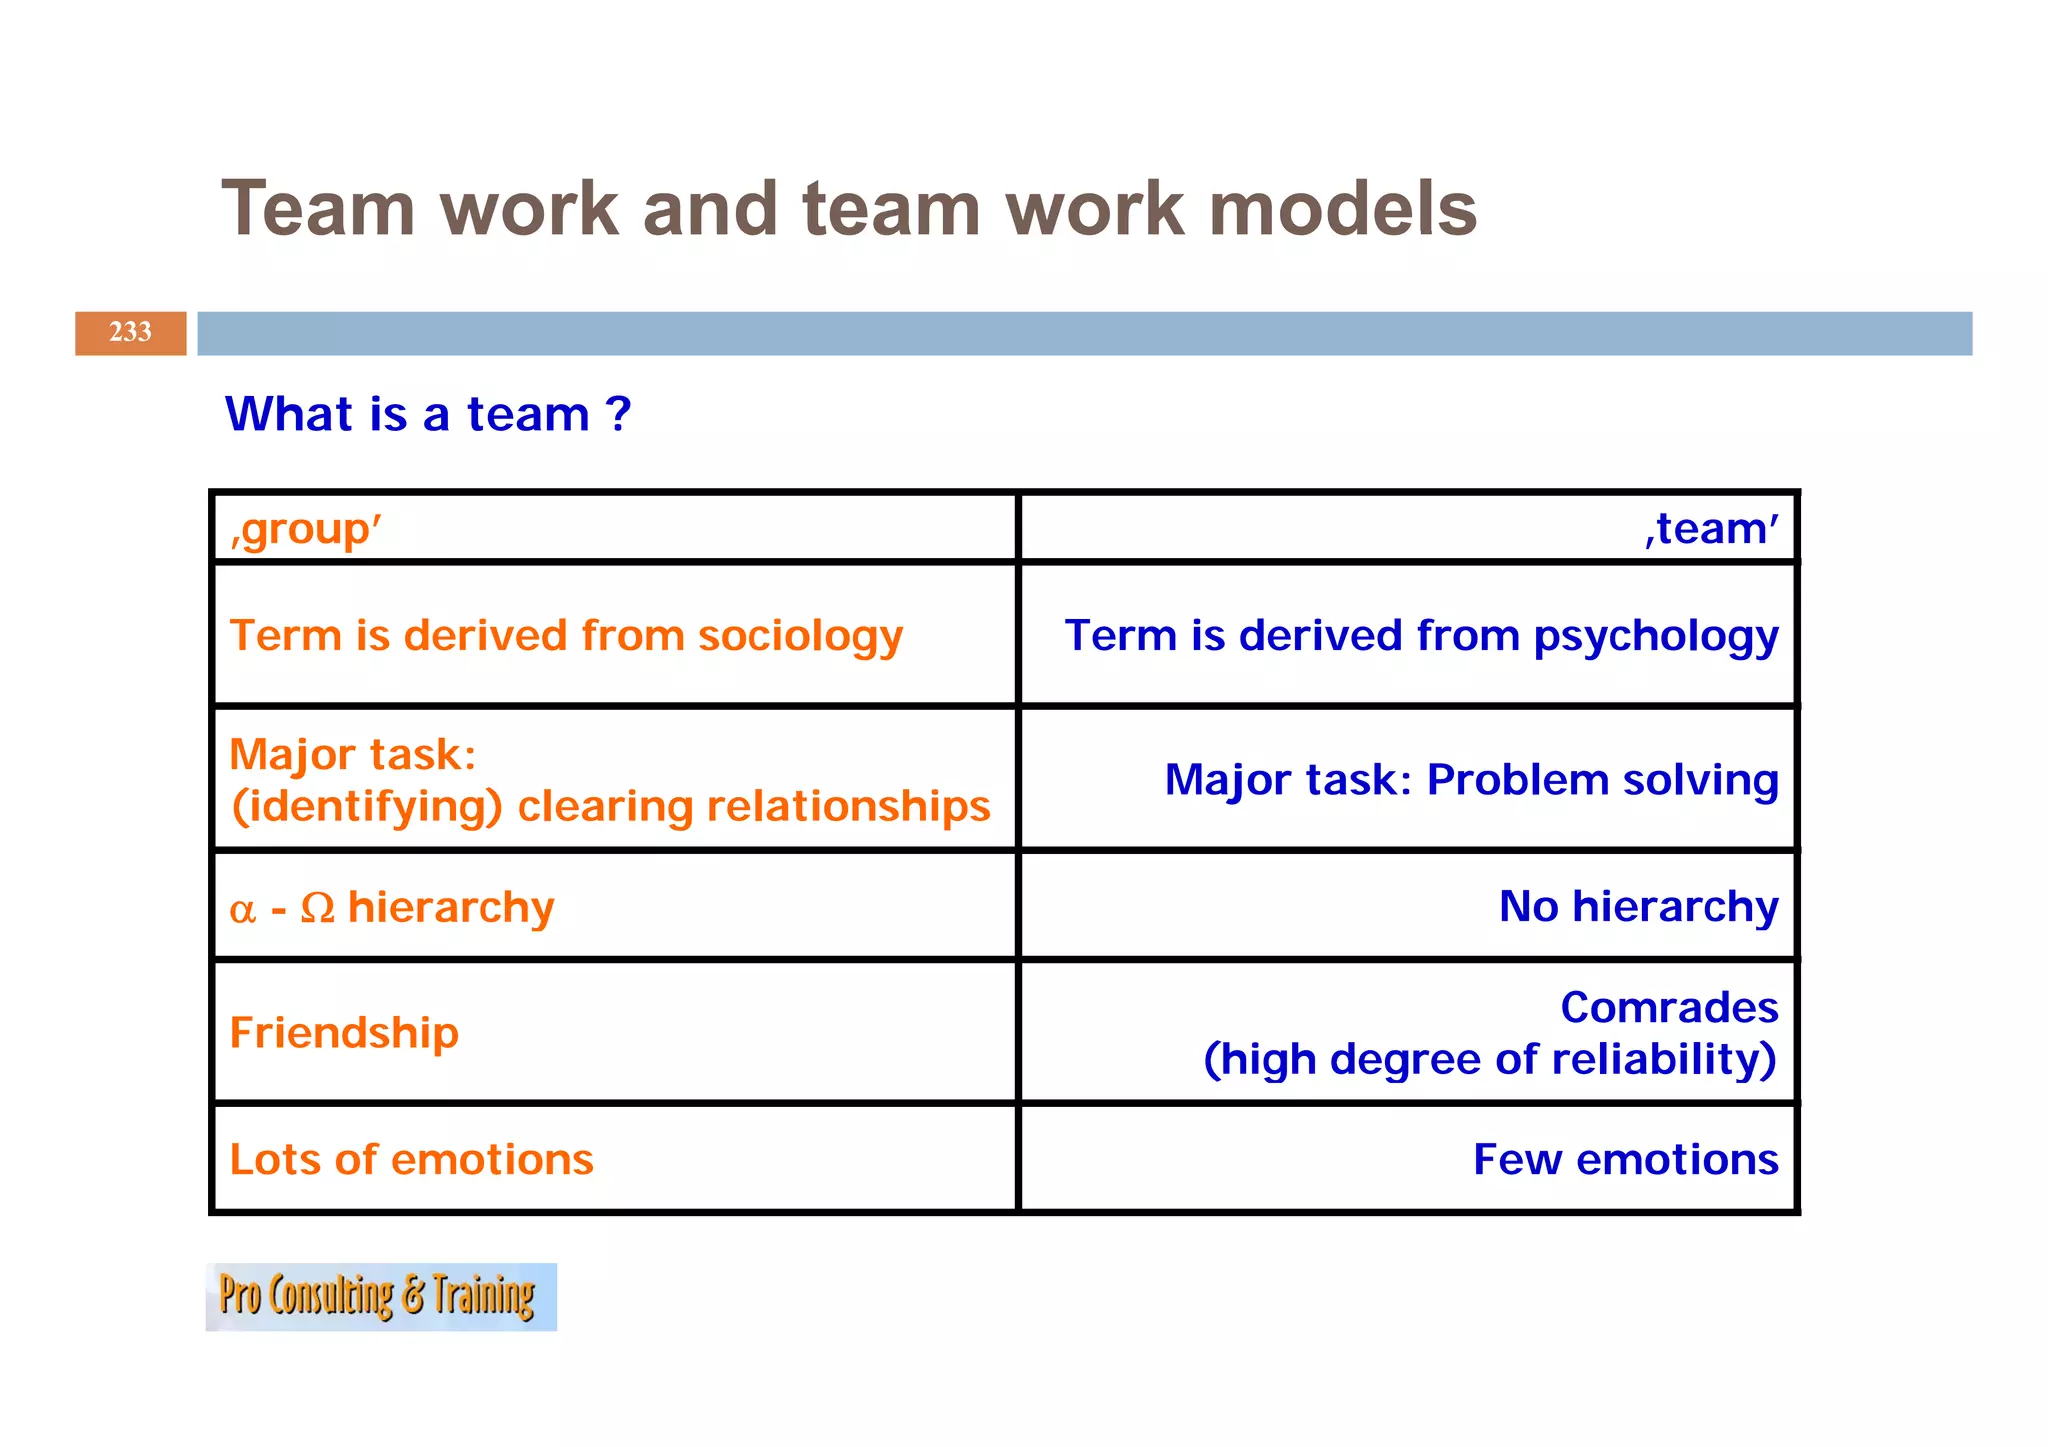
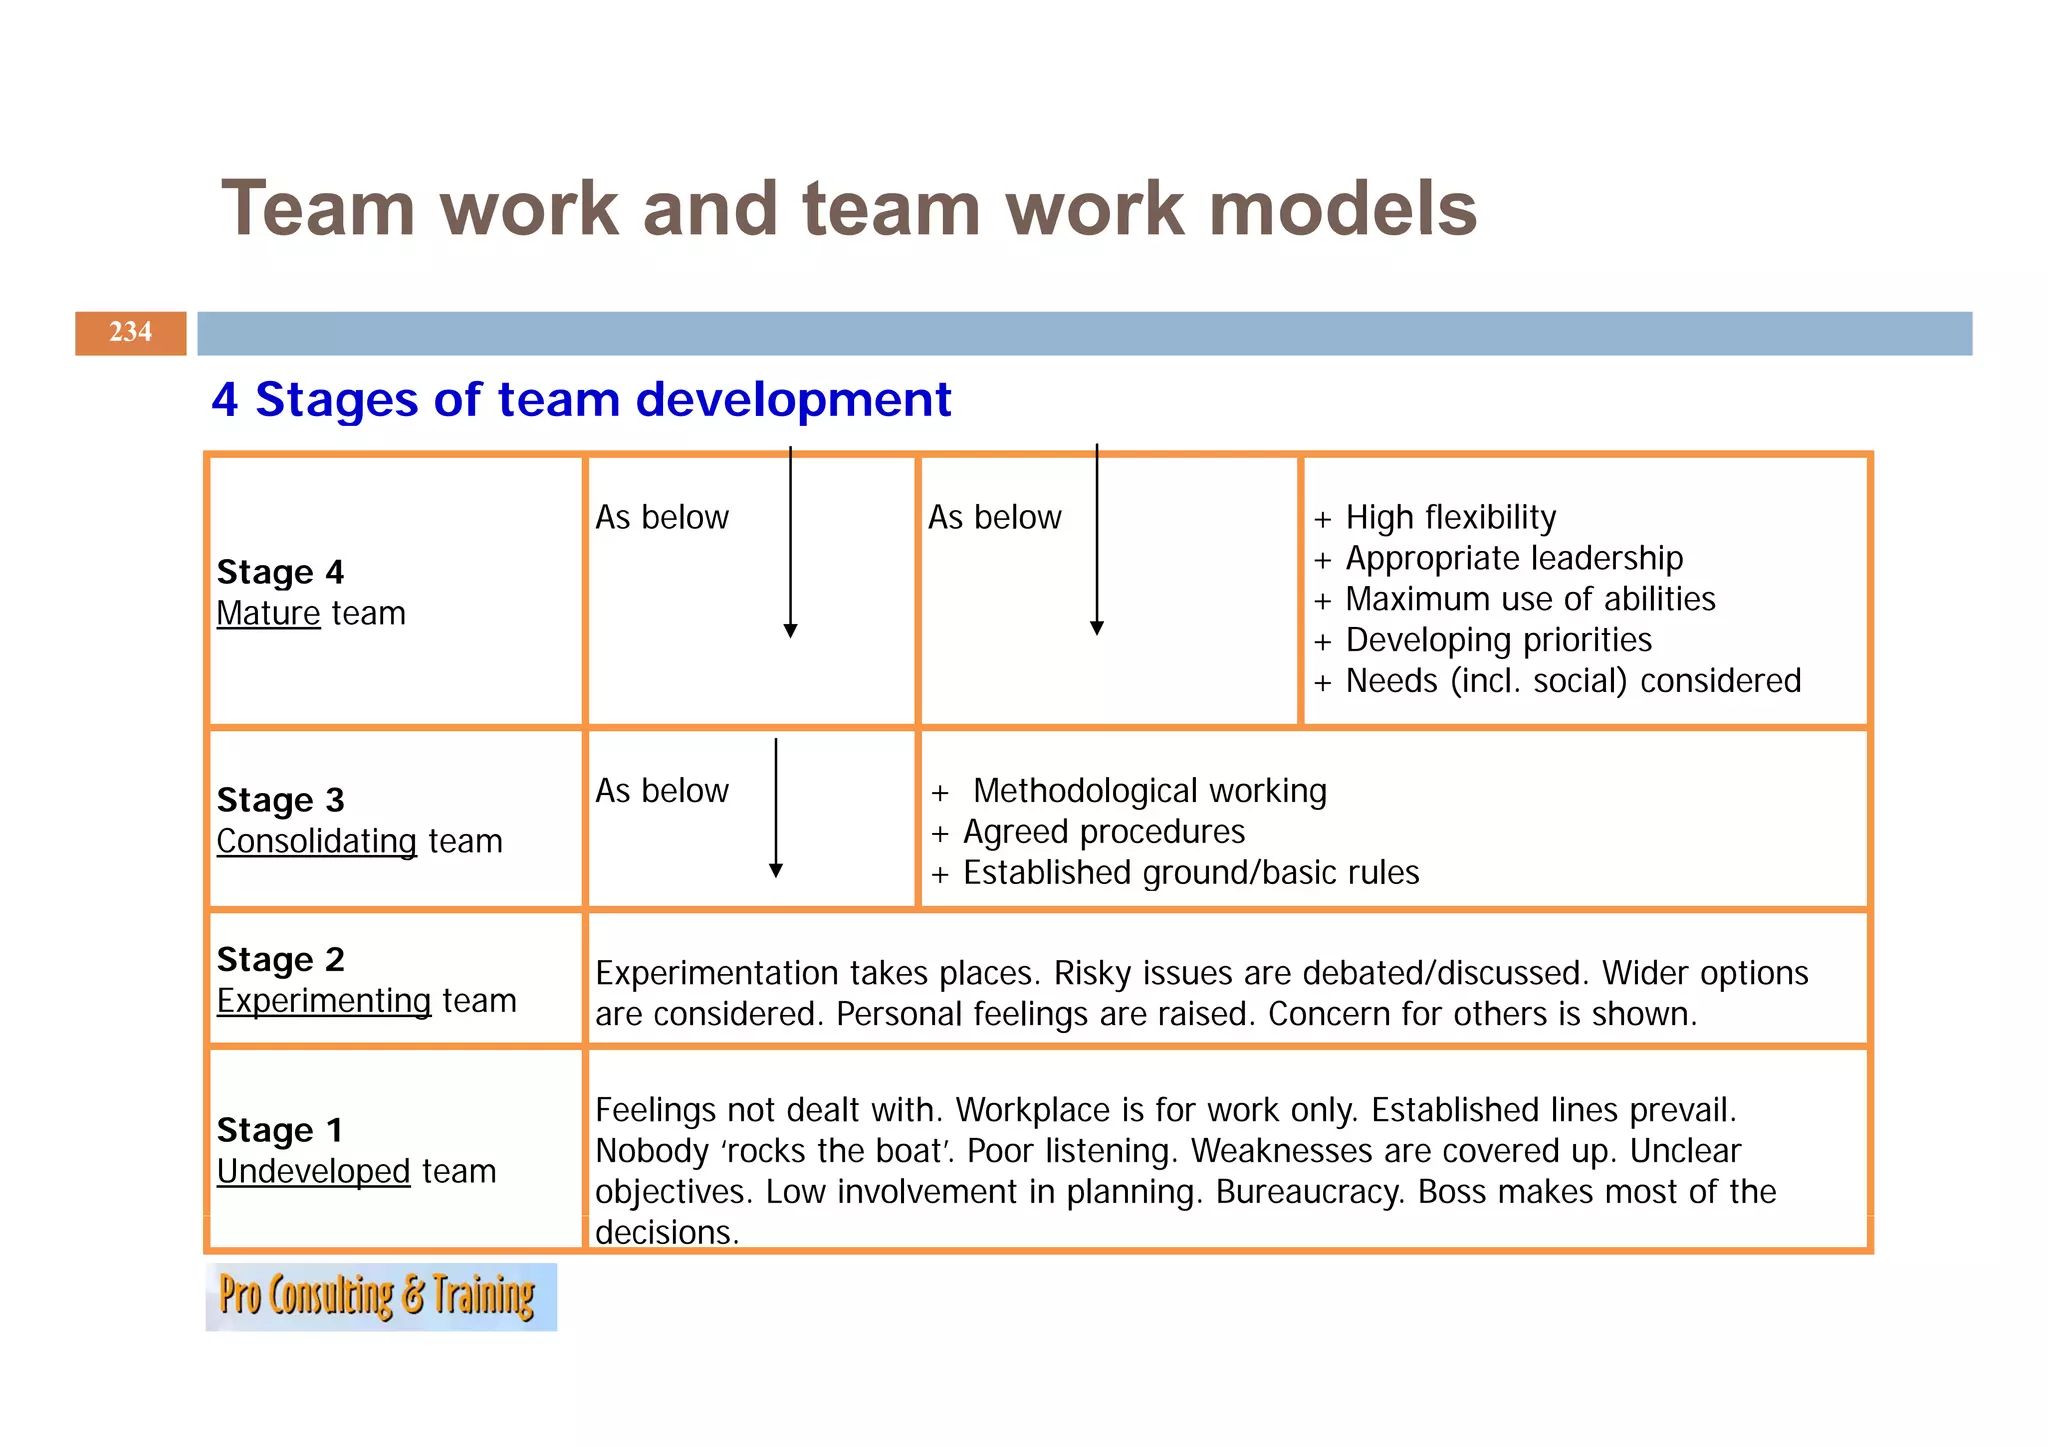
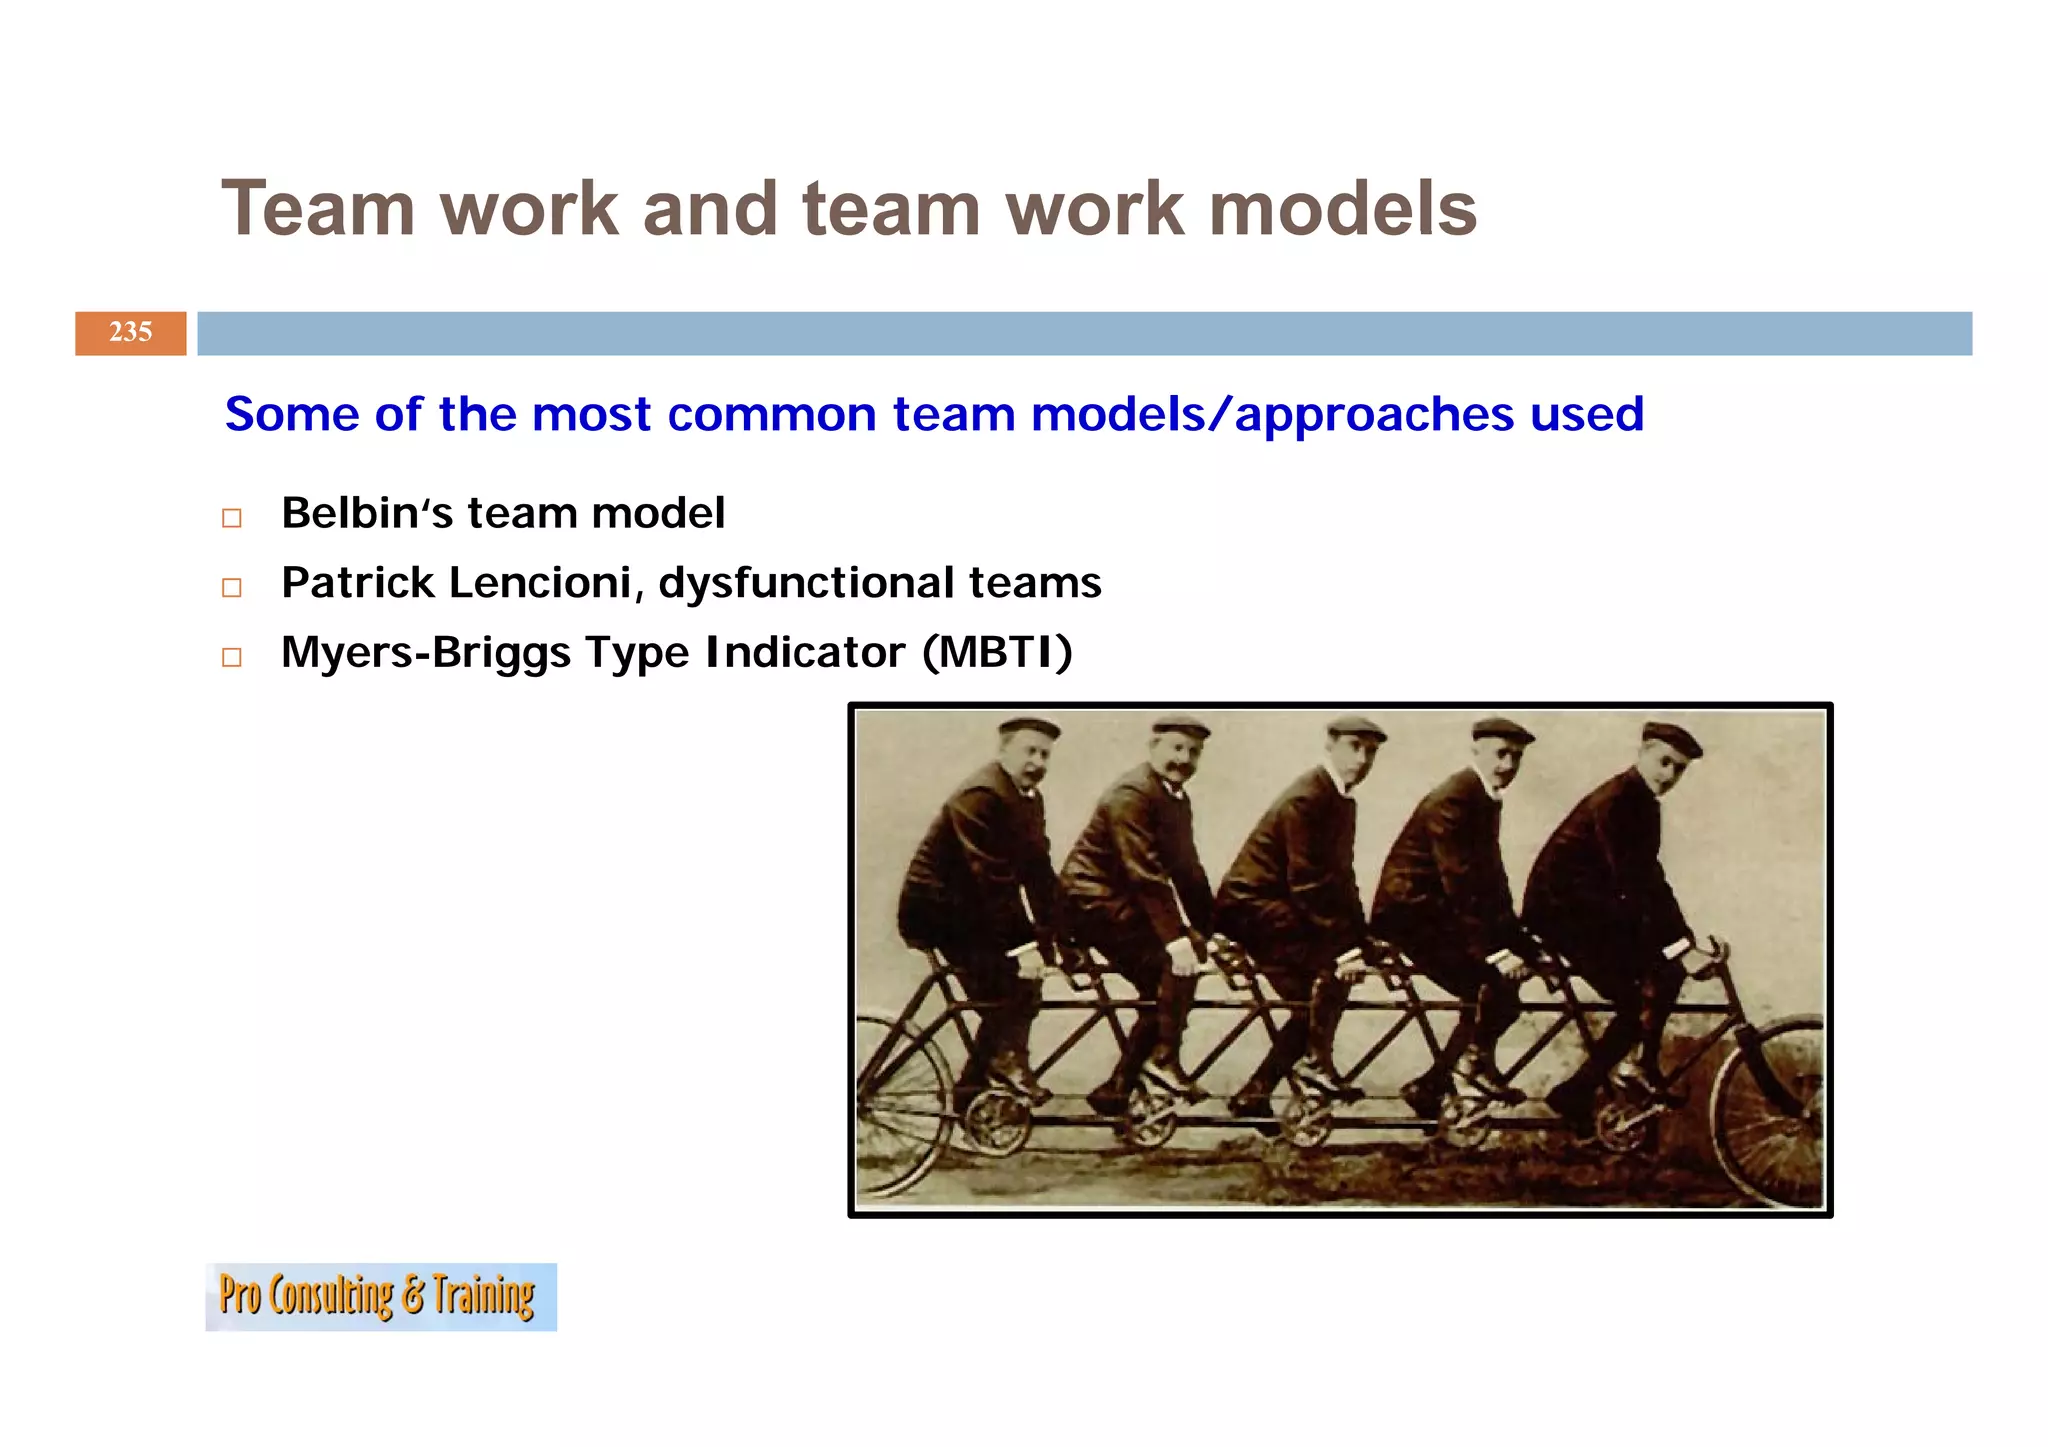
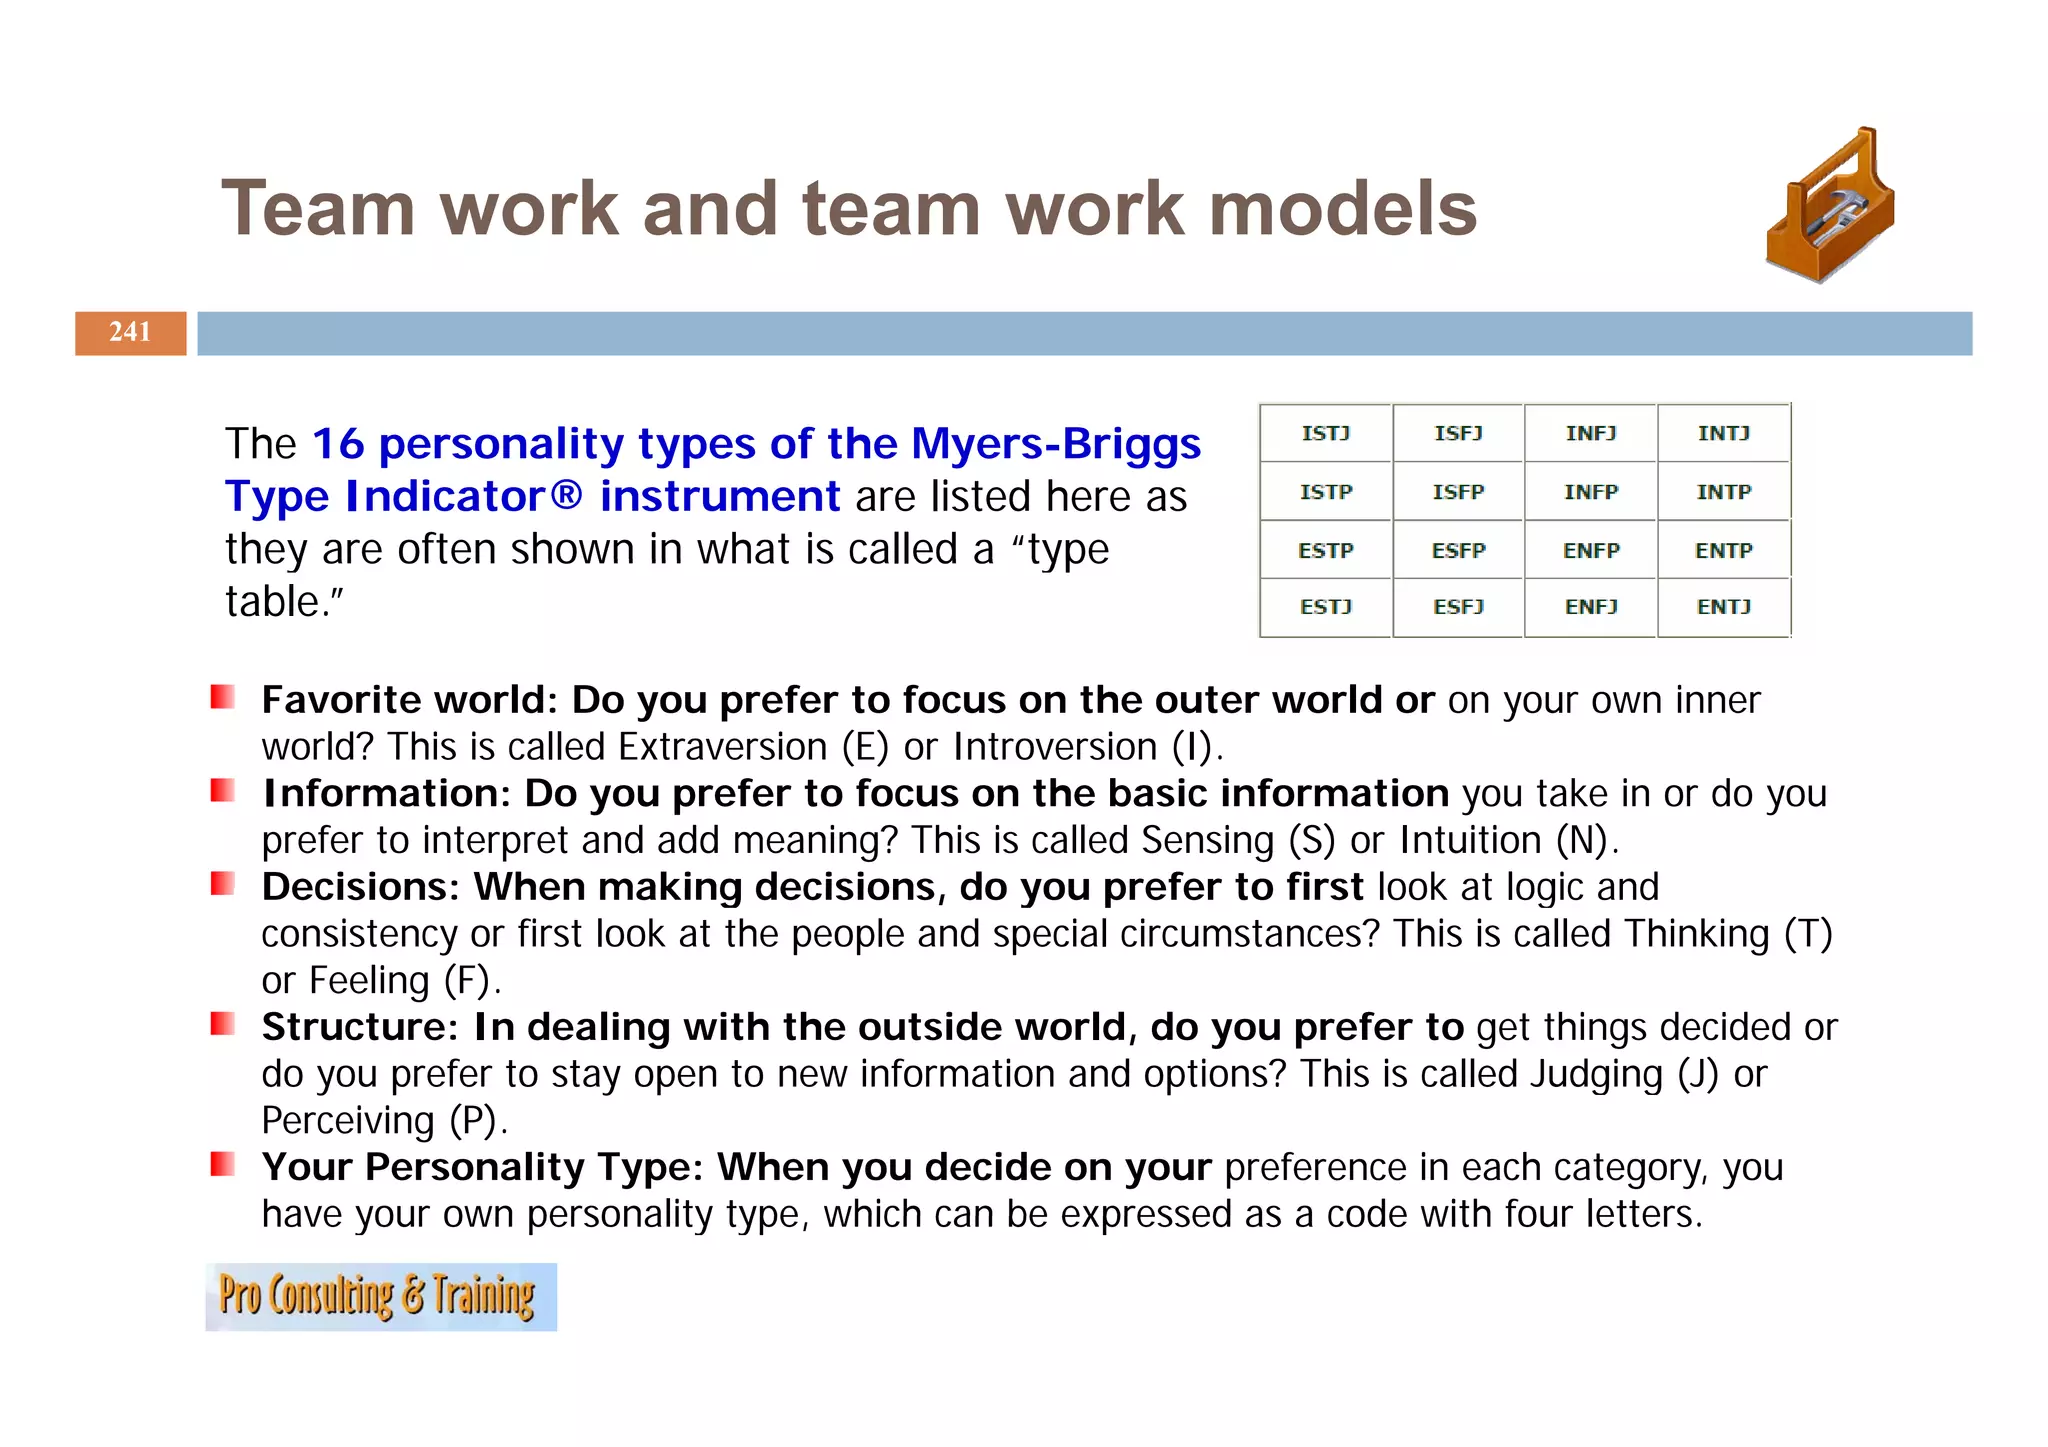
Team dynamics and models discussing efficient teamwork and collaboration.
Team dynamics and models discussing efficient teamwork and collaboration.
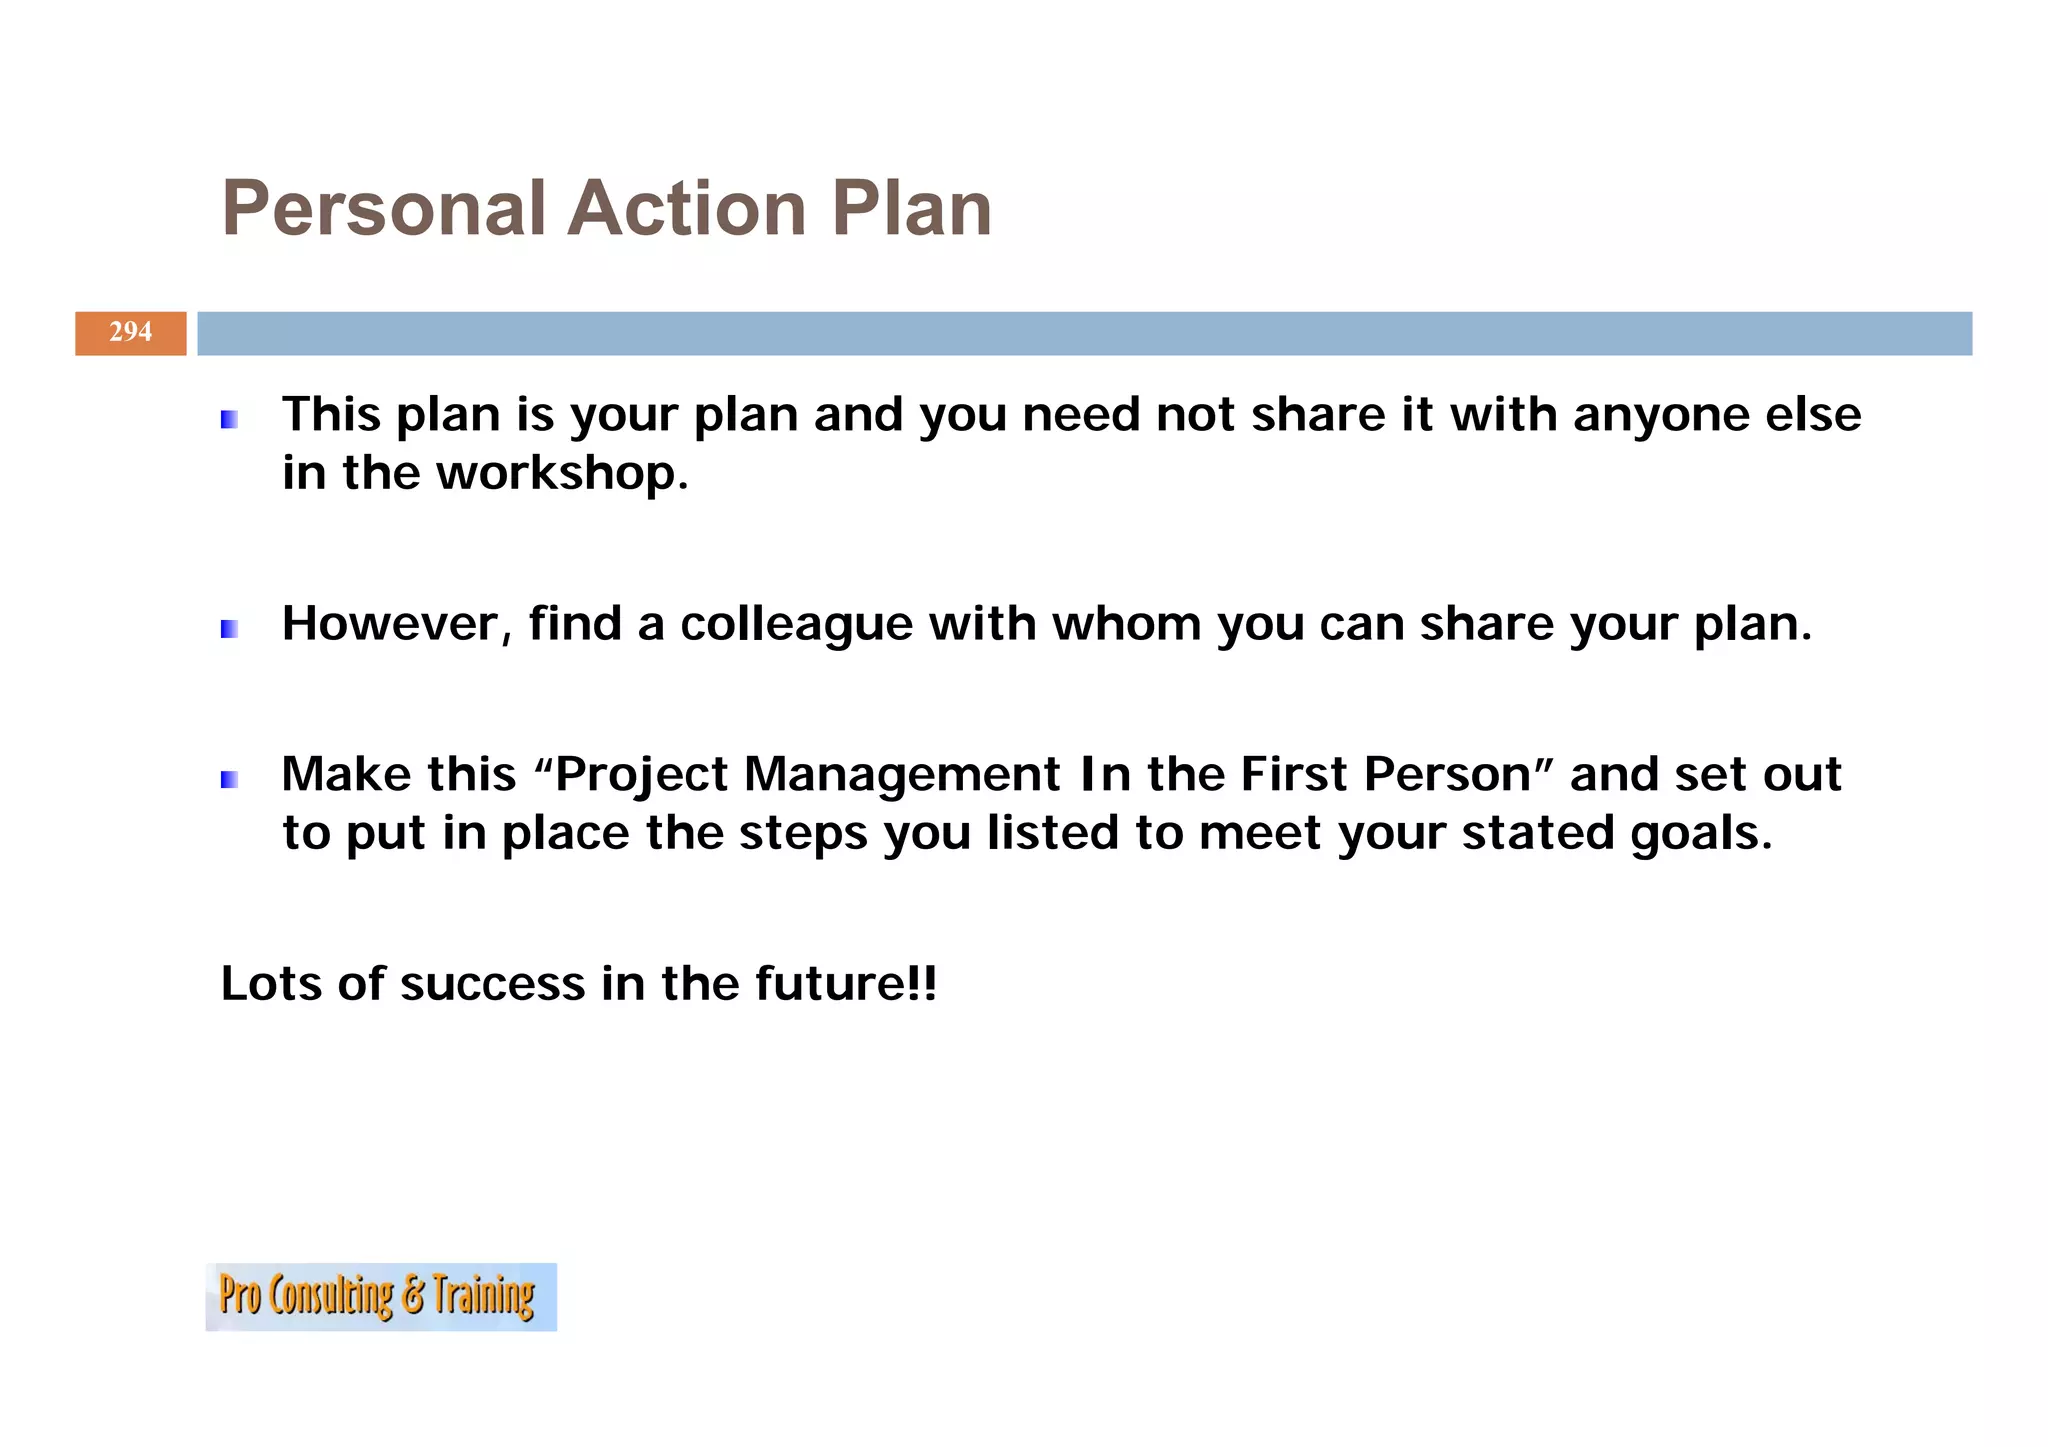
Strategies for planning and enhancing future project management success.
Reflections on project management success factors and challenges.