Force and motion assignment
•Download as DOCX, PDF•
6 likes•5,019 views

Force and motion assignment

Recommended
More Related Content
What's hot
What's hot (20)
Viewers also liked
Similar to Force and motion assignment
Similar to Force and motion assignment (20)
More from 13023901-016
More from 13023901-016 (20)
Recently uploaded
Recently uploaded (20)
Force and motion assignment
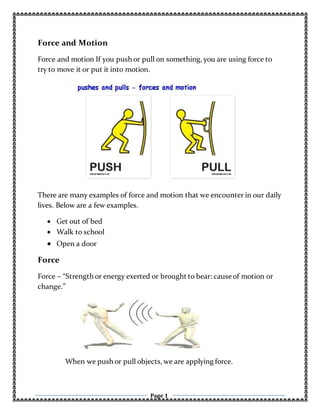
- 1. Page 1 Force and Motion Force and motion If you push or pull on something, you are using force to try to move it or put it into motion. There are many examples of force and motion that we encounter in our daily lives. Below are a few examples. Get out of bed Walk to school Open a door Force Force – “Strength or energy exerted or brought to bear: cause of motion or change.” When we push or pull objects, we are applying force.
- 2. Page 2 Motion Motion – “an act, process, or instance of changing place.” When we move our legs to walk, we are putting them in motion. Force vs. Motion Friction Speed Gravity Velocity Push Acceleration Pull Momentum Different types of force 1. Friction Friction – “Theforce that resists relative motion between two bodies in contact.” Friction occurs when you rub a balloon against your hair.
- 3. Page 3 2. Gravity Gravity – “The gravitational attraction of the mass of the earth, the moon, or a planet for bodies at or near its surface.” An apple falling from a tree is the result of gravity. 3. Magnetism Magnetism– “A class of physicalphenomena that include the attraction for iron observed in a loadstone or magnet.” Magnets are attracted to many different types of metals. Different types of Motion 1. Momentum Momentum – “A property of a moving bodythat determines the length of time required to bring it to rest.” A fast moving car struggles to stop quickly due to its forward momentum. You can see that all the different cars have different velocities, hence
- 4. Page 4 different momentum. But the overall momentum remains the same. The difference in momentum is zero. This arises because forces act 2. Acceleration Acceleration – “To cause to move faster.” The car accelerated to a high speed very quickly. 3. Speed Speed – “The act of moving swiftly.” “The rate of motion.” A cheetah has the ability to run at a high rate of speed. 4. Velocity Velocity – “The rate of position along a straight line with respect to time.” A professional soccerplayer can kick a soccer ball with Powerful forward. A soccer player is kicking a soccerball. The ball travels in a projectile. Newton’s laws of motion Sir Isaac Newton had three laws of motion.
- 5. Page 5 Newton’s 1st law “An object at rest will remain at rest unless acted on by an unbalanced force. An object in motion continues in motion with the same speed and in the same direction unless acted upon by an unbalanced force.’’ Newton’s 2nd law “Acceleration is produce when a force acts on a mass. The greater the mass (of the object being accelerated) the greater the amount of force needed (to accelerate the object).”
- 6. Page 6 Newton’s 3rd law “For every action there is an equal and opposite re-action.” Graphing Nonlinear Graphs 1. Graphs are diagrams (pictures) that can be used to display/compare collected data. 2. A graph is a diagram which represents a functional relationship between sets of numbers which are depicted as sets of points that have coordinates determined by the relationship. It can also refer to a pictorial device that illustrates quantitative relationship. Types of Graph The different types of graphs: line graphs, bar graphs, pictographs, pie charts, cosmography, organizational graphs as well as flow charts.
- 7. Page 7 Linear graph Not all experimental data from a graph with a straight line. Graphs in which the data points yield a straight line are called linear graphs. Nonlinear graph A line graph in which the data points do not fall along a straight line is called a nonlinear graph. Differences between Linear and Nonlinear Graphs A linear graph is made up of a line graph. Every unit on the graph is the same depending on each point in the graph. Non-linear graphs are parabolas and not straight lines.
- 8. Page 8 Graphing Accelerated Motion Acceleration - time graph (a-t graph) The a-t (Acceleration - time) graph gives the acceleration of a moving object at different times. Here are 3 examples of a-t graph representing the motion of 3 different cars Case1: From this graph, we know that the speed is increasing and the s-t graph should also be increasing with a concave downward shape. A-t graph of case 1 Case2: From this graph, we know that the object should either travel in constant speed or at rest. A-t graph of case 2
- 9. Page 9 Case3: From this graph, the v-t (Speed - time) graph and s-t (Distance - time) graph are all increasing with concave downward shape. A-t graph of case 3 The area enclosed by the graph between a certain time intervals represents the change in velocity during that time interval. How to interpret a-t graph Oh, the graph with this shapes again! This time, it is a a-t graph. Let's see how to interpret it. ab : Increasing acceleration (Velocity increases and the rate is faster and faster) bc: Decreasing acceleration (Velocity still increases but the rate is slower and slower) cd: Increasing deceleration (Velocity decreases and the decreasing rate is faster and faster) de: Decreasing deceleration (Velocitydecreases but the decreasing rate is slower and slower)