SlideShare a Scribd company logo
1 of 23
Download to read offline
International Journal of Engineering Science 159 (2021) 103412
Contents lists available at ScienceDirect
International Journal of Engineering Science
journal homepage: www.elsevier.com/locate/ijengsci
A thermodynamic framework for additive manufacturing,
using amorphous polymers, capable of predicting residual
stress, warpage and shrinkage
P Sreejitha
, K Kannana
, KR Rajagopalb,∗
a
Department of Mechanical Engineering, Indian Institute of Technology Madras, Chennai 600036, India
b
Department of Mechanical Engineering, Texas A&M University, College Station, TX 77804, USA
a r t i c l e i n f o
Article history:
Received 20 September 2020
Accepted 23 October 2020
Available online 10 December 2020
Keywords:
Additive manufacturing
Residual stress
Shrinkage
Warpage
Flat nozzle
Helmholtz free energy
Rate of entropy production
Mean normal stress
Magnitude of stress
Nature of the stress state
a b s t r a c t
A thermodynamic framework has been developed for a class of amorphous polymers used
in fused deposition modeling (FDM), in order to predict the residual stresses and the ac-
companying distortion of the geometry of the printed part (warping). When a polymeric
melt is cooled, the inhomogeneous distribution of temperature causes spatially varying
volumetric shrinkage resulting in the generation of residual stresses. Shrinkage is incor-
porated into the framework by introducing an isotropic volumetric expansion/contraction
in the kinematics of the body. We show that the parameter for shrinkage also appears in
the systematically derived rate-type constitutive relation for the stress. The solidification
of the melt around the glass transition temperature is emulated by drastically increasing
the viscosity of the melt. In order to illustrate the usefulness and efficacy of the constitu-
tive relation that has been developed, we consider four ribbons of polymeric melt stacked
on top of each other such as those extruded using a flat nozzle: each layer laid instanta-
neously and allowed to cool for one second before another layer is laid on it. Each layer
cools, shrinks and warps until a new layer is laid, at which time the heat from the newly
laid layer flows into the previous laid layer and heats up the bottom layers. The residual
stresses of the existing and newly laid layers readjust to satisfy equilibrium. Such mechan-
ical and thermal interactions amongst layers result in a complex distribution of residual
stresses. The plane strain approximation predicts nearly equibiaxial tensile stress condi-
tions in the core region of the solidified part, implying that a preexisting crack in that
region is likely to propagate and cause failure of the part during service. The free-end of
the interface between the first and the second layer is subjected to the largest magnitude
of combined shear and tension in the plane with a propensity for delamination.
© 2020 Elsevier Ltd. All rights reserved.
1. Introduction
Manufacturing processes such as fused deposition modeling (FDM), extrusion molding, injection molding and blow mold-
ing induce residual stresses in the thermoplastic components. Determining these stresses is crucial, since it alters the me-
chanical response of the final solidified component. Following instances demonstrate the same: (1) Plastic pipes manufac-
∗
Corresponding author.
E-mail address: krajagopal@tamu.edu (K. Rajagopal).
https://doi.org/10.1016/j.ijengsci.2020.103412
0020-7225/© 2020 Elsevier Ltd. All rights reserved.
P. Sreejith, K. Kannan and K. Rajagopal International Journal of Engineering Science 159 (2021) 103412
tured by extrusion develop compressive residual stresses on the outer surfaces and tensile residual stresses on the inner sur-
faces. Creep tests carried out to study crack propagation on v-notched specimens cutout from these plastic pipes, confirmed
that compressive stresses hindered crack growth whereas tensile stresses aided it (see Chaoui, Chudnovsky, & Moet, 1987).
(2) Similarly, quenching of thermoplastics induce compressive residual stresses in the material. Three point bending tests
and Izod impact tests, conducted to determine the fatigue life and impact strength of the quenched specimens, respectively,
imply that, the strength increases with the magnitude of the residual stresses (see Hornberger & Devries, October 1987 and
So & Broutman, December 1976).
In this paper, we attempt to develop a theory to capture the thermodynamic process associated with FDM during the
layer by layer fabrication of a polymeric component. We aim to achieve the following: (1) Develop a thermodynamic frame-
work that can represent the FDM process. (2) Use the developed model to: (a) Determine the residual stresses induced in
the final solidified component due to rapid cooling and (b) capture the dimensional changes (shrinking and warping) of the
part, which manifests as a consequence of the residual stresses.
In recent years, FDM has been proving to be useful in the fabrication of patient specific transplants, tissue scaffolds and
pharmaceutical products (see Melchels et al., 2012; Melocchi et al., 2016). The use of this technology in the medical in-
dustry has been growing fast due to the flexibility it offers in fashioning products, such as tools for surgical planning and
medical implants. For instance, it has replaced solvent casting, fiber-bonding, membrane lamination, melt molding, and gas
forming, which were previously used to fabricate medical grade polymethylmethacrylate (PMMA) implants for craniofacial
reconstruction and regeneration surgeries (see Espalin et al., 2010; Nyberg et al., 2017). One of the most important advan-
tages of FDM is the possibility to architect the microstructure of the part. This flexibility was demonstrated by Muller, Chim,
Bader, Whiteman, & Schantz (2010), wherein they fabricated an implant for a frontal-parietal defect with branching vascular
channels to promote the growth of blood vessels.
Stress-shielding effect caused by metal implants have led researchers to turn to polymers such as polyetheretherketone
(PEEK) for orthopedic implants (see Han et al., 2019). PEEK displays mechanical behaviour similar to that of the cortical
bone (see Vaezi & Yang, 2015), due to the presence of ether and ketone groups along the backbone of it’s molecular struc-
ture. There have been surgeries such as cervical laminoplasty (see Syuhada, Ramahdita, Rahyussalim, & Whulanza, 2018),
total knee replacement surgery (see Harish & Devadath, 2015; Borges, Choudhury, & Zou, 2018), patient specific upper limb
prostheses attachment (see ten Kate, Smit, & Breedveld, 2017) and patient specific tracheal implants (see Freitag et al., 2017)
recorded in the literature, which use PEEK, polylactic acid (PLA), acrylonitrile butadiene styrene (ABS), polyurethane (PU)
and other medical grade polymer implants that have been fabricated using FDM. Recently, additive manufacturing has re-
ceived a huge impetus in the healthcare sector due to the ongoing Covid-19 pandemic, and the technology is being used to
fabricate products such as ventilator valves, face shields, etc.
During fabrication of such components, thermoplastics are heated above the melting point (θm) and then rapidly cooled
below the glass transition temperature (θg), which causes drastic temperature gradients. Cooling reduces configurational en-
tropy of the polymer molecules, and the sharp temperature gradients induce differential volumetric shrinkage, consequently
leading to the formation of residual stresses. As previously stated, these stresses can be either detrimental or favourable
with regard to the mechanical response of the components.
Process parameters such as layer thickness, orientation, raster angle, raster width, air gap, etc. affect the component’s
final mechanical response (see Sood, Ohdar, & Mahapatra, 2010). For instance, the anistropic nature of a part fabricated by
FDM (see Song et al., 2017) can be controlled by choosing the most suitable raster angle for each individual layer during the
process, in such a way that the component will survive under the required service conditions. This has been demonstrated
by Casavola, Cazzato, Moramarco, & Pappalettera (2017), wherein a rectangular ABS specimen with a raster angle of ±45◦
produced the least residual stresses in the specimen. The optimal raster angle was determined by repeated experimentation,
with a different choice of the angle in each experiment. Developing a consistent theory for capturing the thermodynamic
process and using the resulting constitutive relations in simulations can help in developing standardized methods with
optimized parameters for manufacturing the component.
Many of the theories currently available, concentrate on the analysis of polymers which are at a temperature below
θg, the reasoning being that internal reaction forces due to volume shrinkage are too low in the melt phase to give rise
to appreciable residual stresses (see Xinhua et al., 2015; Wang, Xi, & Jin, 2007; Park, 2005, de Macedo & Ferreira, 2017).
Although such an argument seems reasonable, in a process like FDM, the mechanical and thermal histories of the polymer
melt have a huge impact on the mechanical response of the final component.
Several computational frameworks have been developed, wherein some have assumed incompressible viscous fluid mod-
els for the melt phase (see Xia, Lu, Dabiri, & Tryggvason, 2018a; Dabiri, Schmid, & Tryggvason, 2014, Comminal, Serdeczny,
Pedersen, & Spangenberg, 2018) and linear elastic models (see Xinhua et al., 2015; Wang et al., 2007; de Macedo & Ferreira,
2017; El Moumen, Tarfaoui, & Lafdi, 2019; Casavola, Cazzato, Moramarco, & Pappalettere, 2016) or elasto-plastic models (see
Armillotta, Bellotti, & Cavallaro, 2018; Cattenone, Morganti, Alaimo, & Auricchio, 2018) for the solid phase. However, it is to
be noted that polymer melts are generally modelled as viscoelastic fluids (see Doi & Edwards, 1986). This is supported by
the fact that, residual stresses in injection molded components have been predicted much more accurately by viscoelastic
models than by elastic or elasto-plastic models (see Kamal, Rai-Fook, & Hernandez-Aguilar, May 2002 and Zoetelief, Douven,
& Housz, July 1996). In this paper, the polymer melt is assumed to be amorphous, and we make an entropic assumption to
simplify the analysis. Hence, the internal energy is solely a function of temperature and therefore, at a constant temperature,
the free energy accumulates only due to the reducing configurational entropy of the molecules, such as during stretching.
2
P. Sreejith, K. Kannan and K. Rajagopal International Journal of Engineering Science 159 (2021) 103412
Fig. 1. The various configurations of the melt.
When the load is removed, the melt again assumes a high entropy state, which is also the stress free configuration of the
melt.
Once the amorphous melt has been laid on the substrate, it undergoes phase transformation due to cooling. Numerous
“ad hoc” methods have been implemented by various authors to capture the phase change. One of the simplest meth-
ods used was to assume the melt to transform into a solid at a material point where the temperature reaches θm (see
Xia, Lu, & Tryggvason, 2018b) or θg (see de Macedo & Ferreira, 2017, see Armillotta et al., 2018; El Moumen et al., 2019 and
Cattenone et al., 2018). Generally, polymer melts undergo phase transition through a range of temperature values. The heat
transfer between a polymer melt and the surroundings is usually proportional to the temperature difference between them,
and solidification is initiated at the material points where the germ nuclei are activated into a growth nuclei. An amorphous
polymer melt normally transforms into an amorphous solid, unless the melt contains specific germ nuclei which can cause
crystallization. In the case of FDM, such germ nuclei can be induced in the melt while extruding the melt out of the nozzle
at high shear rates combined with a low temperature (see Northcutt, Orski, Migler, & Kotula, 2018).
In the transition regime, polymer molecules exist in both, the melt, and the solid phases simultaneously, and usually the
body is modelled as a constrained mixture (see Rao & Rajagopal, 2000; Rao & Rajagopal, 2002; Kannan, Rao, & Rajagopal,
2002; Kannan & Rajagopal, 2005; and Kannan & Rajagopal, 2004). While considering such a complex phase transition pro-
cess, it is much more prudent to assume the primary thermodynamic functions to be dependent on the weight fraction of
the phases. The weight fraction can be easily represented as a linear function of temperature (see Liu, Anderson, & Sridhar,
2020) or it can be determined by statistical methods (see Avrami, 1939).
Considering this work to be a preliminary step in developing a consistent theory for FDM, we assume an amorphous
polymer melt to transform into a solid through a drastic increase in the viscosity at the glass transition temperature (θg).
In such a phase change process, the melt transforms completely into a solid when the temperature at all the material
points fall below the glass transition value (θg). This assumption limits the applicability of our theory to very particular
processes having certain specific process parameters, such as:(1) The temperature of the nozzle is maintained above θm
throughout. (2) The intial temperature of the melt is also kept above θm. These predefined conditions ensure that the melt
does not undergo shear induced crystallization. The proposed framework is based on the general theory for viscoelastic
fluids developed by Rajagopal and Srinivasa (2000) and on the theory of the crystallization of polymer melts developed
by Rao and Rajagopal (2000), Rao and Rajagopal (2001), Rao and Rajagopal (2002). The framework requires an appropriate
assumptionror the Helmholtz potential and the rate of entropy production, and the evolution of the “natural configuration”
of the body is determined by maximizing the rate of entropy production.
2. Methodology
2.1. Kinematics
Let us consider the melt to be subjected to thermal loading. Initially the amorphous polymer melt (atactic polymer) is at
the reference configuration κR(B) (refer to Fig. 1). This configuration is stress free and the polymer melt is at the reference
temperature θo. As the melt is cooled from θo, it undergoes deformation and occupies the current configuration κt (B), at the
current temperature θ. The motion of the body from κR(B) to κt (B) is given by
x = χκR
(X,t). (1)
The motion is assumed to be a diffeomorphism. The velocity and the deformation gradient are given by
v =
∂χκR
∂t
, (2)
3
P. Sreejith, K. Kannan and K. Rajagopal International Journal of Engineering Science 159 (2021) 103412
and
FκR
=
∂χκR
∂X
. (3)
The deformation gradient mapping from κpm(t)(B) to κt (B) is Fκpm(t)
. Let αm(θ)I, where αm(θ) is a scalar valued function,
represent pure thermal expansion/contraction. When αm(θ) = 1, i.e., an isothermal process, Fig. 1 will coincide with the
configurations employed by Rajagopal and Srinivasa (2000). The isothermally unloaded configuration κpm(t)(B) evolves due
to thermal expansion/contraction of the melt (see Rajagopal & Srinivasa, 2004a). The configuration κ

pm(t) is stress free, and
since pure thermal expansion/contraction doesn’t induce stresses in the material, the configuration κpm(t) is also assumed
to be stress free. The deformation gradient is multiplicatively decomposed into a dissipative, thermal and an elastic part as
shown
FκR
= αm(θ)Fκpm(t)
Gm. (4)
In general, Gm need not be the gradient of a mapping.
The right Cauchy-Green tensor and the left Cauchy–Green tensor are given by
CκR
= FT
κR
FκR
, and Cκpm(t)
= FT
κpm(t)
Fκpm(t)
, (5)
BκR
= FκR
FT
κR
, and Bκpm(t)
= Fκpm(t)
FT
κpm(t)
. (6)
The ‘right configurational tensor’ associated with the reference configuration (κR) and the instantaneous natural configura-
tion (κ

pm(t)) is defined as
CκR→κ
pm(t)
= GT
mGm. (7)
Therefore, Eq. (6)2 can be represented as
Bκpm(t)
=
1
α2
m(θ)
FκR
C−1
κR→κ
pm(t)
FT
κR
. (8)
The velocity gradients and the corresponding symmetric and skew-symmetric parts are defined as
L = ˙
FκR
F−1
κR
, (9)
D =
L + LT
2
, W =
L − LT
2
, (10)
Lκ
pm(t)
= ˙
GmGm
−1
, (11)
Dκ
pm(t)
=
Lκ
pm(t)
+ LT
κ
pm(t)
2
, Wκ
pm(t)
=
Lκ
pm(t)
− LT
κ
pm(t)
2
. (12)
The material time derivative of Eq. (8) will lead to
˙
Bκpm(t)
= −2
˙
αm(θ)
αm(θ)
Bκpm(t)
+ LBκpm(t)
+ Bκpm(t)
LT
+
1
α2
m(θ)
FκR
˙
C−1
κR→κ
pm(t)
FT
κR
. (13)
The upper convected derivative is used to ensure frame indifference of the time derivatives, which, for any general second
order tensor A is defined as

A= ˙
A − LA − ALT
. (14)
On comparing Eqs. (13) and (14), we arrive at

Bκpm(t)
= −2
˙
αm(θ)
αm(θ)
Bκpm(t)
+
1
α2
m(θ)
FκR
˙
C−1
κR→κ
pm(t)
FT
κR
. (15)
Using Eq. (4), Eq. (7) and Eq. (15), we obtain

Bκpm(t)
= −2Fκpm(t)
Dκ
pm(t)
FT
κpm(t)
− 2
˙
αm(θ)
αm(θ)
Bκpm(t)
. (16)
Note that, the evolution of Bκpm(t)
would depend on the structure of the constitutive equation chosen for αm(θ) (or more
generally, on the material). In the event of an isothermal process, the scalar valued function αm(θ), will become unity, and
Eq. (16) will reduce to the form derived by Rajagopal and Srinivasa (2000) as given below

Bκpm(t)
= −2Fκpm(t)
Dκ
pm(t)
FT
κpm(t)
. (17)
4
P. Sreejith, K. Kannan and K. Rajagopal International Journal of Engineering Science 159 (2021) 103412
To capture the effects of volume relaxation we will be using normalised invariants, where unimodular tensors are defined
such that
−
Cκpm(t)
= det(Fκpm(t)
)− 2
3 Cκpm(t)
, and
−
Bκpm(t)
= det(Fκpm(t)
)− 2
3 Bκpm(t)
. (18)
The invariants that we employ are defined through
Iκpm(t)
= tr(
−
Bκpm(t)
), IIκpm(t)
= tr(
−
Bκpm(t)
)2
, and IIIκpm(t)
= det(Fκpm(t)
). (19)
However, we plot Lode invariants (see Chen, Tan,  Wang, 2012) in Section 3, to interpret the results better. This set of
invariants are defined as
K1 =
tr(A)
√
3
, K2 =

tr(A2
d ), and K3 =
1
3
sin
−1
√
6tr(A3
d )
tr(A2
d )
3
2

, (20)
where A is any tensor and Ad is the deviatoric part of A. When K1 = 0, the tensor is purely composed of the deviatoric
components. Similarly, when K2 = 0, the tensor is volumetric and K3 represents the mode of the tensor which varies from
−π
6 to π
6 .
2.2. Modeling
2.2.1. Modeling the melt
Helmholtz free energy per unit mass is defined with respect to the configuration κpm(t)(B), and is assumed to be a func-
tion of θ and the deformation gradient Fκpm(t)
. We represent it as a sum of the contribution from the thermal interactions
and the mechanical working, where the contribution due to mechanical working is assumed to be of the Neo-Hookean form.
Further, we require it to be frame indifferent and isotropic with respect to the configuration κpm(t)(B), to arrive at
m(θ, Iκpm(t)
, IIIκpm(t)
) = th
m (θ) + mech
m (Iκpm(t)
, IIIκpm(t)
), (21)
where
th
m (θ) = Am
+ (Bm
+ Cm
2 )(θ − θo) − Cm
1
(θ − θo)2
2
− Cm
2 θln
 θ
θo

, (22)
and
mech
m (Iκpm(t)
, IIIκpm(t)
) =
μm
1 θ
2ρκpm(t)
θo

tr(
−
Bκpm(t)
) − 3

+
km
1 θ
2ρκpm(t)
θo

det(Fκpm(t)
) − 1

2
, (23)
where θo, Am, Bm, Cm
1
, Cm
2
, μm
1
and km
1
are the reference material temperature and the material constants respectively, and
μm
1
, km
1
≥ 0, and ρκpm(t)
is the density of the melt in the configuration κpm(t)(B).
The rate of entropy production per unit volume due to mechanical working is defined as a function of θ and Lκ
pm(t)
, and
requiring the function to be frame indifferent and isotropic, we assume
ξmech
m (θ, Dκ
pm(t)
) = ηm
1 (θ)dev(Dκ
pm(t)
).dev(Dκ
pm(t)
) + ηm
2 (θ)tr(Dκ
pm(t)
)2
, (24)
where ηm
1
and ηm
2
are the shear and bulk modulus of viscosity and ηm
1
, ηm
2
≥ 0. The rate of mechanical dissipation should
always be non-negative and hence,
ξmech
m ≥ 0, (25)
and the form given by Eq. (24), ensures that Eq. (25) is always met.
The balance of energy can be written as
ρκt
˙m = T.D − div(q) + ρκt
r, (26)
where T is the Cauchy stress tensor, ˙m is the rate of change of internal energy per unit mass of the melt with respect to
time, q is the heat flux and r is the radiation of heat per unit mass of the melt. We express the second law of thermody-
namics as an equality by introducing a rate of entropy production term, and it takes the form (see Green  Naghdi, 1977)
T.D − ρκt
˙
m − ρκt
ηm
˙
θ −
1
θ
q.grad(θ) = ρκt
θζm = ξtot
m , ξtot
m ≥ 0, (27)
where ηm is the entropy per unit mass of the melt, θ is the absolute temperature, ζm is the rate of entropy production per
unit mass of the melt and ξtot
m is the total rate of entropy production per unit volume. Substituting Eq. (21) into Eq. (27),
we can re-write Eq. (27) as
T.D − ρκt
∂th
m
∂θ
+
μm
1
2ρκpm(t)
θo

tr(
−
Bκpm(t)
) − 3

+
km
1
2ρκpm(t)
θo

det(Fκpm(t)
) − 1

2
+ ηm

˙
θ
5
P. Sreejith, K. Kannan and K. Rajagopal International Journal of Engineering Science 159 (2021) 103412
−ρκt
 μm
1 θ
2ρκpm(t)
θo
tr(
˙
−
Bκpm(t)
) −
μm
1 θ ˙
ρκpm(t)
2ρ2
κpm(t)
θo

tr(
−
Bκpm(t)
) − 3

+
km
1 θ
ρκpm(t)
θo

det(Fκpm(t)
) − 1

˙
det(Fκpm(t)
) −
km
1 θ ˙
ρκpm(t)
2ρ2
κpm(t)
θo

det(Fκpm(t)
) − 1

2

−
1
θ
q.grad(θ) = ξtot
m , ξtot
m ≥ 0. (28)
The balance of mass for the melt undergoing deformation from the configurations κR(B) to κpm(t)(B) is
ρκR
= ρκpm(t)
det(Gm)(αm(θ))3
, (29)
where ρκR
is the density at the reference configuration, κR(B). The balance of mass for the melt between the configurations
κR(B) and κt (B) is given by
ρκR
= ρκt
det(FκR
), (30)
where ρκt is the density at the current configuration, κt (B). Taking the material derivative of Eq. (29), we arrive at
˙
ρκpm(t)
ρκpm(t)
= −tr(Dκ
pm(t)
) −
3 ˙
αm(θ)
αm(θ)
. (31)
Next, from Eq. (6)2 and Eq. (16)
˙
det Fκpm(t)
= det Fκpm(t)
tr

D − Dκ’
pm(t)

− 3
˙
αm(θ)
αm(θ)
, (32)
and from Eqs. (16), (18) and (32), we obtain
tr(
˙
−
Bκpm(t)
) = 2dev(
−
Bκpm(t)
).(D − Dκ
pm(t)
) (33)
It follows from Eqs. (4) and (28)–(32), that

T −
μm
1 θ
det(Fκpm(t)
)θo
dev(
−
Bκpm(t)
) −
km
1 θ
θo

det(Fκpm(t)
) − 1

I

.D
−ρκt
∂th
m
∂θ
+
μm
1
2ρκpm(t)
θo

tr(
−
Bκpm(t)
) − 3

+
km
1
2ρκpm(t)
θo

det(Fκpm(t)
) − 1

2
+ ηm

˙
θ
+
μm
1 θ
det(Fκpm(t)
)θo
dev(
−
Bκpm(t)
).Dκ
pm(t)
+
km
1 θ
θo

det(Fκpm(t)
) − 1

−
μm
1 θ
2det(Fκpm(t)
)θo

tr(
−
Bκpm(t)
) − 3

−
km
1 θ
2det(Fκpm(t)
)θo

det(Fκpm(t)
) − 1

2

×

tr(Dκ
pm(t)
) +
3 ˙
αm(θ)
αm(θ)

−
1
θ
q.grad(θ) = ξtot
m , ξtot
m ≥ 0. (34)
One of the ways to satisfy Eq. (34) is to assume that the three equations given below hold
ηm = −
∂th
m
∂θ
−
μm
1
2ρκpm(t)
θo

tr(
−
Bκpm(t)
) − 3

−
km
1
2ρκpm(t)
θo

det(Fκpm(t)
) − 1

2
, (35)
T =
μm
1 θ
det(Fκpm(t)
)θo
dev(
−
Bκpm(t)
) +
km
1 θ
θo

det(Fκpm(t)
) − 1

I, (36)
and
ξtot
m = T.Dκ
pm(t)
− MECH
m I.Dκ
pm(t)
+
3 ˙
αm(θ)
αm(θ)

−
μm
1 θ
2θodet(Fκpm(t)
)

tr(
−
Bκpm(t)
) − 3

+
km
1 θ
2θodet(Fκpm(t)
)

det(Fκpm(t)
) 2
− 1

−
1
θ
q.grad(θ), ξtot
m ≥ 0, (37)
where
MECH
m = ρκt
mech
m . (38)
The Helmholtz free energy is given by
m = m − θηm. (39)
From Eqs. (21) and (35), the internal energy is defined as
m = Am
− Bm
θo +
1
2
C1
m
(θ2
− θ2
o ) + Cm
2 (θ − θo), (40)
6
P. Sreejith, K. Kannan and K. Rajagopal International Journal of Engineering Science 159 (2021) 103412
and the specific heat is
∂ m
∂θ
= C1
m
θ + Cm
2 . (41)
When the process is homothermal, Eq. (37) will reduce to
ξtot
m = T.Dκ
pm(t)
− MECH
m I.Dκ
pm(t)
, ξtot
m ≥ 0. (42)
Therefore, in the current analysis, it seems prudent to suppose the following
ξmech
m = T.Dκ
pm(t)
− MECH
m I.Dκ
pm(t)
. (43)
Eq. (43) can be re-written as
ξmech
m (Dκ
pm(t)
, θ) = ξmech
m − T.Dκ
pm(t)
+ MECH
m I.Dκ
pm(t)
= 0. (44)
Now, we assume the natural configuration and hence Dκ
pm(t)
to evolve in such a way that, for a fixed Bκ
pm(t)
and θ at
each time instant, the rate of entropy production due to mechanical working is maximum, subject to the constraint in
Eq. (44) (see Rajagopal  Srinivasa, 2004b). Therefore, to extremize ξmech
m constrained by Eq. (44), we write the augmented
form as
aug = ξmech
m + λ(ξmech
m − T.Dκ
pm(t)
+ MECH
m I.Dκ
pm(t)
), (45)
where λ is the Lagrange multiplier. On taking the derivative with respect to Dκ
pm(t)
, we obtain
∂aug
∂Dκ
pm(t)
=
(1 + λ)
λ
∂ξmech
m
∂Dκ
pm(t)
+ (MECH
m I − T) = 0. (46)
At any time instant, assuming Bκpm(t)
and θ to be fixed, Dκ
pm(t)
will take only those values which will satisfy Eq. (46).
Substituting Eq. (24) into Eq. (46) and taking the scalar product with Dκ
pm(t)
∂aug
∂Dκ
pm(t)
.Dκ
pm(t)
=
2(1 + λ)
λ

ηm
1 (θ)dev(Dκ
pm(t)
).Dκ
pm(t)
+ ηm
2 (θ)[tr(Dκ
pm(t)
)]2

+

MECH
m tr(Dκ
pm(t)
) − T.Dκ
pm(t)

= 0. (47)
Comparing Eq. (47) with Eq. (44), we get (1+λ)
λ = 1
2 . Since the melt is assumed to be isotropic, we can assume that
Fκpm(t)
= vκpm(t)
, (48)
Also the eigenvectors of Bκpm(t)
and Dκ
pm(t)
are the same and hence the tensors commute (see Rajagopal  Srinivasa, 2000).
Therefore, from Eqs. (16), (46) and (48), we arrive at the form for the upper convected derivative of Bκpm(t)
, which will
determine the evolution of natural configuration of the melt, as

Bκpm(t)
= 2
MECH
m − tr(T)
3
3ηm
2
(θ)

I −
1
ηm
1
(θ)
dev(T) −
˙
αm(θ)
αm(θ)
I

Bκpm(t)
. (49)
3. Application of the model
A prototypical problem to test the efficacy of the theory that has been developed is considered, i.e., we assume a partic-
ular geometry to be fashioned by FDM and use the constitutive equations to determine the residual stresses induced in the
material during fabrication and the consequent dimensional instability of the geometry.
3.1. Fused deposition modeling
In FDM, a polymer filament is heated above the melting temperature and extruded out through a nozzle attached to a
robotic arm. A stereolithography (STL) file, containing information of the 3D geometry to be made, is then fed into a process-
ing system that controls the robotic arm. The polymer melt is laid layer by layer through the nozzle with the help of the arm
to get the desired 3D geometry, and the melt is allowed to cool. Polymers used in this process are usually thermoplastics like
ABS (Acrylonitrile Butadiene Styrene), PLA (Polylactic Acid), PS (Polystyrene), PC (Polycarbonates), PEEK (Polyetheretherke-
tone), PMMA (Polymethylmethacrylate) and elastomers (see González-Henríquez, Sarabia-Vallejos,  Rodriguez-Hernandez,
2019). Thermoplastics are preferred over thermosets, because the former’s melt viscosity enables smooth extrusion through
7
P. Sreejith, K. Kannan and K. Rajagopal International Journal of Engineering Science 159 (2021) 103412
Fig. 2. Representative images showing the boundary conditions on the layers at different time steps of the simulation. The dashed (dark red) line provides
a break and is intended to denote that the layers are very long.
the nozzle, and at the same time helps to retain the shape once the melt is laid. Complex part geometries can also be made
with the help of support materials.
In the current analysis, we assume each of the layers to be very long and be made of a single raster. Further, we assume
a rectangular cross section for the layers, which finally adds up to each of the layers being in the shape of a very long
ribbon. To lay such a layer, we need a nozzle with an appropriate geometry, such as a nozzle with a slot (see Löffler 
Koch, 2019) or a flat head nozzle which is capable of evening out the melt into the desired shape (see Kim, Trangkanukulkij,
 Kim, 2018). Four layers of the polymer melt are assumed to be laid one over the other consecutively, in the direction
of the length of the ribbon. All four layers are assumed to have a sufficiently long rectangular cross-section, which enables
plane strain conditions to be enforced (refer to Fig. 2).
3.2. Governing equations
The constitutive form for the scalar valued function αm(θ), which represents the isotropic volume expansion/contraction,
can be deduced from Eq. (4). When t  0, taking the determinant of Eq. (4)
αm(θ) =
ρκR
ρκt
det(Fκpm(t)
)det(Gm)

1
3 . (50)
Dilatometry experiments that are conducted to measure the specific volume changes are homothermal processes, and hence,
the deformation gradients, Gm and Fκpm(t)
, shown in Fig. 1, can be assumed to be identity transformations. Thus, density will
become solely a function of temperature and the isotropic volume expansion/contraction can be represented as
αm(θ) =
ρκR
ρκt

1
3 . (51)
The density can be expressed in terms of specific volume, and therefore, αm(θ) is obtained as
αm(θ) =
v(θ)
v(θo)

1
3 =
v
vo

1
3 , (52)
8
P. Sreejith, K. Kannan and K. Rajagopal International Journal of Engineering Science 159 (2021) 103412
Fig. 2. Continued
where v is the specific volume at the current temperature θ and vo is the specific volume at the reference temperature
θo which can be represented by the Tait equation (see Haynes, 2014). At time t = 0 second, i.e. at reference temperature
(temperature of the reference configuration) θ = θo
αm(θo) = 1. (53)
The coefficient of volumetric thermal expansion/contraction, ˆ
αm(θ), is defined as
ˆ
αm(θ) =
1
v
 ∂v
∂θ

= ρκt
∂( 1
ρκt
)
∂θ

. (54)
The relationship between isotropic volume expansion/contraction αm(θ) and the coefficient of volumetric thermal expan-
sion/contraction ˆ
αm(θ) is obtained by taking the derivative of Eq. (52) with respect to the current temperature, θ, as
ˆ
αm(θ) =
3
αm(θ)
∂αm(θ)
∂θ
. (55)
9
P. Sreejith, K. Kannan and K. Rajagopal International Journal of Engineering Science 159 (2021) 103412
Table 1
Properties of PS.
Material Properties Value Unit Ref.
Thermal properties
Melting temperature, θm 513 K van Krevelen and te Nijenhuis (2009)
Glass transition temperature, θg 373 K van Krevelen and te Nijenhuis (2009)
Coefficient of heat
conduction, k (averaged value)
0.159 W
mK
Sombatsompop and Wood (1997)
Coefficient of heat transfer from the material to the environment, he 90 W
m2 K
Costa, Duarte, and Covas (2015)
Coefficient of heat transfer from the material to the substrate, hs 100 W
m2 K
Costa et al. (2015)
Specific heat (Cp):
(Table 1a and 1b of Marti, Kaisersberger,  Moukhina (2006))
Cm
1 4.101 J
K2 kg
Marti et al. (2006)
Cm
2 11.16 J
Kkg
Marti et al. (2006)
Constants in the Tait equation:
A3 0.9287 cm3
g
Haynes (2014)
A4 5.131x10⁻⁴ ◦
C−1
Haynes (2014)
Mechanical properties
Shear modulus (μm
1 ) 109
Pa Mark (1999)
Bulk modulus (km
1 ) 3x10¹⁰
Pa NA
Shear viscosity below glass transition
temperature, θg (ηs
1)
1019
Pas NA
Bulk viscosity below glass transition
temperature, θg (ηs
2)
2x10²⁰
Pas NA
Shear viscosity at the reference
temperature, θo (ηo
1)
103
Pas Miller (1968)
Bulk viscosity at the reference temperature, θo (ηo
2) 2x10⁴
Pas NA
temperature, θo (ηo
2) 2x10⁴
C 22,873 K Miller (1968)
a 0.7 NA NA
As the layers cool, the viscosity of the polymer melt shoots up at glass transition temperature (θg). The variation of the
bulk and shear viscosities of the melt are defined as
ηm
n (θ) = ηs
n

1 − tanh a(θ − θg)

2
+ ηl
n

1 + tanh a(θ − θg)

2
, n = 1, 2, (56)
where ηm
1
is the shear viscosity and ηm
2
is the bulk viscosity, ηs
1
and ηs
2
are the shear and the bulk viscosities below the
glass transition temperature (θg), ηl
1
and ηl
2
are the shear and the bulk viscosities above the glass transition tempera-
ture (θg) and a is a constant. The shear viscosity and the bulk viscosity above the glass transition, i.e., ηl
1
and ηl
2
, are
defined as
ηl
n(θ) = ηo
ne

C 1
θ − 1
θo

, n = 1, 2, (57)
where ηo
1
is the shear viscosity at the melting temperature (θm), ηo
2
is the bulk viscosity at the melting temperature (θm)
and C is a constant.
The dependent variables are assumed to be a function of the current co-ordinates and current time. They are the dis-
placement vector
∼
u (x,t), the current temperature
∼
θ (x,t) and the left Cauchy-Green tensor as defined in Eq. (6)2, i.e.,
∼
Bκpm(t)
(x,t). The bases in the local and the global coordinate system are aligned with each other. Therefore, defining the
dependent variables with respect to the local coordinate system is as good as defining it with respect to the global co-
ordinate system. The position vector of a particle in the reference configuration is defined as
X = x(t)−
∼
u (x,t). (58)
The velocity vector in the current configuration is derived by taking the total time derivative of Eq. (58)
∼
v (x,t) =

I −
∂(
∼
u (x,t))
∂x

−1 ∂
∼
u (x,t)
∂t
, (59)
and the velocity gradient is defined as
∼
L (x,t) =
∂
∼
v (x,t)
∂x
. (60)
The components of the displacement vector are
 ∼
u

=

ux(x, y,t)
uy(x, y,t)

, (61)
10
P. Sreejith, K. Kannan and K. Rajagopal International Journal of Engineering Science 159 (2021) 103412
Fig. 3. Banded contour plots of temperature in o
C, visualised on the deformed configuration. The white arrows depict the local displacement vector, and
its length represents the magnitude. The relative length of arrows are in logarithmic scale.
where
 ∼
u

represents the component form of the displacement vector and, ux(x, y,t) and uy(x, y,t) are the components in
the x and y directions respectively. We represent the components of the velocity vector as given below
 ∼
v

=

vx(x, y,t)
vy(x, y,t)

, (62)
where
vx =
∂ux
∂t
∂uy
∂y
− 1 − ∂ux
∂y
∂uy
∂t
∂ux
∂x
+
∂uy
∂y
− ∂ux
∂x
∂uy
∂y
+ ∂ux
∂y
∂uy
∂x
− 1
, (63)
and
vy =
∂uy
∂t
∂ux
∂x
− 1 − ∂ux
∂t
∂uy
∂x
∂ux
∂x
+
∂uy
∂y
− ∂ux
∂x
∂uy
∂y
+ ∂ux
∂y
∂uy
∂x
− 1
. (64)
Consequently, the component form of the velocity gradient follows from Eq. (60) as
 ∼
L

=
⎡
⎣
∂vx (x,y,t)
∂x
∂vx (x,y,t)
∂y
0
∂vy (x,y,t)
∂x
∂vy (x,y,t)
∂y
0
0 0 0
⎤
⎦. (65)
11
P. Sreejith, K. Kannan and K. Rajagopal International Journal of Engineering Science 159 (2021) 103412
Fig. 3. Continued
We represent the components of
∼
Bκpm(t)
(x,t) and the stress tensor T
 ∼
θ,
∼
Bκpm(t)

as
 ∼
Bκpm(t)

=

Bxx(x, y,t) Bxy(x, y,t) 0
Bxy(x, y,t) Byy(x, y,t) 0
0 0 Bzz(x, y,t)

, (66)
and

T

=

Txx(x, y,t) Txy(x, y,t) 0
Txy(x, y,t) Tyy(x, y,t) 0
0 0 Tzz(x, y,t)

, (67)
where Txx(x, y,t), Tyy(x, y,t), Txy(x, y,t) and Tzz(x, y,t) are derived by substituting θ(x, y,t) and the components of
∼
Bκpm(t)
(x,t) into Eq. (36).
There are seven coupled field equations that have to be solved , i.e., two components of the balance oflinear momen-
tum equation, the energy equation [Eq. (26)] and four components of the evolution equation [Eq. (49)] represented in the
Eulerian form. The linear momentum balance is given by
∂Txx
∂x
+
∂Txy
∂y
= 0, (68)
12
P. Sreejith, K. Kannan and K. Rajagopal International Journal of Engineering Science 159 (2021) 103412
Fig. 4. Banded contour plots of the mean normal stress (Pa), K1
√
3
, visualised on the deformed configuration.
and
∂Txy
∂x
+
∂Tyy
∂y
= 0. (69)
We assume radiation to be absent in the current analysis and hence the energy equation is written as
Txx
∂vx
∂x
+ Tyy
∂vy
∂y
+ Txy
∂vx
∂y
+
∂vy
∂x

+ k
∂2
θ
∂x2
+
∂2
θ
∂y2

= ρκt
∂ (θ)
∂θ
∂θ
∂t
+
∂θ
∂x
vx +
∂θ
∂y
vy

. (70)
The evolution equations are
∂Bxx
∂t
+
∂Bxx
∂x
vx +
∂Bxx
∂y
vy − 2
∂vx
∂x
Bxx +
∂vx
∂y
Bxy

=
2
3ηm
2
(θ)

MECH
m −
(Txx + Tyy + Tzz)
3

Bxx −
2
ηm
1
(θ)
2Txx
3
−
Tyy
3
−
Tzz
3

Bxx + TxyBxy

−
2
αm(θ)
∂αm(θ)
∂θ
∂θ
∂t
+
∂θ
∂x
vx +
∂θ
∂y
vy

Bxx, (71)
∂Byy
∂t
+
∂Byy
∂x
vx +
∂Byy
∂y
vy − 2
∂vy
∂x
Bxy +
∂vy
∂y
Byy

13
P. Sreejith, K. Kannan and K. Rajagopal International Journal of Engineering Science 159 (2021) 103412
Fig. 4. Continued
=
2
3ηm
2
(θ)

MECH
m −
(Txx + Tyy + Tzz)
3

Byy −
2
ηm
1
(θ)
−Txx
3
+
2Tyy
3
−
Tzz
3

Byy + TxyBxy

−
2
αm(θ)
∂αm(θ)
∂θ
∂θ
∂t
+
∂θ
∂x
vx +
∂θ
∂y
vy

Byy, (72)
∂Bzz
∂t
+
∂Bzz
∂x
vx +
∂Bzz
∂y
vy =
2
3ηm
2
(θ)

MECH
m −
(Txx + Tyy + Tzz)
3

Bzz
−
2
ηm
1
(θ)
−Txx
3
−
Tyy
3
+
2Tzz
3

Bzz

−
2
αm(θ)
∂αm(θ)
∂θ
∂θ
∂t
+
∂θ
∂x
vx +
∂θ
∂y
vy

Bzz, (73)
and
∂Bxy
∂t
+
∂Bxy
∂x
vx +
∂Bxy
∂y
vy −
∂vx
∂x
Bxy +
∂vx
∂y
Byy

−
∂vy
∂x
Bxx +
∂vy
∂y
Bxy

=
2
3ηm
2
(θ)

MECH
m −
(Txx + Tyy + Tzz)
3

Bxy −
2
ηm
1
(θ)
2Txx
3
−
Tyy
3
−
Tzz
3

Bxy
14
P. Sreejith, K. Kannan and K. Rajagopal International Journal of Engineering Science 159 (2021) 103412
Fig. 5. Banded contour plots of the norm of deviatoric part of stress (Pa), K2, visualised on the deformed configuration.
+ TxyByy

−
2
αm(θ)
∂αm(θ)
∂θ
∂θ
∂t
+
∂θ
∂x
vx +
∂θ
∂y
vy

Bxy, (74)
where MECH
m in Eqs. (71)–(74) is derived by substituting θ(x, y,t) and the components of
∼
Bκpm(t)
(x,t) into Eq. (38). We
solve the seven equations for the seven unknowns: two components of the displacement field (
∼
u (x,t)), the temperature
field (
∼
θ (x,t)) and four components of the left Cauchy–Green tensor (
∼
Bκpm(t)
(x,t)).
3.3. Material properties
The polymer melt is assumed to be of Polystyrene (PS). High molecular weight atactic PS does not undergo crystallization
(see Chai  Forrest, 2018), and hence is a good candidate for our analysis. The thermal and mechanical properties of PS are
given in Table 1. The mechanical properties provided in Table 1 are associated with the κpm(t) configuration. However, in the
literature, the properties are associated with the κt configuration. Therefore, we have assumed the values to lie in a ballpark
range of the actual values. Since the values of shear modulus and bulk modulus given in Table 1 are towards the higher end
at temperatures above θg, it leads to a very small relaxation time (
η◦
1
μm
1
= 10−6 sec) for the melt. However, this seems to be
a reasonable approximation.
15
P. Sreejith, K. Kannan and K. Rajagopal International Journal of Engineering Science 159 (2021) 103412
Fig. 5. Continued
3.4. Initial and boundary conditions
The first layer of the melt is laid instantaneously on the substrate (which is assumed to be at the ambient temperature
θsub = 27◦C throughout the process) at time t = 0 second. The surface that is in contact with the substrate is fixed along with
the substrate acting as a heat sink. Free convection and traction free conditions are assumed on the outer surfaces (refer
to Fig. 2a). The layer is then allowed to cool for one second, at the end of which, the second layer is laid instantaneously
on top of the first layer. Once the second layer is laid, continuity is established between the layers, thus both the layers act
as a single contiguous body (refer to Fig. 2b), i.e., we assume a perfect interface between the layers. The third and fourth
layers are laid similarly one after the other with an interval of one second each (refer to Fig. 2c and Fig. 2d). After all
the layers have been laid, the entire system cools till the temperature field attains a value close to the ambient temperature
(preferably 27◦C). Symmetry conditions have been imposed to reduce the computational time (refer to Fig. 2a, Fig. 2b, Fig. 2c
and Fig. 2d). The first, second, third and fourth layers have an aspect ratio of 80:1,76:1, 72:1 and 68:1 respectively.
Before each layer is laid, the layer is at 241◦C, which is 1◦C above the melting point of Polystyrene (PS). At this temper-
ature, the isotropic volume contraction/expansion (αm(
∼
θ)) is unity along with
∼
Bκpm(t)
(x,t) being identity, i.e.,

αm(θo)I

=
∼
Bκpm(t)

=

1 0 0
0 1 0
0 0 1

at t = 0 second (75)
16
P. Sreejith, K. Kannan and K. Rajagopal International Journal of Engineering Science 159 (2021) 103412
Fig. 6. Banded contour plots of the modes of deformation, (K3 invariant of the stress tensor), visualised on the deformed configuration. The dark red zones
at the stepped end is close to uniaxial tension and dark blue zones at the core of the geometry is close to equibiaxial tension throughout the process.
3.5. Implementation
Representing non-linear equations in the Lagrangian description and integrating them in the material frame can cause
excessive mesh distortions. This shortcoming of the method is because, each of the nodes of the mesh, follow the corre-
sponding material points during the motion. The Eulerian description in which the nodes remain fixed while the material
distorts, overcomes the above deficiency. However, it compromises the numerical accuracy of the solution while computing
with coarse meshes. It also fails to precisely identify the interface between the domains, leading to poor numerical accuracy
of the interfacial fluxes.
The disadvantages of both the descriptions can be avoided by using the Arbitrary Lagrangian–Eulerian (ALE) method.
ALE combines the best features of both the Lagrangian and Eulerian descriptions. Each node of the ALE mesh is free to
either remain fixed or rezone itself (see Donea, Huerta, Ponthot,  Rodríguez-Ferran, 2004), thus avoiding excessive mesh
distortions and at the same time predicting the domain interfaces with better accuracy. It also provides comparatively better
numerical accuracy of the solutions than the Eulerian approach.
The non-linear equations, Eqs. (68)–(74), have been solved using “Coefficient Form PDE” module in COMSOL
Multiphysics
TM
. The coefficients of the general PDE in the module, are populated by extracting the respective coefficients
of the governing equations by using a MATLAB code. It is to be noted that the equations are provided to the module with
respect to the spatial frame and are integrated in time by using the BDF method. The order of the scheme varies from 1 to
5 with free time stepping.
17
P. Sreejith, K. Kannan and K. Rajagopal International Journal of Engineering Science 159 (2021) 103412
Fig. 6. Continued
3.6. Results and discussion
3.6.1. Volumetric shrinkage and residual stresses
Temperature in the melt starts reducing as heat flows out through the free surfaces into the surroundings and through
the fixed surface into the substrate (note that the rate of heat flow is higher into the substrate) and consequently αm(θ)
begins to fall. Due to the rapid cooling process, the temperature reaches the ambient value in about 60 s. The temperature
distribution in the layers is given in Fig. 3 and the value of temperature (θ) is higher towards the core than towards the
surface, as is to be expected.
Volumetric shrinkage in the first three seconds is not too evident. This can be attributed to the re-heating of the relatively
cooler layer each time continuity is established between consecutive layers. Once all the layers are laid, and the entire
system starts cooling, the volumetric shrinkage becomes strikingly apparent. The reference configuration of the layers have
been superimposed on all the plots, and it indicates the final volume to be approximately 9% less than the initial volume
(refer to Figs. 3d–7d). The arrows superimposed on the plots represent the local displacement vector during the process.
As the material cools from the edges of the geometry, it is being pulled in, i.e., the ux components of the displacement
field are positive and uy components are negative (the orientation of the basis are given in Fig. 2). Towards the core, the ux
components become negligible and only the uy components survive. However, when the existing layers are re-heated each
time a new layer is laid, the core of the geometry starts expanding due to the inflow of heat, which leads to negative ux
components and positive uy components at the core, although, the net effect of uy is in the negative direction throughout
the material. Thus, the resultant displacement vectors near the corners would be directed downwards at an acute angle
18
P. Sreejith, K. Kannan and K. Rajagopal International Journal of Engineering Science 159 (2021) 103412
Fig. 7. Banded contour plots of the total rate of entropy production (ξtot
m ) visualised on the deformed configuration.
(clockwise) with respect to the x-direction, whereas the resultant displacement vectors at the core would be initially di-
rected downwards (refer to Figs. 3a–7a), and later due to re-heating, as time proceeds it would be directed downwards at
an obtuse angle (clockwise) with respect to the x-direction (refer to Figs. 3d–7d).
The thermal and mechanical interactions lead to a complicated distribution of the residual stresses (refer to Figs. 4 and 5)
and consequently the modes of deformation (refer to Fig. 6). The complexity is profound in the vicinity of the stepped geom-
etry, whereas towards the opposite end, the distribution becomes one dimensional, i.e., in the y-direction. The magnitude
of the stresses are negligible during the initial time steps (refer to Fig. 4a–4c and Fig. 5a–5c) due to the relatively lower
volume shrikange. Re-heating of the layers, each time continuity is established, further adds to the relaxation of stresses.
Magnitude of the stresses shoot up drastically when the temperature falls below θg, which is expected since the viscosity
of the polymer increases sharply at θg, and finally, the stresses freeze when the temperature is sufficiently below θg (refer
to Figs. 3d, 4d and 5d). Another reason for a large magnitude of stresses being induced in the material (refer to Figs. 4d and
5d), is due to the high rate of cooling (refer to Table1), which does not give enough time for the material to undergo stress
relaxation.
To understand the distribution of the modes, we consider a shear superposed unequi-triaxial stress state of the material
points. We mark points A, B and C on three different zones corresponding to three different modes of deformation, as
shown in the Fig. 6d. Note that the plane strain assumption constrains stress in the z-direction, i.e. Tzz, to remain positive
throughout the process. The stress state at point “A” is given by: Txx = 0.5 MPa, Tyy = 0.73 MPa, Tzz = 27.7 MPa and Txy
= -0.19 MPa. The magnitude of the Tzz component is two orders higher than Txx, Tyy and Txy components. Therefore, we
can conclude that the mode of deformation of the material point “A” is close to uniaxial tension in the z-direction with
K3 ≈ 0.52. Similarly, the mode of deformation of other points lying in the same zone will be close to uniaxial tension in the
z-direction.
19
P. Sreejith, K. Kannan and K. Rajagopal International Journal of Engineering Science 159 (2021) 103412
Fig. 7. Continued
Next, the stress state at point “B” is given by: Txx = 16.6 MPa, Tyy = -0.186 MPa, Tzz = 34.8 MPa and Txy = 5.13 MPa.
The Txy component is quite significant, and therefore, the zone in which point “B” lies is close to a pure shear mode of
deformation with K3 ≈ 0. Finally, the stress state at point “C” is given by: Txx = 45.2 MPa, Tyy = -1.49 MPa, Tzz = 47.5 MPa
and Txy = 9.56 MPa. Txx and Tzz components are approximately same and positive. Also, they are one order higher than
that of Tyy (which is negative) and Txy. Therefore, the mode of deformation at point “C” is close to equibiaxial tension, and
hence, the zone in which point “C” lies has K3 ≈ −0.52. Subsequently, we conclude that, the material at the top corners of
all the layers are close to uniaxial tension, while the material at the core is close to equibiaxial tension.
The ratio of mean normal stress (
K1
√
3
) to the norm of the deviatoric stresses (K2) is much less than 1 at the top corners
of the layers and close to 1 at the core. Therefore, the corners are dominated by the distortional stresses, whereas, the core
is dominated by the mean normal stress, implying that, dimensional instability is more at the corners than at the core.
This is further supported by the bulging and the warping observed in the neighbourhood of the stepping at the final stages
of the simulation (refer to Figs. 3d–7d). Warping can also be understood based on the direction of the components of the
displacement fields at the top corners, where, ux is positive and uy is negative. Therefore, the material at the topmost corner
will get pushed out, leading to warping.
During the entire process, the total rate of entropy production has to be maintained non-negative. This needs to be
checked a posteriori at every time step of the process. The plots of total rate of entropy production at some chosen time
steps have been given in Fig. 7a–7d, and the values remain positive as expected.
3.6.2. Stress concentrations and delamination
In a practical setting, the interfaces between the layers have discontinuities, and therefore, the inter-layer strength is
usually the weakest, which often causes delamination of the layers for a component fabricated by FDM. Even though, in
the current analysis, the interfaces are perfect, we assume that the layers have a “tendency” to delaminate. Fig. 8 helps us
20
P. Sreejith, K. Kannan and K. Rajagopal International Journal of Engineering Science 159 (2021) 103412
Fig. 8. The stress components (Txy and Tyy) that are responsible for delamination (combination of mode I and mode II) of the layers, visualised along the
length of all the three interfaces (semi-log plot), after the melt has solidified (t = 60 s).
visualise the stress components responsible for delamination along the length of each of the interfaces. Only Tyy and Txy
components of the stress tensor cause delamination. Tyy component tends to pull the layers apart (mode I delamination),
whereas, Txy component tends to slide the layers in the plane of the interface (mode II delamination). It is observed that,
Tyy component becomes compressive in the region that is sufficiently away from the stepped end. Therefore, in this region,
delamination can occur only due to the Txy component (mode II delamination). The tendency to delaminate is the highest
for the interface between the first and the second layer.
The effect of mode I and mode II delamination tendencies, and the traction free condition on the free edges, lead to
the formation of stress concentrations in the neighbourhood of the stepping (refer to Fig. 5d). If delamination occurs, and
the interface breaks apart near the stepping, the stress concentrations would be relieved. The stress components are the
highest (order of seven and eight) in the region of the stress concentration of the first layer. Therefore, yielding is most
likely to occur in this region and lead to a ductile failure termed as “intra-layer fracture”. Usually, inter-layer fracture due
to delamination and other discontinuities are the most common type of failure, compared to the intra-layer fracture caused
by stress concentrations (see de Macedo  Ferreira, 2017). Therefore, a component fabricated by FDM, when in service, will
most probably fail due to the delaminated interfaces termed as“inter-layer fracture”.
4. Conclusion
A thermodynamic framework was developed to determine the differential volumetric shrinkage caused by drastic tem-
perature gradients, the ensuing residual stresses and consequently the dimensional instability of the geometry, by building
on an existing theory which required the definition of two primitives: Helmholtz free energy and the rate of entropy pro-
duction. The theory is most suitable for processes that use amorphous polymers or polymers which do not crystallize much.
The efficacy of the constitutive relation was verified by considering a prototypical FDM process in which four layers of
polystyrene melt were laid, such that, plane strain conditions could be enforced.
As soon as the layers were laid, it underwent a complex thermo-mechanical process which included rapid cooling, re-
heating, solidification at the glass transition temperature (θg) and redistribution of the residual stresses. Although, a high
value of the shear modulus caused stresses in the range of kilo Pascals in the melt phase, it is quite insignificant as com-
pared to the stresses in the solid phase. This result is in keeping with the reasoning put forward by Xinhua et al. (2015),
Wang et al. (2007), Park (2005) and de Macedo and Ferreira (2017), who have confined the analysis to the solidified polymer
since the stresses in the melt phase can be assumed to be negligible. The mean normal stress distribution at the final time
step (refer to Fig. 4d) seems to follow a similar trend, in comparison to the mean normal stress distribution reported by
Xia et al. (2018b) (refer to Fig. 8 in Xia et al., 2018b).
The plane strain approximation caused the outer corners of the layers to be close to uniaxial tension and the core to
be close to equibiaxial tension. During service, there is a high probability for a pre-existing crack at the core to open up
in the x − z plane due to the equibiaxial tension. Further, in a practical setting, analogous to the current analysis, if the
interfaces are highly porous, a large amount of inter-layer fracture (a combination of mode I and mode II) is expected at the
stepped ends as compared to intra-layer fractures caused by stress concentrations. Another major dimensional instability
that occurrs is the warping of the geometry. Warping can be reduced by making the corners in the stepping smoother.
More smooth the corners are, less the degree of warping. The possibility of delamination, warping and the magnitudes of the
stress concentrations, can be reduced by choosing the right combination of rate of cooling, substrate temperature, re-heating
and the geometry for the PS layers, which reduces the magnitude of the “freezed in” stresses (see Macedo de Macedo 
Ferreira, 2017).
21
P. Sreejith, K. Kannan and K. Rajagopal International Journal of Engineering Science 159 (2021) 103412
Declaration of Competing Interest
The authors have no conflict of interest.
References
Armillotta, A., Bellotti, M.,  Cavallaro, M. (2018). Warpage of FDM parts: Experimental tests and analytic model. Robotics and Computer-Integrated Manufac-
turing, 50, 140–152. https://doi.org/10.1016/j.rcim.2017.09.007.
Avrami, M. (1939). Kinetics of phase change. I general theory. The Journal of Chemical Physics, 7(12), 1103–1112. https://doi.org/10.1063/1.1750380.
Borges, R. A., Choudhury, D.,  Zou, M. (2018). 3D printed PCU/UHMWPE polymeric blend for artificial knee meniscus. Tribology International, 122, 1–7.
https://doi.org/10.1016/j.triboint.2018.01.065.
Casavola, C., Cazzato, A., Moramarco, V.,  Pappalettera, G. (2017). Residual stress measurement in fused deposition modelling parts. Polymer Testing, 58,
249–255. https://doi.org/10.1016/j.polymertesting.2017.01.003.
Casavola, C., Cazzato, A., Moramarco, V.,  Pappalettere, C. (2016). Orthotropic mechanical properties of fused deposition modelling parts described by
classical laminate theory. Materials  Design, 90, 453–458. https://doi.org/10.1016/j.matdes.2015.11.009.
Cattenone, A., Morganti, S., Alaimo, G.,  Auricchio, F. (2018). Finite element analysis of additive manufacturing based on fused deposition modeling: Dis-
tortions prediction and comparison with experimental data. Journal of Manufacturing Science and Engineering, 141(1). https://doi.org/10.1115/1.4041626.
011010
Chai, Y.,  Forrest, J. A. (2018). Using atomic force microscopy to probe crystallization in atactic polystyrenes. Macromolecular Chemistry and Physics, 219(3),
1700466. https://doi.org/10.1002/macp.201700466.
Chaoui, K., Chudnovsky, A.,  Moet, A. (1987). Effect of residual stress on crack propagation in MDPE pipes. Journal of Materials Science, 22, 3873–3879.
Chen, M., Tan, Y.,  Wang, B. (2012). General invariant representations of the constitutive equations for isotropic nonlinearly elastic materials. International
Journal of Solids and Structures, 49(2), 318–327. https://doi.org/10.1016/j.ijsolstr.2011.10.008.
Comminal, R., Serdeczny, M. P., Pedersen, D. B.,  Spangenberg, J. (2018). Numerical modeling of the strand deposition flow in extrusion-based additive
manufacturing. Additive Manufacturing, 20, 68–76. https://doi.org/10.1016/j.addma.2017.12.013.
Costa, S., Duarte, F.,  Covas, J. (2015). Thermal conditions affecting heat transfer in FDM/FFE: A contribution towards the numerical modelling of the
process. Virtual and Physical Prototyping, 10(1), 35–46. https://doi.org/10.1080/17452759.2014.984042.
Dabiri, S., Schmid, S.,  Tryggvason, G. (2014). Fully resolved numerical simulations of fused deposition modeling. In Proceedings of the ASME international
manufacturing  science and engineering conference. In MSEC 2014. Detroit
Doi, M.,  Edwards, S. F. (1986). The theory of polymer dynamics. Walton Street, Oxford: Oxford University Press.
Donea, J., Huerta, A., Ponthot, J.-P.,  Rodríguez-Ferran, A. (2004). Arbitrary Lagrangian-Eulerian methods. Encyclopedia of computational mechanics. American
Cancer Society. https://doi.org/10.1002/0470091355.ecm009.
El Moumen, A., Tarfaoui, M.,  Lafdi, K. (2019). Modelling of the temperature and residual stress fields during 3d printing of polymer composites. The
International Journal of Advanced Manufacturing Technology, 104, 1661–1676. https://doi.org/10.1007/s00170-019-03965-y.
Espalin, D., Arcaute, K., Rodriguez, D., Medina, F., Posner, M.,  Wicker, R. (2010). Fused deposition modeling of patient-specific polymethylmethacrylate
implants. Rapid Prototyping Journal, 16(3), 164–173. https://doi.org/10.1108/13552541011034825.
Freitag, L., Gördes, M., Zarogoulidis, P., Darwiche, K., Franzen, D., Funke, F., . . . Dutau, H. (2017). Towards individualized tracheobronchial stents: Technical,
practical and legal considerations.. Respiration: Interventional Pulmonology, 94, 442–456. https://doi.org/10.1159/000479164.
González-Henríquez, C. M., Sarabia-Vallejos, M. A.,  Rodriguez-Hernandez, J. (2019). Polymers for additive manufacturing and 4d-printing: materials,
methodologies, and biomedical applications. Progress in Polymer Science, 94, 57–116. https://doi.org/10.1016/j.progpolymsci.2019.03.001.
Green, A. E.,  Naghdi, P. M. (1977). On thermodynamics and the nature of the second law. Proceedings of the Royal Society of London. A. Mathematical and
Physical Sciences, 357(1690), 253–270. https://doi.org/10.1098/rspa.1977.0166.
Han, X., Yang, D., Yang, C., Spintzyk, S., Scheideler, L., Li, P., . . . Rupp, F. (2019). Carbon fiber reinforced peek composites based on 3D-printing technology
for orthopedic and dental applications. Journal of Clinical Medicine, 8(2). https://doi.org/10.3390/jcm8020240.
Harish, S.,  Devadath, V. R. (2015). Additive manufacturing and analysis of tibial insert in total knee replacement implant. International Research Journal of
Engineering and Technology, 02, 633–638.
Haynes, W. M. (2014). Hand book of chemistry and physics. 6000 Broken Sound Parkway NW, Suite 300: CRC Press.
Hornberger, L. E.,  Devries, K. L. (October 1987). The effects of residual stress on the mechanical properties of glassy polymers. Polymer Engineering and
Science, 27(19), 1473–1478.
Kamal, M. R., Rai-Fook, R. A.,  Hernandez-Aguilar, J. R. (May 2002). Residual thermal stresses in injection moldings of thermoplastics: A theoretical and
experimental study. Polymer-Plastics Technology and Engineering, 42(5), 1098–1114.
Kannan, K.,  Rajagopal, K. R. (2004). A thermomechanical framework for the transition of a miscoelastic liquid to a viscoelastic solid. Mathematics and
Mechanics of Solids, 9(1), 37–59. https://doi.org/10.1177/1081286503035198.
Kannan, K.,  Rajagopal, K. R. (2005). Simulation of fiber spinning including flow-induced crystallization. Journal of Rheology, 49(3), 683–703. https://doi.
org/10.1122/1.1879042.
Kannan, K., Rao, I. J.,  Rajagopal, K. R. (2002). A thermomechanical framework for the glass transition phenomenon in certain polymers and its application
to fiber spinning. Journal of Rheology, 46(4), 977–999. https://doi.org/10.1122/1.1485281.
ten Kate, J., Smit, G.,  Breedveld, P. (2017). 3D-printed upper limb prostheses: A review. Disability and Rehabilitation: Assistive Technology, 12(3), 300–314.
https://doi.org/10.1080/17483107.2016.1253117. PMID: 28152642
Kim, T., Trangkanukulkij, R.,  Kim, W. (2018). Nozzle shape guided filler orientation in 3d printed photo-curable nanocomposites. Scientific Reports, 8,
57–116. https://doi.org/10.1038/s41598-018-22107-0.
van Krevelen, D.,  te Nijenhuis, K. (2009). Properties of polymers, fourth edition: Their correlation with chemical structure; their numerical estimation and
prediction from additive group contributions. Linacre House, Jordan Hill, Oxford OX2 8DP, UK: Elsevier Science.
Liu, J., Anderson, K. L.,  Sridhar, N. (2020). Direct simulation of polymer fused deposition modeling (FDM) an implementation of the multi-phase viscoelas-
tic solver in OpenFOAM. International Journal of Computational Methods, 17(01), 1844002. https://doi.org/10.1142/S0219876218440024.
Löffler, R.,  Koch, M. (2019). Innovative extruder concept for fast and efficient additive manufacturing. IFAC-PapersOnLine, 52(10), 242–247. https://doi.org/
10.1016/j.ifacol.2019.10.071. 13th IFAC Workshop on Intelligent Manufacturing Systems IMS 2019
de Macedo, R. Q.,  Ferreira, R. T. L. (2017). Residual thermal stress in fused deposition modelling. ABCM International Congress of Mechanical Engineering.
https://doi.org/10.26678/ABCM.COBEM2017.COB17-0124.
Mark, J. E. (1999). Polymer data handbook. New York 10016: Oxford University Press.
Marti, E., Kaisersberger, E.,  Moukhina, E. (2006). Heat capacity functions of polystyrene in glassy and in liquid amorphous state and glass transition.
Journal of Thermal Analysis and Calorimetry, 85, 505–525. https://doi.org/10.1007/s10973-006-7745-5.
Melchels, F. P., Domingos, M. A., Klein, T. J., Malda, J., Bartolo, P. J.,  Hutmacher, D. W. (2012). Additive manufacturing of tissues and organs. Progress in
Polymer Science, 37(8), 1079–1104. https://doi.org/10.1016/j.progpolymsci.2011.11.007. Topical Issue on Biorelated polymers
Melocchi, A., Parietti, F., Maroni, A., Foppoli, A., Gazzaniga, A.,  Zema, L. (2016). Hot-melt extruded filaments based on pharmaceutical grade polymers for
3D printing by fused deposition modeling. International Journal of Pharmaceutics, 509(1), 255–263. https://doi.org/10.1016/j.ijpharm.2016.05.036.
Miller, A. A. (1968). Analysis of the melt viscosity and glass transition of polystyrene. Journal of Polymer Science Part A-2: Polymer Physics, 6(6), 1161–1175.
https://doi.org/10.1002/pol.1968.160060609.
22
P. Sreejith, K. Kannan and K. Rajagopal International Journal of Engineering Science 159 (2021) 103412
Muller, D., Chim, H., Bader, A., Whiteman, M.,  Schantz, J.-T. (2010). Vascular guidance: microstructural scaffold patterning for inductive neovascularization.
Stem Cells International, 2011, 547247. https://doi.org/10.4061/2011/547247.
Northcutt, L. A., Orski, S. V., Migler, K. B.,  Kotula, A. P. (2018). Effect of processing conditions on crystallization kinetics during materials extrusion additive
manufacturing. Polymer, 154, 182–187. https://doi.org/10.1016/j.polymer.2018.09.018.
Nyberg, E. L., Farris, A. L., Hung, B. P., Dias, M., Garcia, J. R., Dorafshar, A. H.,  Grayson, W. L. (2017). 3D-printing technologies for craniofacial rehabilitation,
reconstruction, and regeneration. Annals of Biomedical Engineering, 45(1), 45–57. https://doi.org/10.1007/s10439-016-1668-5.
Park, K. (2005). A study on flow simulation and deformation analysis for injection-molded plastic parts using three-dimensional solid elements. Polymer–
Plastics Technology and Engineering, 43(5), 1569–1585.
Rajagopal, K.,  Srinivasa, A. (2000). A thermodynamic frame work for rate type fluid models. Journal of non-Newtonian Fluid Mechanics, 88(3), 207–227.
https://doi.org/10.1016/S0377-0257(99)00023-3.
Rajagopal, K. R.,  Srinivasa, A. R. (2004a). On the thermomechanics of materials that have multiple natural configurations part i: Viscoelasticity and
classical plasticity. Zeitschrift für angewandte Mathematik und Physik ZAMP, 55(5), 861–893. https://doi.org/10.1007/s00033-004-4019-6.
Rajagopal, K. R.,  Srinivasa, A. R. (2004b). On thermomechanical restrictions of continua. Proceedings of the Royal Society of London. Series A: Mathematical,
Physical and Engineering Sciences, 460(2042), 631–651. https://doi.org/10.1098/rspa.2002.1111.
Rao, I.,  Rajagopal, K. (2001). A study of strain-induced crystallization of polymers. International Journal of Solids and Structures, 38(6), 1149–1167. https:
//doi.org/10.1016/S0020-7683(00)00079-2.
Rao, I. J.,  Rajagopal, K. R. (2000). Phenomenological modelling of polymer crystallization using the notion of multiple natural configurations. Interfaces
and Free Boundaries, 2, 73–94.
Rao, I. J.,  Rajagopal, K. R. (2002). A thermodynamic framework for the study of crystallization in polymers. Zeitschrift fur Angewandte Mathematik und
Physik, 53, 365–406. https://doi.org/10.1007/s00033-002-8161-8.
So, P.,  Broutman, L. J. (December 1976). Residual stresses in polymers and their effect on mechanical behavior. Polymer Engineering and Science, 16(12),
785–791.
Sombatsompop, N.,  Wood, A. (1997). Measurement of thermal conductivity of polymers using an improved Lee’s disc apparatus. Polymer Testing, 16(3),
203–223. https://doi.org/10.1016/S0142-9418(96)00043-8.
Song, Y., Li, Y., Song, W., Yee, K., Lee, K.-Y.,  Tagarielli, V. (2017). Measurements of the mechanical response of unidirectional 3D-printed PLA. Materials 
Design, 123, 154–164. https://doi.org/10.1016/j.matdes.2017.03.051.
Sood, A. K., Ohdar, R. K.,  Mahapatra, S. S. (2010). Parametric appraisal of mechanical property of fused deposition modelling processed parts. Materials
and Design, 31, 287–295. https://doi.org/10.1016/j.matdes.2009.06.016.
Syuhada, G., Ramahdita, G., Rahyussalim, A. J.,  Whulanza, Y. (2018). Multi-material poly(lactic acid) scaffold fabricated via fused deposition modeling and
direct hydroxyapatite injection as spacers in laminoplasty. AIP Conference Proceedings, 1933(1), 020008. https://doi.org/10.1063/1.5023942.
Vaezi, M.,  Yang, S. (2015). Extrusion-based additive manufacturing of peek for biomedical applications. Virtual and Physical Prototyping, 10(3), 123–135.
https://doi.org/10.1080/17452759.2015.1097053.
Wang, T.-M., Xi, J.-T.,  Jin, Y. (2007). A model research for prototype warp deformation in the FDM process. The International Journal of Advanced Manufac-
turing Technology, 33(11), 1087–1096. https://doi.org/10.1007/s00170-006-0556-9.
Xia, H., Lu, J., Dabiri, S.,  Tryggvason, G. (2018a). Fully resolved numerical simulations of fused deposition modeling. part i: Fluid flow. Rapid Prototyping
Journal, 24(2), 463–476.
Xia, H., Lu, J.,  Tryggvason, G. (2018b). Fully resolved numerical simulations of fused deposition modeling. part ii solidification, residual stresses and
modeling of the nozzle. Rapid Prototyping Journal, 24(6), 973–987.
Xinhua, L., Shengpeng, L., Zhou, L., Xianhua, Z., Xiaohu, C.,  Zhongbin, W. (2015). An investigation on distortion of PLA thin-plate part in the FDM process.
The International Journal of Advanced Manufacturing Technology, 79(5), 1117–1126. https://doi.org/10.1007/s00170-015-6893-9.
Zoetelief, W. F., Douven, L. F. A.,  Housz, A. J. I. (1996). Residual thermal stresses in injection molded products. Polymer Engineering and Science, 36(14),
1886–1896.
23

More Related Content

Similar to A thermodynamic framework for additive manufacturing.pdf

Effect of coefficient of friction in finite element modeling sanjeev n k
Effect of coefficient of friction in finite element modeling sanjeev n kEffect of coefficient of friction in finite element modeling sanjeev n k
Effect of coefficient of friction in finite element modeling sanjeev n ksanjeevnks
 
Discrete element modeling of micro feature hot compaction process
Discrete element modeling of micro feature hot compaction processDiscrete element modeling of micro feature hot compaction process
Discrete element modeling of micro feature hot compaction processPeng Chen
 
Computational study of film cooling in hypersonic flows
Computational study of film cooling in hypersonic flowsComputational study of film cooling in hypersonic flows
Computational study of film cooling in hypersonic flowsIAEME Publication
 
Design and analysis of Stress on Thick Walled Cylinder with and with out Holes
Design and analysis of Stress on Thick Walled Cylinder with and with out HolesDesign and analysis of Stress on Thick Walled Cylinder with and with out Holes
Design and analysis of Stress on Thick Walled Cylinder with and with out HolesIJERA Editor
 
A Review on Finite Element Analysis of Automobile roof header Manufactured By...
A Review on Finite Element Analysis of Automobile roof header Manufactured By...A Review on Finite Element Analysis of Automobile roof header Manufactured By...
A Review on Finite Element Analysis of Automobile roof header Manufactured By...ijiert bestjournal
 
FEA based Dissipation Energy and Temperature Distribution of Rubber Bushing
FEA based Dissipation Energy and Temperature Distribution of Rubber BushingFEA based Dissipation Energy and Temperature Distribution of Rubber Bushing
FEA based Dissipation Energy and Temperature Distribution of Rubber BushingIJERA Editor
 
Analysis & modelling of thermal mechanical fatigue crack propagat
Analysis & modelling of thermal mechanical fatigue crack propagatAnalysis & modelling of thermal mechanical fatigue crack propagat
Analysis & modelling of thermal mechanical fatigue crack propagatIAEME Publication
 
sandeepkashyapcolliquium-170129204606.pdf
sandeepkashyapcolliquium-170129204606.pdfsandeepkashyapcolliquium-170129204606.pdf
sandeepkashyapcolliquium-170129204606.pdfdanere2178
 
COMPOSITE FABRICATION TECHNIQUES
COMPOSITE FABRICATION TECHNIQUESCOMPOSITE FABRICATION TECHNIQUES
COMPOSITE FABRICATION TECHNIQUESMNNIT Allahabad
 
INFLUENCE MECHANISM OF THICKNESS AND VISCOSITY OF FLAT ENERGY DIRECTOR TO THE...
INFLUENCE MECHANISM OF THICKNESS AND VISCOSITY OF FLAT ENERGY DIRECTOR TO THE...INFLUENCE MECHANISM OF THICKNESS AND VISCOSITY OF FLAT ENERGY DIRECTOR TO THE...
INFLUENCE MECHANISM OF THICKNESS AND VISCOSITY OF FLAT ENERGY DIRECTOR TO THE...adeij1
 
Experimental Analysis and Investigation for Thermal Behaviour of Ventilated D...
Experimental Analysis and Investigation for Thermal Behaviour of Ventilated D...Experimental Analysis and Investigation for Thermal Behaviour of Ventilated D...
Experimental Analysis and Investigation for Thermal Behaviour of Ventilated D...ijsrd.com
 
Numerical Analysis of Hygrothermal Effect on Laminated Composite Plates
Numerical Analysis of Hygrothermal Effect on Laminated Composite PlatesNumerical Analysis of Hygrothermal Effect on Laminated Composite Plates
Numerical Analysis of Hygrothermal Effect on Laminated Composite PlatesIRJET Journal
 
THERMAL AND STRUCTURAL ANALYSIS OF AN EXHAUST MANIFOLD OF A MULTI CYLINDER EN...
THERMAL AND STRUCTURAL ANALYSIS OF AN EXHAUST MANIFOLD OF A MULTI CYLINDER EN...THERMAL AND STRUCTURAL ANALYSIS OF AN EXHAUST MANIFOLD OF A MULTI CYLINDER EN...
THERMAL AND STRUCTURAL ANALYSIS OF AN EXHAUST MANIFOLD OF A MULTI CYLINDER EN...IAEME Publication
 
Tool and jigs stretch blow molding
Tool and jigs stretch blow molding Tool and jigs stretch blow molding
Tool and jigs stretch blow molding ALEMNEW DESALEGN
 
Investigation into the effects of delamination parameters of the layered compo
Investigation into the effects of delamination parameters of the layered compoInvestigation into the effects of delamination parameters of the layered compo
Investigation into the effects of delamination parameters of the layered compoIAEME Publication
 
ManufacturingInducedDistortion_Composites
ManufacturingInducedDistortion_CompositesManufacturingInducedDistortion_Composites
ManufacturingInducedDistortion_CompositesMathilde Chabin
 
Thermal analysis of FGM plates using FEM method
Thermal analysis of FGM plates using FEM methodThermal analysis of FGM plates using FEM method
Thermal analysis of FGM plates using FEM methodRajani Dalal
 
Research problem statementThe main problem is to achieve mecha.docx
Research problem statementThe main problem is to achieve mecha.docxResearch problem statementThe main problem is to achieve mecha.docx
Research problem statementThe main problem is to achieve mecha.docxkhanpaulita
 

Similar to A thermodynamic framework for additive manufacturing.pdf (20)

Effect of coefficient of friction in finite element modeling sanjeev n k
Effect of coefficient of friction in finite element modeling sanjeev n kEffect of coefficient of friction in finite element modeling sanjeev n k
Effect of coefficient of friction in finite element modeling sanjeev n k
 
3D PRINTING.pdf
3D PRINTING.pdf3D PRINTING.pdf
3D PRINTING.pdf
 
Discrete element modeling of micro feature hot compaction process
Discrete element modeling of micro feature hot compaction processDiscrete element modeling of micro feature hot compaction process
Discrete element modeling of micro feature hot compaction process
 
Computational study of film cooling in hypersonic flows
Computational study of film cooling in hypersonic flowsComputational study of film cooling in hypersonic flows
Computational study of film cooling in hypersonic flows
 
Design and analysis of Stress on Thick Walled Cylinder with and with out Holes
Design and analysis of Stress on Thick Walled Cylinder with and with out HolesDesign and analysis of Stress on Thick Walled Cylinder with and with out Holes
Design and analysis of Stress on Thick Walled Cylinder with and with out Holes
 
A Review on Finite Element Analysis of Automobile roof header Manufactured By...
A Review on Finite Element Analysis of Automobile roof header Manufactured By...A Review on Finite Element Analysis of Automobile roof header Manufactured By...
A Review on Finite Element Analysis of Automobile roof header Manufactured By...
 
FEA based Dissipation Energy and Temperature Distribution of Rubber Bushing
FEA based Dissipation Energy and Temperature Distribution of Rubber BushingFEA based Dissipation Energy and Temperature Distribution of Rubber Bushing
FEA based Dissipation Energy and Temperature Distribution of Rubber Bushing
 
FEA based Dissipation Energy and Temperature Distribution of Rubber Bushing
FEA based Dissipation Energy and Temperature Distribution of Rubber BushingFEA based Dissipation Energy and Temperature Distribution of Rubber Bushing
FEA based Dissipation Energy and Temperature Distribution of Rubber Bushing
 
Analysis & modelling of thermal mechanical fatigue crack propagat
Analysis & modelling of thermal mechanical fatigue crack propagatAnalysis & modelling of thermal mechanical fatigue crack propagat
Analysis & modelling of thermal mechanical fatigue crack propagat
 
sandeepkashyapcolliquium-170129204606.pdf
sandeepkashyapcolliquium-170129204606.pdfsandeepkashyapcolliquium-170129204606.pdf
sandeepkashyapcolliquium-170129204606.pdf
 
COMPOSITE FABRICATION TECHNIQUES
COMPOSITE FABRICATION TECHNIQUESCOMPOSITE FABRICATION TECHNIQUES
COMPOSITE FABRICATION TECHNIQUES
 
INFLUENCE MECHANISM OF THICKNESS AND VISCOSITY OF FLAT ENERGY DIRECTOR TO THE...
INFLUENCE MECHANISM OF THICKNESS AND VISCOSITY OF FLAT ENERGY DIRECTOR TO THE...INFLUENCE MECHANISM OF THICKNESS AND VISCOSITY OF FLAT ENERGY DIRECTOR TO THE...
INFLUENCE MECHANISM OF THICKNESS AND VISCOSITY OF FLAT ENERGY DIRECTOR TO THE...
 
Experimental Analysis and Investigation for Thermal Behaviour of Ventilated D...
Experimental Analysis and Investigation for Thermal Behaviour of Ventilated D...Experimental Analysis and Investigation for Thermal Behaviour of Ventilated D...
Experimental Analysis and Investigation for Thermal Behaviour of Ventilated D...
 
Numerical Analysis of Hygrothermal Effect on Laminated Composite Plates
Numerical Analysis of Hygrothermal Effect on Laminated Composite PlatesNumerical Analysis of Hygrothermal Effect on Laminated Composite Plates
Numerical Analysis of Hygrothermal Effect on Laminated Composite Plates
 
THERMAL AND STRUCTURAL ANALYSIS OF AN EXHAUST MANIFOLD OF A MULTI CYLINDER EN...
THERMAL AND STRUCTURAL ANALYSIS OF AN EXHAUST MANIFOLD OF A MULTI CYLINDER EN...THERMAL AND STRUCTURAL ANALYSIS OF AN EXHAUST MANIFOLD OF A MULTI CYLINDER EN...
THERMAL AND STRUCTURAL ANALYSIS OF AN EXHAUST MANIFOLD OF A MULTI CYLINDER EN...
 
Tool and jigs stretch blow molding
Tool and jigs stretch blow molding Tool and jigs stretch blow molding
Tool and jigs stretch blow molding
 
Investigation into the effects of delamination parameters of the layered compo
Investigation into the effects of delamination parameters of the layered compoInvestigation into the effects of delamination parameters of the layered compo
Investigation into the effects of delamination parameters of the layered compo
 
ManufacturingInducedDistortion_Composites
ManufacturingInducedDistortion_CompositesManufacturingInducedDistortion_Composites
ManufacturingInducedDistortion_Composites
 
Thermal analysis of FGM plates using FEM method
Thermal analysis of FGM plates using FEM methodThermal analysis of FGM plates using FEM method
Thermal analysis of FGM plates using FEM method
 
Research problem statementThe main problem is to achieve mecha.docx
Research problem statementThe main problem is to achieve mecha.docxResearch problem statementThe main problem is to achieve mecha.docx
Research problem statementThe main problem is to achieve mecha.docx
 

Recently uploaded

AKTU Computer Networks notes --- Unit 3.pdf
AKTU Computer Networks notes ---  Unit 3.pdfAKTU Computer Networks notes ---  Unit 3.pdf
AKTU Computer Networks notes --- Unit 3.pdfankushspencer015
 
UNIT-V FMM.HYDRAULIC TURBINE - Construction and working
UNIT-V FMM.HYDRAULIC TURBINE - Construction and workingUNIT-V FMM.HYDRAULIC TURBINE - Construction and working
UNIT-V FMM.HYDRAULIC TURBINE - Construction and workingrknatarajan
 
Coefficient of Thermal Expansion and their Importance.pptx
Coefficient of Thermal Expansion and their Importance.pptxCoefficient of Thermal Expansion and their Importance.pptx
Coefficient of Thermal Expansion and their Importance.pptxAsutosh Ranjan
 
Booking open Available Pune Call Girls Pargaon 6297143586 Call Hot Indian Gi...
Booking open Available Pune Call Girls Pargaon  6297143586 Call Hot Indian Gi...Booking open Available Pune Call Girls Pargaon  6297143586 Call Hot Indian Gi...
Booking open Available Pune Call Girls Pargaon 6297143586 Call Hot Indian Gi...Call Girls in Nagpur High Profile
 
Call Girls Service Nashik Vaishnavi 7001305949 Independent Escort Service Nashik
Call Girls Service Nashik Vaishnavi 7001305949 Independent Escort Service NashikCall Girls Service Nashik Vaishnavi 7001305949 Independent Escort Service Nashik
Call Girls Service Nashik Vaishnavi 7001305949 Independent Escort Service NashikCall Girls in Nagpur High Profile
 
Java Programming :Event Handling(Types of Events)
Java Programming :Event Handling(Types of Events)Java Programming :Event Handling(Types of Events)
Java Programming :Event Handling(Types of Events)simmis5
 
MANUFACTURING PROCESS-II UNIT-5 NC MACHINE TOOLS
MANUFACTURING PROCESS-II UNIT-5 NC MACHINE TOOLSMANUFACTURING PROCESS-II UNIT-5 NC MACHINE TOOLS
MANUFACTURING PROCESS-II UNIT-5 NC MACHINE TOOLSSIVASHANKAR N
 
Top Rated Pune Call Girls Budhwar Peth ⟟ 6297143586 ⟟ Call Me For Genuine Se...
Top Rated  Pune Call Girls Budhwar Peth ⟟ 6297143586 ⟟ Call Me For Genuine Se...Top Rated  Pune Call Girls Budhwar Peth ⟟ 6297143586 ⟟ Call Me For Genuine Se...
Top Rated Pune Call Girls Budhwar Peth ⟟ 6297143586 ⟟ Call Me For Genuine Se...Call Girls in Nagpur High Profile
 
Introduction and different types of Ethernet.pptx
Introduction and different types of Ethernet.pptxIntroduction and different types of Ethernet.pptx
Introduction and different types of Ethernet.pptxupamatechverse
 
Call for Papers - Educational Administration: Theory and Practice, E-ISSN: 21...
Call for Papers - Educational Administration: Theory and Practice, E-ISSN: 21...Call for Papers - Educational Administration: Theory and Practice, E-ISSN: 21...
Call for Papers - Educational Administration: Theory and Practice, E-ISSN: 21...Christo Ananth
 
Booking open Available Pune Call Girls Koregaon Park 6297143586 Call Hot Ind...
Booking open Available Pune Call Girls Koregaon Park  6297143586 Call Hot Ind...Booking open Available Pune Call Girls Koregaon Park  6297143586 Call Hot Ind...
Booking open Available Pune Call Girls Koregaon Park 6297143586 Call Hot Ind...Call Girls in Nagpur High Profile
 
BSides Seattle 2024 - Stopping Ethan Hunt From Taking Your Data.pptx
BSides Seattle 2024 - Stopping Ethan Hunt From Taking Your Data.pptxBSides Seattle 2024 - Stopping Ethan Hunt From Taking Your Data.pptx
BSides Seattle 2024 - Stopping Ethan Hunt From Taking Your Data.pptxfenichawla
 
MANUFACTURING PROCESS-II UNIT-1 THEORY OF METAL CUTTING
MANUFACTURING PROCESS-II UNIT-1 THEORY OF METAL CUTTINGMANUFACTURING PROCESS-II UNIT-1 THEORY OF METAL CUTTING
MANUFACTURING PROCESS-II UNIT-1 THEORY OF METAL CUTTINGSIVASHANKAR N
 
(SHREYA) Chakan Call Girls Just Call 7001035870 [ Cash on Delivery ] Pune Esc...
(SHREYA) Chakan Call Girls Just Call 7001035870 [ Cash on Delivery ] Pune Esc...(SHREYA) Chakan Call Girls Just Call 7001035870 [ Cash on Delivery ] Pune Esc...
(SHREYA) Chakan Call Girls Just Call 7001035870 [ Cash on Delivery ] Pune Esc...ranjana rawat
 
ONLINE FOOD ORDER SYSTEM PROJECT REPORT.pdf
ONLINE FOOD ORDER SYSTEM PROJECT REPORT.pdfONLINE FOOD ORDER SYSTEM PROJECT REPORT.pdf
ONLINE FOOD ORDER SYSTEM PROJECT REPORT.pdfKamal Acharya
 
Sheet Pile Wall Design and Construction: A Practical Guide for Civil Engineer...
Sheet Pile Wall Design and Construction: A Practical Guide for Civil Engineer...Sheet Pile Wall Design and Construction: A Practical Guide for Civil Engineer...
Sheet Pile Wall Design and Construction: A Practical Guide for Civil Engineer...Dr.Costas Sachpazis
 
result management system report for college project
result management system report for college projectresult management system report for college project
result management system report for college projectTonystark477637
 
VIP Call Girls Ankleshwar 7001035870 Whatsapp Number, 24/07 Booking
VIP Call Girls Ankleshwar 7001035870 Whatsapp Number, 24/07 BookingVIP Call Girls Ankleshwar 7001035870 Whatsapp Number, 24/07 Booking
VIP Call Girls Ankleshwar 7001035870 Whatsapp Number, 24/07 Bookingdharasingh5698
 

Recently uploaded (20)

AKTU Computer Networks notes --- Unit 3.pdf
AKTU Computer Networks notes ---  Unit 3.pdfAKTU Computer Networks notes ---  Unit 3.pdf
AKTU Computer Networks notes --- Unit 3.pdf
 
UNIT-V FMM.HYDRAULIC TURBINE - Construction and working
UNIT-V FMM.HYDRAULIC TURBINE - Construction and workingUNIT-V FMM.HYDRAULIC TURBINE - Construction and working
UNIT-V FMM.HYDRAULIC TURBINE - Construction and working
 
Coefficient of Thermal Expansion and their Importance.pptx
Coefficient of Thermal Expansion and their Importance.pptxCoefficient of Thermal Expansion and their Importance.pptx
Coefficient of Thermal Expansion and their Importance.pptx
 
Booking open Available Pune Call Girls Pargaon 6297143586 Call Hot Indian Gi...
Booking open Available Pune Call Girls Pargaon  6297143586 Call Hot Indian Gi...Booking open Available Pune Call Girls Pargaon  6297143586 Call Hot Indian Gi...
Booking open Available Pune Call Girls Pargaon 6297143586 Call Hot Indian Gi...
 
Call Girls Service Nashik Vaishnavi 7001305949 Independent Escort Service Nashik
Call Girls Service Nashik Vaishnavi 7001305949 Independent Escort Service NashikCall Girls Service Nashik Vaishnavi 7001305949 Independent Escort Service Nashik
Call Girls Service Nashik Vaishnavi 7001305949 Independent Escort Service Nashik
 
Java Programming :Event Handling(Types of Events)
Java Programming :Event Handling(Types of Events)Java Programming :Event Handling(Types of Events)
Java Programming :Event Handling(Types of Events)
 
MANUFACTURING PROCESS-II UNIT-5 NC MACHINE TOOLS
MANUFACTURING PROCESS-II UNIT-5 NC MACHINE TOOLSMANUFACTURING PROCESS-II UNIT-5 NC MACHINE TOOLS
MANUFACTURING PROCESS-II UNIT-5 NC MACHINE TOOLS
 
Water Industry Process Automation & Control Monthly - April 2024
Water Industry Process Automation & Control Monthly - April 2024Water Industry Process Automation & Control Monthly - April 2024
Water Industry Process Automation & Control Monthly - April 2024
 
Top Rated Pune Call Girls Budhwar Peth ⟟ 6297143586 ⟟ Call Me For Genuine Se...
Top Rated  Pune Call Girls Budhwar Peth ⟟ 6297143586 ⟟ Call Me For Genuine Se...Top Rated  Pune Call Girls Budhwar Peth ⟟ 6297143586 ⟟ Call Me For Genuine Se...
Top Rated Pune Call Girls Budhwar Peth ⟟ 6297143586 ⟟ Call Me For Genuine Se...
 
Introduction and different types of Ethernet.pptx
Introduction and different types of Ethernet.pptxIntroduction and different types of Ethernet.pptx
Introduction and different types of Ethernet.pptx
 
Call for Papers - Educational Administration: Theory and Practice, E-ISSN: 21...
Call for Papers - Educational Administration: Theory and Practice, E-ISSN: 21...Call for Papers - Educational Administration: Theory and Practice, E-ISSN: 21...
Call for Papers - Educational Administration: Theory and Practice, E-ISSN: 21...
 
Booking open Available Pune Call Girls Koregaon Park 6297143586 Call Hot Ind...
Booking open Available Pune Call Girls Koregaon Park  6297143586 Call Hot Ind...Booking open Available Pune Call Girls Koregaon Park  6297143586 Call Hot Ind...
Booking open Available Pune Call Girls Koregaon Park 6297143586 Call Hot Ind...
 
BSides Seattle 2024 - Stopping Ethan Hunt From Taking Your Data.pptx
BSides Seattle 2024 - Stopping Ethan Hunt From Taking Your Data.pptxBSides Seattle 2024 - Stopping Ethan Hunt From Taking Your Data.pptx
BSides Seattle 2024 - Stopping Ethan Hunt From Taking Your Data.pptx
 
MANUFACTURING PROCESS-II UNIT-1 THEORY OF METAL CUTTING
MANUFACTURING PROCESS-II UNIT-1 THEORY OF METAL CUTTINGMANUFACTURING PROCESS-II UNIT-1 THEORY OF METAL CUTTING
MANUFACTURING PROCESS-II UNIT-1 THEORY OF METAL CUTTING
 
(SHREYA) Chakan Call Girls Just Call 7001035870 [ Cash on Delivery ] Pune Esc...
(SHREYA) Chakan Call Girls Just Call 7001035870 [ Cash on Delivery ] Pune Esc...(SHREYA) Chakan Call Girls Just Call 7001035870 [ Cash on Delivery ] Pune Esc...
(SHREYA) Chakan Call Girls Just Call 7001035870 [ Cash on Delivery ] Pune Esc...
 
ONLINE FOOD ORDER SYSTEM PROJECT REPORT.pdf
ONLINE FOOD ORDER SYSTEM PROJECT REPORT.pdfONLINE FOOD ORDER SYSTEM PROJECT REPORT.pdf
ONLINE FOOD ORDER SYSTEM PROJECT REPORT.pdf
 
Sheet Pile Wall Design and Construction: A Practical Guide for Civil Engineer...
Sheet Pile Wall Design and Construction: A Practical Guide for Civil Engineer...Sheet Pile Wall Design and Construction: A Practical Guide for Civil Engineer...
Sheet Pile Wall Design and Construction: A Practical Guide for Civil Engineer...
 
DJARUM4D - SLOT GACOR ONLINE | SLOT DEMO ONLINE
DJARUM4D - SLOT GACOR ONLINE | SLOT DEMO ONLINEDJARUM4D - SLOT GACOR ONLINE | SLOT DEMO ONLINE
DJARUM4D - SLOT GACOR ONLINE | SLOT DEMO ONLINE
 
result management system report for college project
result management system report for college projectresult management system report for college project
result management system report for college project
 
VIP Call Girls Ankleshwar 7001035870 Whatsapp Number, 24/07 Booking
VIP Call Girls Ankleshwar 7001035870 Whatsapp Number, 24/07 BookingVIP Call Girls Ankleshwar 7001035870 Whatsapp Number, 24/07 Booking
VIP Call Girls Ankleshwar 7001035870 Whatsapp Number, 24/07 Booking
 

A thermodynamic framework for additive manufacturing.pdf

  • 1. International Journal of Engineering Science 159 (2021) 103412 Contents lists available at ScienceDirect International Journal of Engineering Science journal homepage: www.elsevier.com/locate/ijengsci A thermodynamic framework for additive manufacturing, using amorphous polymers, capable of predicting residual stress, warpage and shrinkage P Sreejitha , K Kannana , KR Rajagopalb,∗ a Department of Mechanical Engineering, Indian Institute of Technology Madras, Chennai 600036, India b Department of Mechanical Engineering, Texas A&M University, College Station, TX 77804, USA a r t i c l e i n f o Article history: Received 20 September 2020 Accepted 23 October 2020 Available online 10 December 2020 Keywords: Additive manufacturing Residual stress Shrinkage Warpage Flat nozzle Helmholtz free energy Rate of entropy production Mean normal stress Magnitude of stress Nature of the stress state a b s t r a c t A thermodynamic framework has been developed for a class of amorphous polymers used in fused deposition modeling (FDM), in order to predict the residual stresses and the ac- companying distortion of the geometry of the printed part (warping). When a polymeric melt is cooled, the inhomogeneous distribution of temperature causes spatially varying volumetric shrinkage resulting in the generation of residual stresses. Shrinkage is incor- porated into the framework by introducing an isotropic volumetric expansion/contraction in the kinematics of the body. We show that the parameter for shrinkage also appears in the systematically derived rate-type constitutive relation for the stress. The solidification of the melt around the glass transition temperature is emulated by drastically increasing the viscosity of the melt. In order to illustrate the usefulness and efficacy of the constitu- tive relation that has been developed, we consider four ribbons of polymeric melt stacked on top of each other such as those extruded using a flat nozzle: each layer laid instanta- neously and allowed to cool for one second before another layer is laid on it. Each layer cools, shrinks and warps until a new layer is laid, at which time the heat from the newly laid layer flows into the previous laid layer and heats up the bottom layers. The residual stresses of the existing and newly laid layers readjust to satisfy equilibrium. Such mechan- ical and thermal interactions amongst layers result in a complex distribution of residual stresses. The plane strain approximation predicts nearly equibiaxial tensile stress condi- tions in the core region of the solidified part, implying that a preexisting crack in that region is likely to propagate and cause failure of the part during service. The free-end of the interface between the first and the second layer is subjected to the largest magnitude of combined shear and tension in the plane with a propensity for delamination. © 2020 Elsevier Ltd. All rights reserved. 1. Introduction Manufacturing processes such as fused deposition modeling (FDM), extrusion molding, injection molding and blow mold- ing induce residual stresses in the thermoplastic components. Determining these stresses is crucial, since it alters the me- chanical response of the final solidified component. Following instances demonstrate the same: (1) Plastic pipes manufac- ∗ Corresponding author. E-mail address: krajagopal@tamu.edu (K. Rajagopal). https://doi.org/10.1016/j.ijengsci.2020.103412 0020-7225/© 2020 Elsevier Ltd. All rights reserved.
  • 2. P. Sreejith, K. Kannan and K. Rajagopal International Journal of Engineering Science 159 (2021) 103412 tured by extrusion develop compressive residual stresses on the outer surfaces and tensile residual stresses on the inner sur- faces. Creep tests carried out to study crack propagation on v-notched specimens cutout from these plastic pipes, confirmed that compressive stresses hindered crack growth whereas tensile stresses aided it (see Chaoui, Chudnovsky, & Moet, 1987). (2) Similarly, quenching of thermoplastics induce compressive residual stresses in the material. Three point bending tests and Izod impact tests, conducted to determine the fatigue life and impact strength of the quenched specimens, respectively, imply that, the strength increases with the magnitude of the residual stresses (see Hornberger & Devries, October 1987 and So & Broutman, December 1976). In this paper, we attempt to develop a theory to capture the thermodynamic process associated with FDM during the layer by layer fabrication of a polymeric component. We aim to achieve the following: (1) Develop a thermodynamic frame- work that can represent the FDM process. (2) Use the developed model to: (a) Determine the residual stresses induced in the final solidified component due to rapid cooling and (b) capture the dimensional changes (shrinking and warping) of the part, which manifests as a consequence of the residual stresses. In recent years, FDM has been proving to be useful in the fabrication of patient specific transplants, tissue scaffolds and pharmaceutical products (see Melchels et al., 2012; Melocchi et al., 2016). The use of this technology in the medical in- dustry has been growing fast due to the flexibility it offers in fashioning products, such as tools for surgical planning and medical implants. For instance, it has replaced solvent casting, fiber-bonding, membrane lamination, melt molding, and gas forming, which were previously used to fabricate medical grade polymethylmethacrylate (PMMA) implants for craniofacial reconstruction and regeneration surgeries (see Espalin et al., 2010; Nyberg et al., 2017). One of the most important advan- tages of FDM is the possibility to architect the microstructure of the part. This flexibility was demonstrated by Muller, Chim, Bader, Whiteman, & Schantz (2010), wherein they fabricated an implant for a frontal-parietal defect with branching vascular channels to promote the growth of blood vessels. Stress-shielding effect caused by metal implants have led researchers to turn to polymers such as polyetheretherketone (PEEK) for orthopedic implants (see Han et al., 2019). PEEK displays mechanical behaviour similar to that of the cortical bone (see Vaezi & Yang, 2015), due to the presence of ether and ketone groups along the backbone of it’s molecular struc- ture. There have been surgeries such as cervical laminoplasty (see Syuhada, Ramahdita, Rahyussalim, & Whulanza, 2018), total knee replacement surgery (see Harish & Devadath, 2015; Borges, Choudhury, & Zou, 2018), patient specific upper limb prostheses attachment (see ten Kate, Smit, & Breedveld, 2017) and patient specific tracheal implants (see Freitag et al., 2017) recorded in the literature, which use PEEK, polylactic acid (PLA), acrylonitrile butadiene styrene (ABS), polyurethane (PU) and other medical grade polymer implants that have been fabricated using FDM. Recently, additive manufacturing has re- ceived a huge impetus in the healthcare sector due to the ongoing Covid-19 pandemic, and the technology is being used to fabricate products such as ventilator valves, face shields, etc. During fabrication of such components, thermoplastics are heated above the melting point (θm) and then rapidly cooled below the glass transition temperature (θg), which causes drastic temperature gradients. Cooling reduces configurational en- tropy of the polymer molecules, and the sharp temperature gradients induce differential volumetric shrinkage, consequently leading to the formation of residual stresses. As previously stated, these stresses can be either detrimental or favourable with regard to the mechanical response of the components. Process parameters such as layer thickness, orientation, raster angle, raster width, air gap, etc. affect the component’s final mechanical response (see Sood, Ohdar, & Mahapatra, 2010). For instance, the anistropic nature of a part fabricated by FDM (see Song et al., 2017) can be controlled by choosing the most suitable raster angle for each individual layer during the process, in such a way that the component will survive under the required service conditions. This has been demonstrated by Casavola, Cazzato, Moramarco, & Pappalettera (2017), wherein a rectangular ABS specimen with a raster angle of ±45◦ produced the least residual stresses in the specimen. The optimal raster angle was determined by repeated experimentation, with a different choice of the angle in each experiment. Developing a consistent theory for capturing the thermodynamic process and using the resulting constitutive relations in simulations can help in developing standardized methods with optimized parameters for manufacturing the component. Many of the theories currently available, concentrate on the analysis of polymers which are at a temperature below θg, the reasoning being that internal reaction forces due to volume shrinkage are too low in the melt phase to give rise to appreciable residual stresses (see Xinhua et al., 2015; Wang, Xi, & Jin, 2007; Park, 2005, de Macedo & Ferreira, 2017). Although such an argument seems reasonable, in a process like FDM, the mechanical and thermal histories of the polymer melt have a huge impact on the mechanical response of the final component. Several computational frameworks have been developed, wherein some have assumed incompressible viscous fluid mod- els for the melt phase (see Xia, Lu, Dabiri, & Tryggvason, 2018a; Dabiri, Schmid, & Tryggvason, 2014, Comminal, Serdeczny, Pedersen, & Spangenberg, 2018) and linear elastic models (see Xinhua et al., 2015; Wang et al., 2007; de Macedo & Ferreira, 2017; El Moumen, Tarfaoui, & Lafdi, 2019; Casavola, Cazzato, Moramarco, & Pappalettere, 2016) or elasto-plastic models (see Armillotta, Bellotti, & Cavallaro, 2018; Cattenone, Morganti, Alaimo, & Auricchio, 2018) for the solid phase. However, it is to be noted that polymer melts are generally modelled as viscoelastic fluids (see Doi & Edwards, 1986). This is supported by the fact that, residual stresses in injection molded components have been predicted much more accurately by viscoelastic models than by elastic or elasto-plastic models (see Kamal, Rai-Fook, & Hernandez-Aguilar, May 2002 and Zoetelief, Douven, & Housz, July 1996). In this paper, the polymer melt is assumed to be amorphous, and we make an entropic assumption to simplify the analysis. Hence, the internal energy is solely a function of temperature and therefore, at a constant temperature, the free energy accumulates only due to the reducing configurational entropy of the molecules, such as during stretching. 2
  • 3. P. Sreejith, K. Kannan and K. Rajagopal International Journal of Engineering Science 159 (2021) 103412 Fig. 1. The various configurations of the melt. When the load is removed, the melt again assumes a high entropy state, which is also the stress free configuration of the melt. Once the amorphous melt has been laid on the substrate, it undergoes phase transformation due to cooling. Numerous “ad hoc” methods have been implemented by various authors to capture the phase change. One of the simplest meth- ods used was to assume the melt to transform into a solid at a material point where the temperature reaches θm (see Xia, Lu, & Tryggvason, 2018b) or θg (see de Macedo & Ferreira, 2017, see Armillotta et al., 2018; El Moumen et al., 2019 and Cattenone et al., 2018). Generally, polymer melts undergo phase transition through a range of temperature values. The heat transfer between a polymer melt and the surroundings is usually proportional to the temperature difference between them, and solidification is initiated at the material points where the germ nuclei are activated into a growth nuclei. An amorphous polymer melt normally transforms into an amorphous solid, unless the melt contains specific germ nuclei which can cause crystallization. In the case of FDM, such germ nuclei can be induced in the melt while extruding the melt out of the nozzle at high shear rates combined with a low temperature (see Northcutt, Orski, Migler, & Kotula, 2018). In the transition regime, polymer molecules exist in both, the melt, and the solid phases simultaneously, and usually the body is modelled as a constrained mixture (see Rao & Rajagopal, 2000; Rao & Rajagopal, 2002; Kannan, Rao, & Rajagopal, 2002; Kannan & Rajagopal, 2005; and Kannan & Rajagopal, 2004). While considering such a complex phase transition pro- cess, it is much more prudent to assume the primary thermodynamic functions to be dependent on the weight fraction of the phases. The weight fraction can be easily represented as a linear function of temperature (see Liu, Anderson, & Sridhar, 2020) or it can be determined by statistical methods (see Avrami, 1939). Considering this work to be a preliminary step in developing a consistent theory for FDM, we assume an amorphous polymer melt to transform into a solid through a drastic increase in the viscosity at the glass transition temperature (θg). In such a phase change process, the melt transforms completely into a solid when the temperature at all the material points fall below the glass transition value (θg). This assumption limits the applicability of our theory to very particular processes having certain specific process parameters, such as:(1) The temperature of the nozzle is maintained above θm throughout. (2) The intial temperature of the melt is also kept above θm. These predefined conditions ensure that the melt does not undergo shear induced crystallization. The proposed framework is based on the general theory for viscoelastic fluids developed by Rajagopal and Srinivasa (2000) and on the theory of the crystallization of polymer melts developed by Rao and Rajagopal (2000), Rao and Rajagopal (2001), Rao and Rajagopal (2002). The framework requires an appropriate assumptionror the Helmholtz potential and the rate of entropy production, and the evolution of the “natural configuration” of the body is determined by maximizing the rate of entropy production. 2. Methodology 2.1. Kinematics Let us consider the melt to be subjected to thermal loading. Initially the amorphous polymer melt (atactic polymer) is at the reference configuration κR(B) (refer to Fig. 1). This configuration is stress free and the polymer melt is at the reference temperature θo. As the melt is cooled from θo, it undergoes deformation and occupies the current configuration κt (B), at the current temperature θ. The motion of the body from κR(B) to κt (B) is given by x = χκR (X,t). (1) The motion is assumed to be a diffeomorphism. The velocity and the deformation gradient are given by v = ∂χκR ∂t , (2) 3
  • 4. P. Sreejith, K. Kannan and K. Rajagopal International Journal of Engineering Science 159 (2021) 103412 and FκR = ∂χκR ∂X . (3) The deformation gradient mapping from κpm(t)(B) to κt (B) is Fκpm(t) . Let αm(θ)I, where αm(θ) is a scalar valued function, represent pure thermal expansion/contraction. When αm(θ) = 1, i.e., an isothermal process, Fig. 1 will coincide with the configurations employed by Rajagopal and Srinivasa (2000). The isothermally unloaded configuration κpm(t)(B) evolves due to thermal expansion/contraction of the melt (see Rajagopal & Srinivasa, 2004a). The configuration κ pm(t) is stress free, and since pure thermal expansion/contraction doesn’t induce stresses in the material, the configuration κpm(t) is also assumed to be stress free. The deformation gradient is multiplicatively decomposed into a dissipative, thermal and an elastic part as shown FκR = αm(θ)Fκpm(t) Gm. (4) In general, Gm need not be the gradient of a mapping. The right Cauchy-Green tensor and the left Cauchy–Green tensor are given by CκR = FT κR FκR , and Cκpm(t) = FT κpm(t) Fκpm(t) , (5) BκR = FκR FT κR , and Bκpm(t) = Fκpm(t) FT κpm(t) . (6) The ‘right configurational tensor’ associated with the reference configuration (κR) and the instantaneous natural configura- tion (κ pm(t)) is defined as CκR→κ pm(t) = GT mGm. (7) Therefore, Eq. (6)2 can be represented as Bκpm(t) = 1 α2 m(θ) FκR C−1 κR→κ pm(t) FT κR . (8) The velocity gradients and the corresponding symmetric and skew-symmetric parts are defined as L = ˙ FκR F−1 κR , (9) D = L + LT 2 , W = L − LT 2 , (10) Lκ pm(t) = ˙ GmGm −1 , (11) Dκ pm(t) = Lκ pm(t) + LT κ pm(t) 2 , Wκ pm(t) = Lκ pm(t) − LT κ pm(t) 2 . (12) The material time derivative of Eq. (8) will lead to ˙ Bκpm(t) = −2 ˙ αm(θ) αm(θ) Bκpm(t) + LBκpm(t) + Bκpm(t) LT + 1 α2 m(θ) FκR ˙ C−1 κR→κ pm(t) FT κR . (13) The upper convected derivative is used to ensure frame indifference of the time derivatives, which, for any general second order tensor A is defined as A= ˙ A − LA − ALT . (14) On comparing Eqs. (13) and (14), we arrive at Bκpm(t) = −2 ˙ αm(θ) αm(θ) Bκpm(t) + 1 α2 m(θ) FκR ˙ C−1 κR→κ pm(t) FT κR . (15) Using Eq. (4), Eq. (7) and Eq. (15), we obtain Bκpm(t) = −2Fκpm(t) Dκ pm(t) FT κpm(t) − 2 ˙ αm(θ) αm(θ) Bκpm(t) . (16) Note that, the evolution of Bκpm(t) would depend on the structure of the constitutive equation chosen for αm(θ) (or more generally, on the material). In the event of an isothermal process, the scalar valued function αm(θ), will become unity, and Eq. (16) will reduce to the form derived by Rajagopal and Srinivasa (2000) as given below Bκpm(t) = −2Fκpm(t) Dκ pm(t) FT κpm(t) . (17) 4
  • 5. P. Sreejith, K. Kannan and K. Rajagopal International Journal of Engineering Science 159 (2021) 103412 To capture the effects of volume relaxation we will be using normalised invariants, where unimodular tensors are defined such that − Cκpm(t) = det(Fκpm(t) )− 2 3 Cκpm(t) , and − Bκpm(t) = det(Fκpm(t) )− 2 3 Bκpm(t) . (18) The invariants that we employ are defined through Iκpm(t) = tr( − Bκpm(t) ), IIκpm(t) = tr( − Bκpm(t) )2 , and IIIκpm(t) = det(Fκpm(t) ). (19) However, we plot Lode invariants (see Chen, Tan, Wang, 2012) in Section 3, to interpret the results better. This set of invariants are defined as K1 = tr(A) √ 3 , K2 = tr(A2 d ), and K3 = 1 3 sin −1 √ 6tr(A3 d ) tr(A2 d ) 3 2 , (20) where A is any tensor and Ad is the deviatoric part of A. When K1 = 0, the tensor is purely composed of the deviatoric components. Similarly, when K2 = 0, the tensor is volumetric and K3 represents the mode of the tensor which varies from −π 6 to π 6 . 2.2. Modeling 2.2.1. Modeling the melt Helmholtz free energy per unit mass is defined with respect to the configuration κpm(t)(B), and is assumed to be a func- tion of θ and the deformation gradient Fκpm(t) . We represent it as a sum of the contribution from the thermal interactions and the mechanical working, where the contribution due to mechanical working is assumed to be of the Neo-Hookean form. Further, we require it to be frame indifferent and isotropic with respect to the configuration κpm(t)(B), to arrive at m(θ, Iκpm(t) , IIIκpm(t) ) = th m (θ) + mech m (Iκpm(t) , IIIκpm(t) ), (21) where th m (θ) = Am + (Bm + Cm 2 )(θ − θo) − Cm 1 (θ − θo)2 2 − Cm 2 θln θ θo , (22) and mech m (Iκpm(t) , IIIκpm(t) ) = μm 1 θ 2ρκpm(t) θo tr( − Bκpm(t) ) − 3 + km 1 θ 2ρκpm(t) θo det(Fκpm(t) ) − 1 2 , (23) where θo, Am, Bm, Cm 1 , Cm 2 , μm 1 and km 1 are the reference material temperature and the material constants respectively, and μm 1 , km 1 ≥ 0, and ρκpm(t) is the density of the melt in the configuration κpm(t)(B). The rate of entropy production per unit volume due to mechanical working is defined as a function of θ and Lκ pm(t) , and requiring the function to be frame indifferent and isotropic, we assume ξmech m (θ, Dκ pm(t) ) = ηm 1 (θ)dev(Dκ pm(t) ).dev(Dκ pm(t) ) + ηm 2 (θ)tr(Dκ pm(t) )2 , (24) where ηm 1 and ηm 2 are the shear and bulk modulus of viscosity and ηm 1 , ηm 2 ≥ 0. The rate of mechanical dissipation should always be non-negative and hence, ξmech m ≥ 0, (25) and the form given by Eq. (24), ensures that Eq. (25) is always met. The balance of energy can be written as ρκt ˙m = T.D − div(q) + ρκt r, (26) where T is the Cauchy stress tensor, ˙m is the rate of change of internal energy per unit mass of the melt with respect to time, q is the heat flux and r is the radiation of heat per unit mass of the melt. We express the second law of thermody- namics as an equality by introducing a rate of entropy production term, and it takes the form (see Green Naghdi, 1977) T.D − ρκt ˙ m − ρκt ηm ˙ θ − 1 θ q.grad(θ) = ρκt θζm = ξtot m , ξtot m ≥ 0, (27) where ηm is the entropy per unit mass of the melt, θ is the absolute temperature, ζm is the rate of entropy production per unit mass of the melt and ξtot m is the total rate of entropy production per unit volume. Substituting Eq. (21) into Eq. (27), we can re-write Eq. (27) as T.D − ρκt ∂th m ∂θ + μm 1 2ρκpm(t) θo tr( − Bκpm(t) ) − 3 + km 1 2ρκpm(t) θo det(Fκpm(t) ) − 1 2 + ηm ˙ θ 5
  • 6. P. Sreejith, K. Kannan and K. Rajagopal International Journal of Engineering Science 159 (2021) 103412 −ρκt μm 1 θ 2ρκpm(t) θo tr( ˙ − Bκpm(t) ) − μm 1 θ ˙ ρκpm(t) 2ρ2 κpm(t) θo tr( − Bκpm(t) ) − 3 + km 1 θ ρκpm(t) θo det(Fκpm(t) ) − 1 ˙ det(Fκpm(t) ) − km 1 θ ˙ ρκpm(t) 2ρ2 κpm(t) θo det(Fκpm(t) ) − 1 2 − 1 θ q.grad(θ) = ξtot m , ξtot m ≥ 0. (28) The balance of mass for the melt undergoing deformation from the configurations κR(B) to κpm(t)(B) is ρκR = ρκpm(t) det(Gm)(αm(θ))3 , (29) where ρκR is the density at the reference configuration, κR(B). The balance of mass for the melt between the configurations κR(B) and κt (B) is given by ρκR = ρκt det(FκR ), (30) where ρκt is the density at the current configuration, κt (B). Taking the material derivative of Eq. (29), we arrive at ˙ ρκpm(t) ρκpm(t) = −tr(Dκ pm(t) ) − 3 ˙ αm(θ) αm(θ) . (31) Next, from Eq. (6)2 and Eq. (16) ˙ det Fκpm(t) = det Fκpm(t) tr D − Dκ’ pm(t) − 3 ˙ αm(θ) αm(θ) , (32) and from Eqs. (16), (18) and (32), we obtain tr( ˙ − Bκpm(t) ) = 2dev( − Bκpm(t) ).(D − Dκ pm(t) ) (33) It follows from Eqs. (4) and (28)–(32), that T − μm 1 θ det(Fκpm(t) )θo dev( − Bκpm(t) ) − km 1 θ θo det(Fκpm(t) ) − 1 I .D −ρκt ∂th m ∂θ + μm 1 2ρκpm(t) θo tr( − Bκpm(t) ) − 3 + km 1 2ρκpm(t) θo det(Fκpm(t) ) − 1 2 + ηm ˙ θ + μm 1 θ det(Fκpm(t) )θo dev( − Bκpm(t) ).Dκ pm(t) + km 1 θ θo det(Fκpm(t) ) − 1 − μm 1 θ 2det(Fκpm(t) )θo tr( − Bκpm(t) ) − 3 − km 1 θ 2det(Fκpm(t) )θo det(Fκpm(t) ) − 1 2 × tr(Dκ pm(t) ) + 3 ˙ αm(θ) αm(θ) − 1 θ q.grad(θ) = ξtot m , ξtot m ≥ 0. (34) One of the ways to satisfy Eq. (34) is to assume that the three equations given below hold ηm = − ∂th m ∂θ − μm 1 2ρκpm(t) θo tr( − Bκpm(t) ) − 3 − km 1 2ρκpm(t) θo det(Fκpm(t) ) − 1 2 , (35) T = μm 1 θ det(Fκpm(t) )θo dev( − Bκpm(t) ) + km 1 θ θo det(Fκpm(t) ) − 1 I, (36) and ξtot m = T.Dκ pm(t) − MECH m I.Dκ pm(t) + 3 ˙ αm(θ) αm(θ) − μm 1 θ 2θodet(Fκpm(t) ) tr( − Bκpm(t) ) − 3 + km 1 θ 2θodet(Fκpm(t) ) det(Fκpm(t) ) 2 − 1 − 1 θ q.grad(θ), ξtot m ≥ 0, (37) where MECH m = ρκt mech m . (38) The Helmholtz free energy is given by m = m − θηm. (39) From Eqs. (21) and (35), the internal energy is defined as m = Am − Bm θo + 1 2 C1 m (θ2 − θ2 o ) + Cm 2 (θ − θo), (40) 6
  • 7. P. Sreejith, K. Kannan and K. Rajagopal International Journal of Engineering Science 159 (2021) 103412 and the specific heat is ∂ m ∂θ = C1 m θ + Cm 2 . (41) When the process is homothermal, Eq. (37) will reduce to ξtot m = T.Dκ pm(t) − MECH m I.Dκ pm(t) , ξtot m ≥ 0. (42) Therefore, in the current analysis, it seems prudent to suppose the following ξmech m = T.Dκ pm(t) − MECH m I.Dκ pm(t) . (43) Eq. (43) can be re-written as ξmech m (Dκ pm(t) , θ) = ξmech m − T.Dκ pm(t) + MECH m I.Dκ pm(t) = 0. (44) Now, we assume the natural configuration and hence Dκ pm(t) to evolve in such a way that, for a fixed Bκ pm(t) and θ at each time instant, the rate of entropy production due to mechanical working is maximum, subject to the constraint in Eq. (44) (see Rajagopal Srinivasa, 2004b). Therefore, to extremize ξmech m constrained by Eq. (44), we write the augmented form as aug = ξmech m + λ(ξmech m − T.Dκ pm(t) + MECH m I.Dκ pm(t) ), (45) where λ is the Lagrange multiplier. On taking the derivative with respect to Dκ pm(t) , we obtain ∂aug ∂Dκ pm(t) = (1 + λ) λ ∂ξmech m ∂Dκ pm(t) + (MECH m I − T) = 0. (46) At any time instant, assuming Bκpm(t) and θ to be fixed, Dκ pm(t) will take only those values which will satisfy Eq. (46). Substituting Eq. (24) into Eq. (46) and taking the scalar product with Dκ pm(t) ∂aug ∂Dκ pm(t) .Dκ pm(t) = 2(1 + λ) λ ηm 1 (θ)dev(Dκ pm(t) ).Dκ pm(t) + ηm 2 (θ)[tr(Dκ pm(t) )]2 + MECH m tr(Dκ pm(t) ) − T.Dκ pm(t) = 0. (47) Comparing Eq. (47) with Eq. (44), we get (1+λ) λ = 1 2 . Since the melt is assumed to be isotropic, we can assume that Fκpm(t) = vκpm(t) , (48) Also the eigenvectors of Bκpm(t) and Dκ pm(t) are the same and hence the tensors commute (see Rajagopal Srinivasa, 2000). Therefore, from Eqs. (16), (46) and (48), we arrive at the form for the upper convected derivative of Bκpm(t) , which will determine the evolution of natural configuration of the melt, as Bκpm(t) = 2 MECH m − tr(T) 3 3ηm 2 (θ) I − 1 ηm 1 (θ) dev(T) − ˙ αm(θ) αm(θ) I Bκpm(t) . (49) 3. Application of the model A prototypical problem to test the efficacy of the theory that has been developed is considered, i.e., we assume a partic- ular geometry to be fashioned by FDM and use the constitutive equations to determine the residual stresses induced in the material during fabrication and the consequent dimensional instability of the geometry. 3.1. Fused deposition modeling In FDM, a polymer filament is heated above the melting temperature and extruded out through a nozzle attached to a robotic arm. A stereolithography (STL) file, containing information of the 3D geometry to be made, is then fed into a process- ing system that controls the robotic arm. The polymer melt is laid layer by layer through the nozzle with the help of the arm to get the desired 3D geometry, and the melt is allowed to cool. Polymers used in this process are usually thermoplastics like ABS (Acrylonitrile Butadiene Styrene), PLA (Polylactic Acid), PS (Polystyrene), PC (Polycarbonates), PEEK (Polyetheretherke- tone), PMMA (Polymethylmethacrylate) and elastomers (see González-Henríquez, Sarabia-Vallejos, Rodriguez-Hernandez, 2019). Thermoplastics are preferred over thermosets, because the former’s melt viscosity enables smooth extrusion through 7
  • 8. P. Sreejith, K. Kannan and K. Rajagopal International Journal of Engineering Science 159 (2021) 103412 Fig. 2. Representative images showing the boundary conditions on the layers at different time steps of the simulation. The dashed (dark red) line provides a break and is intended to denote that the layers are very long. the nozzle, and at the same time helps to retain the shape once the melt is laid. Complex part geometries can also be made with the help of support materials. In the current analysis, we assume each of the layers to be very long and be made of a single raster. Further, we assume a rectangular cross section for the layers, which finally adds up to each of the layers being in the shape of a very long ribbon. To lay such a layer, we need a nozzle with an appropriate geometry, such as a nozzle with a slot (see Löffler Koch, 2019) or a flat head nozzle which is capable of evening out the melt into the desired shape (see Kim, Trangkanukulkij, Kim, 2018). Four layers of the polymer melt are assumed to be laid one over the other consecutively, in the direction of the length of the ribbon. All four layers are assumed to have a sufficiently long rectangular cross-section, which enables plane strain conditions to be enforced (refer to Fig. 2). 3.2. Governing equations The constitutive form for the scalar valued function αm(θ), which represents the isotropic volume expansion/contraction, can be deduced from Eq. (4). When t 0, taking the determinant of Eq. (4) αm(θ) = ρκR ρκt det(Fκpm(t) )det(Gm) 1 3 . (50) Dilatometry experiments that are conducted to measure the specific volume changes are homothermal processes, and hence, the deformation gradients, Gm and Fκpm(t) , shown in Fig. 1, can be assumed to be identity transformations. Thus, density will become solely a function of temperature and the isotropic volume expansion/contraction can be represented as αm(θ) = ρκR ρκt 1 3 . (51) The density can be expressed in terms of specific volume, and therefore, αm(θ) is obtained as αm(θ) = v(θ) v(θo) 1 3 = v vo 1 3 , (52) 8
  • 9. P. Sreejith, K. Kannan and K. Rajagopal International Journal of Engineering Science 159 (2021) 103412 Fig. 2. Continued where v is the specific volume at the current temperature θ and vo is the specific volume at the reference temperature θo which can be represented by the Tait equation (see Haynes, 2014). At time t = 0 second, i.e. at reference temperature (temperature of the reference configuration) θ = θo αm(θo) = 1. (53) The coefficient of volumetric thermal expansion/contraction, ˆ αm(θ), is defined as ˆ αm(θ) = 1 v ∂v ∂θ = ρκt ∂( 1 ρκt ) ∂θ . (54) The relationship between isotropic volume expansion/contraction αm(θ) and the coefficient of volumetric thermal expan- sion/contraction ˆ αm(θ) is obtained by taking the derivative of Eq. (52) with respect to the current temperature, θ, as ˆ αm(θ) = 3 αm(θ) ∂αm(θ) ∂θ . (55) 9
  • 10. P. Sreejith, K. Kannan and K. Rajagopal International Journal of Engineering Science 159 (2021) 103412 Table 1 Properties of PS. Material Properties Value Unit Ref. Thermal properties Melting temperature, θm 513 K van Krevelen and te Nijenhuis (2009) Glass transition temperature, θg 373 K van Krevelen and te Nijenhuis (2009) Coefficient of heat conduction, k (averaged value) 0.159 W mK Sombatsompop and Wood (1997) Coefficient of heat transfer from the material to the environment, he 90 W m2 K Costa, Duarte, and Covas (2015) Coefficient of heat transfer from the material to the substrate, hs 100 W m2 K Costa et al. (2015) Specific heat (Cp): (Table 1a and 1b of Marti, Kaisersberger, Moukhina (2006)) Cm 1 4.101 J K2 kg Marti et al. (2006) Cm 2 11.16 J Kkg Marti et al. (2006) Constants in the Tait equation: A3 0.9287 cm3 g Haynes (2014) A4 5.131x10⁻⁴ ◦ C−1 Haynes (2014) Mechanical properties Shear modulus (μm 1 ) 109 Pa Mark (1999) Bulk modulus (km 1 ) 3x10¹⁰ Pa NA Shear viscosity below glass transition temperature, θg (ηs 1) 1019 Pas NA Bulk viscosity below glass transition temperature, θg (ηs 2) 2x10²⁰ Pas NA Shear viscosity at the reference temperature, θo (ηo 1) 103 Pas Miller (1968) Bulk viscosity at the reference temperature, θo (ηo 2) 2x10⁴ Pas NA temperature, θo (ηo 2) 2x10⁴ C 22,873 K Miller (1968) a 0.7 NA NA As the layers cool, the viscosity of the polymer melt shoots up at glass transition temperature (θg). The variation of the bulk and shear viscosities of the melt are defined as ηm n (θ) = ηs n 1 − tanh a(θ − θg) 2 + ηl n 1 + tanh a(θ − θg) 2 , n = 1, 2, (56) where ηm 1 is the shear viscosity and ηm 2 is the bulk viscosity, ηs 1 and ηs 2 are the shear and the bulk viscosities below the glass transition temperature (θg), ηl 1 and ηl 2 are the shear and the bulk viscosities above the glass transition tempera- ture (θg) and a is a constant. The shear viscosity and the bulk viscosity above the glass transition, i.e., ηl 1 and ηl 2 , are defined as ηl n(θ) = ηo ne C 1 θ − 1 θo , n = 1, 2, (57) where ηo 1 is the shear viscosity at the melting temperature (θm), ηo 2 is the bulk viscosity at the melting temperature (θm) and C is a constant. The dependent variables are assumed to be a function of the current co-ordinates and current time. They are the dis- placement vector ∼ u (x,t), the current temperature ∼ θ (x,t) and the left Cauchy-Green tensor as defined in Eq. (6)2, i.e., ∼ Bκpm(t) (x,t). The bases in the local and the global coordinate system are aligned with each other. Therefore, defining the dependent variables with respect to the local coordinate system is as good as defining it with respect to the global co- ordinate system. The position vector of a particle in the reference configuration is defined as X = x(t)− ∼ u (x,t). (58) The velocity vector in the current configuration is derived by taking the total time derivative of Eq. (58) ∼ v (x,t) = I − ∂( ∼ u (x,t)) ∂x −1 ∂ ∼ u (x,t) ∂t , (59) and the velocity gradient is defined as ∼ L (x,t) = ∂ ∼ v (x,t) ∂x . (60) The components of the displacement vector are ∼ u = ux(x, y,t) uy(x, y,t) , (61) 10
  • 11. P. Sreejith, K. Kannan and K. Rajagopal International Journal of Engineering Science 159 (2021) 103412 Fig. 3. Banded contour plots of temperature in o C, visualised on the deformed configuration. The white arrows depict the local displacement vector, and its length represents the magnitude. The relative length of arrows are in logarithmic scale. where ∼ u represents the component form of the displacement vector and, ux(x, y,t) and uy(x, y,t) are the components in the x and y directions respectively. We represent the components of the velocity vector as given below ∼ v = vx(x, y,t) vy(x, y,t) , (62) where vx = ∂ux ∂t ∂uy ∂y − 1 − ∂ux ∂y ∂uy ∂t ∂ux ∂x + ∂uy ∂y − ∂ux ∂x ∂uy ∂y + ∂ux ∂y ∂uy ∂x − 1 , (63) and vy = ∂uy ∂t ∂ux ∂x − 1 − ∂ux ∂t ∂uy ∂x ∂ux ∂x + ∂uy ∂y − ∂ux ∂x ∂uy ∂y + ∂ux ∂y ∂uy ∂x − 1 . (64) Consequently, the component form of the velocity gradient follows from Eq. (60) as ∼ L = ⎡ ⎣ ∂vx (x,y,t) ∂x ∂vx (x,y,t) ∂y 0 ∂vy (x,y,t) ∂x ∂vy (x,y,t) ∂y 0 0 0 0 ⎤ ⎦. (65) 11
  • 12. P. Sreejith, K. Kannan and K. Rajagopal International Journal of Engineering Science 159 (2021) 103412 Fig. 3. Continued We represent the components of ∼ Bκpm(t) (x,t) and the stress tensor T ∼ θ, ∼ Bκpm(t) as ∼ Bκpm(t) = Bxx(x, y,t) Bxy(x, y,t) 0 Bxy(x, y,t) Byy(x, y,t) 0 0 0 Bzz(x, y,t) , (66) and T = Txx(x, y,t) Txy(x, y,t) 0 Txy(x, y,t) Tyy(x, y,t) 0 0 0 Tzz(x, y,t) , (67) where Txx(x, y,t), Tyy(x, y,t), Txy(x, y,t) and Tzz(x, y,t) are derived by substituting θ(x, y,t) and the components of ∼ Bκpm(t) (x,t) into Eq. (36). There are seven coupled field equations that have to be solved , i.e., two components of the balance oflinear momen- tum equation, the energy equation [Eq. (26)] and four components of the evolution equation [Eq. (49)] represented in the Eulerian form. The linear momentum balance is given by ∂Txx ∂x + ∂Txy ∂y = 0, (68) 12
  • 13. P. Sreejith, K. Kannan and K. Rajagopal International Journal of Engineering Science 159 (2021) 103412 Fig. 4. Banded contour plots of the mean normal stress (Pa), K1 √ 3 , visualised on the deformed configuration. and ∂Txy ∂x + ∂Tyy ∂y = 0. (69) We assume radiation to be absent in the current analysis and hence the energy equation is written as Txx ∂vx ∂x + Tyy ∂vy ∂y + Txy ∂vx ∂y + ∂vy ∂x + k ∂2 θ ∂x2 + ∂2 θ ∂y2 = ρκt ∂ (θ) ∂θ ∂θ ∂t + ∂θ ∂x vx + ∂θ ∂y vy . (70) The evolution equations are ∂Bxx ∂t + ∂Bxx ∂x vx + ∂Bxx ∂y vy − 2 ∂vx ∂x Bxx + ∂vx ∂y Bxy = 2 3ηm 2 (θ) MECH m − (Txx + Tyy + Tzz) 3 Bxx − 2 ηm 1 (θ) 2Txx 3 − Tyy 3 − Tzz 3 Bxx + TxyBxy − 2 αm(θ) ∂αm(θ) ∂θ ∂θ ∂t + ∂θ ∂x vx + ∂θ ∂y vy Bxx, (71) ∂Byy ∂t + ∂Byy ∂x vx + ∂Byy ∂y vy − 2 ∂vy ∂x Bxy + ∂vy ∂y Byy 13
  • 14. P. Sreejith, K. Kannan and K. Rajagopal International Journal of Engineering Science 159 (2021) 103412 Fig. 4. Continued = 2 3ηm 2 (θ) MECH m − (Txx + Tyy + Tzz) 3 Byy − 2 ηm 1 (θ) −Txx 3 + 2Tyy 3 − Tzz 3 Byy + TxyBxy − 2 αm(θ) ∂αm(θ) ∂θ ∂θ ∂t + ∂θ ∂x vx + ∂θ ∂y vy Byy, (72) ∂Bzz ∂t + ∂Bzz ∂x vx + ∂Bzz ∂y vy = 2 3ηm 2 (θ) MECH m − (Txx + Tyy + Tzz) 3 Bzz − 2 ηm 1 (θ) −Txx 3 − Tyy 3 + 2Tzz 3 Bzz − 2 αm(θ) ∂αm(θ) ∂θ ∂θ ∂t + ∂θ ∂x vx + ∂θ ∂y vy Bzz, (73) and ∂Bxy ∂t + ∂Bxy ∂x vx + ∂Bxy ∂y vy − ∂vx ∂x Bxy + ∂vx ∂y Byy − ∂vy ∂x Bxx + ∂vy ∂y Bxy = 2 3ηm 2 (θ) MECH m − (Txx + Tyy + Tzz) 3 Bxy − 2 ηm 1 (θ) 2Txx 3 − Tyy 3 − Tzz 3 Bxy 14
  • 15. P. Sreejith, K. Kannan and K. Rajagopal International Journal of Engineering Science 159 (2021) 103412 Fig. 5. Banded contour plots of the norm of deviatoric part of stress (Pa), K2, visualised on the deformed configuration. + TxyByy − 2 αm(θ) ∂αm(θ) ∂θ ∂θ ∂t + ∂θ ∂x vx + ∂θ ∂y vy Bxy, (74) where MECH m in Eqs. (71)–(74) is derived by substituting θ(x, y,t) and the components of ∼ Bκpm(t) (x,t) into Eq. (38). We solve the seven equations for the seven unknowns: two components of the displacement field ( ∼ u (x,t)), the temperature field ( ∼ θ (x,t)) and four components of the left Cauchy–Green tensor ( ∼ Bκpm(t) (x,t)). 3.3. Material properties The polymer melt is assumed to be of Polystyrene (PS). High molecular weight atactic PS does not undergo crystallization (see Chai Forrest, 2018), and hence is a good candidate for our analysis. The thermal and mechanical properties of PS are given in Table 1. The mechanical properties provided in Table 1 are associated with the κpm(t) configuration. However, in the literature, the properties are associated with the κt configuration. Therefore, we have assumed the values to lie in a ballpark range of the actual values. Since the values of shear modulus and bulk modulus given in Table 1 are towards the higher end at temperatures above θg, it leads to a very small relaxation time ( η◦ 1 μm 1 = 10−6 sec) for the melt. However, this seems to be a reasonable approximation. 15
  • 16. P. Sreejith, K. Kannan and K. Rajagopal International Journal of Engineering Science 159 (2021) 103412 Fig. 5. Continued 3.4. Initial and boundary conditions The first layer of the melt is laid instantaneously on the substrate (which is assumed to be at the ambient temperature θsub = 27◦C throughout the process) at time t = 0 second. The surface that is in contact with the substrate is fixed along with the substrate acting as a heat sink. Free convection and traction free conditions are assumed on the outer surfaces (refer to Fig. 2a). The layer is then allowed to cool for one second, at the end of which, the second layer is laid instantaneously on top of the first layer. Once the second layer is laid, continuity is established between the layers, thus both the layers act as a single contiguous body (refer to Fig. 2b), i.e., we assume a perfect interface between the layers. The third and fourth layers are laid similarly one after the other with an interval of one second each (refer to Fig. 2c and Fig. 2d). After all the layers have been laid, the entire system cools till the temperature field attains a value close to the ambient temperature (preferably 27◦C). Symmetry conditions have been imposed to reduce the computational time (refer to Fig. 2a, Fig. 2b, Fig. 2c and Fig. 2d). The first, second, third and fourth layers have an aspect ratio of 80:1,76:1, 72:1 and 68:1 respectively. Before each layer is laid, the layer is at 241◦C, which is 1◦C above the melting point of Polystyrene (PS). At this temper- ature, the isotropic volume contraction/expansion (αm( ∼ θ)) is unity along with ∼ Bκpm(t) (x,t) being identity, i.e., αm(θo)I = ∼ Bκpm(t) = 1 0 0 0 1 0 0 0 1 at t = 0 second (75) 16
  • 17. P. Sreejith, K. Kannan and K. Rajagopal International Journal of Engineering Science 159 (2021) 103412 Fig. 6. Banded contour plots of the modes of deformation, (K3 invariant of the stress tensor), visualised on the deformed configuration. The dark red zones at the stepped end is close to uniaxial tension and dark blue zones at the core of the geometry is close to equibiaxial tension throughout the process. 3.5. Implementation Representing non-linear equations in the Lagrangian description and integrating them in the material frame can cause excessive mesh distortions. This shortcoming of the method is because, each of the nodes of the mesh, follow the corre- sponding material points during the motion. The Eulerian description in which the nodes remain fixed while the material distorts, overcomes the above deficiency. However, it compromises the numerical accuracy of the solution while computing with coarse meshes. It also fails to precisely identify the interface between the domains, leading to poor numerical accuracy of the interfacial fluxes. The disadvantages of both the descriptions can be avoided by using the Arbitrary Lagrangian–Eulerian (ALE) method. ALE combines the best features of both the Lagrangian and Eulerian descriptions. Each node of the ALE mesh is free to either remain fixed or rezone itself (see Donea, Huerta, Ponthot, Rodríguez-Ferran, 2004), thus avoiding excessive mesh distortions and at the same time predicting the domain interfaces with better accuracy. It also provides comparatively better numerical accuracy of the solutions than the Eulerian approach. The non-linear equations, Eqs. (68)–(74), have been solved using “Coefficient Form PDE” module in COMSOL Multiphysics TM . The coefficients of the general PDE in the module, are populated by extracting the respective coefficients of the governing equations by using a MATLAB code. It is to be noted that the equations are provided to the module with respect to the spatial frame and are integrated in time by using the BDF method. The order of the scheme varies from 1 to 5 with free time stepping. 17
  • 18. P. Sreejith, K. Kannan and K. Rajagopal International Journal of Engineering Science 159 (2021) 103412 Fig. 6. Continued 3.6. Results and discussion 3.6.1. Volumetric shrinkage and residual stresses Temperature in the melt starts reducing as heat flows out through the free surfaces into the surroundings and through the fixed surface into the substrate (note that the rate of heat flow is higher into the substrate) and consequently αm(θ) begins to fall. Due to the rapid cooling process, the temperature reaches the ambient value in about 60 s. The temperature distribution in the layers is given in Fig. 3 and the value of temperature (θ) is higher towards the core than towards the surface, as is to be expected. Volumetric shrinkage in the first three seconds is not too evident. This can be attributed to the re-heating of the relatively cooler layer each time continuity is established between consecutive layers. Once all the layers are laid, and the entire system starts cooling, the volumetric shrinkage becomes strikingly apparent. The reference configuration of the layers have been superimposed on all the plots, and it indicates the final volume to be approximately 9% less than the initial volume (refer to Figs. 3d–7d). The arrows superimposed on the plots represent the local displacement vector during the process. As the material cools from the edges of the geometry, it is being pulled in, i.e., the ux components of the displacement field are positive and uy components are negative (the orientation of the basis are given in Fig. 2). Towards the core, the ux components become negligible and only the uy components survive. However, when the existing layers are re-heated each time a new layer is laid, the core of the geometry starts expanding due to the inflow of heat, which leads to negative ux components and positive uy components at the core, although, the net effect of uy is in the negative direction throughout the material. Thus, the resultant displacement vectors near the corners would be directed downwards at an acute angle 18
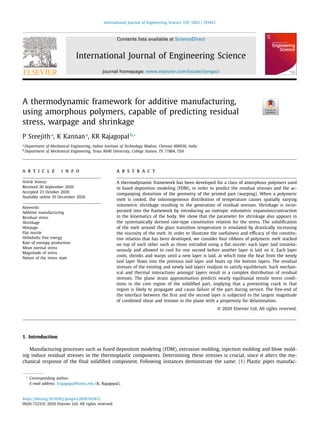
  • 19. P. Sreejith, K. Kannan and K. Rajagopal International Journal of Engineering Science 159 (2021) 103412 Fig. 7. Banded contour plots of the total rate of entropy production (ξtot m ) visualised on the deformed configuration. (clockwise) with respect to the x-direction, whereas the resultant displacement vectors at the core would be initially di- rected downwards (refer to Figs. 3a–7a), and later due to re-heating, as time proceeds it would be directed downwards at an obtuse angle (clockwise) with respect to the x-direction (refer to Figs. 3d–7d). The thermal and mechanical interactions lead to a complicated distribution of the residual stresses (refer to Figs. 4 and 5) and consequently the modes of deformation (refer to Fig. 6). The complexity is profound in the vicinity of the stepped geom- etry, whereas towards the opposite end, the distribution becomes one dimensional, i.e., in the y-direction. The magnitude of the stresses are negligible during the initial time steps (refer to Fig. 4a–4c and Fig. 5a–5c) due to the relatively lower volume shrikange. Re-heating of the layers, each time continuity is established, further adds to the relaxation of stresses. Magnitude of the stresses shoot up drastically when the temperature falls below θg, which is expected since the viscosity of the polymer increases sharply at θg, and finally, the stresses freeze when the temperature is sufficiently below θg (refer to Figs. 3d, 4d and 5d). Another reason for a large magnitude of stresses being induced in the material (refer to Figs. 4d and 5d), is due to the high rate of cooling (refer to Table1), which does not give enough time for the material to undergo stress relaxation. To understand the distribution of the modes, we consider a shear superposed unequi-triaxial stress state of the material points. We mark points A, B and C on three different zones corresponding to three different modes of deformation, as shown in the Fig. 6d. Note that the plane strain assumption constrains stress in the z-direction, i.e. Tzz, to remain positive throughout the process. The stress state at point “A” is given by: Txx = 0.5 MPa, Tyy = 0.73 MPa, Tzz = 27.7 MPa and Txy = -0.19 MPa. The magnitude of the Tzz component is two orders higher than Txx, Tyy and Txy components. Therefore, we can conclude that the mode of deformation of the material point “A” is close to uniaxial tension in the z-direction with K3 ≈ 0.52. Similarly, the mode of deformation of other points lying in the same zone will be close to uniaxial tension in the z-direction. 19
  • 20. P. Sreejith, K. Kannan and K. Rajagopal International Journal of Engineering Science 159 (2021) 103412 Fig. 7. Continued Next, the stress state at point “B” is given by: Txx = 16.6 MPa, Tyy = -0.186 MPa, Tzz = 34.8 MPa and Txy = 5.13 MPa. The Txy component is quite significant, and therefore, the zone in which point “B” lies is close to a pure shear mode of deformation with K3 ≈ 0. Finally, the stress state at point “C” is given by: Txx = 45.2 MPa, Tyy = -1.49 MPa, Tzz = 47.5 MPa and Txy = 9.56 MPa. Txx and Tzz components are approximately same and positive. Also, they are one order higher than that of Tyy (which is negative) and Txy. Therefore, the mode of deformation at point “C” is close to equibiaxial tension, and hence, the zone in which point “C” lies has K3 ≈ −0.52. Subsequently, we conclude that, the material at the top corners of all the layers are close to uniaxial tension, while the material at the core is close to equibiaxial tension. The ratio of mean normal stress ( K1 √ 3 ) to the norm of the deviatoric stresses (K2) is much less than 1 at the top corners of the layers and close to 1 at the core. Therefore, the corners are dominated by the distortional stresses, whereas, the core is dominated by the mean normal stress, implying that, dimensional instability is more at the corners than at the core. This is further supported by the bulging and the warping observed in the neighbourhood of the stepping at the final stages of the simulation (refer to Figs. 3d–7d). Warping can also be understood based on the direction of the components of the displacement fields at the top corners, where, ux is positive and uy is negative. Therefore, the material at the topmost corner will get pushed out, leading to warping. During the entire process, the total rate of entropy production has to be maintained non-negative. This needs to be checked a posteriori at every time step of the process. The plots of total rate of entropy production at some chosen time steps have been given in Fig. 7a–7d, and the values remain positive as expected. 3.6.2. Stress concentrations and delamination In a practical setting, the interfaces between the layers have discontinuities, and therefore, the inter-layer strength is usually the weakest, which often causes delamination of the layers for a component fabricated by FDM. Even though, in the current analysis, the interfaces are perfect, we assume that the layers have a “tendency” to delaminate. Fig. 8 helps us 20
  • 21. P. Sreejith, K. Kannan and K. Rajagopal International Journal of Engineering Science 159 (2021) 103412 Fig. 8. The stress components (Txy and Tyy) that are responsible for delamination (combination of mode I and mode II) of the layers, visualised along the length of all the three interfaces (semi-log plot), after the melt has solidified (t = 60 s). visualise the stress components responsible for delamination along the length of each of the interfaces. Only Tyy and Txy components of the stress tensor cause delamination. Tyy component tends to pull the layers apart (mode I delamination), whereas, Txy component tends to slide the layers in the plane of the interface (mode II delamination). It is observed that, Tyy component becomes compressive in the region that is sufficiently away from the stepped end. Therefore, in this region, delamination can occur only due to the Txy component (mode II delamination). The tendency to delaminate is the highest for the interface between the first and the second layer. The effect of mode I and mode II delamination tendencies, and the traction free condition on the free edges, lead to the formation of stress concentrations in the neighbourhood of the stepping (refer to Fig. 5d). If delamination occurs, and the interface breaks apart near the stepping, the stress concentrations would be relieved. The stress components are the highest (order of seven and eight) in the region of the stress concentration of the first layer. Therefore, yielding is most likely to occur in this region and lead to a ductile failure termed as “intra-layer fracture”. Usually, inter-layer fracture due to delamination and other discontinuities are the most common type of failure, compared to the intra-layer fracture caused by stress concentrations (see de Macedo Ferreira, 2017). Therefore, a component fabricated by FDM, when in service, will most probably fail due to the delaminated interfaces termed as“inter-layer fracture”. 4. Conclusion A thermodynamic framework was developed to determine the differential volumetric shrinkage caused by drastic tem- perature gradients, the ensuing residual stresses and consequently the dimensional instability of the geometry, by building on an existing theory which required the definition of two primitives: Helmholtz free energy and the rate of entropy pro- duction. The theory is most suitable for processes that use amorphous polymers or polymers which do not crystallize much. The efficacy of the constitutive relation was verified by considering a prototypical FDM process in which four layers of polystyrene melt were laid, such that, plane strain conditions could be enforced. As soon as the layers were laid, it underwent a complex thermo-mechanical process which included rapid cooling, re- heating, solidification at the glass transition temperature (θg) and redistribution of the residual stresses. Although, a high value of the shear modulus caused stresses in the range of kilo Pascals in the melt phase, it is quite insignificant as com- pared to the stresses in the solid phase. This result is in keeping with the reasoning put forward by Xinhua et al. (2015), Wang et al. (2007), Park (2005) and de Macedo and Ferreira (2017), who have confined the analysis to the solidified polymer since the stresses in the melt phase can be assumed to be negligible. The mean normal stress distribution at the final time step (refer to Fig. 4d) seems to follow a similar trend, in comparison to the mean normal stress distribution reported by Xia et al. (2018b) (refer to Fig. 8 in Xia et al., 2018b). The plane strain approximation caused the outer corners of the layers to be close to uniaxial tension and the core to be close to equibiaxial tension. During service, there is a high probability for a pre-existing crack at the core to open up in the x − z plane due to the equibiaxial tension. Further, in a practical setting, analogous to the current analysis, if the interfaces are highly porous, a large amount of inter-layer fracture (a combination of mode I and mode II) is expected at the stepped ends as compared to intra-layer fractures caused by stress concentrations. Another major dimensional instability that occurrs is the warping of the geometry. Warping can be reduced by making the corners in the stepping smoother. More smooth the corners are, less the degree of warping. The possibility of delamination, warping and the magnitudes of the stress concentrations, can be reduced by choosing the right combination of rate of cooling, substrate temperature, re-heating and the geometry for the PS layers, which reduces the magnitude of the “freezed in” stresses (see Macedo de Macedo Ferreira, 2017). 21
  • 22. P. Sreejith, K. Kannan and K. Rajagopal International Journal of Engineering Science 159 (2021) 103412 Declaration of Competing Interest The authors have no conflict of interest. References Armillotta, A., Bellotti, M., Cavallaro, M. (2018). Warpage of FDM parts: Experimental tests and analytic model. Robotics and Computer-Integrated Manufac- turing, 50, 140–152. https://doi.org/10.1016/j.rcim.2017.09.007. Avrami, M. (1939). Kinetics of phase change. I general theory. The Journal of Chemical Physics, 7(12), 1103–1112. https://doi.org/10.1063/1.1750380. Borges, R. A., Choudhury, D., Zou, M. (2018). 3D printed PCU/UHMWPE polymeric blend for artificial knee meniscus. Tribology International, 122, 1–7. https://doi.org/10.1016/j.triboint.2018.01.065. Casavola, C., Cazzato, A., Moramarco, V., Pappalettera, G. (2017). Residual stress measurement in fused deposition modelling parts. Polymer Testing, 58, 249–255. https://doi.org/10.1016/j.polymertesting.2017.01.003. Casavola, C., Cazzato, A., Moramarco, V., Pappalettere, C. (2016). Orthotropic mechanical properties of fused deposition modelling parts described by classical laminate theory. Materials Design, 90, 453–458. https://doi.org/10.1016/j.matdes.2015.11.009. Cattenone, A., Morganti, S., Alaimo, G., Auricchio, F. (2018). Finite element analysis of additive manufacturing based on fused deposition modeling: Dis- tortions prediction and comparison with experimental data. Journal of Manufacturing Science and Engineering, 141(1). https://doi.org/10.1115/1.4041626. 011010 Chai, Y., Forrest, J. A. (2018). Using atomic force microscopy to probe crystallization in atactic polystyrenes. Macromolecular Chemistry and Physics, 219(3), 1700466. https://doi.org/10.1002/macp.201700466. Chaoui, K., Chudnovsky, A., Moet, A. (1987). Effect of residual stress on crack propagation in MDPE pipes. Journal of Materials Science, 22, 3873–3879. Chen, M., Tan, Y., Wang, B. (2012). General invariant representations of the constitutive equations for isotropic nonlinearly elastic materials. International Journal of Solids and Structures, 49(2), 318–327. https://doi.org/10.1016/j.ijsolstr.2011.10.008. Comminal, R., Serdeczny, M. P., Pedersen, D. B., Spangenberg, J. (2018). Numerical modeling of the strand deposition flow in extrusion-based additive manufacturing. Additive Manufacturing, 20, 68–76. https://doi.org/10.1016/j.addma.2017.12.013. Costa, S., Duarte, F., Covas, J. (2015). Thermal conditions affecting heat transfer in FDM/FFE: A contribution towards the numerical modelling of the process. Virtual and Physical Prototyping, 10(1), 35–46. https://doi.org/10.1080/17452759.2014.984042. Dabiri, S., Schmid, S., Tryggvason, G. (2014). Fully resolved numerical simulations of fused deposition modeling. In Proceedings of the ASME international manufacturing science and engineering conference. In MSEC 2014. Detroit Doi, M., Edwards, S. F. (1986). The theory of polymer dynamics. Walton Street, Oxford: Oxford University Press. Donea, J., Huerta, A., Ponthot, J.-P., Rodríguez-Ferran, A. (2004). Arbitrary Lagrangian-Eulerian methods. Encyclopedia of computational mechanics. American Cancer Society. https://doi.org/10.1002/0470091355.ecm009. El Moumen, A., Tarfaoui, M., Lafdi, K. (2019). Modelling of the temperature and residual stress fields during 3d printing of polymer composites. The International Journal of Advanced Manufacturing Technology, 104, 1661–1676. https://doi.org/10.1007/s00170-019-03965-y. Espalin, D., Arcaute, K., Rodriguez, D., Medina, F., Posner, M., Wicker, R. (2010). Fused deposition modeling of patient-specific polymethylmethacrylate implants. Rapid Prototyping Journal, 16(3), 164–173. https://doi.org/10.1108/13552541011034825. Freitag, L., Gördes, M., Zarogoulidis, P., Darwiche, K., Franzen, D., Funke, F., . . . Dutau, H. (2017). Towards individualized tracheobronchial stents: Technical, practical and legal considerations.. Respiration: Interventional Pulmonology, 94, 442–456. https://doi.org/10.1159/000479164. González-Henríquez, C. M., Sarabia-Vallejos, M. A., Rodriguez-Hernandez, J. (2019). Polymers for additive manufacturing and 4d-printing: materials, methodologies, and biomedical applications. Progress in Polymer Science, 94, 57–116. https://doi.org/10.1016/j.progpolymsci.2019.03.001. Green, A. E., Naghdi, P. M. (1977). On thermodynamics and the nature of the second law. Proceedings of the Royal Society of London. A. Mathematical and Physical Sciences, 357(1690), 253–270. https://doi.org/10.1098/rspa.1977.0166. Han, X., Yang, D., Yang, C., Spintzyk, S., Scheideler, L., Li, P., . . . Rupp, F. (2019). Carbon fiber reinforced peek composites based on 3D-printing technology for orthopedic and dental applications. Journal of Clinical Medicine, 8(2). https://doi.org/10.3390/jcm8020240. Harish, S., Devadath, V. R. (2015). Additive manufacturing and analysis of tibial insert in total knee replacement implant. International Research Journal of Engineering and Technology, 02, 633–638. Haynes, W. M. (2014). Hand book of chemistry and physics. 6000 Broken Sound Parkway NW, Suite 300: CRC Press. Hornberger, L. E., Devries, K. L. (October 1987). The effects of residual stress on the mechanical properties of glassy polymers. Polymer Engineering and Science, 27(19), 1473–1478. Kamal, M. R., Rai-Fook, R. A., Hernandez-Aguilar, J. R. (May 2002). Residual thermal stresses in injection moldings of thermoplastics: A theoretical and experimental study. Polymer-Plastics Technology and Engineering, 42(5), 1098–1114. Kannan, K., Rajagopal, K. R. (2004). A thermomechanical framework for the transition of a miscoelastic liquid to a viscoelastic solid. Mathematics and Mechanics of Solids, 9(1), 37–59. https://doi.org/10.1177/1081286503035198. Kannan, K., Rajagopal, K. R. (2005). Simulation of fiber spinning including flow-induced crystallization. Journal of Rheology, 49(3), 683–703. https://doi. org/10.1122/1.1879042. Kannan, K., Rao, I. J., Rajagopal, K. R. (2002). A thermomechanical framework for the glass transition phenomenon in certain polymers and its application to fiber spinning. Journal of Rheology, 46(4), 977–999. https://doi.org/10.1122/1.1485281. ten Kate, J., Smit, G., Breedveld, P. (2017). 3D-printed upper limb prostheses: A review. Disability and Rehabilitation: Assistive Technology, 12(3), 300–314. https://doi.org/10.1080/17483107.2016.1253117. PMID: 28152642 Kim, T., Trangkanukulkij, R., Kim, W. (2018). Nozzle shape guided filler orientation in 3d printed photo-curable nanocomposites. Scientific Reports, 8, 57–116. https://doi.org/10.1038/s41598-018-22107-0. van Krevelen, D., te Nijenhuis, K. (2009). Properties of polymers, fourth edition: Their correlation with chemical structure; their numerical estimation and prediction from additive group contributions. Linacre House, Jordan Hill, Oxford OX2 8DP, UK: Elsevier Science. Liu, J., Anderson, K. L., Sridhar, N. (2020). Direct simulation of polymer fused deposition modeling (FDM) an implementation of the multi-phase viscoelas- tic solver in OpenFOAM. International Journal of Computational Methods, 17(01), 1844002. https://doi.org/10.1142/S0219876218440024. Löffler, R., Koch, M. (2019). Innovative extruder concept for fast and efficient additive manufacturing. IFAC-PapersOnLine, 52(10), 242–247. https://doi.org/ 10.1016/j.ifacol.2019.10.071. 13th IFAC Workshop on Intelligent Manufacturing Systems IMS 2019 de Macedo, R. Q., Ferreira, R. T. L. (2017). Residual thermal stress in fused deposition modelling. ABCM International Congress of Mechanical Engineering. https://doi.org/10.26678/ABCM.COBEM2017.COB17-0124. Mark, J. E. (1999). Polymer data handbook. New York 10016: Oxford University Press. Marti, E., Kaisersberger, E., Moukhina, E. (2006). Heat capacity functions of polystyrene in glassy and in liquid amorphous state and glass transition. Journal of Thermal Analysis and Calorimetry, 85, 505–525. https://doi.org/10.1007/s10973-006-7745-5. Melchels, F. P., Domingos, M. A., Klein, T. J., Malda, J., Bartolo, P. J., Hutmacher, D. W. (2012). Additive manufacturing of tissues and organs. Progress in Polymer Science, 37(8), 1079–1104. https://doi.org/10.1016/j.progpolymsci.2011.11.007. Topical Issue on Biorelated polymers Melocchi, A., Parietti, F., Maroni, A., Foppoli, A., Gazzaniga, A., Zema, L. (2016). Hot-melt extruded filaments based on pharmaceutical grade polymers for 3D printing by fused deposition modeling. International Journal of Pharmaceutics, 509(1), 255–263. https://doi.org/10.1016/j.ijpharm.2016.05.036. Miller, A. A. (1968). Analysis of the melt viscosity and glass transition of polystyrene. Journal of Polymer Science Part A-2: Polymer Physics, 6(6), 1161–1175. https://doi.org/10.1002/pol.1968.160060609. 22
  • 23. P. Sreejith, K. Kannan and K. Rajagopal International Journal of Engineering Science 159 (2021) 103412 Muller, D., Chim, H., Bader, A., Whiteman, M., Schantz, J.-T. (2010). Vascular guidance: microstructural scaffold patterning for inductive neovascularization. Stem Cells International, 2011, 547247. https://doi.org/10.4061/2011/547247. Northcutt, L. A., Orski, S. V., Migler, K. B., Kotula, A. P. (2018). Effect of processing conditions on crystallization kinetics during materials extrusion additive manufacturing. Polymer, 154, 182–187. https://doi.org/10.1016/j.polymer.2018.09.018. Nyberg, E. L., Farris, A. L., Hung, B. P., Dias, M., Garcia, J. R., Dorafshar, A. H., Grayson, W. L. (2017). 3D-printing technologies for craniofacial rehabilitation, reconstruction, and regeneration. Annals of Biomedical Engineering, 45(1), 45–57. https://doi.org/10.1007/s10439-016-1668-5. Park, K. (2005). A study on flow simulation and deformation analysis for injection-molded plastic parts using three-dimensional solid elements. Polymer– Plastics Technology and Engineering, 43(5), 1569–1585. Rajagopal, K., Srinivasa, A. (2000). A thermodynamic frame work for rate type fluid models. Journal of non-Newtonian Fluid Mechanics, 88(3), 207–227. https://doi.org/10.1016/S0377-0257(99)00023-3. Rajagopal, K. R., Srinivasa, A. R. (2004a). On the thermomechanics of materials that have multiple natural configurations part i: Viscoelasticity and classical plasticity. Zeitschrift für angewandte Mathematik und Physik ZAMP, 55(5), 861–893. https://doi.org/10.1007/s00033-004-4019-6. Rajagopal, K. R., Srinivasa, A. R. (2004b). On thermomechanical restrictions of continua. Proceedings of the Royal Society of London. Series A: Mathematical, Physical and Engineering Sciences, 460(2042), 631–651. https://doi.org/10.1098/rspa.2002.1111. Rao, I., Rajagopal, K. (2001). A study of strain-induced crystallization of polymers. International Journal of Solids and Structures, 38(6), 1149–1167. https: //doi.org/10.1016/S0020-7683(00)00079-2. Rao, I. J., Rajagopal, K. R. (2000). Phenomenological modelling of polymer crystallization using the notion of multiple natural configurations. Interfaces and Free Boundaries, 2, 73–94. Rao, I. J., Rajagopal, K. R. (2002). A thermodynamic framework for the study of crystallization in polymers. Zeitschrift fur Angewandte Mathematik und Physik, 53, 365–406. https://doi.org/10.1007/s00033-002-8161-8. So, P., Broutman, L. J. (December 1976). Residual stresses in polymers and their effect on mechanical behavior. Polymer Engineering and Science, 16(12), 785–791. Sombatsompop, N., Wood, A. (1997). Measurement of thermal conductivity of polymers using an improved Lee’s disc apparatus. Polymer Testing, 16(3), 203–223. https://doi.org/10.1016/S0142-9418(96)00043-8. Song, Y., Li, Y., Song, W., Yee, K., Lee, K.-Y., Tagarielli, V. (2017). Measurements of the mechanical response of unidirectional 3D-printed PLA. Materials Design, 123, 154–164. https://doi.org/10.1016/j.matdes.2017.03.051. Sood, A. K., Ohdar, R. K., Mahapatra, S. S. (2010). Parametric appraisal of mechanical property of fused deposition modelling processed parts. Materials and Design, 31, 287–295. https://doi.org/10.1016/j.matdes.2009.06.016. Syuhada, G., Ramahdita, G., Rahyussalim, A. J., Whulanza, Y. (2018). Multi-material poly(lactic acid) scaffold fabricated via fused deposition modeling and direct hydroxyapatite injection as spacers in laminoplasty. AIP Conference Proceedings, 1933(1), 020008. https://doi.org/10.1063/1.5023942. Vaezi, M., Yang, S. (2015). Extrusion-based additive manufacturing of peek for biomedical applications. Virtual and Physical Prototyping, 10(3), 123–135. https://doi.org/10.1080/17452759.2015.1097053. Wang, T.-M., Xi, J.-T., Jin, Y. (2007). A model research for prototype warp deformation in the FDM process. The International Journal of Advanced Manufac- turing Technology, 33(11), 1087–1096. https://doi.org/10.1007/s00170-006-0556-9. Xia, H., Lu, J., Dabiri, S., Tryggvason, G. (2018a). Fully resolved numerical simulations of fused deposition modeling. part i: Fluid flow. Rapid Prototyping Journal, 24(2), 463–476. Xia, H., Lu, J., Tryggvason, G. (2018b). Fully resolved numerical simulations of fused deposition modeling. part ii solidification, residual stresses and modeling of the nozzle. Rapid Prototyping Journal, 24(6), 973–987. Xinhua, L., Shengpeng, L., Zhou, L., Xianhua, Z., Xiaohu, C., Zhongbin, W. (2015). An investigation on distortion of PLA thin-plate part in the FDM process. The International Journal of Advanced Manufacturing Technology, 79(5), 1117–1126. https://doi.org/10.1007/s00170-015-6893-9. Zoetelief, W. F., Douven, L. F. A., Housz, A. J. I. (1996). Residual thermal stresses in injection molded products. Polymer Engineering and Science, 36(14), 1886–1896. 23