Research problem statement
The main problem is to achieve mechanical strength to the polymers like Polylactic acid (PLA) by reinforcing with carbon fibres.
FDM printed polymer composites will be studied to demonstrate their strengths and weakness.
Methodology and Experimental design
The key elements of FDM include material feed mechanism, print head, liquefier, printing bed and gantry.
There are several operating parameters that are important in FDM including bead width, model build temperature, air gap, printing orientation and layer thickness.
In FDM, the filament is melted into semi liquid state at nozzle and is extruded layer by layer on the printing bed until complete component is fabricated.
FDM printed polymer composites will be tested and analysed.
Results and discussion
Build orientation in cube software
Results and discussions
Effect of tensile stresses with respect to the orientation
Afrose et al., observed that highest ultimate tensile stress of 38.7 Mpa was found in X-orientation range from 60 to 64% of raw PLA material
Results and discussionsMethodMaterials usedCarbon fiber content (wt%)Maximum Tensile Strength
(MPa)Tensile strength improvement (%) compared to pure polymerReferenceFused Deposition ModellingShort carbon fiber/ABS
Short glass fiber/ABS
5%
13%
18%
40%42
70.69
58.6
7024
194
140
115Zhong et al., tekinalp et al.,Direct write
Short carbon fibre/epoxy/silicon carbide whisker35%66.2127Compton et al.,FDM based Co-extrusionContinuous carbon fibre/PLA
Continuous carbon fibre/nylon6.6 vol%
34.5 vol%185.2
464.4335
446Van der klift et al.,
Matsuzaki et al.,
Results and discussions
Results and discussions
Download high-res image (117KB)
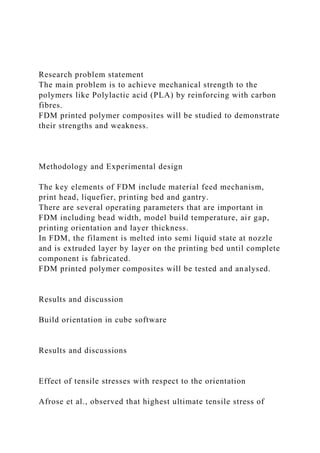
Microstructure of continuos CF reinforced PLA that represents continuos CF in the fracture surface (a,b) overall cross section; (c) interface (Tian et al.,)
conclusion
Continuous CF and PLA were blended successfully in printing head before deposition increasing the fibre matrix adhesion.
Due to this increase in tensile strength and flexural strength is observed.
the highest ultimate tensile stress of 38.7 Mpa was found in X-orientation range from 60 to 64% of raw PLA material.
The microstructure graph indicates that continuous CF in the fractural surface.
Therefore continuous CF reinforced PLA, printed by FDM has great potential to fabricate functional and load bearing component parts.
F U L L R E S E A R C H A R T I C L E
Effects of part build orientations on fatigue behaviour
of FDM-processed PLA material
Mst Faujiya Afrose1 • S. H. Masood1 • Pio Iovenitti1 • Mostafa Nikzad1 •
Igor Sbarski1
Received: 1 June 2015 / Accepted: 19 October 2015 / Published online: 10 November 2015
� Springer International Publishing Switzerland 2015
Abstract This paper investigates the fatigue behaviour of
polylactic acid (PLA) parts processed by fused deposition
modelling (FDM) additive manufacturing process. PLA is
becoming a commonly used thermoplastic in open-sour ...
ICT role in 21st century education and it's challenges.
Research problem statementThe main problem is to achieve mecha.docx
1. Research problem statement
The main problem is to achieve mechanical strength to the
polymers like Polylactic acid (PLA) by reinforcing with carbon
fibres.
FDM printed polymer composites will be studied to demonstrate
their strengths and weakness.
Methodology and Experimental design
The key elements of FDM include material feed mechanism,
print head, liquefier, printing bed and gantry.
There are several operating parameters that are important in
FDM including bead width, model build temperature, air gap,
printing orientation and layer thickness.
In FDM, the filament is melted into semi liquid state at nozzle
and is extruded layer by layer on the printing bed until complete
component is fabricated.
FDM printed polymer composites will be tested and analysed.
Results and discussion
Build orientation in cube software
Results and discussions
Effect of tensile stresses with respect to the orientation
Afrose et al., observed that highest ultimate tensile stress of
2. 38.7 Mpa was found in X-orientation range from 60 to 64% of
raw PLA material
Results and discussionsMethodMaterials usedCarbon fiber
content (wt%)Maximum Tensile Strength
(MPa)Tensile strength improvement (%) compared to pure
polymerReferenceFused Deposition ModellingShort carbon
fiber/ABS
Short glass fiber/ABS
5%
13%
18%
40%42
70.69
58.6
7024
194
140
115Zhong et al., tekinalp et al.,Direct write
Short carbon fibre/epoxy/silicon carbide
whisker35%66.2127Compton et al.,FDM based Co-
extrusionContinuous carbon fibre/PLA
Continuous carbon fibre/nylon6.6 vol%
34.5 vol%185.2
464.4335
446Van der klift et al.,
Matsuzaki et al.,
3. Results and discussions
Results and discussions
Download high-res image (117KB)
Microstructure of continuos CF reinforced PLA that represents
continuos CF in the fracture surface (a,b) overall cross section;
(c) interface (Tian et al.,)
conclusion
Continuous CF and PLA were blended successfully in printing
head before deposition increasing the fibre matrix adhesion.
Due to this increase in tensile strength and flexural strength is
observed.
the highest ultimate tensile stress of 38.7 Mpa was found in X-
orientation range from 60 to 64% of raw PLA material.
The microstructure graph indicates that continuous CF in the
fractural surface.
Therefore continuous CF reinforced PLA, printed by FDM has
great potential to fabricate functional and load bearing
component parts.
F U L L R E S E A R C H A R T I C L E
Effects of part build orientations on fatigue behaviour
4. of FDM-processed PLA material
Mst Faujiya Afrose1 • S. H. Masood1 • Pio Iovenitti1 • Mostafa
Nikzad1 •
Igor Sbarski1
Received: 1 June 2015 / Accepted: 19 October 2015 / Published
online: 10 November 2015
� Springer International Publishing Switzerland 2015
Abstract This paper investigates the fatigue behaviour of
polylactic acid (PLA) parts processed by fused deposition
modelling (FDM) additive manufacturing process. PLA is
becoming a commonly used thermoplastic in open-source
FDM machines for various engineering applications and it
is essential that mechanical properties and performance of
FDM-processed PLA parts must be properly understood.
Very little data exist on the fatigue performance of PLA
parts processed by FDM additive manufacturing. This
study looks at the effect of part build orientations on the
tensile fatigue properties of PLA material. A Cube 3D
printer was used to print dog-bone test specimens in three
5. (X, Y and 45�) different build orientations. These dog-bone
parts were based on ASTM D638 standard and were
cyclically tested at 80, 70, 60 and 50 % nominal values of
the ultimate tensile stress by using a Zwick Z010 universal
testing machine. Results show that in static loading, the
FDM-processed PLA parts in X build orientation exhibit
higher tensile stress, in the range of 60–64 % of that of
injection moulded PLA material, compared to those built in
Y and 45� orientations. But under tensile cyclic loading
condition, the parts in 45� build orientation show higher
fatigue life than the parts in X and Y build orientations for
the same percentage of applied static loads. This paper
adds knowledge to fill the gap on the fatigue characteristics
of the PLA parts processed through FDM and would be
useful in engineering design applications of such parts
subjected to cyclic loading conditions.
Keywords Fused deposition modelling �
Thermoplastics � Polylactic acid � Tensile fatigue
1 Introduction
Additive Manufacturing (AM) is a novel technology that
6. enables rapid fabrication of physical models directly from
three-dimensional computer-aided design (CAD) data
without any conventional tooling or programming
requirements. It offers greater design flexibility and allows
companies to turn first and effective design ideas into
successful prototypes and end products rapidly and effi-
ciently. First additive manufacturing systems appeared in
1986 with the introduction of Stereolithography technology
[1]. In early 1990s, other technologies were commer-
cialised including fused deposition modelling (FDM),
laminated object manufacturing (LOM) and selective laser
sintering (SLS). Stratasys introduced fused deposition
modelling (FDM) technology in 1991, which has since
become the most widely and commonly used AM process,
which builds parts in a layer-by-layer manner by extruding
semi-molten thermoplastic materials through a liquefier
nozzle on to a platform [2]. Recently, several entry level
and open-source FDM type machines have appeared in the
7. market, which can process a variety of thermoplastic
materials. These low cost AM machines not only serve as a
& S. H. Masood
[email protected]
Mst Faujiya Afrose
[email protected]
Pio Iovenitti
[email protected]
Mostafa Nikzad
[email protected]
Igor Sbarski
[email protected]
1
School of Engineering, Swinburne University of Technology,
Hawthorn, VIC 3122, Australia
123
Prog Addit Manuf (2016) 1:21–28
DOI 10.1007/s40964-015-0002-3
http://crossmark.crossref.org/dialog/?doi=10.1007/s40964-015-
0002-3&domain=pdf
http://crossmark.crossref.org/dialog/?doi=10.1007/s40964-015-
0002-3&domain=pdf
8. means of learning and communications in education [3] but
also offer applications in design verification and functional
testing of engineering parts. The Cube 2 3D Printers are
low cost small machines offering faster printability with
acrylonitrile butadiene styrene (ABS) and polylactic acid
(PLA) materials [4].
Because of light weight, ease of fabrication of complex
geometry and low cost, such thermoplastics parts processed
by FDM have been applied at a significant pace in engi-
neering and medical fields. Though the load-bearing parts
in industry are common engineering applications of ther-
moplastics [5], the leading applications of FDM thermo-
plastics are in biomedical and tissue engineering fields such
as novel scaffold architectures [6] and knotless suture
anchor [7]. Thus the knowledge of mechanical properties
of FDM materials is significant now-a-days. Many studies
have been done on ABS and polycarbonate (PC) thermo-
plastics to evaluate their mechanical properties as well as
9. fatigue data. Lee and Huang [8] have investigated the
fatigue data for several print orientations of ABS and
ABSplus materials processed by Stratasys FDM using a
Tinius Olsen H50KS testing machine. Also Ziemian et al.
[9] have investigated different build orientations of ABS
material to improve the mechanical properties. Masood
et al. [10] have determined the tensile strength of FDM-
processed polycarbonate (PC) and found it to be in the
range 70–75 % of the moulded and extruded PC parts.
Alhubail et al. [11] have optimised the FDM process
parameter of ABS-M30i biomedical material by using
Taguchi method and determined the surface roughness and
tensile strength which results in improved part quality.
It is well known that mechanical properties including
fatigue properties of plastic materials are affected by the
type of manufacturing processes used in making plastic
products. It is also known that layer-by-layer additive
process impart anisotropic properties in the built parts and
10. the AM process parameters also affect material properties
of the processed material. This is especially true for FDM
type process, which offers a wide range of process
parameters to influence the mechanical properties of the
FDM-processed parts. It is, therefore, necessary to under-
stand how such properties of different plastics processed by
various FDM processes vary due to different process
parameters and build orientations. There have been some
studies of mechanical properties of well-known additive
manufacturing materials such as ABS, but other 3D print-
ing materials such as PLA have received very little atten-
tion. In the published literature, some researchers have
investigated the mechanical properties of PLA as com-
posite materials added with many fibres [12, 13].
Jamshidian et al. [14] have presented a comprehensive
review of PLA properties and modifications via different
methods, like using modifiers, blending, copolymerizing,
and physical treatments, and have also discussed industrial
11. processing methods for producing different PLA films,
wrappings, laminates, containers, bottles and cups).
Tymark et al. [15] have recently investigated the
mechanical properties such as tensile strength and modulus
of elasticity of PLA materials processed by RepRap 3D
printers.
It is noted that fatigue properties of FDM-processed
PLA has not yet been addressed by researchers in pub-
lished work. Polylactic acid (PLA) is a compostable,
biodegradable thermoplastic made from renewable sources.
PLA’s good appearance, high mechanical strength, low
toxicity; and good barrier properties have contributed in
expanding its applications where the parts may encounter
cyclic loading conditions. Therefore, in this paper, an
experimental work is presented to investigate the fatigue
behaviour of FDM-processed PLA materials through using
flat dog-bone specimens under tensile cyclic loading. A
universal testing machine was used to conduct fatigue
12. testing at applied loads of different percentages of ultimate
tensile strength (UTS). The effect of build orientation was
investigated to understand the fatigue characteristics of the
PLA parts to obtain data helpful in design of such parts
subjected to cyclic loading conditions.
2 Part fabrication using FDM
The FDM type process used in the Cube-2 3D printer was
employed to fabricate the dog-bone shaped tensile samples
in X-, Y- and 45�- build orientations. The Cube 3D printers
are based on FDM type plastic jet printing technology
supplied by 3D Systems Inc. [16]. The filament material
cartridges that work with the Cube come in different col-
ours and can print around 13–15 medium size models from
a single cartridge. The Cube does not require any support
when part features are not angled more than 45� in the print
platform. Also, it allows moving the print head and the
platform together in X, Y and Z directions. In order to build
a part, Cubify software converts the 3D STL files into
printer cube files and offers three different print modes
13. called Solid, Strong and Hollow. Solid mode is suitable for
making solid functional model with best structural integ-
rity. Hollow mode provides thin roads with air gaps and
suitable for faster build. Strong mode is a mid-way between
Solid and Hollow modes using moderate road widths and
air gaps.
The print head heats the thermoplastics to molten state
and produces a thin flowing material of plastic creating
0.20 mm thickness of layers that adheres to the print
platform. The print head moves in one horizontal axis,
while the table moves in the other horizontal and vertical
directions. After each layer is produced, the print platform
22 Prog Addit Manuf (2016) 1:21–28
123
lowers so that a new layer can be drawn on top of the last.
This process continues until the last layer on the top of the
part is jetted.
14. In this study, the geometry of each fabricated dog-bone
shape specimen was taken according to ASTM D638 to
investigate the fatigue properties in tension [17]. Figure 1
shows the dimensions of the specimen used, which could
be fitted on the Cube 3D Printer. The 3D CAD model was
created using Creo parametric software and then converted
into Stereolithiography (STL) file. To achieve desired
creation, the chord height was set to 0 and angle control
was set to 1 while saving as STL file for the Cube software.
Typically building a part using different print modes and
different build directions will affect the part strength and
mechanical properties. In this study, Solid print mode and
three build orientations (X-, Y-, and 45�-) were used. Solid
print mode provides zero air gaps between the depositing
roads. Figure 2 shows the three build orientations in the
Cube software to make the PLA samples. Forty samples of
PLA materials in different orientations were printed to
carry out several tensile and fatigue testing. Since Cube
print head always moves parallel to the X-direction, the
15. deposited road pattern direction in the part will be affected
by the build placement of the part on the build table.
Figure 3 shows the deposited material tool path road pat-
tern used in the tensile specimen for each of the three build
orientations.
3 Fatigue testing
Fatigue tests are considered when parts are expected to
perform under cyclic load applications. In recent years,
researchers have paid more attention on the fatigue beha-
viours of plastics as plastics are increasingly being used in
aerospace, automotive, biomedical and other leading
industries. Like all engineering materials, if plastic parts
are considered under repetitive loading then it is important
to know the fatigue life of such parts. In general, thermo-
plastics are more sensitive to various parameters and these
parameters include stress or strain amplitude of the loading
cycle, mean stress, stress or strain rate, initial defects
present in the component, temperature, frequency and
16. environment. These factors are to be considered when
designing the part for the fatigue life under cyclic loading
and would provide a better understanding to define mate-
rials to be used in specific applications.
For fatigue testing, a Zwick Z010 universal testing
machine was used, which allows a maximum 10 kN load
capacity. The machine was controlled by testXpert
�
II
intelligent software to control and record all test data. It
was observed that a higher frequency increases the body
temperature of the specimen, which results in the decrease
of fatigue life by enabling material flow and increasing
ductility, localised deformation at the weakest section of
the gauge length. Conversely, a lower frequency results in
an increased fatigue life appearing mostly in brittle fracture
with limited deformation over the gauge length [18]. So the
tests were set at a frequency of 1 Hz at room temperature.
17. No specimen temperature control device was supplied
during the test due to the requirements defined for the test
programme. The wedge style cross-hatched grips were
used for proper griping of the specimens as shown in
Fig. 4.
In order to do fatigue tests, it was important to know the
ultimate tensile strength (UTS) of specimens, and there-
fore, three PLA specimens were tested statically to deter-
mine the UTS for each of the three distinct orientations at a
strain rate of 50 mm/min as reported earlier [19]. The static
tensile testing of the PLA plastic specimen was conducted
according to ASTM D638 using the same Zwick Z010
testing machine. Five samples for each build orientation
were used with a single pull until failure to determine
ultimate tensile stresses and to average the tensile results.
Figure 5 shows the static stress–strain curve obtained for
the PLA samples for the 3 build orientations. In cyclic test
programme, the test parameters were kept unchanged for
18. each tested specimens at various applied load conditions
over the cycles. To set the number of cycles, three speci-
mens for the three different orientations were tested and
then set to 5000 cycles to overcome the data overflow in
the test programme. The applied load was varied at 50, 60,
70 and 80 % of UTS from specimen to specimen during
testing. Due to time consuming nature of cyclic loading
experiment in a tensile tester, only one specimen was tested
for each orientation and maximum load as the objective
was to see the trend in the fatigue behaviour of PLA parts
in build orientations.
4 Results and discussion
As noted earlier, all samples were subjected to uniaxial
tension while conducting static and fatigue tests. The pull-
out and retraction were controlled within its maximum and
10 mm
4 mm
15 mm
20 mm
19. 76 mm
50 mm
105 mm
135 mm
Fig. 1 Dimensions of the specimen
Prog Addit Manuf (2016) 1:21–28 23
123
minimum load for each specimen. Static stress–stress
graphs of Fig. 5 show that the ultimate tensile stresses of
fabricated specimens for the three different orientations are
different since it depended on build styles and orientations,
rather than the material itself.
Though the tensile strength of the raw material was more
consistent and higher than the FDM specimens, it was
observed that the tensile stress was around 60–64 % of the
generic raw PLA materials [19]. The output excel file of
tensile test provides tables for maximum force, elongation at
maximum force, force at break and elongation at break. The
20. data were post-processed into stress, strain and number of
cycles using Matlab script. Table 1 shows the average values
of UTS and average values of modulus of elasticity obtained
by static testing and the amount of applied stress at 80, 70, 60
and 50 % of UTS used during fatigue testing for each of these
three orientations. Figure 6 shows the typical pull history
while cyclically loading at 50 % of UTS for the specimens of
three orientations named as PLA-X, PLA-Y and PLA-45�,
4 4(c) 45
o-orientation
XY
(b)Y-orientation
XY
Y
(a) X-orientation
X
Fig. 2 Build orientations in
Cube software
(a) X-orientation (c) 45 o-orientation(b) Y-orientation
21. Fig. 3 Deposited toolpath
pattern on the specimen in three
build orientations
Fig. 4 Specimen holding in a 10 KN Zwick machine
Fig. 5 Static stress vs. strain graph of PLA tensile specimens
built in
different orientations
24 Prog Addit Manuf (2016) 1:21–28
123
respectively. It should be noted that stress–strain behaviour
obtained under cyclic loading is quite different from that
under static loading condition. In general, the yield strength
in tension or compression gets reduced after applying cyclic
load of the same magnitude but of opposite signs. The area
within a hysteresis loop represents the energy dissipated
during a cycle, usually in the form of heating. This energy
represents the plastic work from the cycle. Depending upon
the type of material used, the mechanism of cyclic hardening
or cyclic softening also occurs due to dislocation of sub-
22. structure within the material. Changes in cyclic deformation
behaviour are more evident at the start of the cyclic loading
and the material gradually stabilises with continued cycling.
As shown in Fig. 6, PLA parts built in 45 orientation show
higher cycle softening than the parts built in X- and
Y-orientations.
As shown in Table 1, the specimen in Y-orientation has
lower tensile stress than in X- and 45�-orientations. In
X-orientation, the deposited roads are aligned and bonded
parallel to the longer dimension of the specimen, and
therefore it offers maximum resistance to deformation in
tension. In Y-orientation, the deposited roads are
perpendicular to the longer dimension of the specimen (see
Fig. 3), and therefore offer least resistance to deformation
in tension. In 45 build orientation, the roads are inclined at
45 to longer length of specimen, and hence offer inter-
mediate level of resistance to deformation. This trend is
clearly visible in the measured values in Table 1. However,
23. as shown in Fig. 6, the Y-orientation has displayed better
ductility as compared to other two orientations. Note that
from stress–strain graphs, the modulus of elasticity of PLA
for three distinct orientations were worked-out by plotting
slope on its elastic region while specimens were tested to
determine the UTS for each orientation.
Generally, parts fail in high stress concentration area
under cyclic loading applications. For homogeneous parts, a
failure should appear directly in the middle of the part.
Figure 7 shows the failure profile of tested specimens for
three build orientations. The failure profile of the specimens
appears in different locations due to the different build style
road pattern in each build orientations, which affect the
material properties. From Fig. 7, it can be seen that the
fatigue failure location for the X-orientation specimens
appeared consistently at the same location across the neck as
Table 1 Data outlining the average ultimate tensile stress (ru),
average modulus of elasticity and applied load in percentage of
UTS
26. Strain (%)
0 12 3 4
St
re
ss
(M
P
a)
0
5
10
15
20
(c) 45o-orientation
Fig. 6 PLA specimens showing
the pull history at 50 % of the
ultimate tensile stress
Prog Addit Manuf (2016) 1:21–28 25
123
27. the build pattern roads are along the length of the tensile
sample (see Fig. 4). In the Y- and 45�-orientation specimens,
the build pattern roads were either perpendicular or at 45� to
the length of the sample, and this resulted in failure at dif-
ferent locations where the parts were highly stressed.
Because of the sensitivity in many factors, the fatigue
test conditions must closely mimic the service conditions
of the thermoplastic part and the S–N approach is widely
accepted in the engineering community for design appli-
cations when considering cyclic loading. Figure 8 shows
the stress vs. numbers of cycles to failure curves (S–N
curves) for X-, Y- and 45�-orientations specimens sub-
jected to static stress at their 50, 60, 70 and 80 % of UTS.
Despite the inevitable scatter, the pattern of behaviour
appears to be similar for all three build orientation parts
and each point shows the failure point of each specimen
when they are cyclically loaded at a certain percentage of
their UTS value. Note that the average values of UTS for
X-, Y- and 45�- orientation specimens were 38.7, 31.1 and
33.6 MPa, respectively, as in Table 1. From Fig. 8, it can
28. be seen that although the X-orientation specimens experi-
enced highest UTS, it generated lower fatigue life cycle
than other two orientation specimens. However, the spec-
imen in 45�-orientation had lower UTS than the X-orien-
tation specimen, but it showed a higher number of fatigue
life cycles than X- and Y-orientation specimens. This trend
is due to build orientations of printed specimens and build
pattern road in relation to build direction. It was observed
that for 45�-orientation specimen at approximately 50 % of
UTS, the number of cycles is roughly 1380 until its fail-
ure.The area under the stress–strain curve is the modulus of
toughness or total strain energy per unit volume consumed
by the material until failure. The strain energy can be
calculated by using the following formula.
Total strain energy Uð Þ ¼
Z�
0
r d 2 ð1Þ
where r is the stress and 2 is the strain.
(a) X-orientation (b) Y-orientation specimens
29. (c) 45o-orientation specimens
Fig. 7 Overview of fatigue
tested PLA specimens
10
0
10
2
10
4
0
10
20
30
40
Number of Cycles (N)
St
re
ss
(M
Pa
)
30. PLA-X
PLA-Y
PLA-45
Fig. 8 S–N curves for three build orientations (X, Y and 45�)
orientations
26 Prog Addit Manuf (2016) 1:21–28
123
Therefore, if the stress–strain curve is integrated
numerically, the total strain energy can easily be calcu-
lated. In this study, the total strain energy was calculated by
using a Matlab function ‘‘trapz’’ which numerically cal-
culates the total area under the stress–strain curve, i.e., the
total strain energy. Figure 9 shows the total strain energies
for three distinct build orientations for specimens stressed
at 50 % of their UTS. From Fig. 9, it can be observed that
the 45�-orientation specimen experienced higher strain
energy as compared to other build orientations with a value
of 2048.9 kJ m
-3
until it failed at 1380 cycles. On the
31. other hand, the specimens in X- and Y- orientations
experienced strain energy of 466.69 and 1421.69 kJ m
-3
,
respectively, and the numbers of cycle until failure for X-
and Y-orientations were 175 and 708, respectively. These
three trends were consistently presented for all other tested
specimens subjected to loading of 60, 70 and 80 % of UTS.
Typically the strain energy decreases while testing at
higher tensile stress. Figure 10 shows the strain energy vs.
cyclic load for 50, 60, 70 and 80 % of UTS for specimens in
all three build orientations. From Fig. 10, it can be observed
that the specimen in 45�-orientation experienced highest
strain energy with respect to the percentage of cyclic loading
conditions from other orientations. Thus, this study reveals
that the PLA specimens printed in 45�-orientations have
higher modulus of toughness, absorb more energy and last
longer till failure under fatigue loading conditions compared
to the PLA specimens built in the X- and Y-orientations
32. specimens. This aspect is to be considered when designing
FDM built parts for cyclic loading applications.
5 Conclusions
In this work, an experimental analysis of fatigue charac-
teristics of fused deposition modelling processed PLA
thermoplastics was carried out considering the effect of
different build orientations. It was observed that the ulti-
mate tensile stress of PLA samples built in X-direction
(PLA-X) was found to be the highest at 38.7 MPa and
ranged from 60 to 64 % of raw PLA material, while for
PLA-Y and PLA-45, the values were lower at 31.1 and
33.6 MPa, respectively. Also, it was observed that under
cyclic loading application the PLA specimens built in 45� -
orientations achieved highest fatigue life compared to those
PLA specimens built in X- and Y- orientations. PLA
specimens built in 45-orientation also displayed best
capacity to store strain energy compared to those built in
other two orientations. This study will assist in developing
design guidelines for application of FDM built parts used
33. in cyclic loading conditions. Further work in this area will
include an investigation on how the fatigue life and total
strain energy may be influenced by different strain rates
and frequency of tests. Moreover it will be useful to study
the effect of temperature, environment, surface finish and
mode of loading (compressive, flexural) to gather a more
comprehensive knowledge on fatigue behaviour of FDM
made parts. Such data would be extremely useful to design
parts as more and more additive manufactured parts and
materials are being applied to various engineering appli-
cations in different loading conditions.
Acknowledgments Authors acknowledge technical support of
Mr
Warren Gooch for specimens making in the product design lab.
References
1. Hull CW (1986) Apparatus for production of three-
dimensional
objects by Stereolithography. Patent 4, 575, 330, UVP, Inc., San
Gabriel, CA
34. 2. Chua CK, Leong KF, Lim CS (2003) Rapid prototyping: prin-
cipals and applications, 2nd edn. World Scientific, Singapore
0 500 1000 1500
0
500
1000
1500
2000
2500
Number of Cycles (N)
St
ra
in
E
ne
rg
y
(k
J/
m
3)
35. PLA-X
PLA-Y
PLA-45
Fig. 9 Strain energy vs. number of cycles curves at 50 % of UTS
for
the three build orientations
50 60 70 80
0
500
1000
1500
2000
2500
Cyclic Load (% of UTS)
St
ra
in
E
ne
rg
y
(k
J/
36. m
3)
PLA-X
PLA-Y
PLA-45
Fig. 10 Strain energy vs. percentage of UTS for specimens in
different orientations (X, Y and 45�)
Prog Addit Manuf (2016) 1:21–28 27
123
3. Kostakis V, Niaros V, Giotitsas C (2014) Open source 3D
printing as a means of learning: an educational experiment in
two
high schools in Greece. Telemat Inf 32:118–128. doi:10.1016/j.
tele.2014.05.001
4. 3D Systems, Cube 2. http://www.3dsystems.com/zh/3d-
printers/
personal/cube. Accessed 28 May 2015
5. Stokes VK (1995) Thermoplastics as engineering materials:
the
mechanics, materials, design, processing link. J Eng Mater
37. Technol 117:448–455
6. Zein I, Hutmacher DW, Tan KC et al (2002) Fused deposition
modeling of novel scaffold architectures for tissue engineering
applications. Biomaterials 23:1169–1185. doi:10.1016/S0142-
9612-(01)00232-0
7. Pietschmann MF, Froehlich V, Ficklscherer A et al (2008)
Biomechanical testing of a new knotless suture anchor
compared
with established anchors for rotator cuff repair. J Shoulder Elb
Surg 17:642–646. doi:10.1016/j.jse.2007.11.017
8. Lee J, Huang A (2013) Fatigue analysis of FDM materials.
Rapid
Prototyp J 19:291–299. doi:10.1108/13552541311323290
9. Ziemian C, Sharma M, Ziemian S (2012) Anisotropic
mechanical
properties of ABS parts fabricated by fused deposition
modelling.
In: Gokcek M (ed) Mechanical Engineering, InTech, pp 159–
180
10. Masood SH, Mau K, Song WQ (2010) Tensile properties of
processed FDM polycarbonate material. Mater Sci Forum
38. 654–656:2556–2559
11. Alhubail M, Alenezi D, Aldousiri B (2013) Taguchi-based
opti-
misation of process parameters of fused deposition modelling
for
improved part quality. Int J Eng Res Technol 2:2505–2519
12. Dong Y, Ghataura A, Takagi H et al (2014) Polylactic acid
(PLA)
bio composites reinforced with coir fibres: evaluation of
mechanical performance and multifunctional properties.
Compos
Part A Appl Sci Manuf 63:76–84
13. Kasuga T, Ota Y, Nogami M et al (2000) Preparation and
mechanical properties of polylactic acid composites containing
hydroxyapatite fibres. Biomaterials 22:19–23
14. Jamshidian M, Tehrany Muhammad Imran M, Jacquo M,
Desobr
S (2010) Poly-lactic acid: production, applications, nanocom-
posites, and release studies. Compr Rev Food Sci Food Saf
9:552–571
39. 15. Tymark BM, Kreiger M, Pearce JM (2014) Mechanical
properties
of components fabricated with open-source 3-D printers under
realistic environmental conditions. Mater Des 58:242–246
16. 3D Systems, Cube. http://www.3dsystems.com/. Accessed
28
May 2015
17. ASTM (2010) D638-10 Standard test method for tensile
proper-
ties of plastics. American Society for Testing and Materials,
USA
18. Zoroufi M (2013) Significance of fatigue testing parameters
in
plastics versus metals. Article in http://softlaunch.element.quba.
co.uk/. Accessed 28 May 2015
19. Afrose MF, Masood SH, Nikzad M et al (2014) Effects of
build
orientations on tensile properties of PLA material processed by
FDM. Adv Mater Res 1044–1045:31–34
28 Prog Addit Manuf (2016) 1:21–28
123
41. , Amit K.
Naskar
a
, Craig A. Blue
b
, Soydan Ozcan
a
*
a
Material Science and Technology Division, Oak Ridge National
Laboratory, 1 Bethel Valley Rd, Oak Ridge, TN
37830
b
Manufacturing Demonstration Facility, NTRC II, Oak Ridge
National Laboratory, 2360 Cherahala Blvd, Knoxville, TN
37932
*Correspondence to: [email protected]; 865-241-2158
Abstract
Additive manufacturing, diverging from traditional
manufacturing techniques, such as casting
and machining materials, can handle complex shapes with great
design flexibility without the
typical waste. Although this technique has been mainly used for
42. rapid prototyping, interest is
growing in using this method to directly manufacture actual
parts of complex shape. To use 3D-
printing additive manufacturing in wide spread applications, the
technique and the feedstock
materials require improvements to meet the mechanical
requirements of load-bearing
components. Thus, we investigated the short fiber (0.2 mm to
0.4 mm) reinforced acrylonitrile-
butadiene-styrene composites as a feedstock for 3D-printing in
terms of their processibility,
microstructure and mechanical performance; and also provided
comparison with traditional
compression molded composites. The tensile strength and
modulus of 3D-printed samples
increased ~115% and ~700%, respectively. 3D-printer yielded
samples with very high fiber
orientation in printing direction (up to 91.5 %), whereas,
compression molding process yielded
samples with significantly less fiber orientation.
Microstructure-mechanical property
relationships revealed that although the relatively high porosity
is observed in the 3D-printed
composites as compared to those produced by the conventional
43. compression molding
technique, they both exhibited comparable tensile strength and
modulus. This phenomena is
explained based on the changes in fiber orientation, dispersion
and void formation.
mailto:[email protected]
1. Introduction
Rapid prototyping (RP) is a technology in which a part can be
built layer by layer to a desired
geometry based on a computer-aided design (CAD) model. With
RP, complex parts can easily be
built in reasonable timeframes [1-3]. Therefore, use of this
technology as a manufacturing
process along with conventional manufacturing techniques can
significantly improve and boost
the manufacturing industry.
Fused deposition modeling (FDM), a leading RP technique,
accomplishes the layer-by-layer
build by depositing a material extruded through a nozzle in a
raster pattern (i.e., in a pattern
that is composed of parallel lines) in each layer [4,2,1,5].
However, because only a limited
number of materials, such as thermoplastics and some
44. engineering plastics, have been used as
a feedstock for FDM, the final products have limited mechanical
properties [6,7]. Therefore, to
render this technology suitable for producing functional, load-
bearing parts, FDM protocols are
needed for materials development and for the manufacturing of
composite products.
Fiber reinforcement enhances the properties of resins/polymeric
matrix materials [8-11].
Although continuous fiber composites offer high mechanical
performance, their processing is
not commonplace. More commonly used for traditional low-cost
composite part fabrication are
the short fiber-reinforced polymers (SFRPs) with moderately
improved mechanical properties
[3,12,13,14]. SFRPs are typically produced by extrusion
compounding and injection molding
processes [15-20]. The mechanical properties of these SFRPs
depend significantly on the fiber
length distribution and fiber orientation distribution of the final
parts [3,14,21]. During
processing, fiber breakage occurs [3], affecting the mechanical
properties of the final composite
part. And the higher the fiber loading, the higher is the fiber
breakage, due to increased fiber–
fiber interaction [15,22,23]. Fiber breakage during processing
also arises from the interaction of
fibers with polymers, and processing equipment surfaces [3].
Therefore, the matrix material,
the process conditions, and the fiber loading determine the final
fiber length distribution of the
composite. Similarly, fiber orientation distribution and void
fraction of final SFRPs are also
affected by the aforementioned factors.
45. Only a few studies report FDM of fiber-reinforced feedstock.
Among these, Gray IV et al. [4]
added thermotropic liquid crystalline polymer fibrils into
polypropylene in order to prepare a
composite feedstock for FDM. A capillary rheometer was used
to simulate the FDM process,
and, subsequently, the tensile properties of the extruded strands
were measured. Zhong et al.
[2] studied FDM processing of short glass fiber-reinforced
acrylonitrile-butadiene-styrene (ABS)
resin. Additions of plasticizer and compatibilizer improved
feedstock processibility. Shofner et
al. [6] investigated the effect of vapor-grown carbon fibers into
ABS as an FDM feedstock. An
average of 39% increase in tensile strength was observed at 10
wt% loading of nanofiber. To
the best of our knowledge, FDM processing of 5–7 μm diameter
short carbon fiber-reinforced
resin has not been reported, despite its high potential to reach
desired mechanical, electrical
and thermal properties, and low density [24-26]. Thermoplastic
matrix composites further
provide improved toughness and recyclability [25,27].
In this study, carbon fiber–ABS composite was successfully
prepared and used as an FDM
feedstock. Short carbon fiber-reinforced ABS composites at
different fiber loadings were
prepared by both compression molding (CM) and FDM in order
to assess the strengths and
weaknesses of the FDM process (in comparison with the more
conventional CM process).
46. Effects of the process and fiber loading on void formation,
average fiber length, and fiber
orientation distribution, and eventually their effect on the
tensile strength and modulus of the
final printed product, were investigated.
2. Experimental
2.1. Materials and processing
ABS copolymer (GP35-ABS-NT) was obtained from M Holland
Co., IL. Chopped Hexcel AS4
carbon fibers (CF) with epoxy-based sizing of 3.2 mm length
were obtained from E&L
Enterprises Inc., TN.
The carbon fibers and ABS resin were compounded with a
Brabender Intelli-Torque Plasti-
Corder prep-mixer at 220 °C and 60 rpm rotor speed until the
torque reading became constant.
Mixtures of 10, 20, 30, and 40 wt% CF were prepared. A neat
ABS resin was also run through
the mixer at the same conditions as the control. Approximate
mixing time was 13 min,
including the feeding time. Next, these mixes were extruded as
preforms at 220 °C using a
plunger type batch extrusion unit. For CM preforms, a slit-
shaped die and for FDM printing
preforms (i.e., filament), a cylindrical die of 1.75 mm diameter
were used. During the process,
the barrel temperature ranged between 220 and 235 °C.
FDM dog-bones were prepared by feeding the extruded
filaments into a commercial desktop
FDM unit (Solidoodle 3 from Solidoodle Co., NY) and printing.
ASTM D638 type-V dog-bone
47. dimensions were followed [28]. During printing, nozzle
temperature was maintained at 205 °C,
while printer table temperature was 85 °C. The layer height
was set to 0.2 mm with the
deposition direction being parallel to the loading direction in
the gage section. Although all
samples up to 30 wt% CF were printed successfully, only
several layers of the 40 wt% CF
samples could be printed owing to nozzle clogging. Thus, the
reader should note that the
results for this sample were only included for completeness.
For the preparation of the CM dog-bones, slit-extruded preforms
were cut into shorter pieces
to fit the mold, and they were compression molded at 220 °C
based on ASTM standard D4703
[29] to make rectangular bars. Next, dog-bones (ASTM D638
type-V) were cut from these bars
by use of a Tensilkut template (special template for ASTM
D638 Type V, Sieburg International
Inc., TN), and a router (Tensilkut 10-21, serial No. 100590,
Sieburg International Inc., TN).
2.2. Testing and analysis
The tensile properties of the CM and FDM samples were
determined by testing at least five
dog-bone samples of each composition, performing
displacement-controlled tensile tests in a
servo-hydraulic testing machine at a strain rate of 0.0254 mm/s.
A 12.5 mm gage-length
extensometer was used for strain measurements.
Fibers were extracted from dog-bone samples using acetone. A
48. small portion of each extracted
sample was transferred onto a glass petri dish, and the acetone
was allowed to evaporate.
Images of the extracted fibers were taken at 20x magnification,
and fiber length distributions
from these images were obtained using a code developed in our
laboratories. Mostly, around
1000 fibers were measured in order to obtain reliable fiber
length data.
A piece from a dog-bone representing each composition was cut
and mounted in epoxy. Next,
these samples were polished for imaging clarity. After taking
images of the polished surfaces for
void fraction analysis, the surface was plasma etched to reveal
the fiber orientation for imaging.
Afterwards, a code created by Kunc [30] was used to calculate
fiber orientation. The images
were taken from the regions of the samples that were most
representative of the gauge region
of the dog-bones.
Fracture surfaces of the tested dog-bones were first sputter-
coated with carbon. Next, SEM
micrographs of the fracture surfaces were taken with a Hitachi
S4800 FEG-SEM at an
acceleration voltage of 5 kV and an emission current of 20 µA.
3. Results and Discussions
The purpose of this research was to understand the mechanism
of 3D printing of fiber-
reinforced composites and to see the potential of the process to
manufacture load-bearing
components. Our results showed that composites with highly
dispersed and highly oriented
49. carbon fibers can be printed by FDM process as illustrated in
Fig. 1. Both tensile strength and
modulus increased dramatically reaching a specific strength
(52.9 kN.m/kg ) higher than
Aluminum 6061-0 (45.9 kN.m/kg). Detailed results are given in
the following sections.
Figure 1. Schematic presentation of 3D-printed fiber-reinforced
composite by fused deposition
modeling.
3.1. Effect of process and fiber loading on void formation, fiber
length distribution, and fiber
orientation
Fiber length, fiber orientation, and porosity affect the
mechanical properties of composites. In
this section, the effects of processing method (i.e., FDM vs.
CM) and fiber loading on composite
morphology (i.e., porosity, fiber length, and fiber orientation in
the specimens) were discussed.
3.1.1. Void formation
The CM samples exhibit no visible void content; however, the
FDM samples show significant
pore formation. SEM images of the fracture surfaces and
micrographs of the polished surfaces
of the dog-bone samples are shown in Figs. 2 and 3. To
understand the void formation
mechanism, a closer look at the FDM process is needed. Fig. 2a
50. and b shows the porosity in the
printed neat-ABS sample, which of course has no fiber effect.
The porosity in this sample
consists of relatively large triangular voids that are similarly
oriented. These voids are mainly
the gaps between the beads deposited during printing. Although
the nozzle used to extrude the
molten material is circular, during deposition, the bead is
pressed down to a 0.2 mm thickness
and becomes elliptical. Because the bead is still soft while
being deposited, the bottom part
flattens; however, the top part cools to form round edges before
another bead/layer is
deposited on top of it. For this reason these triangular gaps are
only directed downwards.
S
p
e
ci
fi
c
S
tr
e
n
g
th
Specific Modulus
0
51. Neat-
ABS
30% CF-
ABS
Aluminum
6061-0
Highly-dispersed and
oriented short carbon
fibers
Printed CF-ABS composites
with higher specific strength
than Aluminum
>100µm
<30µm
Figure 2. Fracture surface SEM micrographs of (a) and (b) neat-
ABS fused deposition modeling
(FDM)-printed, (c) 10 wt% carbon fiber-loaded FDM-printed,
and (d) 10 wt% CF-loaded
compression-molded (CM) ABS/CF composites. Protruding
fibers are clear of ABS, indicating
poor fiber–matrix interfacial adhesion. Pore enlargement is
evident around the fibers in the
52. FDM sample, while no significant enlargement is seen in the
CM sample.
These triangular gaps (i.e., inter-bead pores) are actually
channels aligned in the direction of
loading, and they are not expected to significantly affect the
mechanical performance of the
samples. Note that there are no voids in the FDM neat-ABS
sample surface other than these
triangular gaps between the beads as shown in Fig. 2a and b.
However, with the addition of
carbon fibers into the feedstock, internal voids inside the beads
(i.e., inner-bead pores) begin to
(b)
500µm 150µm
(a)
form (Figs. 2c and 3f-h). Because voids inside the beads can
create stress concentration points,
they cause the samples to fail at lower stresses.
Figure 3. Micrographs of polished surfaces of dog-bone slices.
(a) CM neat-ABS, (b) CM10%CF,
(c) CM20%CF, (d) CM30%CF, (e) FDM neat-ABS, (f)
FDM10%CF, (g) FDM20%CF, (h) FDM30%CF.
As shown in Fig. 3e–h, the average size of the triangular
channels between the beads decreases
with the presence of carbon fibers as compared to the FDM
53. neat-ABS sample. This
phenomenon can be attributed to the decrease in die-swell and
the increase in thermal
conductivity with carbon fiber addition. Even 10 wt% carbon
fiber addition significantly
eliminates die-swell, resulting in smaller beads and, therefore,
smaller inter-bead gaps. Also,
higher thermal conductivity helps the already cooled bottom
beads to again soften once in
contact with a hot bead deposited on top of it, leading to the
improved packing and smaller
gaps seen in Fig. 3f–h.
On the other hand, brief image analysis of the polished gauge
section of the fiber-reinforced
FDM-printed dog-bones showed that the void volume fraction
fluctuates between 16% and
27% independent of fiber content. These fluctuations in void
volume can be attributed to the
competing effects of changes in large voids among the beads
and changes in smaller voids
inside the beads (i.e., inter-bead porosity vs. inner-bead
porosity), with increasing fiber content.
As explained earlier, increasing fiber content leads to better
packing of the deposited beads and
thus smaller inter-bead voids, whereas the increased number of
fiber ends [3] is expected to
cause more inner-bead void formation during printing. SEM
micrographs of the fracture
surfaces of the 10 wt% CF-loaded CM and FDM samples (see
Fig. 2c and d) also show pore
enlargement around the fibers in the FDM sample but not in the
CM sample.
54. 3.1.2. Fiber length distribution
The average fiber length decreased with increasing fiber loading
in composites made by both
FDM and CM processes (Fig. 4). Although 3.2 mm long fibers
were used for reinforcement,
during processing (especially, during high-shear mixing)
significant fiber breakage occurred. It
has been reported that during compounding/mixing of fibers
with resin, dramatic fiber
breakage occurs from the interactions between fibers and i)
instrument surfaces, ii) resin, and
iii) other fibers [3]. As the fiber content increases, the
interaction between fibers increases,
leading to more fiber breakage and thus to shorter fibers. The
majority of the fiber breakage
occurs during high-shear mixing. Since the preform extrusion
step is similar for both the FDM
and CM processes, both processes are expected to yield
composites with similar average fiber
lengths (with respect to the initial fiber length of 3.2 mm).
During the CM process, no significant shear is applied to
materials, so no further fiber breakage
is expected. However, in the FDM process, molten material is
pushed through a 0.5 mm nozzle
and pressed down at about a 90° angle, which could cause
further fiber breakage. Therefore,
FDM samples are expected to have a lower average fiber length
at the same fiber loading.
Figure 4. Average fiber length of compression-molded and
FDM-printed samples.
55. 3.1.3. Fiber orientation distribution
The method used by Bay and Tucker [31] was followed to
characterize the samples’ fiber
orientation. Fiber orientation measurements were performed on
2D images of the polished
surface of each sample, and the second-order orientation tensor,
aij, was measured.
Components of second-order orientation tensors for each sample
are given in Table 1.
Components a11, a22, and a33 show orientation in the direction
of x1, x2, and x3, respectively (see
Fig. 5). The results in Table 1 clearly show a characteristic
difference between FDM and CM
samples, but samples prepared by the same method are quite
similar.
Table 1. Components of the second-order orientation tensor of
ABS/CF composites.
Carbon Fiber
(wt %)
a11 a12 a13 a22 a23 a33
Compression-molded samples
10 0.241 −0.023 0.042 0.030 0.084 0.729
20 0.493 −0.059 −0.054 0.023 0.046 0.484
30 0.454 −0.034 0.062 0.023 0.064 0.523
56. 40 0.386 −0.043 −0.049 0.036 0.095 0.578
FDM-printed samples
10 0.055 0.005 0.038 0.030 0.127 0.915
20 0.064 0.004 0.024 0.028 0.121 0.909
30 0.060 −0.002 −0.006 0.039 0.143 0.901
40 0.093 −0.005 −0.018 0.038 0.139 0.869
Figure 5. Sketch of a dog-bone sample showing orientation
directions.
The dominant orientation tensor components for CM samples
are a33 and a11, with the former
being larger. This conveys that fibers are mainly oriented in the
x3-direction (i.e., the load-
bearing direction) and the x1-direction. A closer look at
preform preparation and the CM
method easily explains these results. In this case, preforms are
prepared by extruding the
molten fiber–ABS mixture through a slit-shaped die, during
which fibers are oriented in the
extrusion direction. Next, long pieces cut from this preform at
pre-calculated weight are placed
into the mold and compressed. Because these pieces do not fit
perfectly into the mold, once
molten and pressed, the material flows in x- and z-directions.
In contrast, the dominant component of the orientation tensor
for FDM samples is only a33, and
its nearly 1.0 value indicates that practically all fibers are
57. oriented in the x3-direction. The a23
component being a little over 0.1 shows that fibers are slightly
tilted in the x2-direction,
probably because the depositing nozzle was perpendicular (i.e.,
in the x2-direction) to the
printing direction.
From a mechanical performance standpoint, orientation in the
x3-direction is of most interest
because it is the load-bearing direction and, as explained above,
fiber orientation in the x3-
direction is dramatically higher (approaching maximum) in
printed samples than in compressed
samples. These results emphasize the inherent characteristic of
gaining high orientation by use
of the FDM process. Owing to its nature, the FDM process
produces samples not only with
higher fiber orientation, but also with higher molecular
orientation in thermoplastic compared
with more conventional processes such as CM and injection
molding.
3.2. Tensile properties
Because the samples were exposed to similar thermal cycles in
both processes, among the
parameters that affect the mechanical properties, this study
focused on fiber length
distribution, fiber orientation, and porosity. While an increase
in fiber length and fiber
orientation positively affect the tensile properties, an increase
in void fraction negatively affects
the strength of a composite. Tensile strength and modulus
58. measurements of dog-bone
specimens prepared by both methods are shown in Fig. 6. The
results show that tensile
strength increases with increasing fiber content in both
processes. It was observed that the
neat-ABS samples prepared by the FDM process have higher
tensile strength than the ones
prepared by CM. At least five samples were tested for each
case, and the standard deviation
was insignificant (Fig. 6a), supporting the validity of this
conclusion. The higher strength of the
printed samples despite all the large gaps between the beads
shows that the FDM process
increases the molecular orientation of the polymer chains,
increasing the tensile properties. A
similar conclusion was also reported by Sood et al. [1].
Figure 6. Effect of fiber content and preparation process on (a)
tensile strength and (b)
modulus, of ABS/CF composites.
The standard deviations in tensile strength measurements for the
FDM samples were
significantly lower than those for the CM samples. This result
suggests that the FDM process
not only increases the orientation of the polymer molecules, but
also improves fiber dispersion
and uniformity as the parts are manufactured point by point,
layer by layer. As mentioned
above, the standard deviation for neat polymers, even for the
compression-molded one, is
nearly zero. Thus, the increase in standard deviation with the
59. inclusion of fibers probably arises
from sample-to-sample differences in fiber distribution.
Although for neat-polymer materials the FDM-printed dog-
bones were stronger than the CM
ones, with the addition of fibers into the system, the CM
samples started to perform better.
Since the fiber length distributions of samples prepared by both
processes are similar, to
understand the differences in strength, the competing effects of
fiber orientation and void
fraction must be compared. As shown in the previous results,
fiber orientation is significantly
larger for FDM samples. The increase in tensile strength with
the increase in fiber content
becomes less prominent at higher fiber loadings (Fig. 6a) in
both processes. This can be
attributed to the decrease in average fiber length (Fig. 4) with
increasing fiber content, while
the increase in the number of inner voids (section 3.1.1) can
explain the earlier drop in the
strength increase of FDM samples. Therefore,
modification/optimization of the mixing process
to minimize fiber breakage, and modification of the FDM
process to minimize inner-pore
formation, may lead us to much stronger composite parts. Also,
as shown in SEM micrographs
of fracture surfaces after tensile testing (Fig. 3), the fibers had
pulled out of the matrix, showing
weak fiber–polymer interfacial adhesion, which also negatively
affects composite strength.
Similar to increasing average fiber length, improving interfacial
adhesion can also have a
significant impact on the mechanical performance of FDM-
printed parts. There are many
studies on improvement of interfacial adhesion in composites
60. via modification of the fiber
surface [10,32,33].
Fig. 6b shows the Young’s modulus measurements of all
samples. Unlike tensile strength, the
moduli of FDM and CM samples basically overlap and increase
almost linearly with increasing
fiber content. The modulus value of the CM composite is
increased by nearly an order of
magnitude at 40 wt% fiber loading. However, at this high
loading (40 wt% CF) the FDM sample
was difficult to fabricate owing to repeated nozzle clogging;
these samples could only be
printed to a few layers’ thickness (i.e., much thinner than the
other printed samples, 0.6 mm vs.
3.8 mm). This difference in thickness might have caused the
difference in moduli between the
FDM and CM specimens. Differences in sample thickness affect
edge effects, packing density,
and even instrument sensitivity during measurement.
4. Conclusions
Carbon fiber-containing ABS resin feedstock at different fiber
loadings was prepared, and these
feedstock materials were used to successfully prepare composite
specimens by both the FDM-
printing and compression-molding processes. The results show
that the average fiber length
significantly dropped in both processes, likely due to the high-
shear mixing step during
compounding. While no visible porosity/void was observed in
CM samples, a significant amount
of porosity was observed in FDM-printed samples. With
increasing fiber content, voids inside
the FDM-printed beads increased and voids between the beads
61. decreased. FDM-printed
samples have high fiber orientation in the printing direction,
approaching perfect alignment
with the beads. CM samples also show some orientation in the
tensile loading direction,
probably because of the extrusion process during preform
preparation. Samples prepared by
both FDM and CM methods show significant increases in both
strength and modulus. The
higher results obtained with the CM specimens show the
dominant effect of porosity on tensile
properties over fiber orientation. Furthermore, SEM
micrographs show that fibers had pulled
out of the matrix, indicating weak interfacial adhesion between
the fibers and the matrix.
In summary, this study shows that the FDM process with its
controlled orientation and good
dispersion capabilities, along with the use of carbon fiber-
reinforced feedstock, has great
potential for the manufacturing of load-bearing composite parts.
Minimizing pore formation
during printing and fiber breakage during compounding, as well
as improving interfacial
adhesion between fibers and matrix via surface modification,
appears to be the next steps
necessary for the FDM process to reach full potential.
Acknowledgements
This manuscript has been authored by UT-Battelle, LLC, under
Contract No. DE-AC05-
00OR22725 with the US Department of Energy. The US
62. government retains and the publisher,
by accepting the article for publication, acknowledges that the
US government retains a
nonexclusive, paid-up, irrevocable, worldwide license to
publish or reproduce the published
form of this manuscript, or allow others to do so, for US
government purposes.
This research was sponsored by the Laboratory Directed
Research and Development Program
of Oak Ridge National Laboratory, managed by UT-Battelle,
LLC, for the U.S. Department of
Energy. Thanks go to the Manufacturing Demonstration Facility
at Oak Ridge National
Laboratory for the generous use of their facilities and their
extremely helpful staff. Additionally,
authors would like to thank Mr. John Lindall for his
contribution in printing the FDM test
samples.
5. References
[1] Sood AK, Ohdar RK, Mahapatra SS. Parametric appraisal of
mechanical property of fused
deposition modelling processed parts. Mater Des 2010; 31: 287-
95.
[2] Zhong W, Li F, Zhang Z, Song L, Li Z. Short fiber
reinforced composites for fused
deposition modeling. Mater Sci Eng A 2001; 301: 125-30 .
[3] Fu SY, Lauke B, Mader E, Yue CY, Hu X. Tensile
properties of short-glass-fiber- and short-
carbon-fiber-reinforced polypropylene composites. Composites
Part A 2000; 31: 1117-
25.
63. [4] Gray IV RW, Baird DG, Bohn JH. Thermoplastic composites
reinforced with long fiber
thermotropic liquid crystalline polymers for fused deposition
modeling. Polym Compos
1998; 19(4): 383-94.
[5] Es-Said OS, Foyos J, Noorani R, Mandelson M, Marloth R,
Pregger BA. Effect of layer
orientation on mechanical properties of rapic prototyped
samples. Mater Manuf
Process 2000; 15(1): 107-22.
[6] Shofner ML, Lozano K, Rodriguez-Macias FJ, Barrera EV. J
Appl Polym Sci 2003; 89: 3081-
90.
[7] Nikzad M, Masood SH, Sbarski I. Mater Des 2011; 32:
3448-56.
[8] Karsli NG, Aytac A. Tensile and thermomechanical
properties of short carbon fiber
reinforced polyamide 6 composites. Composites Part B 2013;
61: 270-75.
[9] Botelho EC, Figiel L, Rezende MC, Lauke B. Mehanical
behavior of carbon fiber
reinforced polyamide composites. Compos Sci Technol 2003;
63: 1843-55.
[10] Tezcan J, Ozcan S, Gurung B, Filip P. Measurement and
analytical validation of interfacial
bond strength of PAN-fiber-reinforced carbon matrix
composites. J Mater Sci 2008;
64. 43(5): 1612-18.
[11] Vautard F, Ozcan S, Poland L, Nardin M, Meyer H.
Influence of thermal history on the
mechanical properties of carbon–acrylate composites cured by
electron beam and
thermal processes. Composites Part A 2013; 45: 162-72.
[12] Gordeyev SA, Ferreira JA, Bernardo CA, Ward IM. A
promising conductive material:
highly oriented polypropylene filled with short vapour-grown
carbon fibers. Mater Lett
2001; 51: 32-6.
[13] Kuriger RJ, Khairul MA, Anderson PD, Jacobson RL.
Processing and characterization of
aligned vapor grown carbon fiber reinforced polypropylene.
Composites Part A 2002;
33: 53-62.
[14] Fu Sy, Lauke B. Effect of fiber length and fiber orientation
distributions on the tensile
strength of short-fiber-reinforced polymers. Compos Sci
Technol 1996; 56: 1179-90.
[15] Bijsterbosch H, Gaymans RJ. Polyamide 6-long glass fiber
injection moldings. Polym
Compos 1995; 16: 363–9.
[16] Biolzi L, Castellani L, Pitacco I. On the mechanical
response of short fibre reinforced
polymer composites. J Mater Sci 1994; 29: 2507–12.
[17] Fu SY, Lauke B. Analysis of mechanical properties of ABS
terpolymer reinforced with
short glass fibers and calcite particles. J Mater Sci Technol
65. 1997; 13: 389–96.
[18] Ho KC, Hwang JR, Doong JL. Tensile properties of short
glass fibre reinforced
polycarbonate. Polym Polym Compos 1996; 4: 563–75.
[19] Ramsteiner F, Theysohn R. The influence of fibre diameter
on the tensile behavior of
short-glass-fibre reinforced polymers. Compos Sci Technol
1985; 24: 231–40.
[20] Sato N, Kurauchi T, Sato S, Kamigaito O. Microfailure
behaviour of randomly dispersed
short fibre reinforced thermoplastic composites obtained by
direct SEM observation. J
Mater Sci 1991; 26: 3891–8.
[21] Hine PJ, Davidson N, Duckett RA, Ward IM. Measuring
the fibre orientation and
modelling the elastic properties of injection-molded long-fibre-
reinforced nylon. Comp
Sci Technol 1995; 53: 125-31.
[22] Shiao ML, Nair SV, Garrett PD, Pollard RE. Effect of
glass-fibre reinforcement and
annealing on microstructure and mechanical behavior of nylon
6,6. Part I.
Microstructure and morphology. J Mater Sci 1994; 29: 1973–81.
[23] Shiao ML, Nair SV, Garrett PD, Pollard RE. Effect of
glass-fibre reinforcement and
annealing on microstructure and mechanical behavior of nylon
6,6. Part II. Mechanical
behaviour. J Mater Sci 1994; 29: 1739–52.
66. [24] Li J, Cai CL. The carbon fiber surface treatment and
addition of PA6 on tensile properties
of ABS composites. Curr Appl Phys 2011; 11: 50-4.
[25] Rezaei F, Yunus R, Ibrahim NA. Effect of fiberlength on
thermomechanical properties of
short carbon fiber reinforced polypropylene composites. Mater
Des 2009; 30: 260-3.
[26] Li J. Interfacial studies on the O3 modified carbon fiber-
reinforced polyamide 6
composites. Appl Surf Sci 2008; 255: 2822-4.
[27] Montes-Moran MA, Hattum FWJ, Nunes JP. A study of the
effect of plasma treatment
on the interfacial properties of carbon fiber-thermoplastic
composites. Carbon 2005; 8:
1795-9.
[28] ASTM D638, ASTM Standard test method for tensile
properties of plastics, in D638-03.
2003, ASTM International: West Conshohocken, PA.
[29] ASTM D4703, ASTM Standard practice for compression
molding thermoplastic materials
into test specimens, plaques, or sheets, in D4703 – 10a. 2010,
ASTM International: West
Conshohocken, PA.
[30] We’ll add reference for fiber orientation
[31] Bay RS, Tucker CL. Stereological measurement and error-
estimates for 3-dimensional
fiber orientation. Polym Eng Sci 1992; 32(4): 240-53.
67. [32] Vautard F, Ozcan S, Paulauskas F, Spruiell JE, Meyer H,
Lance MJ. Influence of the carbon
fiber surface microstructure on the surface chemistry generated
by a thermo-chemical
surface treatment. Appl Surf Sci 2012; 261: 473-480.
[33] Vautard F, Grappe H, Ozcan S. Stability of carbon fiber
surface functionality at elevated
temperatures and it influence on interfacial adhesion. Appl Surf
Sci 2013; 268: 61-72.