SlideShare a Scribd company logo
1 of 95
Download to read offline
1
CHAPTER 1
INTRODUCTION
1.1 GENERAL
The applications of recycled aggregate in construction have started since end of
World War II by demolished concretepavement as recycled aggregate in stabilizing
the base course for road construction (Olorusongo F.T. 1999). Theadvantages of using
recycle aggregate concrete in construction industry are of economic values and
environmentalissues.So every year a lot of newer structure is rising with the economic
development of the country. As a result the land for construction is getting smaller
day by day. So undoubtedly the construction companies are heading towards the
coastal areas. But seawater instrusion has a great impact on the durability of concrete.
So it is tried to find out the effect of saline water on the concrete durability related
properties (compressive & tensile strength, change in volume, chloride content,
sulphate content, ph etc.) using various percentage of recycled aggregate for casting
and saline water for curing.
1.2 BACKGROUND
The seas and oceans contain 75% of the total surface of the earth. Nowadays many
concrete structures are needed to construct in the coastal regions such as sea walls,
concrete blocks, ship yard, ports, dry docks as well as residential and commercial
buildings. Meanwhile recycled aggregates of demolished concrete are being wasted
without any use. But it is very much possible to use huge part of demolished concrete
as recycled aggregate in concrete constructions. So the use of recycled aggregate in
2
replacing the normal coarse aggregates in concrete construction has become popular
among researchers. They compare the performance and characteristics of the two
aggregates used. Most researchers found that the performance of recycled aggregate
used in concrete has low workability and compressive strength. The reasons for these
are because of factors like smooth texture and rounder shape of RA, higher percentage
of fine particles and high water absorption (Olorusongo, F.T., 1999). This paper also
intends to contribute to increase the knowledge of concrete durability characteristics
with the use of recycled concrete aggregates in marine environment.
1.3 OBJECTIVES
 To study the behavior of compressive strength as well as tensile strength of
recycled aggregate concrete in marine environment.
 To study the chloride content and PH
in NaCl solution at different
concentration.
 To observe the change in volume with respect to salinity of water of recycled
aggregate concrete in marine environment.
1.4 SCOPE
Bangladesh consists of cities like Chittagong & Cox’s bazar situated just beside The
Bay of Bengal where sea water intrusion is increasing day by day towards the coastal
regions. As a result concrete structures loose its strength and durability in these
regions due to the adverse effect of NaCl.The percentage of NaCl in total salt of water
is 3.02. Our study is to bring the effective use of those recycled aggregate of
demolished concrete to make the construction economic and feasible in marine
3
environment. Thus it can be seen that the scope of this investigation is huge in
lowering the construction cost using waste materials like demolished concrete as
coarse aggregate and checking its feasibility in using concrete construction around
marine environment in seashore and coastal regions. This investigation will be
beneficial for further use of recycled concrete in construction works of sea wall,
dockyard etc. only if it is possible to gain a desired percentage of strength after some
specified curing periods.
4
CHAPTER 2
REVIEW OF LITERATURE
2.1 INTRODUCTION
The applications of recycled aggregate in construction have started since end of
World War II by demolished concrete pavement as recycled aggregate in stabilizing
the base course for road construction. The advantages of using recycle aggregate
concrete in construction industry are of economic values and environmental issues.
Otherwise high rise buildings are constructed in coastal region now a days. But
seawater intrusion in coastal region has a great impact on the strength of concrete. So
by using various percentage of recycled aggregates and saline water for curing it is
tried to find out the effect of saline water on the durability of concrete. This paper also
intends to contribute to increase the knowledge of concrete durability characteristics
with the use of recycled concrete aggregates in marine environment.
2.2 ORDINARY CONCRETE
Concrete is considered as chemically combined mass where the inert materials act as
filter and binding materials acts as binder. So concrete can be defined as an artificial
stone manufacture from a mixture of binding materials and inert materials with water.
It can be expressed as following
Concrete = Binding materials + Inert materials + water
Here most commonly used binding materials are cement and lime. Again the inert
materials used are termed as aggregate.
5
2.3 RECYCLED CONCRETE
Recycled concrete means that concrete in which recycled aggregates are used as
coarse aggregates. These recycled concrete are very much economical but the strength
gained are comparatively low. If a desired and considerable strength achievement is
possible by using of recycled aggregate in recycled concrete, only then recycled
concrete technology will be reasonable and feasible.
2.3.1 SOURCE
Recycled concrete are made with recycled aggregates. The main source of recycled
aggregate are demolished concrete from old concrete structures which are demolished
or broken down due to various purposes. These demolished concrete are then broken
into small chips. Then they are sieved through standard sieves and finally recycled
aggregates are obtained.
2.3.2 TYPES
The types of recycled concrete depend on the percentage of recycled aggregate used
in concrete casting. Various amount of recycled aggregate are used such as 20%
,30%, 40%, 50% etc. Among tiose percentage the optimum percentage is to be found
by using which optimum type of recycled concrete can be produced.
2.4 MARINE ENVIRONMENT
The term marine environment is generally well understood but the complexities
inherent in such environment are not usually clear. Marine environment is not just
over the sea, but it could be deemed to be extending over the coast, and the
neighbourhood of tidal cracks, backwaters and estuaries. Broadly it covers the area
6
where concrete becomes wet with seawater and wherever the wind will carry
saltwater spray, which may be as far 1 km inland. Reinforced concrete structures,
located in such an environment, are always subjected to aggressive loadings both
physical and chemical in nature, over their entire life span. It is therefore, necessary to
understand clearly the characteristics of the seas, the various aggressive agents
causing distress, their nature, intensity of attack, the different detrimental zone etc. in
order to get satisfactory performance of marine structures.
2.4.1 DENSITY OF SEA WATER:
Average density at the surface is 1.025 g/ml. Seawater is denser than both fresh water
and pure water (density 1.0 g/ml @ 4 °C (39 °F)) because the dissolved salts add mass
without contributing significantly to the volume. The freezing point of seawater
decreases as salt concentration increases. At typical salinity it freezes at about −2 °C
(28 °F).[1] The coldest seawater ever recorded (in a liquid state) was in 2010, in a
stream under an Antarctic glacier, and measured −2.6 °C (27.3 °F).[2]
2.4.2 SALINITY OF SEA WATER:
Seawater or salt water is water from a sea or ocean. On average, seawater in the
world's oceans has a salinity of about 3.5% (35 g/L). This means that every kilogram
(roughly one litre by volume) of seawater has approximately 35 grams (1.2 oz) of
dissolved salts (predominantly sodium (Na+) and chloride (Cl−) ions).
7
2.5 FACTORS AFFECTING THE DURABILITY OF CONCRETE
IN MARINE ENVIRONMENT
According to ACI committee 201, durability of Portland cement concrete is defined as
its ability to resist weathering action, chemical attack, and abrasion or any other
process of deterioration when exposed to its environment. Some of these important
factors are given below:
2.5.1 AGGREGATE TYPE
The durability of concrete is influenced to a large extent by the properties and
proportions of its constituent materials. Since the aggregates occupy up to 80% by
volume of concrete, the resistance surface properties of the aggregates are important
parameters affecting durability of concrete. To ensure adequate durability of marine
structure, the aggregate material should be dense, non-shrinking and alkali resistant.
Seawater composition (by mass) (salinity = 3.5)
Element Percent Element Percent
Oxygen 85.84 Sulfur 0.091
Hydrogen 10.82 Calcium 0.04
Chloride 1.94 Potassium 0.04
Sodium 1.08 Bromine 0.0067
Magnesium 0.1292 Carbon 0.0028
8
2.5.2 CEMENT TYPE
The resistance of concrete against the action of various aggressive agencies depends
to a great extent on the type and properties of cement. Ordinary Portland and sulfate
resisting cements are the various types mainly used in marine concrete construction.
Various researchers assessed the performance of these cements individually by either
exposing the mortar and concrete specimens in the seawater or in its constituent salt
solutions, to study their strength and durability characteristics.
2.5.3 CEMENT CONTENT
Apart from other factors, the cement content also has a marked influence on the
durability of reinforced concrete. Several researchers and authorities have been given
recommendations for the minimum cement content of concrete exposed to different
zones of marine environment.
2.5.4 WATER-CEMENT RATIO
The water-cement ratio influences both the strength and durability of concrete.
According to Abram’s law, the strength of concrete at a given age and normal
temperature decreases with increasing water-content ratio assuming full compaction
of concrete. Permeability of concrete to water depends mainly on the w/c ratio, which
determines the size, volume and continuity of the capillary voids. It is clear that even
a small increase of w/c ratio can increase the concrete permeability to a great extent.
9
2.5.5 PERMEABILITY
Permeability is the most important characteristics determining the long-term
durability of reinforced concrete exposed to seawater as it control the diffusion of
aggressive salt-ions into the concrete. ACI 318-83 requires that normal weight
concrete subjected to freezing and thawing in a moist condition should have a
maximum w/c ratio of 0.45 in case of curbs, gutter, guard rail, or their sections and
0.50 for other elements.
2.5.6 AIR ENTRAINMENT
Harden concrete containing entrained air is more uniform, has less absorption and
permeability and much more resistant to the action of freezing and thawing. Normally
about 4-6% of air by volume of concrete is entrained which is dispersed throughout,
the concrete in the form of minute, disconnect bubble. It has been reported that the
amount of entrained air necessary for imparting the highest resistance to frost action
in the seawater is in the range of 10-12% which is more than twice as large as fore
concrete with 3-6% air entrained when exposed to plain water in similar environment.
However, the amount of air entrained (10-12%) reduces the compressive strength of
the concrete to about one-half of the strength without air entrainment.
2.5.7 QUALITY OF MIXING WATER
Sea water has a total salinity of 3.5% of which 78% of the dissolved solid being NaCl
and 15% MgCl2 and MgSO4. According to ACI 318-43, mixing water should be
potable and free from salts. Giving no specific reference to seawater, it specifies that
mortar cubes made with mixing water which are not potable shall have 7 days and 28
10
days strength equal to at least 90% of strength of similar specimens made with potable
water
2.5.8 CARBONATION PROCESS
The hydrated concrete has a tendency of combining with carbon dioxide present in the
atmosphere and forming carbonates, which partly neutralizes the alkaline nature of
concrete. This process is known as carbonation. When carbonation depth exceeds the
depth of cover to the reinforcement, the salt ions find a suitable environment leading
to greater corrosion.
2.5.9 DEPTH OF COVER TO THE REINFORCEMENT
The thickness of the concrete cover to the steel is an important factor regarding rebar
corrosion in an aggressive environment. It affects the time taken for the salts to
penetrate to the steel and the subsequent rate of arrival of oxygen at the steel surface
as in the case of permeability. Lesser the cover, shorter the time required to reach the
embedded steel. Also moisture content is affected by the depth of the cover and
permeability to surrounding salts and gasses.
2.5.10 INFLUENCE OF CRACKS
Reinforced concrete structure, either reinforced develop unavoidable cracks during
their service life. Cracking may stem from various causes; construction cracks as a
result of initial and drying shrinkage, settlement, heats of hydration; load cracking
during normal service as a result of flexure, stress reversal, torsion, shear etc.
11
However, cracks offer a path to the interior of concrete for the deactivating and
corroding agents.
2.5.11 AGE OF IMMERSION
The age at immersion also referred to as period of procuring is the time duration of
concrete commencing immediately after casting up to the formal curing. In a marine
environment, procuring of concrete can be done with either seawater or fresh plain
water. The dissolved salts start reacting with the concrete affecting its rate of gain in
strength when procuring is done with seawater.
2.5.12 DIFFUTION OF SALTS UNDER PRESSURE
The harmful salt ions enter the body of concrete at various depths under hydrostatic
pressure and the embedded steel. The resulting disintegration of concrete which in
turn increases its permeability and provides greater access to the chloride ions for
coming in contact with steel. But due to limited availability of oxygen, the corrosion
process is often ineffective.
2.5.13 WETTING AND DRYING CYCLES
In a marine environment, the structural concrete in the tidal zone undergoes alternate
wetting and drying process due to wave and tidal action.
12
2.5.14 FREEZING AND TWAWING CYCLE
Concrete is greatly affected by freeze-thaw cycles. The change in physical state of
water (liquid-solid) inside the mass of concrete results in an increase of volume by
9%. The volume of change in a cycle fashion (freeze- thaw cycle) causes disruption of
concrete by dilation process..
2.6 CORROSION OF REINFORCED CONCRETE IN MARINE
ENVIRONMENT
The corrosion of steel embedded in concrete is an electrochemical process. The
electrochemical potentials forming the corrosion cells may be generated in two ways:
(a) Composition cells that may be formed when two dissimilar metals are embedded
in concrete such as steel rebar and Al conduit pipes or when significant variation exit
in surface characteristics of the steel.
(b) Concentration cells that may be formed due to difference in concentrations of
dissolved ions in the vicinity of steel such as alkalis, chlorides and oxygen.
As a result of either composition or concentration cell one of the two metals or some
art of the metals become anode and the cathode. The fundamental chemical changes
occurring at the anodic and cathode areas are as follows:
Anode: Fe → 2e-
+ Fe2+
↘
(Metallic iron)
Fe2O (H2O) n (Rust)
Cathode: O2 + H2O + 2e-
→ 2(OH) -
↗
13
(Air)
The transform of metallic iron to rust is accompanied by an increase in volume which
depending on the state of oxidation may be as large as 600 percent of the original
metal consumed. The formation of corrosion products can produce a pressure of 40
N/mm2
which will easily overcome the tensile strength of concrete of about 40N/mm2
.
The result is corrosion cracks, spelling and ultimately structural failure.
Four states of corrosion of steel in concrete have been defined namely:
(a) Passive state
(b) Pitting corrosion
(c) General corrosion
(d) Active low potential corrosion
2.7 CASE HISTORYS OF REINFORCED CONCRETE
DETERIORATION IN MARINE ENVIRONMENT:
From the stand point of some of the earliest published date on deterioration of
reinforced concrete in sea water the following reports cited by Johnson are of
considerable interest:
(i) A report by British Institution of Civil Engineering to the International Navigation
Congress on 30 concrete structures was given in 1920. Six constructed during 1855-
1880 and the remaining 24 during 1880-1912 showed that 17 of the 30 structures were
in a state of deterioration.
14
(ii) A report of reinforced concrete damage from Port of Spain shown that a
breakwater was built with 90 day cured concrete which was fully submerged 12
meters below the low-tide lime. Within five years, the concrete was found in a state of
deterioration.
(iii) In 1922 San Francisco Bay Marine piling committee showed that 457 reinforced
concrete cylinders needed repair from a total of 5198 install during 1909-1918.
2.8 PREVIOUS RESEARCH WORKS IN RELATED SECTORS:
(i) “Influence of Recycled Concrete Aggregates on Concrete Durability‖ in National
Laboratory of Civil Engineering, Portugal, shows that replacement of natural
aggregates up to 50% by recycled aggregates led to concrete strength reduction of 5%
in normal environment.
(ii) ―Shear Strength of Concrete with Recycled Aggregates‖ in School of civil
Engineering, University of a Coruna, Spain, shows that replacing 50% of recycled
aggregates requires a 6.2% increase in the amount of cement in order to maintain a
consistency of the mixes.
(iii) ―Compressive Strength of Concrete with Recycled Aggregates‖ in National
Laboratory of Civil Engineering, Portugal, shows that due to lower densities and
higher water absorption of recycled aggregates led to a reduction of concrete strength.
15
CHAPTER 3
EXPERIMENTAL INVESTIGATIONS
3.1 MATERIALS
Relatively higher strength concrete with a lower permeability is commonly used for
the construction of marine structures. A brief description of the constituent materials
used in the present investigation is given below. The materials used are cement, fine
aggregates, coarse aggregates, water as construction materials and curing tank as
curing equipment. The property test of the construction materials are conducted
properly. Based on specified properties of construction materials ACI mix design has
been done. From ACI mix design required mix proportion has been determined for
desired strength. Then 4‖ cube blocks of required numbers as working plan are casted.
3.1.1 CEMENT
Ordinary Portland cement (OPC) and Pozzolana Portland cement (PPC) both are used
for concrete construction in marine environment. Ordinary Portland cement as per
ASTM type 1 is used in this experimental investigation as it is the most common type
of cement used in Bangladesh. The relevant physical properties for the ordinary
Portland cement has to be determined first. The physical properties of the cement used
in this experiment are mentioned below comparing with the ASTM standard value.
16
Physical Properties of Ordinary Portland cement are given in following table:
Table 3.1: Physical Properties of Ordinary Portland cement
SL No. Characteristics
Valued Obtained
Experimentally
Valued Specified
by ASTM
1 Fineness 94% >90%
2 Normal Consistency 24.5% 22-30%
3 Soundness 6mm <10mm
4
Setting
Time
Initial 145 min >45 min
Final 185 min <375 min
5
Compressive
strength(psi)
3 days 15.2 >12.4
7 days 20.9 >19.3
17
3.1.2 FINE AGGREGATES
Sylhet sand is used as fine aggregate in this experimental investigation. Properties of
fine aggregate are listed below:
Table 3.2: Properties of Fine Aggregate
Sieve No % of Retaining
Cumulative % of
Retain % Finer
# 4 0 0 0
# 8 4.88 4.88 95.12
# 16 17.68 22.56 77.44
# 30 29.04 51.6 48.4
# 50 26.38 77.98 22.02
# 100 18.72 96.7 3.3
Total 253.72
Properties of Fine Aggregate
Fineness modulus 2.54
Specific gravity 2.59
Absorption capacity 1.7
Moisture content 2.65
18
3.1.3 COARSE AGGREGATES
Normal aggregates and recycled aggregates are used as coarse aggregates in this
experimental investigation. Different percentage both of this type are used to make 4
samples of coarse aggregate. These 4 samples are mentioned below:
Sample Normal aggregate Recycled Aggregate
Sample 1 (R20) 80% 20%
Sample 2 (R30) 70% 30%
Sample 3 (R40) 60% 40%
Sample 4 (R50) 50% 50%
Properties of this 4 sample of coarse aggregates are given below:
Table 3.3: Properties of Coarse Aggregate
Sample Property R20 R30 R40 R50
Unit Weight (Kg/m3
) 1515 1505 1494 1487
Bulk specific Gravity(SSD) 2.53 2.53 2.52 2.52
Absorption capacity (%) 1.1 1.4 1.7 2.1
Moisture content (%) 0.3 0.4 0.5 0.6
19
3.1.4 WATER
 Casting water
 Curing water
Casting water: For casting of concrete only fresh plain and potable water is used in
this experiment.
Curing water: For curing of 4‖ cube blocks 4 samples of curing water are used as
mentioned below:
Sample Curing Water Type Weight of NaCl in1 cft
water
Sample 1 (0N) Plain water 0 kg
Sample 2 (1N) 1N Saline Water .709 kg
Sample 3 (3N) 3N Saline Water 2.127 kg
Sample 4 (5N) 5N Saline Water 3.545 kg
20
3.1.5 WATER/CEMENT RATIO
For concrete exposed to sea water environment durability consideration must be
accounted for. And ACI mix design specified for a maximum W/C ratio of 0.45 for
durability consideration. Following 3 W/C ratio have been found for different
requirements and among them the lowest one is to be taken.
Consideration W/C Ratio
According to strength (3000 psi) 0.59
According to seawater exposure 0.50
According to durability 0.45
So, the selected theoretical W/C ratio is 0.45
3.1.6 CONCRETE MIX RATIO
Concrete mix ratio is designed on the basis of ACI mix design where the design
compressive strength of concrete is taken as 3000 psi. This specific strength is taken
in this experimental investigation as this concrete strength is most widely used in our
country. As we used 4 different samples of coarse aggregate, 4 different concrete mix
ratios have been found. These are mentioned in the following table:
21
Table 3.4: Mix Ratio for Different Sample
Sample Normal aggregate Recycled Aggregate Mix Ratio
Sample 1 (R20) 80% 20% 1 : 1.61 : 2.95
Sample 2 (R30) 70% 30% 1 : 1.62 : 2.93
Sample 3 (R40) 60% 40% 1 : 1.62 : 2.92
Sample 4 (R50) 50% 50% 1 : 1.63 : 2.91
3.1.7 CURING TANKS
8 curing tanks are collected on the purpose of curing 4 different samples in 4 different
types of curing water.
3.2 LIST OF TEST:
a. Physical parameter :
 compressive strength
 tensile strength
 percentage of change in volume
b. Chemical analysis :
 determination of chloride content
 determination of PH
22
3.2.1 COMPRESSIVE STRENGTH:
Cement concrete is known to possess substantially high compressive strength. The
tensile strength is usually only about 10-15% of its compressive strength. It was,
therefore considered sufficient test to RC specimen to test the concrete.
3.2.2 DETERMINATION OF CHLORIDE CONTENT :
REAGENT USED:
1. Dilute nitric acid.
2. 0.1N ammonium thiocyanate.
3. 0.1N silver nitrate.
4. Nitrobenzene.
5. Ferric alum.
PROCEDURE:
1. The sample collected after passing through by NO.200sieve.
2. 3 gms. Of powdered sample, weighed to the nearest .1mg. was added to about 70
ml distilled water and the solution was boiled for 5 minutes.
3. After cooling it was filtered and residue was washed several times with hot
distilled water and was made a volume of 150 ml.
4. A 50 ml. of sample solution was pipetted into a 250 ml. conical flask and acidified
with dilute nitric acid.
5. .1N silver nitrate solution was added in excess to it and its volume was recorded.
23
6. 4to 5 ml. of nitrobenzene and 1ml. of ferric alum indicator solution added to it and
shaken vigorously to coagulate the precipitation.
7. Excess silver nitrate was then treated with .1N. ammoniumthiocyanate until a
permanent faint reddish brown color appeared.
Weight of the soluble chloride in sample=(N1V1-N2V2)*35.46*3/1000(gm)
Chloride percent (%)=(N1V1-N2V2)*3.546*3/W
Where,
N1=Normality of silver nitrate solution.
N2=Normality of ammonium thiocyanate.
V1=Volume of silver nitrate solution added.
V2=Volume of ammonium thiocyanate added.
W=Weight of the powdered concrete sample used.
3.3 CASTING OF TEST SPECIMENS
A total of 320 cubes are cast for 4 different samples of coarse aggregates. The casting
was conducted from 28th
February 2012 to 1st
March 2012 in 3 days onwards and in
each day 48 cubes were cast. The 36 cubes of R30, R40 and R50 are cast on 3 following
days and 12 cubes of R0 are cast on each day.
24
3.4 CURING OF TEST SPECIMENS
The 320 cubes are then cured in 8 curing tanks containing 4 different type of curing
water as specified in flow diagram. Each tank contains a total of 40 cubes.
3.5 COMPRESSIVE STRENGTH TEST
Thecompressive strength tests are conducted after specified duration of curing periods
of 28 days, 60 days and 90 days. The calibration equations of the compressive
strength test machine of SM laboratory are given bellow:
Y = 5.883 X – 11.71
Where, X= Reading given by machine
Y= Applied load (KN)
3.6 PRECAUTIONS
Following precautions are maintained carefully during experimental investigations:
 During testing of materials all the properties have been determined with
specified process.
 Before casting all the measuring devices have been checked as per
requirement to maintain desired mix ratios.
 Fine aggregates and coarse aggregates have been mixed in SSD condition to
maintain design mix ratio as per ACI mix design.
25
 Mixing platform was made SSD before putting the materials on it to maintain
W/C ratio.
 Mixing time and speed was maintained properly.
 After attaining suitable consistency the wet concrete mix was poured into
specified cubes which inside area were greased properly.
 The tamping of the concrete mix was done carefully in 2 layer with 25 blows
uniformly each to avoid possible segregation.
26
FIG: 3.3 FLOW DIAGRAM OF INVESTIGATION WORK
Total no of
cubes (320)
Recycled
(320)
Aggregate
types
4 4 4 4
16 1
16
8 8
0
8
30% 40%% of Recycled
Aggregates
Curing
periods
Salinity of
curing water
2
month
3
month1
month
20%
3N 5N
0N
1N
8
50%
1
6
mont
h
1
12
month
27
CASTING OF CONCRETE CUBES
Casting specimens and concrete cubes after casting are shown in following pictures:
Pic 3.1: Mixing of concrete
Pic 3.2: Concrete cubes before placing into curing tanks
28
CHAPTER: FOUR
EXPERIMENTAL RESULT AND GRAPH
29
Table 4. 1: Compressive strength (psi)
Concentration
of curing water
Designation
Compressive strength (psi)
30 Day 60 Day 90 Day 180 Day
Plain water
20R0 3486 3733 3870 3930
30R0 3294 3568 3760 3820
40R0 3184 3348 3541 3712
50R0 2416 2580 2635 3021
1 N
20R1 3239 3678 3760 3840
30R1 3129 3348 3568 3630
40R1 3047 3211 3376 3503
50R1 2306 2388 2498 2775
3 N
20R3 3156 3486 3623 3710
30R3 2937 3047 3348 3435
40R3 2937 3019 3184 3245
50R3 2196 2279 2416 2543
5N
20R5 3047 3294 3458 3530
30R5 2745 2992 3129 3258
40R5 2800 2964 3047 3212
50R5 2114 2224 2333 2411
30
Table 4. 2: Tensile strength (psi)
Concentration
of curing water
Designation
Tensile strength (psi)
30 Day 60 Day 90 Day 180 Day
Plain water
20R0 578 578 660 710
30R0 495 578 578 653
40R0 413 495 578 613
50R0 331 413 495 535
1 N
20R1 495 495 578 673
30R1 413 495 578 592
40R1 413 413 495 556
50R1 413 413 413 446
3 N
20R3 413 495 495 610
30R3 413 495 578 589
40R3 331 413 495 556
50R3 331 249 413 446
5N
20R5 413 413 495 557
30R5 331 495 495 537
40R5 331 331 413 521
50R5 249 331 331 413
31
Table 4. 3: Change in Volume (%)
Concentration
of curing water
Designation
Change in Volume (%)
30 Day 60 Day 90 Day 180 Day
Plain water
20R0 -1.26 -1.16 -1.12 -1.08
30R0 -1.19 -1.09 -1.04 -1
40R0 -1.05 -0.93 -0.87 -0.67
50R0 -0.92 -0.76 -0.67 -0.56
1 N
20R1 -0.67 -0.48 -0.4 -0.29
30R1 -0.58 -0.39 -0.31 -0.2
40R1 -0.47 -0.27 -0.19 -0.11
50R1 -0.36 -0.2 -0.11 -0.04
3 N
20R3 -0.11 0.13 0.29 0.39
30R3 0.01 0.26 0.41 0.52
40R3 0.09 0.34 0.49 0.61
50R3 0.12 0.44 0.56 0.72
5N
20R5 0.18 0.51 0.63 0.78
30R5 0.23 0.58 0.68 0.84
40R5 0.27 0.67 0.75 0.93
50R5 0.33 0.73 0.87 0.98
32
Table 4. 4: Value of PH
Concentration
0f curing
water
Desig-
nation
Value of PH
Curing periods
30 Day 60 Day 90 Day 180 Day
Surface
15
mm
25
mm
Surface
15
mm
25
mm
Surface
15
mm
25 mm Surface
15
mm
25
mm
Plain water
20R0 13.47 13.46 13.48 13.34 13.36 13.43 13.38 13.48 13.5 13.45 13.51 13.53
30R0 13.4 13.39 13.42 13.37 13.41 13.43 13.39 13.42 13.44 13.49 13.5 13.56
40R0 13.4 13.42 13.46 13.41 13.4 13.45 13.39 13.38 13.4 13.51 13.56 13.61
50R0 13.49 13.48 13.5 13.45 13.38 13.47 13.32 13.42 13.44 13.4 13.58 13.63
1 N
20R1 13.3 13.45 13.44 13.34 13.43 13.41 13.3 13.44 13.45 13.52 13.61 13.68
30R1 13.36 13.42 13.44 13.37 13.39 13.45 13.25 13.36 13.38 13.55 13.56 13.61
40R1 13.42 13.41 13.44 13.41 13.43 13.49 13.31 13.45 13.48 13.51 13.52 13.58
50R1 13.44 13.45 13.5 13.42 13.46 13.41 13.35 13.38 13.43 13.6 13.68 13.7
3 N
20R3 13.32 13.35 13.41 13.34 13.21 13.39 13.21 13.3 13.35 13.52 13.58 13.7
30R3 13.39 13.4 13.45 13.38 13.42 13.41 13.21 13.35 13.42 13.53 13.59 13.65
40R3 13.4 13.42 13.45 13.37 13.41 13.46 13.16 13.35 13.36 13.48 13.46 13.65
50R3 13.33 13.42 13.48 13.34 13.49 13.42 13.25 13.36 13.38 13.49 13.56 13.65
5 N
20R5 13.34 13.36 13.43 13.46 13.39 13.41 13.2 13.4 13.41 13.3 13.44 13.48
30R5 13.41 13.45 13.48 13.39 13.46 13.5 13.36 13.5 13.51 13.3 13.48 13.5
40R5 13.3 13.45 13.47 13.46 13.39 13.48 13.3 13.4 13.42 13.32 13.42 13.48
50R5 13.39 13.46 13.48 13.4 13.37 13.4 13.25 13.3 13.4 13.34 13.43 13.5
33
Table 4. 5: Percentage of Chloride content
Concentration
0f curing
water
Desig-
nation
Percentage of Chloride content
Curing periods
30 Day 60 Day 90 Day 180 Day
Surface
15
mm
25
mm
Surface
15
mm
25
mm
Surface
15
mm
25
mm
Surface
15
mm
25 mm
1 N
20R1 0.025 0.023 0.018 0.030 0.028 0.025 0.039 0.035 0.030 0.046 0.043 0.041
30R1 0.028 0.025 0.020 0.032 0.030 0.028 0.035 0.032 0.028 0.039 0.035 0.030
40R1 0.034 0.027 0.025 0.035 0.032 0.030 0.039 0.034 0.030 0.043 0.037 0.035
50R1 0.039 0.034 0.032 0.043 0.041 0.035 0.041 0.039 0.035 0.043 0.039 0.037
3 N
20R3 0.037 0.035 0.034 0.043 0.039 0.037 0.046 0.043 0.037 0.046 0.041 0.032
30R3 0.039 0.037 0.035 0.046 0.043 0.039 0.048 0.046 0.044 0.050 0.046 0.043
40R3 0.043 0.037 0.035 0.046 0.044 0.041 0.050 0.048 0.046 0.053 0.051 0.046
50R3 0.046 0.043 0.037 0.048 0.046 0.043 0.050 0.046 0.044 0.051 0.050 0.046
5 N
20R5 0.050 0.046 0.043 0.053 0.051 0.046 0.057 0.055 0.053 0.060 0.057 0.059
30R5 0.051 0.046 0.043 0.053 0.050 0.043 0.055 0.050 0.046 0.060 0.059 0.053
40R5 0.057 0.050 0.048 0.060 0.059 0.055 0.064 0.060 0.059 0.067 0.064 0.062
50R5 0.060 0.059 0.055 0.062 0.059 0.053 0.067 0.062 0.057 0.073 0.071 0.066
34
Table 4.1.1: Comparison of compressive strength of concrete for different curing period cured
in Normal water
Designation Aggregate Type
Compressive Strength
Curing period (Day)
30 Day 60 Day 90 Day 180 Day
20R0 20% Recycled 3486 3733 3870 3930
30R0 30% Recycled 3294 3568 3760 3820
40R0 40% Recycled 3184 3348 3541 3712
50R0 50% Recycled 2416 2580 2635 3021
Table 4.1.2: Comparison of compressive strength of concrete for different curing period cured
in Saline Water having concentration of 1N.
Designation Aggregate Type
Compressive Strength
Curing period (Day)
30 Day 60 Day 90 Day 180 Day
20R1 20% Recycled 3239 3678 3760 3840
30 R1 30% Recycled 3129 3348 3568 3630
40 R1 40% Recycled 3047 3211 3376 3503
50 R1 50% Recycled 2306 2388 2498 2775
Table 4.1.3: Comparison of compressive strength of concrete for different curing period cured
in Saline Water having concentration of 3N.
Designation Aggregate Type Compressive Strength
Curing period (Day)
30 Day 60 Day 90 Day 180 Day
20R3 20% Recycled 3156 3486 3623 3710
30R3 30% Recycled 2937 3047 3348 3435
40R3 40% Recycled 2937 3019 3184 3245
50 R3 50% Recycled 2196 2279 2416 2543
35
Table 4.1.4: Comparison of compressive strength of concrete for different curing
period cured in Saline Water having concentration of 5N.
Designation Aggregate Type
Compressive Strength
Curing period (Day)
30 Day 60 Day 90 Day 180 Day
20R5 20% Recycled 3047 3294 3458 3530
30 R5 30% Recycled 2745 2992 3129 3258
40 R5 40% Recycled 2800 2964 3047 3212
50 R5 50% Recycled 2114 2224 2333 2411
Table 4.1.5: Comparison of compressive strength of concrete for different
Concentration of Curing Water Cured for 30 Days
Designation Aggregate Type
Compressive Strength
Concentration of Curing Water
0N 1N 3N 5N
20R30 20% Recycled 3486 3239 3156 3047
30 R30 30% Recycled 3294 3129 2937 2745
40 R30 40% Recycled 3184 3047 2937 2800
50 R30 50% Recycled 2416 2306 2196 2114
Table 4.1.6: Comparison of compressive strength of concrete for different
Concentration of Curing Water Cured for 60 Days
Designation Aggregate Type
Compressive Strength
Concentration of Curing Water
0N 1N 3N 5N
20R60 20% Recycled 3733 3678 3486 3294
30 R60 30% Recycled 3568 3348 3047 2992
40 R60 40% Recycled 3348 3211 3019 2964
50 R60 50% Recycled 2580 2388 2279 2224
36
Table 4.1.7: Comparison of compressive strength of concrete for different
Concentration of Curing Water Cured for 90 Days
Designation Aggregate Type
Compressive Strength
Concentration of Curing Water
0N 1N 3N 5N
20R90 20% Recycled 3870 3760 3623 3458
30 R90 30% Recycled 3760 3568 3348 3129
40 R90 40% Recycled 3541 3376 3184 3047
50 R90 50% Recycled 2635 2498 2416 2333
Table 4.1.8: Comparison of compressive strength of concrete for different
Concentration of Curing Water Cured for 180 Days
Designation Aggregate Type
Compressive Strength
Concentration of Curing Water
0N 1N 3N 5N
20R180 20% Recycled 3930 3840 3710 3530
30 R180 30% Recycled 3820 3630 3435 3258
40 R180 40% Recycled 3712 3503 3245 3212
50 R180 50% Recycled 3021 2775 2543 2411
Table 4.1.9: Comparison of compressive strength of concrete for different Types of
Aggregate Cured for 30 Days
Designation
Concentration of
curing water
Compressive Strength
Aggregate Type
20%
Recycled
30%
Recycled
40%
Recycled
50%
Recycled
0N30 0N 3486 3294 3184 2416
1N30 1N 3239 3129 3047 2306
3N30 3N 3156 2937 2937 2196
5N30 5N 3047 2745 2800 2114
37
Table 4.1.10: Comparison of compressive strength of concrete for different Types of
Aggregate Cured for60 Days
Designation
Concentration of
curing water
Compressive Strength
Aggregate Type
20%
Recycled
30%
Recycled
40%
Recycled
50%
Recycled
0N60 0N 3733 3568 3348 2580
1N60 1N 3678 3348 3211 2388
3N60 3N 3486 3047 3019 2279
5N60 5N 3294 2992 2964 2224
Table 4.1.11: Comparison of compressive strength of concrete for different Types of
Aggregate Cured for90 Days
Designation
Concentration of
curing water
Compressive Strength
Aggregate Type
20%
Recycled
30%
Recycled
40%
Recycled
50%
Recycled
0N90 0N 3870 3760 3541 2635
1N90 1N 3760 3568 3376 2498
3N90 3N 3623 3348 3184 2416
5N90 5N 3458 3129 3047 2333
Table 4.1.12: Comparison of compressive strength of concrete for different Types of
Aggregate Cured for180 Days
Designation
Concentration of
curing water
Compressive Strength
Aggregate Type
20%
Recycled
30%
Recycled
40%
Recycled
50%
Recycled
0N180 0N 3930 3820 3712 3021
1N180 1N 3840 3630 3503 2775
3N180 3N 3710 3435 3245 2543
5N180 5N 3530 3258 3212 2411
38
Table 4.2.1: Comparison of Tensile Strength of concrete for different Types of
Aggregate Cured for 30 Days
Designation
Concentration of
curing water
Compressive Strength
Aggregate Type
20%
Recycled
30%
Recycled
40%
Recycled
50%
Recycled
0N30 0N 578 495 413 331
1N30 1N 495 413 413 413
3N30 3N 413 413 331 331
5N30 5N 413 331 331 249
Table 4.2.2: Comparison of Tensile strength of concrete for different Types of
Aggregate Cured for 60 Days
Designation
Concentration of
curing water
Compressive Strength
Aggregate Type
20%
Recycled
30%
Recycled
40%
Recycled
50%
Recycled
0N60 0N 578 578 495 413
1N60 1N 495 495 413 413
3N60 3N 495 495 413 249
5N60 5N 413 495 331 331
Table 4.2.3: Comparison of Tensile strength of concrete for different Types of
Aggregate Cured for 90 Days
Designation
Concentration of
curing water
Compressive Strength
Aggregate Type
20%
Recycled
30%
Recycled
40%
Recycled
50%
Recycled
0N90 0N 660 578 578 495
1N90 1N 578 578 495 413
3N90 3N 495 578 495 413
5N90 5N 495 495 413 331
39
Table 4.2.4: Comparison of Tensile strength of concrete for different Types of
Aggregate Cured for180Days
Designation
Concentration of
curing water
Compressive Strength
Aggregate Type
20%
Recycled
30%
Recycled
40%
Recycled
50%
Recycled
0N180 0N 710 653 613 535
1N180 1N 673 592 556 446
3N180 3N 610 589 556 446
5N180 5N 557 537 521 413
Table 4.2.5: Comparison of Tensile strength of concrete for different Concentration of
Curing Water Cured for 30 Days
Designation Aggregate Type
Compressive Strength
Concentration of Curing Water
0N 1N 3N 5N
20R30 20% Recycled 578 495 413 413
30 R30 30% Recycled 495 413 413 331
40 R30 40% Recycled 413 413 331 331
50 R30 50% Recycled 331 413 331 249
Table 4.2.6: Comparison of Tensile strength of concrete for different Concentration of
Curing Water Cured for 60 Days
Designation Aggregate Type
Compressive Strength
Concentration of Curing Water
0N 1N 3N 5N
20R60 20% Recycled 578 495 495 413
30 R60 30% Recycled 578 495 495 495
40 R60 40% Recycled 495 413 413 331
50 R60 50% Recycled 413 413 249 331
40
Table 4.2.7: Comparison of Tensile strength of concrete for different Concentration of
Curing Water Cured for 90 Days
Designation Aggregate Type
Compressive Strength
Concentration of Curing Water
0N 1N 3N 5N
20R90 20% Recycled 660 578 495 495
30 R90 30% Recycled 578 578 578 495
40 R90 40% Recycled 578 495 495 413
50 R90 50% Recycled 495 413 413 331
Table 4.2.8: Comparison of Tensile strength of concrete for different Concentration
of Curing Water Cured for180 Day
Designation Aggregate Type
Compressive Strength
Concentration of Curing Water
0N 1N 3N 5N
20R180 20% Recycled 710 673 610 557
30 R180 30% Recycled 653 592 589 537
40 R180 40% Recycled 613 556 556 521
50 R180 50% Recycled 535 446 446 413
Table 4.2.9: Comparison of Tensile strength of concrete for different curing period
cured in Normal water
Designation Aggregate Type
Compressive Strength
Curing period (Day)
30 Day 60 Day 90 Day 180 Day
20R0 20% Recycled 578 578 660 710
30R0 30% Recycled 495 578 578 653
40R0 40% Recycled 413 495 578 613
50R0 50% Recycled 331 413 495 535
41
Table 4.2.10: Comparison of Tensile strength of concrete for different curing period
cured in Saline Water having concentration of 1N.
Designation Aggregate Type
Compressive Strength
Curing period (Day)
30 Day 60 Day 90 Day 180 Day
20R1 20% Recycled 413 495 495 610
30 R1 30% Recycled 413 495 578 592
40 R1 40% Recycled 413 413 495 556
50 R1 50% Recycled 413 413 413 446
Table 4.2.11: Comparison of Tensile strength of concrete for different curing period
cured in Saline Water having concentration of 3N.
Designation Aggregate Type
Compressive Strength
Curing period (Day)
30 Day 60 Day 90 Day 180 Day
20R3 20% Recycled 413 495 495 610
30R3 30% Recycled 413 495 578 589
40R3 40% Recycled 331 413 495 556
50 R3 50% Recycled 331 249 413 446
Table 4.2.12: Comparison of Tensile strength of concrete for different curing period
cured in Saline Water having concentration of 5N.
Designation Aggregate Type
Compressive Strength
Curing period (Day)
30 Day 60 Day 90 Day 180 Day
20R5 20% Recycled 413 413 495 557
30 R5 30% Recycled 331 495 495 537
40 R5 40% Recycled 331 331 413 521
50 R5 50% Recycled 249 331 331 413
42
Table 4.3.1: Value of pH in different depth for 20% recycled concrete cured in 30 days
Table 4.3.2: Value of pH in different depth for 30% recycled concrete cured in 30 days.
Table 4.3.3: Value of pH in different depth for 40% recycled concrete cured in 30 days.
Designation
Value of pH
Curing period (30 Days)
Surface 15mm 25mm
40R0 13.4 13.42 13.46
40R1 13.42 13.41 13.44
40R3 13.4 13.42 13.45
40R5 13.3 13.45 13.47
Designation
Value of pH
Curing period (30 Days)
Surface 15mm 25mm
20R0 13.47 13.46 13.48
20R1 13.3 13.45 13.44
20R3 13.32 13.35 13.41
20R5 13.34 13.36 13.43
Designation
Value of pH
Curing period (30 Days)
Surface 15mm 25mm
30R0 13.4 13.39 13.42
30R1 13.36 13.42 13.44
30R3 13.39 13.4 13.45
30R5 13.41 13.45 13.48
Designation
Value of pH
Curing period (30 Days)
Surface 15mm 25mm
20R0 13.47 13.46 13.48
20R1 13.3 13.45 13.44
20R3 13.32 13.35 13.41
20R5 13.34 13.36 13.43
43
Table 4.3.4: Value of pH in different depth for 50% recycled concrete cured in 30 days.
Table 4.3.5: Value of pH in different depth for 20% recycled concrete cured in 60 days.
Designation
Value of pH
Curing period (60 Days)
Surface 15mm 25mm
20R0 13.34 13.36 13.43
20R1 13.34 13.43 13.41
20R3 13.34 13.21 13.39
20R5 13.46 13.39 13.41
Table 4.3.6: Value of pH in different depth for 30% recycled concrete cured in 60 days.
Designation
Value of pH
Curing period (60 Days)
Surface 15mm 25mm
30R0 13.37 13.41 13.43
30R1 13.37 13.39 13.45
30R3 13.38 13.42 13.41
30R5 13.39 13.46 13.5
Designation
Value of pH
Curing period (30 Days)
Surface 15mm 25mm
50R0 13.49 13.48 13.5
50R1 13.44 13.45 13.5
50R3 13.33 13.42 13.48
50R5 13.39 13.46 13.48
44
Table 4.3.7: Value of pH in different depth for 40% recycled concrete cured in 60 days.
Table 4.3.8: Value of pH in different depth for 50% recycled concrete cured in 60 days.
Designation
Value of pH
Curing period (60 Days)
Surface 15mm 25mm
50R0 13.45 13.38 13.47
50R1 13.42 13.46 13.41
50R3 13.34 13.49 13.42
50R5 13.4 13.37 13.4
Table 4.3.9: Value of pH in different depth for 20% recycled concrete cured in 90 days.
Designation
Value of pH
Curing period (90 Days)
Surface 15mm 25mm
20R0 13.38 13.48 13.5
20R1 13.3 13.44 13.45
20R3 13.21 13.3 13.35
20R5 13.2 13.4 13.41
Designation
Value of pH
Curing period (60 Days)
Surface 15mm 25mm
40R0 13.41 13.4 13.45
40R1 13.41 13.43 13.49
40R3 13.37 13.41 13.46
40R5 13.46 13.39 13.48
45
Table 4.3.10: Value of pH in different depth for 30% recycled concrete cured in 90 days.
Table 4.3.11: Value of pH in different depth for 40% recycled concrete cured in 90 days.
Designation
Value of pH
Curing period (90 Days)
Surface 15mm 25mm
40R0 13.39 13.38 13.4
40R1 13.31 13.45 13.48
40R3 13.16 13.35 13.36
40R5 13.3 13.4 13.42
Table 4.3.12: Value of pH in different depth for 50% recycled concrete cured in 90 days.
Designation
Value of pH
Curing period (90 Days)
Surface 15mm 25mm
50R0 13.32 13.42 13.44
50R1 13.35 13.38 13.43
50R3 13.25 13.36 13.38
50R5 13.25 13.3 13.4
Designation
Value of pH
Curing Curing period (90 Days)
Surface 15mm 25mm
30R0 13.39 13.42 13.44
30R1 13.25 13.36 13.38
30R3 13.21 13.35 13.42
30R5 13.36 13.5 13.51
46
Table 4.3.13: Value of pH in different depth for 20% recycled concrete cured in 180 days.
Table 4.3.14: Value of pH in different depth for 30% recycled concrete cured in 180 days.
Designation
Value of pH
Curing period (180 Days)
Surface 15mm 25mm
30R0 13.49 13.5 13.56
30R1 13.55 13.56 13.61
30R3 13.53 13.59 13.65
30R5 13.3 13.48 13.5
Table 4.3.15: Value of pH in different depth for 40% recycled concrete cured in 180 days.
Designation
Value of pH
Curing period (180 Days)
Surface 15mm 25mm
40R0 13.51 13.56 13.61
40R1 13.51 13.52 13.58
40R3 13.48 13.46 13.65
40R5 13.32 13.42 13.48
Designation
Value of pH
Curing Curing period (180 Days)
Surface 15mm 25mm
20R0 13.45 13.51 13.53
20R1 13.52 13.61 13.68
20R3 13.52 13.58 13.7
20R5 13.3 13.44 13.48
47
Table 4.3.16: Value of pH in different depth for 50% recycled concrete cured in 180
days.
Designation
Value of pH
Curing Curing period (180 Days)
Surface 15mm 25mm
50R0 13.4 13.58 13.63
50R1 13.6 13.68 13.7
50R3 13.49 13.56 13.65
50R5 13.34 13.43 13.5
Table 4.3.17: Value of pH in different depth for 20% recycled concrete cured in 0N
Curing period Value of pH
Depth (mm)
Surface 15mm 25mm
30 Days 13.47 13.46 13.48
60 Days 13.34 13.36 13.43
90 Days 13.38 13.48 13.5
180 Days 13.45 13.51 13.53
Table 4.3.18: Value of pH in different depth for 30% recycled concrete cured in 0N
Curing period Value of pH
Depth (mm)
Surface 15mm 25mm
30 Days 13.4 13.39 13.42
60 Days 13.37 13.41 13.43
90 Days 13.39 13.42 13.44
180 Days 13.49 13.5 13.56
48
Table 4.3.19: Value of pH in different depth for 40% recycled concrete cured in 0N
Curing period Value of pH
Depth (mm)
Surface 15mm 25mm
30 Days 13.4 13.42 13.46
60 Days 13.41 13.4 13.45
90 Days 13.39 13.38 13.4
180 Days 13.51 13.56 13.61
Table 4.3.20: Value of pH in different depth for 50% recycled concrete cured in 0N
Curing period Value of pH
Depth (mm)
Surface 15mm 25mm
30 Days 13.49 13.48 13.5
60 Days 13.45 13.38 13.47
90 Days 13.32 13.42 13.44
180 Days 13.4 13.58 13.63
Table 4.3.21: Value of pH in different depth for 20% recycled concrete cured in 1N
Curing period Value of pH
Depth (mm)
Surface 15mm 25mm
30 Days 13.3 13.45 13.44
60 Days 13.34 13.43 13.41
90 Days 13.3 13.44 13.45
180 Days 13.52 13.61 13.68
49
Table 4.3.22: Value of pH in different depth for 30% recycled concrete cured in 1N
Table 4.3.23: Value of pH in different depth for 40% recycled concrete cured in 1N
Curing period Value of pH
Depth (mm)
Surface 15mm 25mm
30 Days 13.42 13.41 13.44
60 Days 13.41 13.43 13.49
90 Days 13.31 13.45 13.48
180 Days 13.51 13.52 13.58
Table 4.3.24: Value of pH in different depth for 50% recycled concrete cured in 1N
Curing period Value of pH
Depth (mm)
Surface 15mm 25mm
30 Days 13.44 13.45 13.5
60 Days 13.42 13.46 13.41
90 Days 13.35 13.38 13.43
180 Days 13.6 13.68 13.7
Curing period Value of pH
Depth (mm)
Surface 15mm 25mm
30 Days 13.36 13.42 13.44
60 Days 13.37 13.39 13.45
90 Days 13.25 13.36 13.38
180 Days 13.55 13.56 13.61
50
Table 4.3.25: Value of pH in different depth for 20% recycled concrete cured in 3N
Curing period Value of pH
Depth (mm)
Surface 15mm 25mm
30 Days 13.32 13.35 13.41
60 Days 13.34 13.21 13.39
90 Days 13.21 13.3 13.35
180 Days 13.52 13.58 13.7
Table 4.3.26: Value of pH in different depth for 30% recycled concrete cured in 3N
Curing period Value of pH
Depth (mm)
Surface 15mm 25mm
30 Days 13.39 13.4 13.45
60 Days 13.38 13.42 13.41
90 Days 13.21 13.35 13.42
180 Days 13.53 13.59 13.65
Table 4.3.27: Value of pH in different depth for 40% recycled concrete cured in 3N
Curing period Value of pH
Depth (mm)
Surface 15mm 25mm
30 Days 13.4 13.42 13.45
60 Days 13.37 13.41 13.46
90 Days 13.16 13.35 13.36
180 Days 13.48 13.46 13.65
51
Table 4.3.28: Value of pH in different depth for 50% recycled concrete cured in 3N
Curing period Value of pH
Depth (mm)
Surface 15mm 25mm
30 Days 13.33 13.42 13.48
60 Days 13.34 13.49 13.42
90 Days 13.25 13.36 13.38
180 Days 13.49 13.56 13.65
Table 4.3.29: Value of pH in different depth for 20% recycled concrete cured in 5N
Curing period Value of pH
Depth (mm)
Surface 15mm 25mm
30 Days 13.34 13.36 13.43
60 Days 13.46 13.39 13.41
90 Days 13.2 13.4 13.41
180 Days 13.3 13.44 13.48
Table 4.3.30: Value of pH in different depth for 30% recycled concrete cured in 5N
Curing period Value of pH
Depth (mm)
Surface 15mm 25mm
30 Days 13.41 13.45 13.48
60 Days 13.39 13.46 13.5
90 Days 13.36 13.5 13.51
180 Days 13.3 13.48 13.5
52
Table 4.3.31: Value of pH in different depth for 40% recycled concrete cured in 5N
Table 4.3.32: Value of pH in different depth for 50% recycled concrete cured in 5N
Curing period Value of pH
Depth (mm)
Surface 15mm 25mm
30 Days 13.3 13.45 13.47
60 Days 13.46 13.39 13.48
90 Days 13.3 13.4 13.42
180 Days 13.32 13.42 13.48
Curing period Value of pH
Depth (mm)
Surface 15mm 25mm
30 Days 13.39 13.46 13.48
60 Days 13.4 13.37 13.4
90 Days 13.25 13.3 13.4
180 Days 13.34 13.43 13.5
53
Table 4.4.1: Percentage of chloride content in different depth for 20% recycled
concrete cured in 30 days
Table 4.4.2: Percentage of chloride content in different depth for 30% recycled
concrete cured in 30 days
Table 4.4.3: Percentage of chloride content in different depth for 40% recycled
concrete cured in 30 days.
Designation Chloride content (%)
Curing period (30 Days)
Surface 15mm 25mm
20R1 0.025 0.023 0.018
20R3 0.037 0.035 0.034
20R5 0.050 0.046 0.043
Designation Chloride content (%)
Curing period (30 Days)
Surface 15mm 25mm
30R1 0.028 0.025 0.020
30R3 0.039 0.037 0.035
30R5 0.051 0.046 0.043
Designation Chloride content (%)
Curing period (30 Days)
Surface 15mm 25mm
40R1 0.034 0.027 0.025
40R3 0.043 0.037 0.035
40R5 0.057 0.050 0.048
54
Table 4.4.4: Percentage of chloride content in different depth for 50% recycled
concrete cured in 30 days.
Table 4.4.5: Percentage of chloride content in different depth for 20% recycled
concrete cured in 60 days.
Table 4.4.6: Percentage of chloride content in different depth for 30% recycled
concrete cured in 60 days.
Designation Chloride content (%)
Curing period (30 Days)
Surface 15mm 25mm
50R1 0.039 0.034 0.032
50R3 0.046 0.043 0.037
50R5 0.060 0.059 0.055
Designation Chloride content (%)
Curing period (60 Days)
Surface 15mm 25mm
20R1 0.030 0.028 0.025
20R3 0.043 0.039 0.037
20R5 0.053 0.051 0.046
Designation Chloride content (%)
Curing period (60 Days)
Surface 15mm 25mm
30R1 0.032 0.030 0.028
30R3 0.046 0.043 0.039
30R5 0.053 0.050 0.043
55
Table 4.4.7: Percentage of chloride content in different depth for 40% recycled
concrete cured in 60 days.
Table 4.4.8: Percentage of chloride content in different depth for 50% recycled
concrete cured in 60 days.
Table 4.4.9: Percentage of chloride content in different depth for 20% recycled
concrete cured in 90 days.
Designation Chloride content (%)
Curing period (60 Days)
Surface 15mm 25mm
40R1 0.035 0.032 0.030
40R3 0.046 0.044 0.041
40R5 0.060 0.059 0.055
Designation Chloride content (%)
Curing period (60 Days)
Surface 15mm 25mm
50R1 0.043 0.041 0.035
50R3 0.048 0.046 0.043
50R5 0.062 0.059 0.053
Designation Chloride content (%)
Curing period (90 Days)
Surface 15mm 25mm
20R1 0.039 0.035 0.030
20R3 0.046 0.043 0.037
20R5 0.057 0.055 0.053
56
Table 4.4.10: Percentage of chloride content in different depth for 30% recycled
concrete cured in 90 days.
Table 4.4.11: Percentage of chloride content in different depth for 40% recycled
concrete cured in 90 days.
Table 4.4.12: Percentage of chloride content in different depth for 50% recycled
concrete cured in 90 days.
Designation Chloride content (%)
Curing period (90 Days)
Surface 15mm 25mm
30R1 0.035 0.032 0.028
30R3 0.048 0.046 0.044
30R5 0.055 0.050 0.046
Designation Chloride content (%)
Curing period (90 Days)
Surface 15mm 25mm
40R1 0.039 0.034 0.030
40R3 0.050 0.048 0.046
40R5 0.064 0.060 0.059
Designation Chloride content (%)
Curing period (90 Days)
Surface 15mm 25mm
50R1 0.041 0.039 0.035
50R3 0.050 0.046 0.044
50R5 0.067 0.062 0.057
57
Table 4.4.13: Percentage of chloride content in different depth for 20% recycled
concrete cured in 180 days.
Table 4.4.14: Percentage of chloride content in different depth for 30% recycled
concrete cured in 180 days.
Table 4.4.15: Percentage of chloride content in different depth for 40% recycled
concrete cured in 180 days.
Designation Chloride content (%)
Curing period (180 Days)
Surface 15mm 25mm
20R1 0.046 0.043 0.041
20R3 0.046 0.041 0.032
20R5 0.060 0.057 0.059
Designation Chloride content (%)
Curing period (180 Days)
Surface 15mm 25mm
30R1 0.039 0.035 0.030
30R3 0.050 0.046 0.043
30R5 0.060 0.059 0.053
Designation Chloride content (%)
Curing period (180 Days)
Surface 15mm 25mm
40R1 0.043 0.037 0.035
40R3 0.053 0.051 0.046
40R5 0.067 0.064 0.062
58
Table 4.4.16: Percentage of chloride content in different depth for 50% recycled
concrete cured in 180 days.
Designation Chloride content (%)
Curing period (180 Days)
Surface 15mm 25mm
50R1 0.043 0.039 0.037
50R3 0.051 0.050 0.046
50R5 0.073 0.071 0.066
59
Fig 4.1.1: Compressive Strength Vs. Curing Period for Concrete cured in Normal
Water
Fig 4.1.2: Compressive Strength Vs. Curing Period for Concrete cured in Saline
Water having concentration of 1N.
0
500
1000
1500
2000
2500
3000
3500
4000
4500
0 30 60 90 120 150 180
Compressivestrength(psi)
Curing period (Days)
COMPRESSIVE STRENGTH Vs. CURING PERIODS
20R0
30R0
40R0
50R0
0
500
1000
1500
2000
2500
3000
3500
4000
4500
0 30 60 90 120 150 180
Compressivestrength(psi)
Curing period (Days)
20R1
30R1
40R1
50R1
60
Fig 4.1.3: Compressive Strength Vs. Curing Period for Concrete cured in Saline
Water having concentration of 3N.
Fig 4.1.4: Compressive Strength Vs. Curing Period for Concrete cured in Saline
Water having concentration of 5N.
0
500
1000
1500
2000
2500
3000
3500
4000
0 30 60 90 120 150 180
Compressivestrength(psi)
Curing period (Days)
20R3
30R3
40R3
50R3
0
500
1000
1500
2000
2500
3000
3500
4000
0 30 60 90 120 150 180
Compressivestrength(psi)
Curing period (Days)
20R5
30R5
40R5
50R5
61
Fig 4.1.5: Compressive Strength Vs. Concentration of Curing Water for Concrete
Cured for 30 Days
Fig 4.1.6: Compressive Strength Vs. Concentration of Curing Water for Concrete
Cured for 60 Days
0
500
1000
1500
2000
2500
3000
3500
4000
Compressivestrength(psi)
0N 1N 3N 5N
Concentration of curing water (N)
20R30
30R30
40R30
50R30
0
500
1000
1500
2000
2500
3000
3500
4000
Compressivestrength(psi)
0N 1N 3N 5N
Concentration of curing water (N)
20R60
30R60
40R60
50R60
62
Fig 4.1.7: Compressive Strength Vs. Concentration of Curing Water for Concrete
Cured for 90 Days
Fig 4.1.8: Compressive Strength Vs. Concentration of Curing Water for Concrete
Cured for 180 Days
0
500
1000
1500
2000
2500
3000
3500
4000
4500
Compressivestrength(psi)
0N 1N 3N 5N
Concentration of curing water (N)
20R90
30R90
40R90
50R90
0
500
1000
1500
2000
2500
3000
3500
4000
4500
Compressivestrength(psi)
0N 1N 3N 5N
Concentration of curing water (N)
20R180
30R180
40R180
50R180
63
Fig 4.1.9: Compressive Strength Vs. Types of Aggregate used in Concrete Cured for
30 Days
Fig 4.1.10: Compressive Strength Vs. Types of Aggregate used in Concrete Cured for
60 Days
0
500
1000
1500
2000
2500
3000
3500
4000
Compressivestrength(psi)
20R 30R 40R 50R
Type of aggregate
0N30
1N30
3N30
5N30
0
500
1000
1500
2000
2500
3000
3500
4000
Compressivestrength(psi)
20R 30R 40R 50R
Type of aggregate
0N60
1N60
3N60
5N60
64
Fig 4.1.11: Compressive Strength Vs. Types of Aggregate used in Concrete Cured for
90 Days
Fig 4.1.12: Compressive Strength Vs. Types of Aggregate used in Concrete Cured for
180 Days
0
500
1000
1500
2000
2500
3000
3500
4000
4500
Compressivestrength(psi)
20R 30R 40R 50R
Type of aggregate
0N90
1N90
3N90
5N90
0
500
1000
1500
2000
2500
3000
3500
4000
4500
Compressivestrength(psi)
20R 30R 40R 50R
Type of aggregate
…
0N180
1N180
3N180
5N180
65
Fig 4.2.1: Tensile Strength Vs. Types of Aggregate used in Concrete Cured for 30
Days
Fig 4.2.2 : Tensile Strength Vs. Types of Aggregate used in Concrete Cured for 60
Days
0
100
200
300
400
500
600
700
Tensilestrength(psi)
20R 30R 40R 50R
Type of aggregate
0N30
1N30
3N30
5N30
0
100
200
300
400
500
600
700
Tensilestrength(psi)
20R 30R 40R 50R
Type of aggregate
0N60
1N6O
3N60
5N60
66
Fig 4.2.3: Tensile Strength Vs. Types of Aggregate used in Concrete Cured for 90
Days
0
100
200
300
400
500
600
700
Tensilestrength(psi)
20R 30R 40R 50R
Type of aggregate
0N90
1N90
3N90
5N90
0
100
200
300
400
500
600
700
800
Tensilestrength(psi)
20R 30R 40R 50R
Type of aggregate
0N180
1N180
3N180
5N180
67
Fig 4.2.4: Tensile Strength Vs. Types of Aggregate used in Concrete Cured for 180
Day
Fig 4.2.5: Tensile Strength Vs. Concentration of Curing Water for Concrete Cured
for 30 Days
Fig 4.2.6: Tensile Strength Vs. Concentration of Curing Water for Concrete Cured
for 60 Days
0
100
200
300
400
500
600
700
0 1 2 3 4 5 6
Tensilestrength(psi)
Concentration of curing water (N)
20R30
30R30
40R30
50R30
0
100
200
300
400
500
600
700
0 1 2 3 4 5 6
Tensilestrength(psi)
Concentration of curing water (N)
20R60
30R60
40R60
50R60
68
Fig 4.2.7: Tensile Strength Vs. Concentration of Curing Water for Concrete Cured
for 90 Days
0
100
200
300
400
500
600
700
0 1 2 3 4 5 6
Tensilestrength(psi)
Concentration of curing water (N)
20R90
30R90
40R90
50R90
0
100
200
300
400
500
600
700
800
0 1 2 3 4 5 6
Tensilestrength(psi)
Concentration of curing water (N)
20R120
30R120
40R120
50R120
69
Fig 4.2.8: Tensile Strength Vs. Concentration of Curing Water for Concrete Cured
for 180 Days
Fig 4.2.9: Tensile Strength Vs. Curing Period for Concrete cured in Normal Water
0
100
200
300
400
500
600
700
800
0 30 60 90 120 150 180 210
Tensilestrength(psi)
Curing period (Days)
20R0
30R0
40R0
50R0
0
100
200
300
400
500
600
700
800
0 30 60 90 120 150 180 210
Tensilestrength(psi)
Curing period (Days)
20R1
30R1
40R1
50R1
70
Fig 4.2.10 :Tensile Strength Vs. Curing Period for Concrete cured in Saline Water
having concentration of 1N.
Fig 4.2.11: Tensile Strength Vs. Curing Period for Concrete cured in Saline Water
having concentration of 3N.
0
100
200
300
400
500
600
700
0 30 60 90 120 150 180 210
Tensilestrength(psi)
Curing period (Days)
20R3
30R3
40R3
50R3
0
100
200
300
400
500
600
0 30 60 90 120 150 180 210
Tensilestrength(psi)
Curing period (Days)
20R5
30R5
40R5
50R5
71
Fig 4.2.12: Tensile Strength Vs. Curing Period for Concrete cured in Saline Water
having concentration of 5N
Fig 4.3.1: Percentage in change in volume vs. Curing periods having concentration
3N
0
0.2
0.4
0.6
0.8
1
1.2
0 30 60 90 120 150 180
Changeinvolume(%)
Curing periods (day)
20R3
30R3
40R3
50R3
72
Fig 4.3.2: Percentage in change in volume vs. Curing periods having concentration
5N
Fig 4.4.1: Variation of pH with Depth (20% Recycled)
0
0.2
0.4
0.6
0.8
1
1.2
0 30 60 90 120 150 180
Changeinvolume(%)
Curing periods (day)
20R5
30R5
40R5
50R5
13
13.15
13.3
13.45
0 15 25
pH
Depth (mm)
PH Vs. DEPTH (30 DAYS)
20R0
20R1
20R3
20R5
73
Fig 4.4.2: Variation of pH with Depth (30% Recycled)
Fig 4.4.3: Variation of pH with Depth (40% Recycled
Fig 4.4.4: Variation of pH with Depth (50% Recycled)
13.3
13.35
13.4
13.45
0 15 25
pH
Depth (mm)
PH Vs. DEPTH (30 DAYS)
30R0
30R1
30R3
30R5
13.2
13.3
13.4
13.5
0 15 25
pH
Depth (mm)
PH Vs. DEPTH (30 DAYS)
40R0
40R1
40R3
40R5
13.2
13.3
13.4
13.5
13.6
0 15 25
pH
Depth (mm)
PH Vs. DEPTH (30 DAYS)
50R0
50R1
50R3
50R5
74
Fig 4.4.5: Variation of pH with Depth (20% Recycled)
Fig 4.4.6: Variation of pH with Depth (30% Recycled)
Fig 4.4.7: Variation of pH with Depth (40% Recycled)
13
13.1
13.2
13.3
13.4
13.5
0 15 25
pH
Depth (mm)
PH Vs. DEPTH (60 DAYS)
20R0
20R1
20R3
20R5
13.3
13.35
13.4
13.45
13.5
13.55
0 15 25
pH
Depth (mm)
PH Vs. DEPTH (60 DAYS)
30R0
30R1
30R3
30R5
13.3
13.35
13.4
13.45
13.5
0 15 25
pH
Depth (mm)
PH Vs. DEPTH (60 DAYS)
40R0
40R1
40R3
40R5
75
Fig 4.4.8: Variation of pH with Depth (50% Recycled)
Fig 4.4.9: Variation of pH with Depth (20% Recycled)
Fig 4.4.10: Variation of pH with Depth (30% Recycled)
13.2
13.3
13.4
13.5
13.6
0 15 25
pH
Depth (mm)
PH Vs. DEPTH (60 DAYS)
50R0
50R1
50R3
50R5
13
13.15
13.3
13.45
13.6
0 15 25
pH
Depth (mm)
PH Vs. DEPTH (90 DAYS)
20R0
20R1
20R3
20R5
13
13.15
13.3
13.45
13.6
0 15 25
pH
Depth (mm)
PH Vs. DEPTH (90 DAYS)
30R0
30R1
30R3
30R5
76
Fig 4.4.11: Variation of pH with Depth (40% Recycled)
Fig 4.4.12: Variation of pH with Depth (50% Recycled)
Fig 4.4.13: Variation of pH with Depth (20% Recycled)
13
13.15
13.3
13.45
13.6
0 15 25
pH
Depth (mm)
PH Vs. DEPTH (90 DAYS)
40R0
40R1
40R3
40R5
13.1
13.2
13.3
13.4
13.5
0 15 25
pH
Depth (mm)
PH Vs. DEPTH (90 DAYS)
50R0
50R1
50R3
50R5
13.1
13.3
13.5
13.7
0 15 25
pH
Depth (mm)
PH Vs. DEPTH (180 DAYS)
2OR0
20R1
20R3
20R5
77
Fig 4.4.14: Variation of pH with Depth (30% Recycled)
Fig 4.4.15: Variation of pH with Depth (40% Recycled)
Fig 4.4.16: Variation of pH with Depth (50% Recycled)
13.1
13.25
13.4
13.55
13.7
0 15 25
pH
Depth (mm)
PH Vs. DEPTH (180 DAYS)
30R0
30R1
30R3
30R5
13.1
13.25
13.4
13.55
13.7
0 15 25
pH
Depth (mm)
PH Vs. DEPTH (180 DAYS)
40R0
40R1
40R3
40R5
13.1
13.3
13.5
13.7
0 15 25
pH
Depth (mm)
PH Vs. DEPTH (180 DAYS)
50R0
50R1
50R3
50R5
78
Fig 4.4.17: Variation of pH with Depth (0N)
Fig 4.4.18: Variation of pH with Depth (0N)
13.2
13.3
13.4
13.5
0 15 25
pH
Depth (mm)
PH Vs. DEPTH (20R0)
30 Day
60 Day
90 Day
180Day
13.25
13.35
13.45
13.55
0 15 25
pH
Depth (mm)
PH Vs. DEPTH (30R0)
30 Day
60 Day
90 Day
180Day
13.2
13.3
13.4
13.5
13.6
13.7
0 15 25
pH
Depth (mm)
PH Vs. DEPTH (40R0)
30 Day
60 Day
90 Day
180Day
79
Fig 4.4.19: Variation of pH with Depth (0N)
Fig 4.4.20: Variation of pH with Depth (0N)
Fig 4.4.21: Variation of pH with Depth (1N)
13.1
13.25
13.4
13.55
13.7
0 15 25
pH
Depth (mm)
PH Vs. DEPTH (50R0)
30 Day
60 Day
90 Day
180Day
13.1
13.25
13.4
13.55
13.7
0 15 25
pH
Depth (mm)
PH Vs. DEPTH (20R1)
30 Day
60 Day
90 Day
180Day
13
13.15
13.3
13.45
13.6
0 15 25
pH
Depth (mm)
PH Vs. DEPTH (30R1)
30 Day
60 Day
90 Day
180Day
80
Fig 4.4.22: Variation of pH with Depth (1N)
Fig 4.4.23: Variation of pH with Depth (1N)
Fig 4.4.24: Variation of pH with Depth (1N)
13.1
13.25
13.4
13.55
13.7
0 15 25
pH
Depth (mm)
PH Vs. DEPTH (40R1)
30 Day
60 Day
90 Day
180Day
13.1
13.3
13.5
13.7
0 15 25
pH
Depth (mm)
PH Vs. DEPTH (50R1)
30 Day
60 Day
90 Day
180Day
12.8
13
13.2
13.4
13.6
13.8
0 15 25
pH
Depth (mm)
PH Vs. DEPTH (20R3)
30 Day
60 Day
90 Day
180Day
81
Fig 4.4.25: Variation of pH with Depth (3N)
Fig 4.4.26: Variation of pH with Depth (3N)
Fig 4.4.27: Variation of pH with Depth (3N)
12.9
13.1
13.3
13.5
13.7
0 15 25
pH
Depth (mm)
PH Vs. DEPTH (30R3)
30 Day
60 Day
90 Day
180Day
12.8
13
13.2
13.4
13.6
13.8
0 15 25
pH
Depth (mm)
PH Vs. DEPTH (40R3)
30 Day
60 Day
90 Day
180Day
13
13.15
13.3
13.45
13.6
13.75
0 15 25
pH
Depth (mm)
PH Vs. DEPTH (50R3)
30 Day
60 Day
90 Day
180Day
82
Fig 4.4.28: Variation of pH with Depth (3N)
Fig 4.4.29: Variation of pH with Depth (5N)
Fig 4.4.30: Variation of pH with Depth (5N)
13
13.15
13.3
13.45
13.6
0 15 25
pH
Depth (mm)
PH Vs. DEPTH (20R5)
30 Day
60 Day
90 Day
180Day
13.1
13.2
13.3
13.4
13.5
13.6
0 15 25
pH
Depth (mm)
PH Vs. DEPTH (30R5)
30 Day
60 Day
90 Day
180Day
13.2
13.3
13.4
13.5
0 15 25
pH
Depth (mm)
PH Vs. DEPTH (40R5)
30 Day
60 Day
90 Day
180Day
83
Fig 4.4.31: Variation of pH with Depth (5N)
Fig 4.4.32: Variation of pH with Depth (5N)
Fig 4.5.1: Variation of percentage of chloride content with Depth (20% Recycled)
13.1
13.25
13.4
13.55
0 15 25
pH
Depth (mm)
PH Vs. DEPTH (50R5)
30 Day
60 Day
90 Day
180Day
0.000
0.020
0.040
0.060
0.080
0.100
0.120
0 15 25
Chloride(%)
Depth (mm)
PERCENTAGE OF CHLORIDE CONTENT Vs.DEPTH
(30 DAYS)
20R5
20R3
20R1
84
Fig 4.5.2: Variation of percentage of chloride content with Depth (50% Recycled)
Fig 4.5.3: Variation of percentage of chloride content with Depth (40% Recycled
Fig 4.5.4: Variation of percentage of chloride content with Depth (30% Recycled)
0.000
0.050
0.100
0.150
0.200
0 15 25
Chloride(%)
Depth (mm)
PERCENTAGE OF CHLORIDE CONTENT Vs.DEPTH
(30 DAYS)
50R5
50R3
50R1
0.000
0.020
0.040
0.060
0.080
0.100
0.120
0.140
0 15 25
Chloride(%)
Depth (mm)
PERCENTAGE OF CHLORIDE CONTENT Vs.DEPTH
(30 DAYS)
40R5
40R3
40R1
0.000
0.020
0.040
0.060
0.080
0.100
0.120
0.140
0 15 25
Chloride(%)
Depth (mm)
PERCENTAGE OF CHLORIDE CONTENT Vs.DEPTH
(30 DAYS)
30R5
30R3
30R1
85
Fig 4.5.5: Variation of percentage of chloride content with Depth (20% Recycled)
Fig 4.5.6: Variation of percentage of chloride content with Depth (30% Recycled)
Fig 4.5.7: Variation of percentage of chloride content with Depth (40% Recycled)
0.000
0.020
0.040
0.060
0.080
0.100
0.120
0.140
0 15 25
Chloride(%)
Depth (mm)
PERCENTAGE OF CHLORIDE CONTENT Vs.DEPTH
(60 DAYS)
20R5
20R3
20R1
0.000
0.020
0.040
0.060
0.080
0.100
0.120
0.140
0 15 25
Chloride(%)
Depth (mm)
PERCENTAGE OF CHLORIDE CONTENT Vs.DEPTH
(60 DAYS)
30R5
30R3
30R1
0.000
0.020
0.040
0.060
0.080
0.100
0.120
0.140
0.160
0 15 25
Chloride(%)
Depth (mm)
PERCENTAGE OF CHLORIDE CONTENT Vs.DEPTH
(60 DAYS)
40R5
40R3
40R1
86
Fig 4.5.8: Variation of percentage of chloride content with Depth (50% Recycled)
Fig 4.5.9: Variation of percentage of chloride content with Depth (20% Recycled)
Fig 4.5.10: Variation of percentage of chloride content with Depth (30% Recycled)
0.000
0.050
0.100
0.150
0.200
0 15 25
Chloride(%)
Depth (mm)
PERCENTAGE OF CHLORIDE CONTENT Vs.DEPTH
(60 DAYS)
50R5
50R3
50R1
0.000
0.050
0.100
0.150
0 15 25
Chloride(%)
Depth (mm)
PERCENTAGE OF CHLORIDE CONTENT Vs.DEPTH
(90 DAYS)
20R5
20R3
20R1
0.000
0.020
0.040
0.060
0.080
0.100
0.120
0.140
0.160
0 15 25
Chloride(%)
Depth (mm)
PERCENTAGE OF CHLORIDE CONTENT Vs.DEPTH
(90 DAYS)
30R5
30R3
30R1
87
Fig 4.5.11: Variation of percentage of chloride content with Depth (40% Recycled)
Fig 4.5.12: Variation of percentage of chloride content with Depth (50% Recycled)
Fig 4.5.13: Variation of percentage of chloride content with Depth (20% Recycled)
0.000
0.050
0.100
0.150
0.200
0 15 25
Chloride(%)
Depth (mm)
PERCENTAGE OF CHLORIDE CONTENT Vs.DEPTH
(90 DAYS)
40R5
40R3
40R1
0.000
0.050
0.100
0.150
0.200
0 15 25
Chloride(%)
Depth (mm)
PERCENTAGE OF CHLORIDE CONTENT Vs.DEPTH
(90 DAYS)
50R5
50R3
50R1
0.000
0.050
0.100
0.150
0.200
0 15 25
Chloride(%)
Depth (mm)
PERCENTAGE OF CHLORIDE CONTENT Vs.DEPTH
(180 DAYS)
20R5
20R3
20R1
88
Fig 4.5.14: Variation of percentage of chloride content with Depth (30% Recycled)
Fig 4.5.15: Variation of percentage of chloride content with Depth (40% Recycled)
Fig 4.5.16: Variation of percentage of chloride content with Depth (50% Recycled)
0.000
0.050
0.100
0.150
0.200
0 15 25
Chloride(%)
Depth (mm)
PERCENTAGE OF CHLORIDE CONTENT Vs.DEPTH
(180 DAYS)
30R5
30R3
30R1
0.000
0.050
0.100
0.150
0.200
0 15 25
Chloride(%)
Depth (mm)
PERCENTAGE OF CHLORIDE CONTENT Vs.DEPTH
(180 DAYS)
40R5
40R3
40R1
0.000
0.050
0.100
0.150
0.200
0 15 25
Chloride(%)
Depth (mm)
PERCENTAGE OF CHLORIDE CONTENT Vs.DEPTH
(180 DAYS)
50R5
50R3
50R1
89
90
CHAPTER 5
CONCLUSION AND RECOMMENDATION
5.1 GENAREL
One of the most important factors for gaining desired strength of concrete is curing
water .Generally the curing water should be potable and vital to gain required
strength. From this point of view it is clear that plain and salinity free water is most
beneficial in gaining strength. But at the same time huge amount of demolished
concrete are wasted nowadays .If this demolished concrete are used as recycled
aggregate in recycled concrete and those recycled concrete are exposed around marine
environment then the behavior pattern of strength under such condition will help in
investigate that whether recycled aggregate using in marine structures are feasible or
not.
The experimental investigation shows that strength of recycled of concrete reduced
tremendously when cured and exposed in high saline water. But the strength of
recycled concrete with optimum of recycled aggregate cured in low saline water or
plain water gives a rational and considerable strength which may be a little beneficial
in construction of marine structures.
91
5.2 CONCLUSION AND DISCUSSION
 20% replacement of recycled aggregate leads to a better performance in plain
water and the worst case is 50% replacement of recycled aggregate having
salinity of curing water 5N
 With the increase of percentage of recycled aggregate the durability related
properties show lower performance.
 The deterioration of RAC increases with time having higher concentration of
sea water.
 The change in volume of RAC shows higher percentage of change in volume
(0.93) at 50% replacement of RA having curing period 180 days.
 pH value increase proportionally with depth and decreases with salinity of
water. Maximum pH is observed as 13.7 at 25mm depth cured in 1N saline
water.
 As the depth increases percentage of chloride content decreases. Maximum
percentage of chloride content is observed 0.073 at surface for 180 days curing
period of 50% replacement of RA and Minimum percentage of chloride
content reported as 0.018 at 25mm depth cured in 1N.
92
5.3 RECOMMENDATION
After completing the investigation work here are some of the recommendation for
using recycled concrete in marine construction and for further research on this sector.
 Curing with sea water must be avoided as much as possible for both ordinary
and recycled concrete.
 Desired strength gaining by recycled concrete in marine structure is only
possible when optimum percentage of recycled aggregates (which has lesser
decrement in relative percentage of strength gained within allowable limits
vary from 5-10% with curing periods) will be used and when it will be cured
in plain water somehow.
 More variety of the percentage of recycled aggregates such as 25%,35%,45%
may be used for further extensive investigation on the behavior of durability of
recycled concrete.
 The concept of pre curing in plain water before exposed to saline water can be
introduced and further investigation with various pre curing periods can be
carried on to determine the improvement of the compressive strength of
recycled concrete.
 The research can be carried out for longer curing periods to know about the
deterioration of concrete in marine environment.
 More various concentration of sea water may be used to find more definite
conclusion about the investigation.
93
 Different types of strength gaining reagent and admixtures can be used to
increase the strength of recycled concrete in marine environment. But at first
the behavior pattern of compressive strength must be investigated after adding
those admixtures.
94
REFERENCES
 Aziz, M.A, Engineering materials,1st
edition,revised,August
1995,Dhaka,Bangladesh.
 G. Arlindo, E. Ana, & V. Manuel., Influence of recycled aggregate concrete on
concrete durability, November 2004, National Laboratory of Civil Engineering,
Portugal.
 Islam et al., An experimental study on the behavior of reinforced concrete in
marine environment ,Undergraduate Thesis, September 2003, Department of
Civil Engineering, Chittagong University of Engineering and Technology,
Chittagong, Bangladesh.
 Nevile, A.M .,Properties of concrete, 3rd
edition,1981,U.K.
 SOMERVILLE, G., —Whole life design for durability and sustainability.
Where are we going, and how do we get there?", Concrete Durability and
Repair Technology, Proceedings of International Congress —Creating with
Concrete", Ed. R.K. Dhir and M.J. McCarty, Dundee, September 1999.
 Shetty, M.S., Concrete technology, 2nd
edition,1986,India.
 Topcu, I. B. (1997). "Physical and Mechanical Properties of Concretes
Produced With Waste Concrete". Cement and Concrete Research, vol 27, pp
1817-1823.
95
APPENDICES
PREPARATION OF NaCl SOLUTION:
1N =2.5 kg. NaCl in 100 kg of water (Equivalent weight of NaCl is 58.5.)
=2.5 kg. NaCl in 100×2.202 lb. of water
=2.5 kg. NaCl in 100×2.202÷62.45 ft3
of water
=2.5 kg. NaCl in 3.526 ft3
of water
=0.709 kg. NaCl in 1 ft3
of water
So, 1N saline water =0.709 kg. NaCl in 1 ft3
of water
3N saline water =2.127 kg. NaCl in 1 ft3
of water
5N saline water =3.545 kg. NaCl in 1 ft3
of water

More Related Content

What's hot

Pervious concrete
Pervious concretePervious concrete
Pervious concreteLatha Reddy
 
Polymer concrete and it's types
Polymer concrete and it's typesPolymer concrete and it's types
Polymer concrete and it's typesMONISHA K Y
 
Coconut shell as coarse aggregate in the concrete
Coconut shell as coarse aggregate in the concreteCoconut shell as coarse aggregate in the concrete
Coconut shell as coarse aggregate in the concreteAglaia Connect
 
Utilization Plastic (Pet) Bottle As A Bricks in Building Construction
Utilization Plastic (Pet) Bottle As A  Bricks in Building Construction Utilization Plastic (Pet) Bottle As A  Bricks in Building Construction
Utilization Plastic (Pet) Bottle As A Bricks in Building Construction Mangal Maurya
 
PPT ON Glass powder and GGBS Mix concrete
PPT ON Glass powder and GGBS Mix concretePPT ON Glass powder and GGBS Mix concrete
PPT ON Glass powder and GGBS Mix concreteamity university
 
Industrial report for civil engg. training
Industrial report for civil engg. trainingIndustrial report for civil engg. training
Industrial report for civil engg. trainingRam1239
 
Concrete- Classification,Properties and Testing
Concrete- Classification,Properties and TestingConcrete- Classification,Properties and Testing
Concrete- Classification,Properties and TestingRishabh Lala
 
Concepts of Shotcrete Technology
Concepts of Shotcrete TechnologyConcepts of Shotcrete Technology
Concepts of Shotcrete TechnologyNADEEM AKHTAR
 
summer Internship report L&T_ Bihar museum_Patna
summer Internship report L&T_ Bihar museum_Patnasummer Internship report L&T_ Bihar museum_Patna
summer Internship report L&T_ Bihar museum_Patnakishore1192
 
PERVIOUS CONCRETE by DEEPAK TIWARI
PERVIOUS CONCRETE by DEEPAK TIWARI PERVIOUS CONCRETE by DEEPAK TIWARI
PERVIOUS CONCRETE by DEEPAK TIWARI Deepak_Tiwari19
 
Plastic roads
Plastic roadsPlastic roads
Plastic roadsSVIST
 
over view of coconut shell as coarse aggreagate
over view of coconut shell as coarse aggreagateover view of coconut shell as coarse aggreagate
over view of coconut shell as coarse aggreagateMUKUNDA BUSI
 
hybrid fiber blended concrete.pptx
hybrid fiber blended concrete.pptxhybrid fiber blended concrete.pptx
hybrid fiber blended concrete.pptxKusalKumar
 
Epoxy Injection & vacuum concrete (RR&S)
Epoxy Injection & vacuum concrete (RR&S)Epoxy Injection & vacuum concrete (RR&S)
Epoxy Injection & vacuum concrete (RR&S)RAMPRASAD KUMAWAT
 
STUDY ON STRENGTH PROPERTIES OF COCONUT SHELL CONCRETE
STUDY ON STRENGTH PROPERTIES OF COCONUT SHELL CONCRETESTUDY ON STRENGTH PROPERTIES OF COCONUT SHELL CONCRETE
STUDY ON STRENGTH PROPERTIES OF COCONUT SHELL CONCRETEIAEME Publication
 

What's hot (20)

Pervious concrete
Pervious concretePervious concrete
Pervious concrete
 
Polymer concrete and it's types
Polymer concrete and it's typesPolymer concrete and it's types
Polymer concrete and it's types
 
Bagasse ash ppt
Bagasse ash pptBagasse ash ppt
Bagasse ash ppt
 
Coconut shell as coarse aggregate in the concrete
Coconut shell as coarse aggregate in the concreteCoconut shell as coarse aggregate in the concrete
Coconut shell as coarse aggregate in the concrete
 
Utilization Plastic (Pet) Bottle As A Bricks in Building Construction
Utilization Plastic (Pet) Bottle As A  Bricks in Building Construction Utilization Plastic (Pet) Bottle As A  Bricks in Building Construction
Utilization Plastic (Pet) Bottle As A Bricks in Building Construction
 
PPT ON Glass powder and GGBS Mix concrete
PPT ON Glass powder and GGBS Mix concretePPT ON Glass powder and GGBS Mix concrete
PPT ON Glass powder and GGBS Mix concrete
 
Industrial report for civil engg. training
Industrial report for civil engg. trainingIndustrial report for civil engg. training
Industrial report for civil engg. training
 
Concrete- Classification,Properties and Testing
Concrete- Classification,Properties and TestingConcrete- Classification,Properties and Testing
Concrete- Classification,Properties and Testing
 
Concepts of Shotcrete Technology
Concepts of Shotcrete TechnologyConcepts of Shotcrete Technology
Concepts of Shotcrete Technology
 
Pervious concrete
Pervious concretePervious concrete
Pervious concrete
 
summer Internship report L&T_ Bihar museum_Patna
summer Internship report L&T_ Bihar museum_Patnasummer Internship report L&T_ Bihar museum_Patna
summer Internship report L&T_ Bihar museum_Patna
 
PERVIOUS CONCRETE by DEEPAK TIWARI
PERVIOUS CONCRETE by DEEPAK TIWARI PERVIOUS CONCRETE by DEEPAK TIWARI
PERVIOUS CONCRETE by DEEPAK TIWARI
 
Plastic roads
Plastic roadsPlastic roads
Plastic roads
 
over view of coconut shell as coarse aggreagate
over view of coconut shell as coarse aggreagateover view of coconut shell as coarse aggreagate
over view of coconut shell as coarse aggreagate
 
High Performance Concrete
High Performance ConcreteHigh Performance Concrete
High Performance Concrete
 
Rubber concrete
Rubber concreteRubber concrete
Rubber concrete
 
hybrid fiber blended concrete.pptx
hybrid fiber blended concrete.pptxhybrid fiber blended concrete.pptx
hybrid fiber blended concrete.pptx
 
Mhv final project report
Mhv final project reportMhv final project report
Mhv final project report
 
Epoxy Injection & vacuum concrete (RR&S)
Epoxy Injection & vacuum concrete (RR&S)Epoxy Injection & vacuum concrete (RR&S)
Epoxy Injection & vacuum concrete (RR&S)
 
STUDY ON STRENGTH PROPERTIES OF COCONUT SHELL CONCRETE
STUDY ON STRENGTH PROPERTIES OF COCONUT SHELL CONCRETESTUDY ON STRENGTH PROPERTIES OF COCONUT SHELL CONCRETE
STUDY ON STRENGTH PROPERTIES OF COCONUT SHELL CONCRETE
 

Similar to Effects on Durability of recycle aggregate concrete in Marine Environment

EFFECT OF DEAD SEA WATER ON DURABILITY, STRENGTH, FLEXURE AND BOND ON HARDENE...
EFFECT OF DEAD SEA WATER ON DURABILITY, STRENGTH, FLEXURE AND BOND ON HARDENE...EFFECT OF DEAD SEA WATER ON DURABILITY, STRENGTH, FLEXURE AND BOND ON HARDENE...
EFFECT OF DEAD SEA WATER ON DURABILITY, STRENGTH, FLEXURE AND BOND ON HARDENE...IAEME Publication
 
IRJET- Variation of Hydraulic Conductivity of Montmorillonite Rich Clay upon ...
IRJET- Variation of Hydraulic Conductivity of Montmorillonite Rich Clay upon ...IRJET- Variation of Hydraulic Conductivity of Montmorillonite Rich Clay upon ...
IRJET- Variation of Hydraulic Conductivity of Montmorillonite Rich Clay upon ...IRJET Journal
 
IRJET- Effect of Sea Water and Strength of Concrete
IRJET-  	  Effect of Sea Water and Strength of ConcreteIRJET-  	  Effect of Sea Water and Strength of Concrete
IRJET- Effect of Sea Water and Strength of ConcreteIRJET Journal
 
IRJET - A Review on Feasibility of Geopolymer Sea Sand Concrete in Interlocki...
IRJET - A Review on Feasibility of Geopolymer Sea Sand Concrete in Interlocki...IRJET - A Review on Feasibility of Geopolymer Sea Sand Concrete in Interlocki...
IRJET - A Review on Feasibility of Geopolymer Sea Sand Concrete in Interlocki...IRJET Journal
 
IRJET - Effect of Tap Water and Sea Water on Fly Ash Mixed Swelling Soil-...
IRJET -  	  Effect of Tap Water and Sea Water on Fly Ash Mixed Swelling Soil-...IRJET -  	  Effect of Tap Water and Sea Water on Fly Ash Mixed Swelling Soil-...
IRJET - Effect of Tap Water and Sea Water on Fly Ash Mixed Swelling Soil-...IRJET Journal
 
Effect of silica fume on the strength of cement mortar
Effect of silica fume on the strength of cement mortarEffect of silica fume on the strength of cement mortar
Effect of silica fume on the strength of cement mortareSAT Journals
 
IRJET - Water Absorption Capacity of Concrete Cubes with Sorptivity Coefficient
IRJET - Water Absorption Capacity of Concrete Cubes with Sorptivity CoefficientIRJET - Water Absorption Capacity of Concrete Cubes with Sorptivity Coefficient
IRJET - Water Absorption Capacity of Concrete Cubes with Sorptivity CoefficientIRJET Journal
 
Mechanical Properties of Concrete with Marine Sand as Partial Replacement of ...
Mechanical Properties of Concrete with Marine Sand as Partial Replacement of ...Mechanical Properties of Concrete with Marine Sand as Partial Replacement of ...
Mechanical Properties of Concrete with Marine Sand as Partial Replacement of ...IJERA Editor
 
Fly ash concrecte
Fly ash concrecte Fly ash concrecte
Fly ash concrecte AbdullaSk
 
IRJET- Microstructure Study and Plasticity Characteristics of Clay
IRJET- Microstructure Study and Plasticity Characteristics of ClayIRJET- Microstructure Study and Plasticity Characteristics of Clay
IRJET- Microstructure Study and Plasticity Characteristics of ClayIRJET Journal
 
Experimental Study on Strength of Concrete using Crushed Pebbles by Replaceme...
Experimental Study on Strength of Concrete using Crushed Pebbles by Replaceme...Experimental Study on Strength of Concrete using Crushed Pebbles by Replaceme...
Experimental Study on Strength of Concrete using Crushed Pebbles by Replaceme...IRJET Journal
 
IRJET- Effect of Salt Water on Compressive Strength, Flexural Strength and Du...
IRJET- Effect of Salt Water on Compressive Strength, Flexural Strength and Du...IRJET- Effect of Salt Water on Compressive Strength, Flexural Strength and Du...
IRJET- Effect of Salt Water on Compressive Strength, Flexural Strength and Du...IRJET Journal
 
Effects of Silica Fume and Fly Ash as Partial Replacement of Cement on Water ...
Effects of Silica Fume and Fly Ash as Partial Replacement of Cement on Water ...Effects of Silica Fume and Fly Ash as Partial Replacement of Cement on Water ...
Effects of Silica Fume and Fly Ash as Partial Replacement of Cement on Water ...idescitation
 

Similar to Effects on Durability of recycle aggregate concrete in Marine Environment (20)

E0372023031
E0372023031E0372023031
E0372023031
 
EFFECT OF DEAD SEA WATER ON DURABILITY, STRENGTH, FLEXURE AND BOND ON HARDENE...
EFFECT OF DEAD SEA WATER ON DURABILITY, STRENGTH, FLEXURE AND BOND ON HARDENE...EFFECT OF DEAD SEA WATER ON DURABILITY, STRENGTH, FLEXURE AND BOND ON HARDENE...
EFFECT OF DEAD SEA WATER ON DURABILITY, STRENGTH, FLEXURE AND BOND ON HARDENE...
 
IRJET- Variation of Hydraulic Conductivity of Montmorillonite Rich Clay upon ...
IRJET- Variation of Hydraulic Conductivity of Montmorillonite Rich Clay upon ...IRJET- Variation of Hydraulic Conductivity of Montmorillonite Rich Clay upon ...
IRJET- Variation of Hydraulic Conductivity of Montmorillonite Rich Clay upon ...
 
Strength and durability assessment of concrete substructure in organic and hy...
Strength and durability assessment of concrete substructure in organic and hy...Strength and durability assessment of concrete substructure in organic and hy...
Strength and durability assessment of concrete substructure in organic and hy...
 
IRJET- Effect of Sea Water and Strength of Concrete
IRJET-  	  Effect of Sea Water and Strength of ConcreteIRJET-  	  Effect of Sea Water and Strength of Concrete
IRJET- Effect of Sea Water and Strength of Concrete
 
IRJET - A Review on Feasibility of Geopolymer Sea Sand Concrete in Interlocki...
IRJET - A Review on Feasibility of Geopolymer Sea Sand Concrete in Interlocki...IRJET - A Review on Feasibility of Geopolymer Sea Sand Concrete in Interlocki...
IRJET - A Review on Feasibility of Geopolymer Sea Sand Concrete in Interlocki...
 
Ijciet 10 02_047
Ijciet 10 02_047Ijciet 10 02_047
Ijciet 10 02_047
 
Av34285289
Av34285289Av34285289
Av34285289
 
IRJET - Effect of Tap Water and Sea Water on Fly Ash Mixed Swelling Soil-...
IRJET -  	  Effect of Tap Water and Sea Water on Fly Ash Mixed Swelling Soil-...IRJET -  	  Effect of Tap Water and Sea Water on Fly Ash Mixed Swelling Soil-...
IRJET - Effect of Tap Water and Sea Water on Fly Ash Mixed Swelling Soil-...
 
Effect of silica fume on the strength of cement mortar
Effect of silica fume on the strength of cement mortarEffect of silica fume on the strength of cement mortar
Effect of silica fume on the strength of cement mortar
 
IRJET - Water Absorption Capacity of Concrete Cubes with Sorptivity Coefficient
IRJET - Water Absorption Capacity of Concrete Cubes with Sorptivity CoefficientIRJET - Water Absorption Capacity of Concrete Cubes with Sorptivity Coefficient
IRJET - Water Absorption Capacity of Concrete Cubes with Sorptivity Coefficient
 
Mechanical Properties of Concrete with Marine Sand as Partial Replacement of ...
Mechanical Properties of Concrete with Marine Sand as Partial Replacement of ...Mechanical Properties of Concrete with Marine Sand as Partial Replacement of ...
Mechanical Properties of Concrete with Marine Sand as Partial Replacement of ...
 
Mechanical Properties of Concrete with Marine Sand as Partial Replacement of ...
Mechanical Properties of Concrete with Marine Sand as Partial Replacement of ...Mechanical Properties of Concrete with Marine Sand as Partial Replacement of ...
Mechanical Properties of Concrete with Marine Sand as Partial Replacement of ...
 
Fly ash concrecte
Fly ash concrecte Fly ash concrecte
Fly ash concrecte
 
J012446569
J012446569J012446569
J012446569
 
IRJET- Microstructure Study and Plasticity Characteristics of Clay
IRJET- Microstructure Study and Plasticity Characteristics of ClayIRJET- Microstructure Study and Plasticity Characteristics of Clay
IRJET- Microstructure Study and Plasticity Characteristics of Clay
 
Dh35601604
Dh35601604Dh35601604
Dh35601604
 
Experimental Study on Strength of Concrete using Crushed Pebbles by Replaceme...
Experimental Study on Strength of Concrete using Crushed Pebbles by Replaceme...Experimental Study on Strength of Concrete using Crushed Pebbles by Replaceme...
Experimental Study on Strength of Concrete using Crushed Pebbles by Replaceme...
 
IRJET- Effect of Salt Water on Compressive Strength, Flexural Strength and Du...
IRJET- Effect of Salt Water on Compressive Strength, Flexural Strength and Du...IRJET- Effect of Salt Water on Compressive Strength, Flexural Strength and Du...
IRJET- Effect of Salt Water on Compressive Strength, Flexural Strength and Du...
 
Effects of Silica Fume and Fly Ash as Partial Replacement of Cement on Water ...
Effects of Silica Fume and Fly Ash as Partial Replacement of Cement on Water ...Effects of Silica Fume and Fly Ash as Partial Replacement of Cement on Water ...
Effects of Silica Fume and Fly Ash as Partial Replacement of Cement on Water ...
 

Recently uploaded

CCS355 Neural Networks & Deep Learning Unit 1 PDF notes with Question bank .pdf
CCS355 Neural Networks & Deep Learning Unit 1 PDF notes with Question bank .pdfCCS355 Neural Networks & Deep Learning Unit 1 PDF notes with Question bank .pdf
CCS355 Neural Networks & Deep Learning Unit 1 PDF notes with Question bank .pdfAsst.prof M.Gokilavani
 
Architect Hassan Khalil Portfolio for 2024
Architect Hassan Khalil Portfolio for 2024Architect Hassan Khalil Portfolio for 2024
Architect Hassan Khalil Portfolio for 2024hassan khalil
 
Concrete Mix Design - IS 10262-2019 - .pptx
Concrete Mix Design - IS 10262-2019 - .pptxConcrete Mix Design - IS 10262-2019 - .pptx
Concrete Mix Design - IS 10262-2019 - .pptxKartikeyaDwivedi3
 
Call Girls Delhi {Jodhpur} 9711199012 high profile service
Call Girls Delhi {Jodhpur} 9711199012 high profile serviceCall Girls Delhi {Jodhpur} 9711199012 high profile service
Call Girls Delhi {Jodhpur} 9711199012 high profile servicerehmti665
 
DATA ANALYTICS PPT definition usage example
DATA ANALYTICS PPT definition usage exampleDATA ANALYTICS PPT definition usage example
DATA ANALYTICS PPT definition usage examplePragyanshuParadkar1
 
Arduino_CSE ece ppt for working and principal of arduino.ppt
Arduino_CSE ece ppt for working and principal of arduino.pptArduino_CSE ece ppt for working and principal of arduino.ppt
Arduino_CSE ece ppt for working and principal of arduino.pptSAURABHKUMAR892774
 
HARMONY IN THE NATURE AND EXISTENCE - Unit-IV
HARMONY IN THE NATURE AND EXISTENCE - Unit-IVHARMONY IN THE NATURE AND EXISTENCE - Unit-IV
HARMONY IN THE NATURE AND EXISTENCE - Unit-IVRajaP95
 
CCS355 Neural Network & Deep Learning Unit II Notes with Question bank .pdf
CCS355 Neural Network & Deep Learning Unit II Notes with Question bank .pdfCCS355 Neural Network & Deep Learning Unit II Notes with Question bank .pdf
CCS355 Neural Network & Deep Learning Unit II Notes with Question bank .pdfAsst.prof M.Gokilavani
 
Work Experience-Dalton Park.pptxfvvvvvvv
Work Experience-Dalton Park.pptxfvvvvvvvWork Experience-Dalton Park.pptxfvvvvvvv
Work Experience-Dalton Park.pptxfvvvvvvvLewisJB
 
Past, Present and Future of Generative AI
Past, Present and Future of Generative AIPast, Present and Future of Generative AI
Past, Present and Future of Generative AIabhishek36461
 
INFLUENCE OF NANOSILICA ON THE PROPERTIES OF CONCRETE
INFLUENCE OF NANOSILICA ON THE PROPERTIES OF CONCRETEINFLUENCE OF NANOSILICA ON THE PROPERTIES OF CONCRETE
INFLUENCE OF NANOSILICA ON THE PROPERTIES OF CONCRETEroselinkalist12
 
Artificial-Intelligence-in-Electronics (K).pptx
Artificial-Intelligence-in-Electronics (K).pptxArtificial-Intelligence-in-Electronics (K).pptx
Artificial-Intelligence-in-Electronics (K).pptxbritheesh05
 
Call Girls Narol 7397865700 Independent Call Girls
Call Girls Narol 7397865700 Independent Call GirlsCall Girls Narol 7397865700 Independent Call Girls
Call Girls Narol 7397865700 Independent Call Girlsssuser7cb4ff
 
Introduction-To-Agricultural-Surveillance-Rover.pptx
Introduction-To-Agricultural-Surveillance-Rover.pptxIntroduction-To-Agricultural-Surveillance-Rover.pptx
Introduction-To-Agricultural-Surveillance-Rover.pptxk795866
 
Biology for Computer Engineers Course Handout.pptx
Biology for Computer Engineers Course Handout.pptxBiology for Computer Engineers Course Handout.pptx
Biology for Computer Engineers Course Handout.pptxDeepakSakkari2
 
IVE Industry Focused Event - Defence Sector 2024
IVE Industry Focused Event - Defence Sector 2024IVE Industry Focused Event - Defence Sector 2024
IVE Industry Focused Event - Defence Sector 2024Mark Billinghurst
 
Gurgaon ✡️9711147426✨Call In girls Gurgaon Sector 51 escort service
Gurgaon ✡️9711147426✨Call In girls Gurgaon Sector 51 escort serviceGurgaon ✡️9711147426✨Call In girls Gurgaon Sector 51 escort service
Gurgaon ✡️9711147426✨Call In girls Gurgaon Sector 51 escort servicejennyeacort
 
VICTOR MAESTRE RAMIREZ - Planetary Defender on NASA's Double Asteroid Redirec...
VICTOR MAESTRE RAMIREZ - Planetary Defender on NASA's Double Asteroid Redirec...VICTOR MAESTRE RAMIREZ - Planetary Defender on NASA's Double Asteroid Redirec...
VICTOR MAESTRE RAMIREZ - Planetary Defender on NASA's Double Asteroid Redirec...VICTOR MAESTRE RAMIREZ
 
Introduction to Machine Learning Unit-3 for II MECH
Introduction to Machine Learning Unit-3 for II MECHIntroduction to Machine Learning Unit-3 for II MECH
Introduction to Machine Learning Unit-3 for II MECHC Sai Kiran
 

Recently uploaded (20)

CCS355 Neural Networks & Deep Learning Unit 1 PDF notes with Question bank .pdf
CCS355 Neural Networks & Deep Learning Unit 1 PDF notes with Question bank .pdfCCS355 Neural Networks & Deep Learning Unit 1 PDF notes with Question bank .pdf
CCS355 Neural Networks & Deep Learning Unit 1 PDF notes with Question bank .pdf
 
Architect Hassan Khalil Portfolio for 2024
Architect Hassan Khalil Portfolio for 2024Architect Hassan Khalil Portfolio for 2024
Architect Hassan Khalil Portfolio for 2024
 
Concrete Mix Design - IS 10262-2019 - .pptx
Concrete Mix Design - IS 10262-2019 - .pptxConcrete Mix Design - IS 10262-2019 - .pptx
Concrete Mix Design - IS 10262-2019 - .pptx
 
Call Girls Delhi {Jodhpur} 9711199012 high profile service
Call Girls Delhi {Jodhpur} 9711199012 high profile serviceCall Girls Delhi {Jodhpur} 9711199012 high profile service
Call Girls Delhi {Jodhpur} 9711199012 high profile service
 
DATA ANALYTICS PPT definition usage example
DATA ANALYTICS PPT definition usage exampleDATA ANALYTICS PPT definition usage example
DATA ANALYTICS PPT definition usage example
 
Arduino_CSE ece ppt for working and principal of arduino.ppt
Arduino_CSE ece ppt for working and principal of arduino.pptArduino_CSE ece ppt for working and principal of arduino.ppt
Arduino_CSE ece ppt for working and principal of arduino.ppt
 
HARMONY IN THE NATURE AND EXISTENCE - Unit-IV
HARMONY IN THE NATURE AND EXISTENCE - Unit-IVHARMONY IN THE NATURE AND EXISTENCE - Unit-IV
HARMONY IN THE NATURE AND EXISTENCE - Unit-IV
 
CCS355 Neural Network & Deep Learning Unit II Notes with Question bank .pdf
CCS355 Neural Network & Deep Learning Unit II Notes with Question bank .pdfCCS355 Neural Network & Deep Learning Unit II Notes with Question bank .pdf
CCS355 Neural Network & Deep Learning Unit II Notes with Question bank .pdf
 
Work Experience-Dalton Park.pptxfvvvvvvv
Work Experience-Dalton Park.pptxfvvvvvvvWork Experience-Dalton Park.pptxfvvvvvvv
Work Experience-Dalton Park.pptxfvvvvvvv
 
Past, Present and Future of Generative AI
Past, Present and Future of Generative AIPast, Present and Future of Generative AI
Past, Present and Future of Generative AI
 
INFLUENCE OF NANOSILICA ON THE PROPERTIES OF CONCRETE
INFLUENCE OF NANOSILICA ON THE PROPERTIES OF CONCRETEINFLUENCE OF NANOSILICA ON THE PROPERTIES OF CONCRETE
INFLUENCE OF NANOSILICA ON THE PROPERTIES OF CONCRETE
 
Artificial-Intelligence-in-Electronics (K).pptx
Artificial-Intelligence-in-Electronics (K).pptxArtificial-Intelligence-in-Electronics (K).pptx
Artificial-Intelligence-in-Electronics (K).pptx
 
Call Us -/9953056974- Call Girls In Vikaspuri-/- Delhi NCR
Call Us -/9953056974- Call Girls In Vikaspuri-/- Delhi NCRCall Us -/9953056974- Call Girls In Vikaspuri-/- Delhi NCR
Call Us -/9953056974- Call Girls In Vikaspuri-/- Delhi NCR
 
Call Girls Narol 7397865700 Independent Call Girls
Call Girls Narol 7397865700 Independent Call GirlsCall Girls Narol 7397865700 Independent Call Girls
Call Girls Narol 7397865700 Independent Call Girls
 
Introduction-To-Agricultural-Surveillance-Rover.pptx
Introduction-To-Agricultural-Surveillance-Rover.pptxIntroduction-To-Agricultural-Surveillance-Rover.pptx
Introduction-To-Agricultural-Surveillance-Rover.pptx
 
Biology for Computer Engineers Course Handout.pptx
Biology for Computer Engineers Course Handout.pptxBiology for Computer Engineers Course Handout.pptx
Biology for Computer Engineers Course Handout.pptx
 
IVE Industry Focused Event - Defence Sector 2024
IVE Industry Focused Event - Defence Sector 2024IVE Industry Focused Event - Defence Sector 2024
IVE Industry Focused Event - Defence Sector 2024
 
Gurgaon ✡️9711147426✨Call In girls Gurgaon Sector 51 escort service
Gurgaon ✡️9711147426✨Call In girls Gurgaon Sector 51 escort serviceGurgaon ✡️9711147426✨Call In girls Gurgaon Sector 51 escort service
Gurgaon ✡️9711147426✨Call In girls Gurgaon Sector 51 escort service
 
VICTOR MAESTRE RAMIREZ - Planetary Defender on NASA's Double Asteroid Redirec...
VICTOR MAESTRE RAMIREZ - Planetary Defender on NASA's Double Asteroid Redirec...VICTOR MAESTRE RAMIREZ - Planetary Defender on NASA's Double Asteroid Redirec...
VICTOR MAESTRE RAMIREZ - Planetary Defender on NASA's Double Asteroid Redirec...
 
Introduction to Machine Learning Unit-3 for II MECH
Introduction to Machine Learning Unit-3 for II MECHIntroduction to Machine Learning Unit-3 for II MECH
Introduction to Machine Learning Unit-3 for II MECH
 

Effects on Durability of recycle aggregate concrete in Marine Environment

  • 1. 1 CHAPTER 1 INTRODUCTION 1.1 GENERAL The applications of recycled aggregate in construction have started since end of World War II by demolished concretepavement as recycled aggregate in stabilizing the base course for road construction (Olorusongo F.T. 1999). Theadvantages of using recycle aggregate concrete in construction industry are of economic values and environmentalissues.So every year a lot of newer structure is rising with the economic development of the country. As a result the land for construction is getting smaller day by day. So undoubtedly the construction companies are heading towards the coastal areas. But seawater instrusion has a great impact on the durability of concrete. So it is tried to find out the effect of saline water on the concrete durability related properties (compressive & tensile strength, change in volume, chloride content, sulphate content, ph etc.) using various percentage of recycled aggregate for casting and saline water for curing. 1.2 BACKGROUND The seas and oceans contain 75% of the total surface of the earth. Nowadays many concrete structures are needed to construct in the coastal regions such as sea walls, concrete blocks, ship yard, ports, dry docks as well as residential and commercial buildings. Meanwhile recycled aggregates of demolished concrete are being wasted without any use. But it is very much possible to use huge part of demolished concrete as recycled aggregate in concrete constructions. So the use of recycled aggregate in
  • 2. 2 replacing the normal coarse aggregates in concrete construction has become popular among researchers. They compare the performance and characteristics of the two aggregates used. Most researchers found that the performance of recycled aggregate used in concrete has low workability and compressive strength. The reasons for these are because of factors like smooth texture and rounder shape of RA, higher percentage of fine particles and high water absorption (Olorusongo, F.T., 1999). This paper also intends to contribute to increase the knowledge of concrete durability characteristics with the use of recycled concrete aggregates in marine environment. 1.3 OBJECTIVES  To study the behavior of compressive strength as well as tensile strength of recycled aggregate concrete in marine environment.  To study the chloride content and PH in NaCl solution at different concentration.  To observe the change in volume with respect to salinity of water of recycled aggregate concrete in marine environment. 1.4 SCOPE Bangladesh consists of cities like Chittagong & Cox’s bazar situated just beside The Bay of Bengal where sea water intrusion is increasing day by day towards the coastal regions. As a result concrete structures loose its strength and durability in these regions due to the adverse effect of NaCl.The percentage of NaCl in total salt of water is 3.02. Our study is to bring the effective use of those recycled aggregate of demolished concrete to make the construction economic and feasible in marine
  • 3. 3 environment. Thus it can be seen that the scope of this investigation is huge in lowering the construction cost using waste materials like demolished concrete as coarse aggregate and checking its feasibility in using concrete construction around marine environment in seashore and coastal regions. This investigation will be beneficial for further use of recycled concrete in construction works of sea wall, dockyard etc. only if it is possible to gain a desired percentage of strength after some specified curing periods.
  • 4. 4 CHAPTER 2 REVIEW OF LITERATURE 2.1 INTRODUCTION The applications of recycled aggregate in construction have started since end of World War II by demolished concrete pavement as recycled aggregate in stabilizing the base course for road construction. The advantages of using recycle aggregate concrete in construction industry are of economic values and environmental issues. Otherwise high rise buildings are constructed in coastal region now a days. But seawater intrusion in coastal region has a great impact on the strength of concrete. So by using various percentage of recycled aggregates and saline water for curing it is tried to find out the effect of saline water on the durability of concrete. This paper also intends to contribute to increase the knowledge of concrete durability characteristics with the use of recycled concrete aggregates in marine environment. 2.2 ORDINARY CONCRETE Concrete is considered as chemically combined mass where the inert materials act as filter and binding materials acts as binder. So concrete can be defined as an artificial stone manufacture from a mixture of binding materials and inert materials with water. It can be expressed as following Concrete = Binding materials + Inert materials + water Here most commonly used binding materials are cement and lime. Again the inert materials used are termed as aggregate.
  • 5. 5 2.3 RECYCLED CONCRETE Recycled concrete means that concrete in which recycled aggregates are used as coarse aggregates. These recycled concrete are very much economical but the strength gained are comparatively low. If a desired and considerable strength achievement is possible by using of recycled aggregate in recycled concrete, only then recycled concrete technology will be reasonable and feasible. 2.3.1 SOURCE Recycled concrete are made with recycled aggregates. The main source of recycled aggregate are demolished concrete from old concrete structures which are demolished or broken down due to various purposes. These demolished concrete are then broken into small chips. Then they are sieved through standard sieves and finally recycled aggregates are obtained. 2.3.2 TYPES The types of recycled concrete depend on the percentage of recycled aggregate used in concrete casting. Various amount of recycled aggregate are used such as 20% ,30%, 40%, 50% etc. Among tiose percentage the optimum percentage is to be found by using which optimum type of recycled concrete can be produced. 2.4 MARINE ENVIRONMENT The term marine environment is generally well understood but the complexities inherent in such environment are not usually clear. Marine environment is not just over the sea, but it could be deemed to be extending over the coast, and the neighbourhood of tidal cracks, backwaters and estuaries. Broadly it covers the area
  • 6. 6 where concrete becomes wet with seawater and wherever the wind will carry saltwater spray, which may be as far 1 km inland. Reinforced concrete structures, located in such an environment, are always subjected to aggressive loadings both physical and chemical in nature, over their entire life span. It is therefore, necessary to understand clearly the characteristics of the seas, the various aggressive agents causing distress, their nature, intensity of attack, the different detrimental zone etc. in order to get satisfactory performance of marine structures. 2.4.1 DENSITY OF SEA WATER: Average density at the surface is 1.025 g/ml. Seawater is denser than both fresh water and pure water (density 1.0 g/ml @ 4 °C (39 °F)) because the dissolved salts add mass without contributing significantly to the volume. The freezing point of seawater decreases as salt concentration increases. At typical salinity it freezes at about −2 °C (28 °F).[1] The coldest seawater ever recorded (in a liquid state) was in 2010, in a stream under an Antarctic glacier, and measured −2.6 °C (27.3 °F).[2] 2.4.2 SALINITY OF SEA WATER: Seawater or salt water is water from a sea or ocean. On average, seawater in the world's oceans has a salinity of about 3.5% (35 g/L). This means that every kilogram (roughly one litre by volume) of seawater has approximately 35 grams (1.2 oz) of dissolved salts (predominantly sodium (Na+) and chloride (Cl−) ions).
  • 7. 7 2.5 FACTORS AFFECTING THE DURABILITY OF CONCRETE IN MARINE ENVIRONMENT According to ACI committee 201, durability of Portland cement concrete is defined as its ability to resist weathering action, chemical attack, and abrasion or any other process of deterioration when exposed to its environment. Some of these important factors are given below: 2.5.1 AGGREGATE TYPE The durability of concrete is influenced to a large extent by the properties and proportions of its constituent materials. Since the aggregates occupy up to 80% by volume of concrete, the resistance surface properties of the aggregates are important parameters affecting durability of concrete. To ensure adequate durability of marine structure, the aggregate material should be dense, non-shrinking and alkali resistant. Seawater composition (by mass) (salinity = 3.5) Element Percent Element Percent Oxygen 85.84 Sulfur 0.091 Hydrogen 10.82 Calcium 0.04 Chloride 1.94 Potassium 0.04 Sodium 1.08 Bromine 0.0067 Magnesium 0.1292 Carbon 0.0028
  • 8. 8 2.5.2 CEMENT TYPE The resistance of concrete against the action of various aggressive agencies depends to a great extent on the type and properties of cement. Ordinary Portland and sulfate resisting cements are the various types mainly used in marine concrete construction. Various researchers assessed the performance of these cements individually by either exposing the mortar and concrete specimens in the seawater or in its constituent salt solutions, to study their strength and durability characteristics. 2.5.3 CEMENT CONTENT Apart from other factors, the cement content also has a marked influence on the durability of reinforced concrete. Several researchers and authorities have been given recommendations for the minimum cement content of concrete exposed to different zones of marine environment. 2.5.4 WATER-CEMENT RATIO The water-cement ratio influences both the strength and durability of concrete. According to Abram’s law, the strength of concrete at a given age and normal temperature decreases with increasing water-content ratio assuming full compaction of concrete. Permeability of concrete to water depends mainly on the w/c ratio, which determines the size, volume and continuity of the capillary voids. It is clear that even a small increase of w/c ratio can increase the concrete permeability to a great extent.
  • 9. 9 2.5.5 PERMEABILITY Permeability is the most important characteristics determining the long-term durability of reinforced concrete exposed to seawater as it control the diffusion of aggressive salt-ions into the concrete. ACI 318-83 requires that normal weight concrete subjected to freezing and thawing in a moist condition should have a maximum w/c ratio of 0.45 in case of curbs, gutter, guard rail, or their sections and 0.50 for other elements. 2.5.6 AIR ENTRAINMENT Harden concrete containing entrained air is more uniform, has less absorption and permeability and much more resistant to the action of freezing and thawing. Normally about 4-6% of air by volume of concrete is entrained which is dispersed throughout, the concrete in the form of minute, disconnect bubble. It has been reported that the amount of entrained air necessary for imparting the highest resistance to frost action in the seawater is in the range of 10-12% which is more than twice as large as fore concrete with 3-6% air entrained when exposed to plain water in similar environment. However, the amount of air entrained (10-12%) reduces the compressive strength of the concrete to about one-half of the strength without air entrainment. 2.5.7 QUALITY OF MIXING WATER Sea water has a total salinity of 3.5% of which 78% of the dissolved solid being NaCl and 15% MgCl2 and MgSO4. According to ACI 318-43, mixing water should be potable and free from salts. Giving no specific reference to seawater, it specifies that mortar cubes made with mixing water which are not potable shall have 7 days and 28
  • 10. 10 days strength equal to at least 90% of strength of similar specimens made with potable water 2.5.8 CARBONATION PROCESS The hydrated concrete has a tendency of combining with carbon dioxide present in the atmosphere and forming carbonates, which partly neutralizes the alkaline nature of concrete. This process is known as carbonation. When carbonation depth exceeds the depth of cover to the reinforcement, the salt ions find a suitable environment leading to greater corrosion. 2.5.9 DEPTH OF COVER TO THE REINFORCEMENT The thickness of the concrete cover to the steel is an important factor regarding rebar corrosion in an aggressive environment. It affects the time taken for the salts to penetrate to the steel and the subsequent rate of arrival of oxygen at the steel surface as in the case of permeability. Lesser the cover, shorter the time required to reach the embedded steel. Also moisture content is affected by the depth of the cover and permeability to surrounding salts and gasses. 2.5.10 INFLUENCE OF CRACKS Reinforced concrete structure, either reinforced develop unavoidable cracks during their service life. Cracking may stem from various causes; construction cracks as a result of initial and drying shrinkage, settlement, heats of hydration; load cracking during normal service as a result of flexure, stress reversal, torsion, shear etc.
  • 11. 11 However, cracks offer a path to the interior of concrete for the deactivating and corroding agents. 2.5.11 AGE OF IMMERSION The age at immersion also referred to as period of procuring is the time duration of concrete commencing immediately after casting up to the formal curing. In a marine environment, procuring of concrete can be done with either seawater or fresh plain water. The dissolved salts start reacting with the concrete affecting its rate of gain in strength when procuring is done with seawater. 2.5.12 DIFFUTION OF SALTS UNDER PRESSURE The harmful salt ions enter the body of concrete at various depths under hydrostatic pressure and the embedded steel. The resulting disintegration of concrete which in turn increases its permeability and provides greater access to the chloride ions for coming in contact with steel. But due to limited availability of oxygen, the corrosion process is often ineffective. 2.5.13 WETTING AND DRYING CYCLES In a marine environment, the structural concrete in the tidal zone undergoes alternate wetting and drying process due to wave and tidal action.
  • 12. 12 2.5.14 FREEZING AND TWAWING CYCLE Concrete is greatly affected by freeze-thaw cycles. The change in physical state of water (liquid-solid) inside the mass of concrete results in an increase of volume by 9%. The volume of change in a cycle fashion (freeze- thaw cycle) causes disruption of concrete by dilation process.. 2.6 CORROSION OF REINFORCED CONCRETE IN MARINE ENVIRONMENT The corrosion of steel embedded in concrete is an electrochemical process. The electrochemical potentials forming the corrosion cells may be generated in two ways: (a) Composition cells that may be formed when two dissimilar metals are embedded in concrete such as steel rebar and Al conduit pipes or when significant variation exit in surface characteristics of the steel. (b) Concentration cells that may be formed due to difference in concentrations of dissolved ions in the vicinity of steel such as alkalis, chlorides and oxygen. As a result of either composition or concentration cell one of the two metals or some art of the metals become anode and the cathode. The fundamental chemical changes occurring at the anodic and cathode areas are as follows: Anode: Fe → 2e- + Fe2+ ↘ (Metallic iron) Fe2O (H2O) n (Rust) Cathode: O2 + H2O + 2e- → 2(OH) - ↗
  • 13. 13 (Air) The transform of metallic iron to rust is accompanied by an increase in volume which depending on the state of oxidation may be as large as 600 percent of the original metal consumed. The formation of corrosion products can produce a pressure of 40 N/mm2 which will easily overcome the tensile strength of concrete of about 40N/mm2 . The result is corrosion cracks, spelling and ultimately structural failure. Four states of corrosion of steel in concrete have been defined namely: (a) Passive state (b) Pitting corrosion (c) General corrosion (d) Active low potential corrosion 2.7 CASE HISTORYS OF REINFORCED CONCRETE DETERIORATION IN MARINE ENVIRONMENT: From the stand point of some of the earliest published date on deterioration of reinforced concrete in sea water the following reports cited by Johnson are of considerable interest: (i) A report by British Institution of Civil Engineering to the International Navigation Congress on 30 concrete structures was given in 1920. Six constructed during 1855- 1880 and the remaining 24 during 1880-1912 showed that 17 of the 30 structures were in a state of deterioration.
  • 14. 14 (ii) A report of reinforced concrete damage from Port of Spain shown that a breakwater was built with 90 day cured concrete which was fully submerged 12 meters below the low-tide lime. Within five years, the concrete was found in a state of deterioration. (iii) In 1922 San Francisco Bay Marine piling committee showed that 457 reinforced concrete cylinders needed repair from a total of 5198 install during 1909-1918. 2.8 PREVIOUS RESEARCH WORKS IN RELATED SECTORS: (i) “Influence of Recycled Concrete Aggregates on Concrete Durability‖ in National Laboratory of Civil Engineering, Portugal, shows that replacement of natural aggregates up to 50% by recycled aggregates led to concrete strength reduction of 5% in normal environment. (ii) ―Shear Strength of Concrete with Recycled Aggregates‖ in School of civil Engineering, University of a Coruna, Spain, shows that replacing 50% of recycled aggregates requires a 6.2% increase in the amount of cement in order to maintain a consistency of the mixes. (iii) ―Compressive Strength of Concrete with Recycled Aggregates‖ in National Laboratory of Civil Engineering, Portugal, shows that due to lower densities and higher water absorption of recycled aggregates led to a reduction of concrete strength.
  • 15. 15 CHAPTER 3 EXPERIMENTAL INVESTIGATIONS 3.1 MATERIALS Relatively higher strength concrete with a lower permeability is commonly used for the construction of marine structures. A brief description of the constituent materials used in the present investigation is given below. The materials used are cement, fine aggregates, coarse aggregates, water as construction materials and curing tank as curing equipment. The property test of the construction materials are conducted properly. Based on specified properties of construction materials ACI mix design has been done. From ACI mix design required mix proportion has been determined for desired strength. Then 4‖ cube blocks of required numbers as working plan are casted. 3.1.1 CEMENT Ordinary Portland cement (OPC) and Pozzolana Portland cement (PPC) both are used for concrete construction in marine environment. Ordinary Portland cement as per ASTM type 1 is used in this experimental investigation as it is the most common type of cement used in Bangladesh. The relevant physical properties for the ordinary Portland cement has to be determined first. The physical properties of the cement used in this experiment are mentioned below comparing with the ASTM standard value.
  • 16. 16 Physical Properties of Ordinary Portland cement are given in following table: Table 3.1: Physical Properties of Ordinary Portland cement SL No. Characteristics Valued Obtained Experimentally Valued Specified by ASTM 1 Fineness 94% >90% 2 Normal Consistency 24.5% 22-30% 3 Soundness 6mm <10mm 4 Setting Time Initial 145 min >45 min Final 185 min <375 min 5 Compressive strength(psi) 3 days 15.2 >12.4 7 days 20.9 >19.3
  • 17. 17 3.1.2 FINE AGGREGATES Sylhet sand is used as fine aggregate in this experimental investigation. Properties of fine aggregate are listed below: Table 3.2: Properties of Fine Aggregate Sieve No % of Retaining Cumulative % of Retain % Finer # 4 0 0 0 # 8 4.88 4.88 95.12 # 16 17.68 22.56 77.44 # 30 29.04 51.6 48.4 # 50 26.38 77.98 22.02 # 100 18.72 96.7 3.3 Total 253.72 Properties of Fine Aggregate Fineness modulus 2.54 Specific gravity 2.59 Absorption capacity 1.7 Moisture content 2.65
  • 18. 18 3.1.3 COARSE AGGREGATES Normal aggregates and recycled aggregates are used as coarse aggregates in this experimental investigation. Different percentage both of this type are used to make 4 samples of coarse aggregate. These 4 samples are mentioned below: Sample Normal aggregate Recycled Aggregate Sample 1 (R20) 80% 20% Sample 2 (R30) 70% 30% Sample 3 (R40) 60% 40% Sample 4 (R50) 50% 50% Properties of this 4 sample of coarse aggregates are given below: Table 3.3: Properties of Coarse Aggregate Sample Property R20 R30 R40 R50 Unit Weight (Kg/m3 ) 1515 1505 1494 1487 Bulk specific Gravity(SSD) 2.53 2.53 2.52 2.52 Absorption capacity (%) 1.1 1.4 1.7 2.1 Moisture content (%) 0.3 0.4 0.5 0.6
  • 19. 19 3.1.4 WATER  Casting water  Curing water Casting water: For casting of concrete only fresh plain and potable water is used in this experiment. Curing water: For curing of 4‖ cube blocks 4 samples of curing water are used as mentioned below: Sample Curing Water Type Weight of NaCl in1 cft water Sample 1 (0N) Plain water 0 kg Sample 2 (1N) 1N Saline Water .709 kg Sample 3 (3N) 3N Saline Water 2.127 kg Sample 4 (5N) 5N Saline Water 3.545 kg
  • 20. 20 3.1.5 WATER/CEMENT RATIO For concrete exposed to sea water environment durability consideration must be accounted for. And ACI mix design specified for a maximum W/C ratio of 0.45 for durability consideration. Following 3 W/C ratio have been found for different requirements and among them the lowest one is to be taken. Consideration W/C Ratio According to strength (3000 psi) 0.59 According to seawater exposure 0.50 According to durability 0.45 So, the selected theoretical W/C ratio is 0.45 3.1.6 CONCRETE MIX RATIO Concrete mix ratio is designed on the basis of ACI mix design where the design compressive strength of concrete is taken as 3000 psi. This specific strength is taken in this experimental investigation as this concrete strength is most widely used in our country. As we used 4 different samples of coarse aggregate, 4 different concrete mix ratios have been found. These are mentioned in the following table:
  • 21. 21 Table 3.4: Mix Ratio for Different Sample Sample Normal aggregate Recycled Aggregate Mix Ratio Sample 1 (R20) 80% 20% 1 : 1.61 : 2.95 Sample 2 (R30) 70% 30% 1 : 1.62 : 2.93 Sample 3 (R40) 60% 40% 1 : 1.62 : 2.92 Sample 4 (R50) 50% 50% 1 : 1.63 : 2.91 3.1.7 CURING TANKS 8 curing tanks are collected on the purpose of curing 4 different samples in 4 different types of curing water. 3.2 LIST OF TEST: a. Physical parameter :  compressive strength  tensile strength  percentage of change in volume b. Chemical analysis :  determination of chloride content  determination of PH
  • 22. 22 3.2.1 COMPRESSIVE STRENGTH: Cement concrete is known to possess substantially high compressive strength. The tensile strength is usually only about 10-15% of its compressive strength. It was, therefore considered sufficient test to RC specimen to test the concrete. 3.2.2 DETERMINATION OF CHLORIDE CONTENT : REAGENT USED: 1. Dilute nitric acid. 2. 0.1N ammonium thiocyanate. 3. 0.1N silver nitrate. 4. Nitrobenzene. 5. Ferric alum. PROCEDURE: 1. The sample collected after passing through by NO.200sieve. 2. 3 gms. Of powdered sample, weighed to the nearest .1mg. was added to about 70 ml distilled water and the solution was boiled for 5 minutes. 3. After cooling it was filtered and residue was washed several times with hot distilled water and was made a volume of 150 ml. 4. A 50 ml. of sample solution was pipetted into a 250 ml. conical flask and acidified with dilute nitric acid. 5. .1N silver nitrate solution was added in excess to it and its volume was recorded.
  • 23. 23 6. 4to 5 ml. of nitrobenzene and 1ml. of ferric alum indicator solution added to it and shaken vigorously to coagulate the precipitation. 7. Excess silver nitrate was then treated with .1N. ammoniumthiocyanate until a permanent faint reddish brown color appeared. Weight of the soluble chloride in sample=(N1V1-N2V2)*35.46*3/1000(gm) Chloride percent (%)=(N1V1-N2V2)*3.546*3/W Where, N1=Normality of silver nitrate solution. N2=Normality of ammonium thiocyanate. V1=Volume of silver nitrate solution added. V2=Volume of ammonium thiocyanate added. W=Weight of the powdered concrete sample used. 3.3 CASTING OF TEST SPECIMENS A total of 320 cubes are cast for 4 different samples of coarse aggregates. The casting was conducted from 28th February 2012 to 1st March 2012 in 3 days onwards and in each day 48 cubes were cast. The 36 cubes of R30, R40 and R50 are cast on 3 following days and 12 cubes of R0 are cast on each day.
  • 24. 24 3.4 CURING OF TEST SPECIMENS The 320 cubes are then cured in 8 curing tanks containing 4 different type of curing water as specified in flow diagram. Each tank contains a total of 40 cubes. 3.5 COMPRESSIVE STRENGTH TEST Thecompressive strength tests are conducted after specified duration of curing periods of 28 days, 60 days and 90 days. The calibration equations of the compressive strength test machine of SM laboratory are given bellow: Y = 5.883 X – 11.71 Where, X= Reading given by machine Y= Applied load (KN) 3.6 PRECAUTIONS Following precautions are maintained carefully during experimental investigations:  During testing of materials all the properties have been determined with specified process.  Before casting all the measuring devices have been checked as per requirement to maintain desired mix ratios.  Fine aggregates and coarse aggregates have been mixed in SSD condition to maintain design mix ratio as per ACI mix design.
  • 25. 25  Mixing platform was made SSD before putting the materials on it to maintain W/C ratio.  Mixing time and speed was maintained properly.  After attaining suitable consistency the wet concrete mix was poured into specified cubes which inside area were greased properly.  The tamping of the concrete mix was done carefully in 2 layer with 25 blows uniformly each to avoid possible segregation.
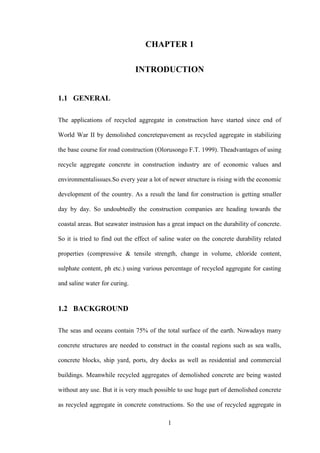
  • 26. 26 FIG: 3.3 FLOW DIAGRAM OF INVESTIGATION WORK Total no of cubes (320) Recycled (320) Aggregate types 4 4 4 4 16 1 16 8 8 0 8 30% 40%% of Recycled Aggregates Curing periods Salinity of curing water 2 month 3 month1 month 20% 3N 5N 0N 1N 8 50% 1 6 mont h 1 12 month
  • 27. 27 CASTING OF CONCRETE CUBES Casting specimens and concrete cubes after casting are shown in following pictures: Pic 3.1: Mixing of concrete Pic 3.2: Concrete cubes before placing into curing tanks
  • 29. 29 Table 4. 1: Compressive strength (psi) Concentration of curing water Designation Compressive strength (psi) 30 Day 60 Day 90 Day 180 Day Plain water 20R0 3486 3733 3870 3930 30R0 3294 3568 3760 3820 40R0 3184 3348 3541 3712 50R0 2416 2580 2635 3021 1 N 20R1 3239 3678 3760 3840 30R1 3129 3348 3568 3630 40R1 3047 3211 3376 3503 50R1 2306 2388 2498 2775 3 N 20R3 3156 3486 3623 3710 30R3 2937 3047 3348 3435 40R3 2937 3019 3184 3245 50R3 2196 2279 2416 2543 5N 20R5 3047 3294 3458 3530 30R5 2745 2992 3129 3258 40R5 2800 2964 3047 3212 50R5 2114 2224 2333 2411
  • 30. 30 Table 4. 2: Tensile strength (psi) Concentration of curing water Designation Tensile strength (psi) 30 Day 60 Day 90 Day 180 Day Plain water 20R0 578 578 660 710 30R0 495 578 578 653 40R0 413 495 578 613 50R0 331 413 495 535 1 N 20R1 495 495 578 673 30R1 413 495 578 592 40R1 413 413 495 556 50R1 413 413 413 446 3 N 20R3 413 495 495 610 30R3 413 495 578 589 40R3 331 413 495 556 50R3 331 249 413 446 5N 20R5 413 413 495 557 30R5 331 495 495 537 40R5 331 331 413 521 50R5 249 331 331 413
  • 31. 31 Table 4. 3: Change in Volume (%) Concentration of curing water Designation Change in Volume (%) 30 Day 60 Day 90 Day 180 Day Plain water 20R0 -1.26 -1.16 -1.12 -1.08 30R0 -1.19 -1.09 -1.04 -1 40R0 -1.05 -0.93 -0.87 -0.67 50R0 -0.92 -0.76 -0.67 -0.56 1 N 20R1 -0.67 -0.48 -0.4 -0.29 30R1 -0.58 -0.39 -0.31 -0.2 40R1 -0.47 -0.27 -0.19 -0.11 50R1 -0.36 -0.2 -0.11 -0.04 3 N 20R3 -0.11 0.13 0.29 0.39 30R3 0.01 0.26 0.41 0.52 40R3 0.09 0.34 0.49 0.61 50R3 0.12 0.44 0.56 0.72 5N 20R5 0.18 0.51 0.63 0.78 30R5 0.23 0.58 0.68 0.84 40R5 0.27 0.67 0.75 0.93 50R5 0.33 0.73 0.87 0.98
  • 32. 32 Table 4. 4: Value of PH Concentration 0f curing water Desig- nation Value of PH Curing periods 30 Day 60 Day 90 Day 180 Day Surface 15 mm 25 mm Surface 15 mm 25 mm Surface 15 mm 25 mm Surface 15 mm 25 mm Plain water 20R0 13.47 13.46 13.48 13.34 13.36 13.43 13.38 13.48 13.5 13.45 13.51 13.53 30R0 13.4 13.39 13.42 13.37 13.41 13.43 13.39 13.42 13.44 13.49 13.5 13.56 40R0 13.4 13.42 13.46 13.41 13.4 13.45 13.39 13.38 13.4 13.51 13.56 13.61 50R0 13.49 13.48 13.5 13.45 13.38 13.47 13.32 13.42 13.44 13.4 13.58 13.63 1 N 20R1 13.3 13.45 13.44 13.34 13.43 13.41 13.3 13.44 13.45 13.52 13.61 13.68 30R1 13.36 13.42 13.44 13.37 13.39 13.45 13.25 13.36 13.38 13.55 13.56 13.61 40R1 13.42 13.41 13.44 13.41 13.43 13.49 13.31 13.45 13.48 13.51 13.52 13.58 50R1 13.44 13.45 13.5 13.42 13.46 13.41 13.35 13.38 13.43 13.6 13.68 13.7 3 N 20R3 13.32 13.35 13.41 13.34 13.21 13.39 13.21 13.3 13.35 13.52 13.58 13.7 30R3 13.39 13.4 13.45 13.38 13.42 13.41 13.21 13.35 13.42 13.53 13.59 13.65 40R3 13.4 13.42 13.45 13.37 13.41 13.46 13.16 13.35 13.36 13.48 13.46 13.65 50R3 13.33 13.42 13.48 13.34 13.49 13.42 13.25 13.36 13.38 13.49 13.56 13.65 5 N 20R5 13.34 13.36 13.43 13.46 13.39 13.41 13.2 13.4 13.41 13.3 13.44 13.48 30R5 13.41 13.45 13.48 13.39 13.46 13.5 13.36 13.5 13.51 13.3 13.48 13.5 40R5 13.3 13.45 13.47 13.46 13.39 13.48 13.3 13.4 13.42 13.32 13.42 13.48 50R5 13.39 13.46 13.48 13.4 13.37 13.4 13.25 13.3 13.4 13.34 13.43 13.5
  • 33. 33 Table 4. 5: Percentage of Chloride content Concentration 0f curing water Desig- nation Percentage of Chloride content Curing periods 30 Day 60 Day 90 Day 180 Day Surface 15 mm 25 mm Surface 15 mm 25 mm Surface 15 mm 25 mm Surface 15 mm 25 mm 1 N 20R1 0.025 0.023 0.018 0.030 0.028 0.025 0.039 0.035 0.030 0.046 0.043 0.041 30R1 0.028 0.025 0.020 0.032 0.030 0.028 0.035 0.032 0.028 0.039 0.035 0.030 40R1 0.034 0.027 0.025 0.035 0.032 0.030 0.039 0.034 0.030 0.043 0.037 0.035 50R1 0.039 0.034 0.032 0.043 0.041 0.035 0.041 0.039 0.035 0.043 0.039 0.037 3 N 20R3 0.037 0.035 0.034 0.043 0.039 0.037 0.046 0.043 0.037 0.046 0.041 0.032 30R3 0.039 0.037 0.035 0.046 0.043 0.039 0.048 0.046 0.044 0.050 0.046 0.043 40R3 0.043 0.037 0.035 0.046 0.044 0.041 0.050 0.048 0.046 0.053 0.051 0.046 50R3 0.046 0.043 0.037 0.048 0.046 0.043 0.050 0.046 0.044 0.051 0.050 0.046 5 N 20R5 0.050 0.046 0.043 0.053 0.051 0.046 0.057 0.055 0.053 0.060 0.057 0.059 30R5 0.051 0.046 0.043 0.053 0.050 0.043 0.055 0.050 0.046 0.060 0.059 0.053 40R5 0.057 0.050 0.048 0.060 0.059 0.055 0.064 0.060 0.059 0.067 0.064 0.062 50R5 0.060 0.059 0.055 0.062 0.059 0.053 0.067 0.062 0.057 0.073 0.071 0.066
  • 34. 34 Table 4.1.1: Comparison of compressive strength of concrete for different curing period cured in Normal water Designation Aggregate Type Compressive Strength Curing period (Day) 30 Day 60 Day 90 Day 180 Day 20R0 20% Recycled 3486 3733 3870 3930 30R0 30% Recycled 3294 3568 3760 3820 40R0 40% Recycled 3184 3348 3541 3712 50R0 50% Recycled 2416 2580 2635 3021 Table 4.1.2: Comparison of compressive strength of concrete for different curing period cured in Saline Water having concentration of 1N. Designation Aggregate Type Compressive Strength Curing period (Day) 30 Day 60 Day 90 Day 180 Day 20R1 20% Recycled 3239 3678 3760 3840 30 R1 30% Recycled 3129 3348 3568 3630 40 R1 40% Recycled 3047 3211 3376 3503 50 R1 50% Recycled 2306 2388 2498 2775 Table 4.1.3: Comparison of compressive strength of concrete for different curing period cured in Saline Water having concentration of 3N. Designation Aggregate Type Compressive Strength Curing period (Day) 30 Day 60 Day 90 Day 180 Day 20R3 20% Recycled 3156 3486 3623 3710 30R3 30% Recycled 2937 3047 3348 3435 40R3 40% Recycled 2937 3019 3184 3245 50 R3 50% Recycled 2196 2279 2416 2543
  • 35. 35 Table 4.1.4: Comparison of compressive strength of concrete for different curing period cured in Saline Water having concentration of 5N. Designation Aggregate Type Compressive Strength Curing period (Day) 30 Day 60 Day 90 Day 180 Day 20R5 20% Recycled 3047 3294 3458 3530 30 R5 30% Recycled 2745 2992 3129 3258 40 R5 40% Recycled 2800 2964 3047 3212 50 R5 50% Recycled 2114 2224 2333 2411 Table 4.1.5: Comparison of compressive strength of concrete for different Concentration of Curing Water Cured for 30 Days Designation Aggregate Type Compressive Strength Concentration of Curing Water 0N 1N 3N 5N 20R30 20% Recycled 3486 3239 3156 3047 30 R30 30% Recycled 3294 3129 2937 2745 40 R30 40% Recycled 3184 3047 2937 2800 50 R30 50% Recycled 2416 2306 2196 2114 Table 4.1.6: Comparison of compressive strength of concrete for different Concentration of Curing Water Cured for 60 Days Designation Aggregate Type Compressive Strength Concentration of Curing Water 0N 1N 3N 5N 20R60 20% Recycled 3733 3678 3486 3294 30 R60 30% Recycled 3568 3348 3047 2992 40 R60 40% Recycled 3348 3211 3019 2964 50 R60 50% Recycled 2580 2388 2279 2224
  • 36. 36 Table 4.1.7: Comparison of compressive strength of concrete for different Concentration of Curing Water Cured for 90 Days Designation Aggregate Type Compressive Strength Concentration of Curing Water 0N 1N 3N 5N 20R90 20% Recycled 3870 3760 3623 3458 30 R90 30% Recycled 3760 3568 3348 3129 40 R90 40% Recycled 3541 3376 3184 3047 50 R90 50% Recycled 2635 2498 2416 2333 Table 4.1.8: Comparison of compressive strength of concrete for different Concentration of Curing Water Cured for 180 Days Designation Aggregate Type Compressive Strength Concentration of Curing Water 0N 1N 3N 5N 20R180 20% Recycled 3930 3840 3710 3530 30 R180 30% Recycled 3820 3630 3435 3258 40 R180 40% Recycled 3712 3503 3245 3212 50 R180 50% Recycled 3021 2775 2543 2411 Table 4.1.9: Comparison of compressive strength of concrete for different Types of Aggregate Cured for 30 Days Designation Concentration of curing water Compressive Strength Aggregate Type 20% Recycled 30% Recycled 40% Recycled 50% Recycled 0N30 0N 3486 3294 3184 2416 1N30 1N 3239 3129 3047 2306 3N30 3N 3156 2937 2937 2196 5N30 5N 3047 2745 2800 2114
  • 37. 37 Table 4.1.10: Comparison of compressive strength of concrete for different Types of Aggregate Cured for60 Days Designation Concentration of curing water Compressive Strength Aggregate Type 20% Recycled 30% Recycled 40% Recycled 50% Recycled 0N60 0N 3733 3568 3348 2580 1N60 1N 3678 3348 3211 2388 3N60 3N 3486 3047 3019 2279 5N60 5N 3294 2992 2964 2224 Table 4.1.11: Comparison of compressive strength of concrete for different Types of Aggregate Cured for90 Days Designation Concentration of curing water Compressive Strength Aggregate Type 20% Recycled 30% Recycled 40% Recycled 50% Recycled 0N90 0N 3870 3760 3541 2635 1N90 1N 3760 3568 3376 2498 3N90 3N 3623 3348 3184 2416 5N90 5N 3458 3129 3047 2333 Table 4.1.12: Comparison of compressive strength of concrete for different Types of Aggregate Cured for180 Days Designation Concentration of curing water Compressive Strength Aggregate Type 20% Recycled 30% Recycled 40% Recycled 50% Recycled 0N180 0N 3930 3820 3712 3021 1N180 1N 3840 3630 3503 2775 3N180 3N 3710 3435 3245 2543 5N180 5N 3530 3258 3212 2411
  • 38. 38 Table 4.2.1: Comparison of Tensile Strength of concrete for different Types of Aggregate Cured for 30 Days Designation Concentration of curing water Compressive Strength Aggregate Type 20% Recycled 30% Recycled 40% Recycled 50% Recycled 0N30 0N 578 495 413 331 1N30 1N 495 413 413 413 3N30 3N 413 413 331 331 5N30 5N 413 331 331 249 Table 4.2.2: Comparison of Tensile strength of concrete for different Types of Aggregate Cured for 60 Days Designation Concentration of curing water Compressive Strength Aggregate Type 20% Recycled 30% Recycled 40% Recycled 50% Recycled 0N60 0N 578 578 495 413 1N60 1N 495 495 413 413 3N60 3N 495 495 413 249 5N60 5N 413 495 331 331 Table 4.2.3: Comparison of Tensile strength of concrete for different Types of Aggregate Cured for 90 Days Designation Concentration of curing water Compressive Strength Aggregate Type 20% Recycled 30% Recycled 40% Recycled 50% Recycled 0N90 0N 660 578 578 495 1N90 1N 578 578 495 413 3N90 3N 495 578 495 413 5N90 5N 495 495 413 331
  • 39. 39 Table 4.2.4: Comparison of Tensile strength of concrete for different Types of Aggregate Cured for180Days Designation Concentration of curing water Compressive Strength Aggregate Type 20% Recycled 30% Recycled 40% Recycled 50% Recycled 0N180 0N 710 653 613 535 1N180 1N 673 592 556 446 3N180 3N 610 589 556 446 5N180 5N 557 537 521 413 Table 4.2.5: Comparison of Tensile strength of concrete for different Concentration of Curing Water Cured for 30 Days Designation Aggregate Type Compressive Strength Concentration of Curing Water 0N 1N 3N 5N 20R30 20% Recycled 578 495 413 413 30 R30 30% Recycled 495 413 413 331 40 R30 40% Recycled 413 413 331 331 50 R30 50% Recycled 331 413 331 249 Table 4.2.6: Comparison of Tensile strength of concrete for different Concentration of Curing Water Cured for 60 Days Designation Aggregate Type Compressive Strength Concentration of Curing Water 0N 1N 3N 5N 20R60 20% Recycled 578 495 495 413 30 R60 30% Recycled 578 495 495 495 40 R60 40% Recycled 495 413 413 331 50 R60 50% Recycled 413 413 249 331
  • 40. 40 Table 4.2.7: Comparison of Tensile strength of concrete for different Concentration of Curing Water Cured for 90 Days Designation Aggregate Type Compressive Strength Concentration of Curing Water 0N 1N 3N 5N 20R90 20% Recycled 660 578 495 495 30 R90 30% Recycled 578 578 578 495 40 R90 40% Recycled 578 495 495 413 50 R90 50% Recycled 495 413 413 331 Table 4.2.8: Comparison of Tensile strength of concrete for different Concentration of Curing Water Cured for180 Day Designation Aggregate Type Compressive Strength Concentration of Curing Water 0N 1N 3N 5N 20R180 20% Recycled 710 673 610 557 30 R180 30% Recycled 653 592 589 537 40 R180 40% Recycled 613 556 556 521 50 R180 50% Recycled 535 446 446 413 Table 4.2.9: Comparison of Tensile strength of concrete for different curing period cured in Normal water Designation Aggregate Type Compressive Strength Curing period (Day) 30 Day 60 Day 90 Day 180 Day 20R0 20% Recycled 578 578 660 710 30R0 30% Recycled 495 578 578 653 40R0 40% Recycled 413 495 578 613 50R0 50% Recycled 331 413 495 535
  • 41. 41 Table 4.2.10: Comparison of Tensile strength of concrete for different curing period cured in Saline Water having concentration of 1N. Designation Aggregate Type Compressive Strength Curing period (Day) 30 Day 60 Day 90 Day 180 Day 20R1 20% Recycled 413 495 495 610 30 R1 30% Recycled 413 495 578 592 40 R1 40% Recycled 413 413 495 556 50 R1 50% Recycled 413 413 413 446 Table 4.2.11: Comparison of Tensile strength of concrete for different curing period cured in Saline Water having concentration of 3N. Designation Aggregate Type Compressive Strength Curing period (Day) 30 Day 60 Day 90 Day 180 Day 20R3 20% Recycled 413 495 495 610 30R3 30% Recycled 413 495 578 589 40R3 40% Recycled 331 413 495 556 50 R3 50% Recycled 331 249 413 446 Table 4.2.12: Comparison of Tensile strength of concrete for different curing period cured in Saline Water having concentration of 5N. Designation Aggregate Type Compressive Strength Curing period (Day) 30 Day 60 Day 90 Day 180 Day 20R5 20% Recycled 413 413 495 557 30 R5 30% Recycled 331 495 495 537 40 R5 40% Recycled 331 331 413 521 50 R5 50% Recycled 249 331 331 413
  • 42. 42 Table 4.3.1: Value of pH in different depth for 20% recycled concrete cured in 30 days Table 4.3.2: Value of pH in different depth for 30% recycled concrete cured in 30 days. Table 4.3.3: Value of pH in different depth for 40% recycled concrete cured in 30 days. Designation Value of pH Curing period (30 Days) Surface 15mm 25mm 40R0 13.4 13.42 13.46 40R1 13.42 13.41 13.44 40R3 13.4 13.42 13.45 40R5 13.3 13.45 13.47 Designation Value of pH Curing period (30 Days) Surface 15mm 25mm 20R0 13.47 13.46 13.48 20R1 13.3 13.45 13.44 20R3 13.32 13.35 13.41 20R5 13.34 13.36 13.43 Designation Value of pH Curing period (30 Days) Surface 15mm 25mm 30R0 13.4 13.39 13.42 30R1 13.36 13.42 13.44 30R3 13.39 13.4 13.45 30R5 13.41 13.45 13.48 Designation Value of pH Curing period (30 Days) Surface 15mm 25mm 20R0 13.47 13.46 13.48 20R1 13.3 13.45 13.44 20R3 13.32 13.35 13.41 20R5 13.34 13.36 13.43
  • 43. 43 Table 4.3.4: Value of pH in different depth for 50% recycled concrete cured in 30 days. Table 4.3.5: Value of pH in different depth for 20% recycled concrete cured in 60 days. Designation Value of pH Curing period (60 Days) Surface 15mm 25mm 20R0 13.34 13.36 13.43 20R1 13.34 13.43 13.41 20R3 13.34 13.21 13.39 20R5 13.46 13.39 13.41 Table 4.3.6: Value of pH in different depth for 30% recycled concrete cured in 60 days. Designation Value of pH Curing period (60 Days) Surface 15mm 25mm 30R0 13.37 13.41 13.43 30R1 13.37 13.39 13.45 30R3 13.38 13.42 13.41 30R5 13.39 13.46 13.5 Designation Value of pH Curing period (30 Days) Surface 15mm 25mm 50R0 13.49 13.48 13.5 50R1 13.44 13.45 13.5 50R3 13.33 13.42 13.48 50R5 13.39 13.46 13.48
  • 44. 44 Table 4.3.7: Value of pH in different depth for 40% recycled concrete cured in 60 days. Table 4.3.8: Value of pH in different depth for 50% recycled concrete cured in 60 days. Designation Value of pH Curing period (60 Days) Surface 15mm 25mm 50R0 13.45 13.38 13.47 50R1 13.42 13.46 13.41 50R3 13.34 13.49 13.42 50R5 13.4 13.37 13.4 Table 4.3.9: Value of pH in different depth for 20% recycled concrete cured in 90 days. Designation Value of pH Curing period (90 Days) Surface 15mm 25mm 20R0 13.38 13.48 13.5 20R1 13.3 13.44 13.45 20R3 13.21 13.3 13.35 20R5 13.2 13.4 13.41 Designation Value of pH Curing period (60 Days) Surface 15mm 25mm 40R0 13.41 13.4 13.45 40R1 13.41 13.43 13.49 40R3 13.37 13.41 13.46 40R5 13.46 13.39 13.48
  • 45. 45 Table 4.3.10: Value of pH in different depth for 30% recycled concrete cured in 90 days. Table 4.3.11: Value of pH in different depth for 40% recycled concrete cured in 90 days. Designation Value of pH Curing period (90 Days) Surface 15mm 25mm 40R0 13.39 13.38 13.4 40R1 13.31 13.45 13.48 40R3 13.16 13.35 13.36 40R5 13.3 13.4 13.42 Table 4.3.12: Value of pH in different depth for 50% recycled concrete cured in 90 days. Designation Value of pH Curing period (90 Days) Surface 15mm 25mm 50R0 13.32 13.42 13.44 50R1 13.35 13.38 13.43 50R3 13.25 13.36 13.38 50R5 13.25 13.3 13.4 Designation Value of pH Curing Curing period (90 Days) Surface 15mm 25mm 30R0 13.39 13.42 13.44 30R1 13.25 13.36 13.38 30R3 13.21 13.35 13.42 30R5 13.36 13.5 13.51
  • 46. 46 Table 4.3.13: Value of pH in different depth for 20% recycled concrete cured in 180 days. Table 4.3.14: Value of pH in different depth for 30% recycled concrete cured in 180 days. Designation Value of pH Curing period (180 Days) Surface 15mm 25mm 30R0 13.49 13.5 13.56 30R1 13.55 13.56 13.61 30R3 13.53 13.59 13.65 30R5 13.3 13.48 13.5 Table 4.3.15: Value of pH in different depth for 40% recycled concrete cured in 180 days. Designation Value of pH Curing period (180 Days) Surface 15mm 25mm 40R0 13.51 13.56 13.61 40R1 13.51 13.52 13.58 40R3 13.48 13.46 13.65 40R5 13.32 13.42 13.48 Designation Value of pH Curing Curing period (180 Days) Surface 15mm 25mm 20R0 13.45 13.51 13.53 20R1 13.52 13.61 13.68 20R3 13.52 13.58 13.7 20R5 13.3 13.44 13.48
  • 47. 47 Table 4.3.16: Value of pH in different depth for 50% recycled concrete cured in 180 days. Designation Value of pH Curing Curing period (180 Days) Surface 15mm 25mm 50R0 13.4 13.58 13.63 50R1 13.6 13.68 13.7 50R3 13.49 13.56 13.65 50R5 13.34 13.43 13.5 Table 4.3.17: Value of pH in different depth for 20% recycled concrete cured in 0N Curing period Value of pH Depth (mm) Surface 15mm 25mm 30 Days 13.47 13.46 13.48 60 Days 13.34 13.36 13.43 90 Days 13.38 13.48 13.5 180 Days 13.45 13.51 13.53 Table 4.3.18: Value of pH in different depth for 30% recycled concrete cured in 0N Curing period Value of pH Depth (mm) Surface 15mm 25mm 30 Days 13.4 13.39 13.42 60 Days 13.37 13.41 13.43 90 Days 13.39 13.42 13.44 180 Days 13.49 13.5 13.56
  • 48. 48 Table 4.3.19: Value of pH in different depth for 40% recycled concrete cured in 0N Curing period Value of pH Depth (mm) Surface 15mm 25mm 30 Days 13.4 13.42 13.46 60 Days 13.41 13.4 13.45 90 Days 13.39 13.38 13.4 180 Days 13.51 13.56 13.61 Table 4.3.20: Value of pH in different depth for 50% recycled concrete cured in 0N Curing period Value of pH Depth (mm) Surface 15mm 25mm 30 Days 13.49 13.48 13.5 60 Days 13.45 13.38 13.47 90 Days 13.32 13.42 13.44 180 Days 13.4 13.58 13.63 Table 4.3.21: Value of pH in different depth for 20% recycled concrete cured in 1N Curing period Value of pH Depth (mm) Surface 15mm 25mm 30 Days 13.3 13.45 13.44 60 Days 13.34 13.43 13.41 90 Days 13.3 13.44 13.45 180 Days 13.52 13.61 13.68
  • 49. 49 Table 4.3.22: Value of pH in different depth for 30% recycled concrete cured in 1N Table 4.3.23: Value of pH in different depth for 40% recycled concrete cured in 1N Curing period Value of pH Depth (mm) Surface 15mm 25mm 30 Days 13.42 13.41 13.44 60 Days 13.41 13.43 13.49 90 Days 13.31 13.45 13.48 180 Days 13.51 13.52 13.58 Table 4.3.24: Value of pH in different depth for 50% recycled concrete cured in 1N Curing period Value of pH Depth (mm) Surface 15mm 25mm 30 Days 13.44 13.45 13.5 60 Days 13.42 13.46 13.41 90 Days 13.35 13.38 13.43 180 Days 13.6 13.68 13.7 Curing period Value of pH Depth (mm) Surface 15mm 25mm 30 Days 13.36 13.42 13.44 60 Days 13.37 13.39 13.45 90 Days 13.25 13.36 13.38 180 Days 13.55 13.56 13.61
  • 50. 50 Table 4.3.25: Value of pH in different depth for 20% recycled concrete cured in 3N Curing period Value of pH Depth (mm) Surface 15mm 25mm 30 Days 13.32 13.35 13.41 60 Days 13.34 13.21 13.39 90 Days 13.21 13.3 13.35 180 Days 13.52 13.58 13.7 Table 4.3.26: Value of pH in different depth for 30% recycled concrete cured in 3N Curing period Value of pH Depth (mm) Surface 15mm 25mm 30 Days 13.39 13.4 13.45 60 Days 13.38 13.42 13.41 90 Days 13.21 13.35 13.42 180 Days 13.53 13.59 13.65 Table 4.3.27: Value of pH in different depth for 40% recycled concrete cured in 3N Curing period Value of pH Depth (mm) Surface 15mm 25mm 30 Days 13.4 13.42 13.45 60 Days 13.37 13.41 13.46 90 Days 13.16 13.35 13.36 180 Days 13.48 13.46 13.65
  • 51. 51 Table 4.3.28: Value of pH in different depth for 50% recycled concrete cured in 3N Curing period Value of pH Depth (mm) Surface 15mm 25mm 30 Days 13.33 13.42 13.48 60 Days 13.34 13.49 13.42 90 Days 13.25 13.36 13.38 180 Days 13.49 13.56 13.65 Table 4.3.29: Value of pH in different depth for 20% recycled concrete cured in 5N Curing period Value of pH Depth (mm) Surface 15mm 25mm 30 Days 13.34 13.36 13.43 60 Days 13.46 13.39 13.41 90 Days 13.2 13.4 13.41 180 Days 13.3 13.44 13.48 Table 4.3.30: Value of pH in different depth for 30% recycled concrete cured in 5N Curing period Value of pH Depth (mm) Surface 15mm 25mm 30 Days 13.41 13.45 13.48 60 Days 13.39 13.46 13.5 90 Days 13.36 13.5 13.51 180 Days 13.3 13.48 13.5
  • 52. 52 Table 4.3.31: Value of pH in different depth for 40% recycled concrete cured in 5N Table 4.3.32: Value of pH in different depth for 50% recycled concrete cured in 5N Curing period Value of pH Depth (mm) Surface 15mm 25mm 30 Days 13.3 13.45 13.47 60 Days 13.46 13.39 13.48 90 Days 13.3 13.4 13.42 180 Days 13.32 13.42 13.48 Curing period Value of pH Depth (mm) Surface 15mm 25mm 30 Days 13.39 13.46 13.48 60 Days 13.4 13.37 13.4 90 Days 13.25 13.3 13.4 180 Days 13.34 13.43 13.5
  • 53. 53 Table 4.4.1: Percentage of chloride content in different depth for 20% recycled concrete cured in 30 days Table 4.4.2: Percentage of chloride content in different depth for 30% recycled concrete cured in 30 days Table 4.4.3: Percentage of chloride content in different depth for 40% recycled concrete cured in 30 days. Designation Chloride content (%) Curing period (30 Days) Surface 15mm 25mm 20R1 0.025 0.023 0.018 20R3 0.037 0.035 0.034 20R5 0.050 0.046 0.043 Designation Chloride content (%) Curing period (30 Days) Surface 15mm 25mm 30R1 0.028 0.025 0.020 30R3 0.039 0.037 0.035 30R5 0.051 0.046 0.043 Designation Chloride content (%) Curing period (30 Days) Surface 15mm 25mm 40R1 0.034 0.027 0.025 40R3 0.043 0.037 0.035 40R5 0.057 0.050 0.048
  • 54. 54 Table 4.4.4: Percentage of chloride content in different depth for 50% recycled concrete cured in 30 days. Table 4.4.5: Percentage of chloride content in different depth for 20% recycled concrete cured in 60 days. Table 4.4.6: Percentage of chloride content in different depth for 30% recycled concrete cured in 60 days. Designation Chloride content (%) Curing period (30 Days) Surface 15mm 25mm 50R1 0.039 0.034 0.032 50R3 0.046 0.043 0.037 50R5 0.060 0.059 0.055 Designation Chloride content (%) Curing period (60 Days) Surface 15mm 25mm 20R1 0.030 0.028 0.025 20R3 0.043 0.039 0.037 20R5 0.053 0.051 0.046 Designation Chloride content (%) Curing period (60 Days) Surface 15mm 25mm 30R1 0.032 0.030 0.028 30R3 0.046 0.043 0.039 30R5 0.053 0.050 0.043
  • 55. 55 Table 4.4.7: Percentage of chloride content in different depth for 40% recycled concrete cured in 60 days. Table 4.4.8: Percentage of chloride content in different depth for 50% recycled concrete cured in 60 days. Table 4.4.9: Percentage of chloride content in different depth for 20% recycled concrete cured in 90 days. Designation Chloride content (%) Curing period (60 Days) Surface 15mm 25mm 40R1 0.035 0.032 0.030 40R3 0.046 0.044 0.041 40R5 0.060 0.059 0.055 Designation Chloride content (%) Curing period (60 Days) Surface 15mm 25mm 50R1 0.043 0.041 0.035 50R3 0.048 0.046 0.043 50R5 0.062 0.059 0.053 Designation Chloride content (%) Curing period (90 Days) Surface 15mm 25mm 20R1 0.039 0.035 0.030 20R3 0.046 0.043 0.037 20R5 0.057 0.055 0.053
  • 56. 56 Table 4.4.10: Percentage of chloride content in different depth for 30% recycled concrete cured in 90 days. Table 4.4.11: Percentage of chloride content in different depth for 40% recycled concrete cured in 90 days. Table 4.4.12: Percentage of chloride content in different depth for 50% recycled concrete cured in 90 days. Designation Chloride content (%) Curing period (90 Days) Surface 15mm 25mm 30R1 0.035 0.032 0.028 30R3 0.048 0.046 0.044 30R5 0.055 0.050 0.046 Designation Chloride content (%) Curing period (90 Days) Surface 15mm 25mm 40R1 0.039 0.034 0.030 40R3 0.050 0.048 0.046 40R5 0.064 0.060 0.059 Designation Chloride content (%) Curing period (90 Days) Surface 15mm 25mm 50R1 0.041 0.039 0.035 50R3 0.050 0.046 0.044 50R5 0.067 0.062 0.057
  • 57. 57 Table 4.4.13: Percentage of chloride content in different depth for 20% recycled concrete cured in 180 days. Table 4.4.14: Percentage of chloride content in different depth for 30% recycled concrete cured in 180 days. Table 4.4.15: Percentage of chloride content in different depth for 40% recycled concrete cured in 180 days. Designation Chloride content (%) Curing period (180 Days) Surface 15mm 25mm 20R1 0.046 0.043 0.041 20R3 0.046 0.041 0.032 20R5 0.060 0.057 0.059 Designation Chloride content (%) Curing period (180 Days) Surface 15mm 25mm 30R1 0.039 0.035 0.030 30R3 0.050 0.046 0.043 30R5 0.060 0.059 0.053 Designation Chloride content (%) Curing period (180 Days) Surface 15mm 25mm 40R1 0.043 0.037 0.035 40R3 0.053 0.051 0.046 40R5 0.067 0.064 0.062
  • 58. 58 Table 4.4.16: Percentage of chloride content in different depth for 50% recycled concrete cured in 180 days. Designation Chloride content (%) Curing period (180 Days) Surface 15mm 25mm 50R1 0.043 0.039 0.037 50R3 0.051 0.050 0.046 50R5 0.073 0.071 0.066
  • 59. 59 Fig 4.1.1: Compressive Strength Vs. Curing Period for Concrete cured in Normal Water Fig 4.1.2: Compressive Strength Vs. Curing Period for Concrete cured in Saline Water having concentration of 1N. 0 500 1000 1500 2000 2500 3000 3500 4000 4500 0 30 60 90 120 150 180 Compressivestrength(psi) Curing period (Days) COMPRESSIVE STRENGTH Vs. CURING PERIODS 20R0 30R0 40R0 50R0 0 500 1000 1500 2000 2500 3000 3500 4000 4500 0 30 60 90 120 150 180 Compressivestrength(psi) Curing period (Days) 20R1 30R1 40R1 50R1
  • 60. 60 Fig 4.1.3: Compressive Strength Vs. Curing Period for Concrete cured in Saline Water having concentration of 3N. Fig 4.1.4: Compressive Strength Vs. Curing Period for Concrete cured in Saline Water having concentration of 5N. 0 500 1000 1500 2000 2500 3000 3500 4000 0 30 60 90 120 150 180 Compressivestrength(psi) Curing period (Days) 20R3 30R3 40R3 50R3 0 500 1000 1500 2000 2500 3000 3500 4000 0 30 60 90 120 150 180 Compressivestrength(psi) Curing period (Days) 20R5 30R5 40R5 50R5
  • 61. 61 Fig 4.1.5: Compressive Strength Vs. Concentration of Curing Water for Concrete Cured for 30 Days Fig 4.1.6: Compressive Strength Vs. Concentration of Curing Water for Concrete Cured for 60 Days 0 500 1000 1500 2000 2500 3000 3500 4000 Compressivestrength(psi) 0N 1N 3N 5N Concentration of curing water (N) 20R30 30R30 40R30 50R30 0 500 1000 1500 2000 2500 3000 3500 4000 Compressivestrength(psi) 0N 1N 3N 5N Concentration of curing water (N) 20R60 30R60 40R60 50R60
  • 62. 62 Fig 4.1.7: Compressive Strength Vs. Concentration of Curing Water for Concrete Cured for 90 Days Fig 4.1.8: Compressive Strength Vs. Concentration of Curing Water for Concrete Cured for 180 Days 0 500 1000 1500 2000 2500 3000 3500 4000 4500 Compressivestrength(psi) 0N 1N 3N 5N Concentration of curing water (N) 20R90 30R90 40R90 50R90 0 500 1000 1500 2000 2500 3000 3500 4000 4500 Compressivestrength(psi) 0N 1N 3N 5N Concentration of curing water (N) 20R180 30R180 40R180 50R180
  • 63. 63 Fig 4.1.9: Compressive Strength Vs. Types of Aggregate used in Concrete Cured for 30 Days Fig 4.1.10: Compressive Strength Vs. Types of Aggregate used in Concrete Cured for 60 Days 0 500 1000 1500 2000 2500 3000 3500 4000 Compressivestrength(psi) 20R 30R 40R 50R Type of aggregate 0N30 1N30 3N30 5N30 0 500 1000 1500 2000 2500 3000 3500 4000 Compressivestrength(psi) 20R 30R 40R 50R Type of aggregate 0N60 1N60 3N60 5N60
  • 64. 64 Fig 4.1.11: Compressive Strength Vs. Types of Aggregate used in Concrete Cured for 90 Days Fig 4.1.12: Compressive Strength Vs. Types of Aggregate used in Concrete Cured for 180 Days 0 500 1000 1500 2000 2500 3000 3500 4000 4500 Compressivestrength(psi) 20R 30R 40R 50R Type of aggregate 0N90 1N90 3N90 5N90 0 500 1000 1500 2000 2500 3000 3500 4000 4500 Compressivestrength(psi) 20R 30R 40R 50R Type of aggregate … 0N180 1N180 3N180 5N180
  • 65. 65 Fig 4.2.1: Tensile Strength Vs. Types of Aggregate used in Concrete Cured for 30 Days Fig 4.2.2 : Tensile Strength Vs. Types of Aggregate used in Concrete Cured for 60 Days 0 100 200 300 400 500 600 700 Tensilestrength(psi) 20R 30R 40R 50R Type of aggregate 0N30 1N30 3N30 5N30 0 100 200 300 400 500 600 700 Tensilestrength(psi) 20R 30R 40R 50R Type of aggregate 0N60 1N6O 3N60 5N60
  • 66. 66 Fig 4.2.3: Tensile Strength Vs. Types of Aggregate used in Concrete Cured for 90 Days 0 100 200 300 400 500 600 700 Tensilestrength(psi) 20R 30R 40R 50R Type of aggregate 0N90 1N90 3N90 5N90 0 100 200 300 400 500 600 700 800 Tensilestrength(psi) 20R 30R 40R 50R Type of aggregate 0N180 1N180 3N180 5N180
  • 67. 67 Fig 4.2.4: Tensile Strength Vs. Types of Aggregate used in Concrete Cured for 180 Day Fig 4.2.5: Tensile Strength Vs. Concentration of Curing Water for Concrete Cured for 30 Days Fig 4.2.6: Tensile Strength Vs. Concentration of Curing Water for Concrete Cured for 60 Days 0 100 200 300 400 500 600 700 0 1 2 3 4 5 6 Tensilestrength(psi) Concentration of curing water (N) 20R30 30R30 40R30 50R30 0 100 200 300 400 500 600 700 0 1 2 3 4 5 6 Tensilestrength(psi) Concentration of curing water (N) 20R60 30R60 40R60 50R60
  • 68. 68 Fig 4.2.7: Tensile Strength Vs. Concentration of Curing Water for Concrete Cured for 90 Days 0 100 200 300 400 500 600 700 0 1 2 3 4 5 6 Tensilestrength(psi) Concentration of curing water (N) 20R90 30R90 40R90 50R90 0 100 200 300 400 500 600 700 800 0 1 2 3 4 5 6 Tensilestrength(psi) Concentration of curing water (N) 20R120 30R120 40R120 50R120
  • 69. 69 Fig 4.2.8: Tensile Strength Vs. Concentration of Curing Water for Concrete Cured for 180 Days Fig 4.2.9: Tensile Strength Vs. Curing Period for Concrete cured in Normal Water 0 100 200 300 400 500 600 700 800 0 30 60 90 120 150 180 210 Tensilestrength(psi) Curing period (Days) 20R0 30R0 40R0 50R0 0 100 200 300 400 500 600 700 800 0 30 60 90 120 150 180 210 Tensilestrength(psi) Curing period (Days) 20R1 30R1 40R1 50R1
  • 70. 70 Fig 4.2.10 :Tensile Strength Vs. Curing Period for Concrete cured in Saline Water having concentration of 1N. Fig 4.2.11: Tensile Strength Vs. Curing Period for Concrete cured in Saline Water having concentration of 3N. 0 100 200 300 400 500 600 700 0 30 60 90 120 150 180 210 Tensilestrength(psi) Curing period (Days) 20R3 30R3 40R3 50R3 0 100 200 300 400 500 600 0 30 60 90 120 150 180 210 Tensilestrength(psi) Curing period (Days) 20R5 30R5 40R5 50R5
  • 71. 71 Fig 4.2.12: Tensile Strength Vs. Curing Period for Concrete cured in Saline Water having concentration of 5N Fig 4.3.1: Percentage in change in volume vs. Curing periods having concentration 3N 0 0.2 0.4 0.6 0.8 1 1.2 0 30 60 90 120 150 180 Changeinvolume(%) Curing periods (day) 20R3 30R3 40R3 50R3
  • 72. 72 Fig 4.3.2: Percentage in change in volume vs. Curing periods having concentration 5N Fig 4.4.1: Variation of pH with Depth (20% Recycled) 0 0.2 0.4 0.6 0.8 1 1.2 0 30 60 90 120 150 180 Changeinvolume(%) Curing periods (day) 20R5 30R5 40R5 50R5 13 13.15 13.3 13.45 0 15 25 pH Depth (mm) PH Vs. DEPTH (30 DAYS) 20R0 20R1 20R3 20R5
  • 73. 73 Fig 4.4.2: Variation of pH with Depth (30% Recycled) Fig 4.4.3: Variation of pH with Depth (40% Recycled Fig 4.4.4: Variation of pH with Depth (50% Recycled) 13.3 13.35 13.4 13.45 0 15 25 pH Depth (mm) PH Vs. DEPTH (30 DAYS) 30R0 30R1 30R3 30R5 13.2 13.3 13.4 13.5 0 15 25 pH Depth (mm) PH Vs. DEPTH (30 DAYS) 40R0 40R1 40R3 40R5 13.2 13.3 13.4 13.5 13.6 0 15 25 pH Depth (mm) PH Vs. DEPTH (30 DAYS) 50R0 50R1 50R3 50R5
  • 74. 74 Fig 4.4.5: Variation of pH with Depth (20% Recycled) Fig 4.4.6: Variation of pH with Depth (30% Recycled) Fig 4.4.7: Variation of pH with Depth (40% Recycled) 13 13.1 13.2 13.3 13.4 13.5 0 15 25 pH Depth (mm) PH Vs. DEPTH (60 DAYS) 20R0 20R1 20R3 20R5 13.3 13.35 13.4 13.45 13.5 13.55 0 15 25 pH Depth (mm) PH Vs. DEPTH (60 DAYS) 30R0 30R1 30R3 30R5 13.3 13.35 13.4 13.45 13.5 0 15 25 pH Depth (mm) PH Vs. DEPTH (60 DAYS) 40R0 40R1 40R3 40R5
  • 75. 75 Fig 4.4.8: Variation of pH with Depth (50% Recycled) Fig 4.4.9: Variation of pH with Depth (20% Recycled) Fig 4.4.10: Variation of pH with Depth (30% Recycled) 13.2 13.3 13.4 13.5 13.6 0 15 25 pH Depth (mm) PH Vs. DEPTH (60 DAYS) 50R0 50R1 50R3 50R5 13 13.15 13.3 13.45 13.6 0 15 25 pH Depth (mm) PH Vs. DEPTH (90 DAYS) 20R0 20R1 20R3 20R5 13 13.15 13.3 13.45 13.6 0 15 25 pH Depth (mm) PH Vs. DEPTH (90 DAYS) 30R0 30R1 30R3 30R5
  • 76. 76 Fig 4.4.11: Variation of pH with Depth (40% Recycled) Fig 4.4.12: Variation of pH with Depth (50% Recycled) Fig 4.4.13: Variation of pH with Depth (20% Recycled) 13 13.15 13.3 13.45 13.6 0 15 25 pH Depth (mm) PH Vs. DEPTH (90 DAYS) 40R0 40R1 40R3 40R5 13.1 13.2 13.3 13.4 13.5 0 15 25 pH Depth (mm) PH Vs. DEPTH (90 DAYS) 50R0 50R1 50R3 50R5 13.1 13.3 13.5 13.7 0 15 25 pH Depth (mm) PH Vs. DEPTH (180 DAYS) 2OR0 20R1 20R3 20R5
  • 77. 77 Fig 4.4.14: Variation of pH with Depth (30% Recycled) Fig 4.4.15: Variation of pH with Depth (40% Recycled) Fig 4.4.16: Variation of pH with Depth (50% Recycled) 13.1 13.25 13.4 13.55 13.7 0 15 25 pH Depth (mm) PH Vs. DEPTH (180 DAYS) 30R0 30R1 30R3 30R5 13.1 13.25 13.4 13.55 13.7 0 15 25 pH Depth (mm) PH Vs. DEPTH (180 DAYS) 40R0 40R1 40R3 40R5 13.1 13.3 13.5 13.7 0 15 25 pH Depth (mm) PH Vs. DEPTH (180 DAYS) 50R0 50R1 50R3 50R5
  • 78. 78 Fig 4.4.17: Variation of pH with Depth (0N) Fig 4.4.18: Variation of pH with Depth (0N) 13.2 13.3 13.4 13.5 0 15 25 pH Depth (mm) PH Vs. DEPTH (20R0) 30 Day 60 Day 90 Day 180Day 13.25 13.35 13.45 13.55 0 15 25 pH Depth (mm) PH Vs. DEPTH (30R0) 30 Day 60 Day 90 Day 180Day 13.2 13.3 13.4 13.5 13.6 13.7 0 15 25 pH Depth (mm) PH Vs. DEPTH (40R0) 30 Day 60 Day 90 Day 180Day
  • 79. 79 Fig 4.4.19: Variation of pH with Depth (0N) Fig 4.4.20: Variation of pH with Depth (0N) Fig 4.4.21: Variation of pH with Depth (1N) 13.1 13.25 13.4 13.55 13.7 0 15 25 pH Depth (mm) PH Vs. DEPTH (50R0) 30 Day 60 Day 90 Day 180Day 13.1 13.25 13.4 13.55 13.7 0 15 25 pH Depth (mm) PH Vs. DEPTH (20R1) 30 Day 60 Day 90 Day 180Day 13 13.15 13.3 13.45 13.6 0 15 25 pH Depth (mm) PH Vs. DEPTH (30R1) 30 Day 60 Day 90 Day 180Day
  • 80. 80 Fig 4.4.22: Variation of pH with Depth (1N) Fig 4.4.23: Variation of pH with Depth (1N) Fig 4.4.24: Variation of pH with Depth (1N) 13.1 13.25 13.4 13.55 13.7 0 15 25 pH Depth (mm) PH Vs. DEPTH (40R1) 30 Day 60 Day 90 Day 180Day 13.1 13.3 13.5 13.7 0 15 25 pH Depth (mm) PH Vs. DEPTH (50R1) 30 Day 60 Day 90 Day 180Day 12.8 13 13.2 13.4 13.6 13.8 0 15 25 pH Depth (mm) PH Vs. DEPTH (20R3) 30 Day 60 Day 90 Day 180Day
  • 81. 81 Fig 4.4.25: Variation of pH with Depth (3N) Fig 4.4.26: Variation of pH with Depth (3N) Fig 4.4.27: Variation of pH with Depth (3N) 12.9 13.1 13.3 13.5 13.7 0 15 25 pH Depth (mm) PH Vs. DEPTH (30R3) 30 Day 60 Day 90 Day 180Day 12.8 13 13.2 13.4 13.6 13.8 0 15 25 pH Depth (mm) PH Vs. DEPTH (40R3) 30 Day 60 Day 90 Day 180Day 13 13.15 13.3 13.45 13.6 13.75 0 15 25 pH Depth (mm) PH Vs. DEPTH (50R3) 30 Day 60 Day 90 Day 180Day
  • 82. 82 Fig 4.4.28: Variation of pH with Depth (3N) Fig 4.4.29: Variation of pH with Depth (5N) Fig 4.4.30: Variation of pH with Depth (5N) 13 13.15 13.3 13.45 13.6 0 15 25 pH Depth (mm) PH Vs. DEPTH (20R5) 30 Day 60 Day 90 Day 180Day 13.1 13.2 13.3 13.4 13.5 13.6 0 15 25 pH Depth (mm) PH Vs. DEPTH (30R5) 30 Day 60 Day 90 Day 180Day 13.2 13.3 13.4 13.5 0 15 25 pH Depth (mm) PH Vs. DEPTH (40R5) 30 Day 60 Day 90 Day 180Day
  • 83. 83 Fig 4.4.31: Variation of pH with Depth (5N) Fig 4.4.32: Variation of pH with Depth (5N) Fig 4.5.1: Variation of percentage of chloride content with Depth (20% Recycled) 13.1 13.25 13.4 13.55 0 15 25 pH Depth (mm) PH Vs. DEPTH (50R5) 30 Day 60 Day 90 Day 180Day 0.000 0.020 0.040 0.060 0.080 0.100 0.120 0 15 25 Chloride(%) Depth (mm) PERCENTAGE OF CHLORIDE CONTENT Vs.DEPTH (30 DAYS) 20R5 20R3 20R1
  • 84. 84 Fig 4.5.2: Variation of percentage of chloride content with Depth (50% Recycled) Fig 4.5.3: Variation of percentage of chloride content with Depth (40% Recycled Fig 4.5.4: Variation of percentage of chloride content with Depth (30% Recycled) 0.000 0.050 0.100 0.150 0.200 0 15 25 Chloride(%) Depth (mm) PERCENTAGE OF CHLORIDE CONTENT Vs.DEPTH (30 DAYS) 50R5 50R3 50R1 0.000 0.020 0.040 0.060 0.080 0.100 0.120 0.140 0 15 25 Chloride(%) Depth (mm) PERCENTAGE OF CHLORIDE CONTENT Vs.DEPTH (30 DAYS) 40R5 40R3 40R1 0.000 0.020 0.040 0.060 0.080 0.100 0.120 0.140 0 15 25 Chloride(%) Depth (mm) PERCENTAGE OF CHLORIDE CONTENT Vs.DEPTH (30 DAYS) 30R5 30R3 30R1
  • 85. 85 Fig 4.5.5: Variation of percentage of chloride content with Depth (20% Recycled) Fig 4.5.6: Variation of percentage of chloride content with Depth (30% Recycled) Fig 4.5.7: Variation of percentage of chloride content with Depth (40% Recycled) 0.000 0.020 0.040 0.060 0.080 0.100 0.120 0.140 0 15 25 Chloride(%) Depth (mm) PERCENTAGE OF CHLORIDE CONTENT Vs.DEPTH (60 DAYS) 20R5 20R3 20R1 0.000 0.020 0.040 0.060 0.080 0.100 0.120 0.140 0 15 25 Chloride(%) Depth (mm) PERCENTAGE OF CHLORIDE CONTENT Vs.DEPTH (60 DAYS) 30R5 30R3 30R1 0.000 0.020 0.040 0.060 0.080 0.100 0.120 0.140 0.160 0 15 25 Chloride(%) Depth (mm) PERCENTAGE OF CHLORIDE CONTENT Vs.DEPTH (60 DAYS) 40R5 40R3 40R1
  • 86. 86 Fig 4.5.8: Variation of percentage of chloride content with Depth (50% Recycled) Fig 4.5.9: Variation of percentage of chloride content with Depth (20% Recycled) Fig 4.5.10: Variation of percentage of chloride content with Depth (30% Recycled) 0.000 0.050 0.100 0.150 0.200 0 15 25 Chloride(%) Depth (mm) PERCENTAGE OF CHLORIDE CONTENT Vs.DEPTH (60 DAYS) 50R5 50R3 50R1 0.000 0.050 0.100 0.150 0 15 25 Chloride(%) Depth (mm) PERCENTAGE OF CHLORIDE CONTENT Vs.DEPTH (90 DAYS) 20R5 20R3 20R1 0.000 0.020 0.040 0.060 0.080 0.100 0.120 0.140 0.160 0 15 25 Chloride(%) Depth (mm) PERCENTAGE OF CHLORIDE CONTENT Vs.DEPTH (90 DAYS) 30R5 30R3 30R1
  • 87. 87 Fig 4.5.11: Variation of percentage of chloride content with Depth (40% Recycled) Fig 4.5.12: Variation of percentage of chloride content with Depth (50% Recycled) Fig 4.5.13: Variation of percentage of chloride content with Depth (20% Recycled) 0.000 0.050 0.100 0.150 0.200 0 15 25 Chloride(%) Depth (mm) PERCENTAGE OF CHLORIDE CONTENT Vs.DEPTH (90 DAYS) 40R5 40R3 40R1 0.000 0.050 0.100 0.150 0.200 0 15 25 Chloride(%) Depth (mm) PERCENTAGE OF CHLORIDE CONTENT Vs.DEPTH (90 DAYS) 50R5 50R3 50R1 0.000 0.050 0.100 0.150 0.200 0 15 25 Chloride(%) Depth (mm) PERCENTAGE OF CHLORIDE CONTENT Vs.DEPTH (180 DAYS) 20R5 20R3 20R1
  • 88. 88 Fig 4.5.14: Variation of percentage of chloride content with Depth (30% Recycled) Fig 4.5.15: Variation of percentage of chloride content with Depth (40% Recycled) Fig 4.5.16: Variation of percentage of chloride content with Depth (50% Recycled) 0.000 0.050 0.100 0.150 0.200 0 15 25 Chloride(%) Depth (mm) PERCENTAGE OF CHLORIDE CONTENT Vs.DEPTH (180 DAYS) 30R5 30R3 30R1 0.000 0.050 0.100 0.150 0.200 0 15 25 Chloride(%) Depth (mm) PERCENTAGE OF CHLORIDE CONTENT Vs.DEPTH (180 DAYS) 40R5 40R3 40R1 0.000 0.050 0.100 0.150 0.200 0 15 25 Chloride(%) Depth (mm) PERCENTAGE OF CHLORIDE CONTENT Vs.DEPTH (180 DAYS) 50R5 50R3 50R1
  • 89. 89
  • 90. 90 CHAPTER 5 CONCLUSION AND RECOMMENDATION 5.1 GENAREL One of the most important factors for gaining desired strength of concrete is curing water .Generally the curing water should be potable and vital to gain required strength. From this point of view it is clear that plain and salinity free water is most beneficial in gaining strength. But at the same time huge amount of demolished concrete are wasted nowadays .If this demolished concrete are used as recycled aggregate in recycled concrete and those recycled concrete are exposed around marine environment then the behavior pattern of strength under such condition will help in investigate that whether recycled aggregate using in marine structures are feasible or not. The experimental investigation shows that strength of recycled of concrete reduced tremendously when cured and exposed in high saline water. But the strength of recycled concrete with optimum of recycled aggregate cured in low saline water or plain water gives a rational and considerable strength which may be a little beneficial in construction of marine structures.
  • 91. 91 5.2 CONCLUSION AND DISCUSSION  20% replacement of recycled aggregate leads to a better performance in plain water and the worst case is 50% replacement of recycled aggregate having salinity of curing water 5N  With the increase of percentage of recycled aggregate the durability related properties show lower performance.  The deterioration of RAC increases with time having higher concentration of sea water.  The change in volume of RAC shows higher percentage of change in volume (0.93) at 50% replacement of RA having curing period 180 days.  pH value increase proportionally with depth and decreases with salinity of water. Maximum pH is observed as 13.7 at 25mm depth cured in 1N saline water.  As the depth increases percentage of chloride content decreases. Maximum percentage of chloride content is observed 0.073 at surface for 180 days curing period of 50% replacement of RA and Minimum percentage of chloride content reported as 0.018 at 25mm depth cured in 1N.
  • 92. 92 5.3 RECOMMENDATION After completing the investigation work here are some of the recommendation for using recycled concrete in marine construction and for further research on this sector.  Curing with sea water must be avoided as much as possible for both ordinary and recycled concrete.  Desired strength gaining by recycled concrete in marine structure is only possible when optimum percentage of recycled aggregates (which has lesser decrement in relative percentage of strength gained within allowable limits vary from 5-10% with curing periods) will be used and when it will be cured in plain water somehow.  More variety of the percentage of recycled aggregates such as 25%,35%,45% may be used for further extensive investigation on the behavior of durability of recycled concrete.  The concept of pre curing in plain water before exposed to saline water can be introduced and further investigation with various pre curing periods can be carried on to determine the improvement of the compressive strength of recycled concrete.  The research can be carried out for longer curing periods to know about the deterioration of concrete in marine environment.  More various concentration of sea water may be used to find more definite conclusion about the investigation.
  • 93. 93  Different types of strength gaining reagent and admixtures can be used to increase the strength of recycled concrete in marine environment. But at first the behavior pattern of compressive strength must be investigated after adding those admixtures.
  • 94. 94 REFERENCES  Aziz, M.A, Engineering materials,1st edition,revised,August 1995,Dhaka,Bangladesh.  G. Arlindo, E. Ana, & V. Manuel., Influence of recycled aggregate concrete on concrete durability, November 2004, National Laboratory of Civil Engineering, Portugal.  Islam et al., An experimental study on the behavior of reinforced concrete in marine environment ,Undergraduate Thesis, September 2003, Department of Civil Engineering, Chittagong University of Engineering and Technology, Chittagong, Bangladesh.  Nevile, A.M .,Properties of concrete, 3rd edition,1981,U.K.  SOMERVILLE, G., —Whole life design for durability and sustainability. Where are we going, and how do we get there?", Concrete Durability and Repair Technology, Proceedings of International Congress —Creating with Concrete", Ed. R.K. Dhir and M.J. McCarty, Dundee, September 1999.  Shetty, M.S., Concrete technology, 2nd edition,1986,India.  Topcu, I. B. (1997). "Physical and Mechanical Properties of Concretes Produced With Waste Concrete". Cement and Concrete Research, vol 27, pp 1817-1823.
  • 95. 95 APPENDICES PREPARATION OF NaCl SOLUTION: 1N =2.5 kg. NaCl in 100 kg of water (Equivalent weight of NaCl is 58.5.) =2.5 kg. NaCl in 100×2.202 lb. of water =2.5 kg. NaCl in 100×2.202÷62.45 ft3 of water =2.5 kg. NaCl in 3.526 ft3 of water =0.709 kg. NaCl in 1 ft3 of water So, 1N saline water =0.709 kg. NaCl in 1 ft3 of water 3N saline water =2.127 kg. NaCl in 1 ft3 of water 5N saline water =3.545 kg. NaCl in 1 ft3 of water