1. Course 3, Lesson 9-4
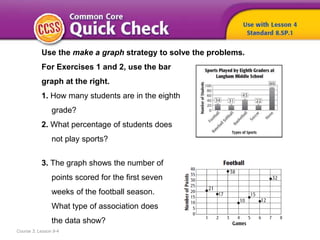
Use the make a graph strategy to solve the problems.
For Exercises 1 and 2, use the bar
graph at the right.
1. How many students are in the eighth
grade?
2. What percentage of students does
not play sports?
3. The graph shows the number of
points scored for the first seven
weeks of the football season.
What type of association does
the data show?
2. Course 3, Lesson 9-4
ANSWERS
1. 219 students
2. 40.6%
3. no association
3. HOW are patterns used
when comparing two quantities?
Statistics and Probability
Course 3, Lesson 9-4
6. To
• describe univariate data using
measures of center,
• measure quantitative data using
a five-number summary
Course 3, Lesson 9-4 .
Statistics and Probability
7. • univariate data
• quantitative data
• five-number summary
Course 3, Lesson 9-4
Statistics and Probability
8. 1
Need Another Example?
2
3
4
Step-by-Step Example
1. The ages, in years, of the people seated in one row of a movie theater
are 16, 15, 24, 33, 30, 56, 19, and 19. Find the mean, median, mode, and
range of the data set.
Mean
The mode is 19, since it is the number that occurs most often.
Arrange in order from least to greatest.Median 15, 16, 19, 19, 24, 30, 33, 56
Mode
56 – 15 = 41Range
9. Answer
Need Another Example?
The ages, in years, of the actors in a play are
5, 16, 32, 15, 26, and 32. Find the mean, median,
mode, and range of the data set.
mean: 21; median: 21; mode: 32; range: 27
10. 1
Need Another Example?
2
3
5
Step-by-Step Example
2. The data for daily average temperatures for
15 days in May are shown in the table.
a. Find the five-number summary of the data.
b. Draw a box plot of the data.
b.
68 69 70 71 72 72 73 74 75 75 75 75 76 76 76
minimum
Draw the box plot and assign a title to the graph.
Daily Temperatures
a. Write the data from least to greatest.
first quartile median third quartile maximum
Draw a number line that includes the least and greatest numbers in the data.
Mark the minimum and maximum values, the median, and the first and third
quartiles above the number line.
4
11. Answer
Need Another Example?
Find the five-number
summary of the data.
Draw a box plot of
the data.
minimum: 39.1; Q 1 : 59.25; median: 74.1;
Q 3 : 81.4; maximum: 95.5
12. How did what you learned
today help you answer the
How are patterns used
when comparing two quantities?
Course 3, Lesson 9-4
GeometryStatistics and Probability
13. How did what you learned
today help you answer the
How are patterns used
when comparing two quantities?
Course 3, Lesson 9-4
GeometryStatistics and Probability
Sample answers:
• You can find the five-number summary of a set of
univariate data.
• Using the five-number summary, you can construct and
analyze a box plot of the data.
14. Write a set of directions for
finding mean, median, mode,
and range for a data set.
Course 3, Lesson 9-4
Ratios and Proportional RelationshipsFunctionsStatistics and Probability