1. DIPLOMA IN BUSINESS ADMINISTRATION
MICROECONOMICS
BECO 0101
Tutorial 1
CANDIDATE
NAME
SECTION A- Multiple Choice Questions
1. What is the main economic problem facing by the societies?
A. How to reduce poverty
B. How to allocate scarce resources
C. How to reduce unemployment rate
D. How to control inflation
2. To an household, the problem of scarcity is seen as
A. unlimited income but limited wants
B. unlimited income but unlimited wants
C. limited income but limited wants
D. limited income but unlimited wants
3. Land, labour, capital and entrepreneurship are classified as
A. factors of quality
B. factors of production
C. factors of quality of resources
D. factors of resources
4. Which of the following belongs to the factor of production ‘capital’
A. river for the farmer
B. the ability to read and write
C. money
D. a pair of scissors for the tailor
5. Opportunity cost is best defined as
A. the monetary price of any productive resource
B. the amount of labour that must be used to produce one unit of any product
C. the ratio of the price of imported goods to the prices of the exported goods
D. the amount of one product that must be given up to product one more unit of
another product
6. Alex decides to stay in his room to do some works rather than going to play the
bowling.
What is the opportunity cost of his decision?
A. The enjoyment he would have derived from a visit to the bowling
B. The improvement in the mark he obtains for his assignment
C. The cost of the extra electricity he uses
D. The money he would have spent in the bowling
2. 2
7. The production possibilities curve shows:
A. the various combinations of two goods that can be produced when society uses
its scarce resources efficiently.
B. the minimum outputs of two goods that will sustain a society.
C. the various combinations of two goods that can be produced when some
resources are unemployed.
D. the ideal, but unattainable, combinations of two goods that would maximize
consumer satisfactions.
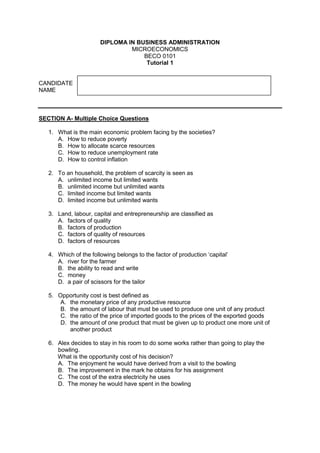
8. The diagram shows a production possibility curve CC.
Products Y
C
Z
D
Y
0
D C Products X
What might cause the curve to shift to DD?
A. Technological progress
B. An economic growth
C. The depletion of natural resources
D. A reallocation of resources
9. Point Y and Z in the diagram above refers to:
A. Full employment
B. Unemployment and scarcity
C. Unemployment and choice
D. Full employment and unemployment
10. We have to make choices because:
A. we have unlimited income.
B. resources are scarce.
C. choices involve a trade-off.
D. of both b and c.
11. Which is a normative statement?
A. The inflation rate in 2010 was 2.8%
B. The government should cut he fuel tax to reduce the rate of inflation
C. A fall in supply of petrol will lead to an increase in its price
D. An increase in taxation on cigarettes will result in fewer cigarettes being sold
12. Which of the following is a positive statement?
A. Economics is concerned with using scarce resources efficiently to satisfy
society’s material wants.
B. Economics should be concerned with how to use scarce resources efficiently to
satisfy society’s material wants.
C. It is more beneficial to divide the studies of economics into positive economics
and normative economics.
D. It is not necessary to divide the studies of economics into microeconomics and
macroeconomics.
2
3. 3
13. What is meant by the ceteris paribus?
A. An assumption that is not supported by the facts
B. An assumption that consumers act rationally
C. An assumption that two factors are in equilibrium
D. An assumption that other factors are held constant
14. In the mixed economy
A. Economic questions are solved by government
B. Economic decisions are made by the private sector and free market
C. Economic allocation is achieved by the invisible hand
D. Economic problems are solved by government and market
15. In a command economy, all decision making is done by
A. consumers
B. producers
C. the government
D. voters
SECTION B: Answer all the questions.
1. Atlantis is a small island in the South Atlantic. The inhabitants grow potatoes and catch
fish. The accompanying table shows the maximum annual output combinations of
potatoes and fish that can be produced.
Option Potatoes (pounds) Fish (pounds)
A 1,000 0
B 800 300
C 600 500
D 400 600
E 200 650
F 0 675 0
a) Define ‘Production Possibility Curve (PPC)’ [3M]
b) Based on above data, draw a production possibility curve with potatoes on the horizontal
axis and fish on the vertical axis, showing points A–F. [4M]
c) Can Atlantis produce 500 pounds of fish and 800 pounds of potatoes? Explain. Where
would this point lie relative to the production possibility curve? [2M]
d) Explain opportunity cost. [2M]
e) What is the opportunity cost of increasing the annual output of potatoes from 600 to 800
pounds? [1M]
f) What is the opportunity cost of increasing the annual output of potatoes from 200 to 400
pounds? [1M]
g) Can you explain why the answers to parts c and d are not the same? What does this
imply about the slope of the production possibility curve? [2M]
h) Sketch a new PPC with constant opportunity cost and indicate on the PPC the following:-
Point X - Unemployment [1M]
Point Y – Full employment [1M]
Point Z – Scarcity [1M]
i) State 2 factors that can shift the PPC of a country outward [2M]
3
4. 4
Answer
Section B
Question 1
a) Define ‘Production Possibility Curve (PPC)’ [3M]
Production Possibility curve (PPC) shows the maximum combinations of 2 products
that can be produced by a country [1] with available resources and technology [1]
A country can produce any quantity on the PPC or below the PPC but not outside
the PPC [1]
Any point of production inside the PPC is inefficient, any point outside the ppc is
unattainable [1]
There are 2 type of PPC- Concave shaped and straight-line [1]
Concave-shaped reflects the increasing opportunity cost and Straight-line shows
constant opportunity cost [1]
b) Based on above data, draw a production possibility curve with potatoes on the horizontal
axis and fish on the vertical axis, showing points A–F. [4M]
c) Can Atlantis produce 500 pounds of fish and 800 pounds of potatoes? Explain. Where
would this point lie relative to the production possibility curve? [2M]
No, Atlantis cannot produce 500 pounds of fish and 800 pounds of potatoes.[1]
If it produces 500 pounds of fish, the most potatoes it can produce is 600 pounds.[1]
This point would lie outside the production possibility frontier, at point G on the
diagram.[1]
d) Explain opportunity cost. [2M]
Opportunity cost is the next best alternative that has to be foregone. It is what we
gave up to get what we did. [1]
For example, you only have RM 20.00, you could buy either a new T-Shirt or a pair
of shoes. If T- Shirt is chosen the opportunity cost is the Pair of shoes that given
up.[1]
4
5. 5
e) What is the opportunity cost of increasing the annual output of potatoes from 600 to 800
pounds? [1M]
The opportunity cost of increasing output from 600 to 800 pounds of potatoes is 200
pounds of fish.( 500 pounds-300 pounds) [1]
f) What is the opportunity cost of increasing the annual output of potatoes from 200 to 400
pounds? [1M]
The opportunity cost of increasing output from 200 to 400 pounds of potatoes is 50
pounds of fish. (650 pounds - 600 pounds)[1]
g) Can you explain why the answers to parts c and d are not the same? What does this
imply about the slope of the production possibility curve? [2M]
The answers to parts c and d imply that the more potatoes Atlantis produces, the
higher the opportunity cost becomes.[1]
For instance, as you grow more and more potatoes, you have to use less and less
suitable land to do so[1]
As a result, you have to divert increasingly more resources away from fishing as you
grow more potatoes.[1]
h) Sketch a new PPC with constant opportunity cost and indicate on the PPC the following:-
Point X - Unemployment [1M]
Point Y – Full employment [1M]
Point Z – Scarcity [1M]
TV
Z
Y
Y
X
0 Food
i) State 2 factors that can shift the PPC of a country outward
Technology advancement [1]
Found new resources [1]
5