Gun violence prevention
practices among local police
in the United States
Christopher S. Koper
Department of Criminology, Law and Society, George Mason University,
Fairfax, Virginia, USA, and
Daniel J. Woods and Bruce E. Kubu
Police Executive Research Forum, Washington, District of Columbia, USA
Abstract
Purpose – The purpose of the study is to examine gun violence prevention practices among urban
police in the USA, assessing their scope, effectiveness, limitations, and impacts.
Design/methodology/approach – A national survey was conducted with police agencies serving
cities of 100,000 or more people.
Findings – Strategies used most frequently and rated as most effective include targeted efforts
focussed on high-risk places and groups, as well as multi-agency problem-solving efforts, particularly
those involving federal authorities. However, most agencies make limited use of proactive strategies to
reduce gun crime, and there are substantial gaps in the enforcement of many gun laws. Results also
suggest that gun crime is lower in places where police engage in more intensive gun-related
enforcement and prevention efforts.
Research limitations/implications – The survey focussed only on large US cities. Implementation
of the strategies could not be examined in detail, and assessments of the effectiveness of strategies
reflect the views of practitioners. There is a need for more in-depth research on gun-related
enforcement and prevention practices, their effectiveness, and the organizational and environmental
factors that facilitate or hinder them.
Practical implications – The study highlights strategies that should be given priority consideration
in policy decisions. The findings also suggest that police efforts to address gun crime can be enhanced
considerably – and that doing so may produce demonstrable reductions in gun crime. Further
examination of policy changes necessary to facilitate these efforts is warranted.
Originality/value – This study represents the first national survey of gun violence reduction efforts
by police in the USA.
Keywords Police, Firearms, Violence, Enforcement, Prevention, National, Survey, Urban,
Effectiveness, USA
Paper type Research paper
Introduction
Controlling gun crime continues to be a difficult challenge for policymakers and
practitioners in the USA. In 2010, there were nearly 10,000 murders with firearms in
the USA[1] and another 3,38,000 non-fatal violent crimes with guns (Truman, 2011).
The current issue and full text archive of this journal is available at
www.emeraldinsight.com/1363-951X.htm
Received 18 June 2012
Revised 25 September 2012
29 October 2012
Accepted 1 November 2012
Policing: An International Journal of
Police Strategies & Management
Vol. 36 No. 3, 2013
pp. 577-603
r Emerald Group Publishing Limited
1363-951X
DOI 10.1108/PIJPSM-06-2012-0052
This research was supported by funding from the Joyce Foundation and the Motorola
Foundation (the authors thank Chuck Wexler of the Polic ...
Gun violence preventionpractices among local policein th.docx
1. Gun violence prevention
practices among local police
in the United States
Christopher S. Koper
Department of Criminology, Law and Society, George Mason
University,
Fairfax, Virginia, USA, and
Daniel J. Woods and Bruce E. Kubu
Police Executive Research Forum, Washington, District of
Columbia, USA
Abstract
Purpose – The purpose of the study is to examine gun violence
prevention practices among urban
police in the USA, assessing their scope, effectiveness,
limitations, and impacts.
Design/methodology/approach – A national survey was
conducted with police agencies serving
cities of 100,000 or more people.
Findings – Strategies used most frequently and rated as most
effective include targeted efforts
focussed on high-risk places and groups, as well as multi-
agency problem-solving efforts, particularly
those involving federal authorities. However, most agencies
make limited use of proactive strategies to
reduce gun crime, and there are substantial gaps in the
enforcement of many gun laws. Results also
suggest that gun crime is lower in places where police engage in
2. more intensive gun-related
enforcement and prevention efforts.
Research limitations/implications – The survey focussed only
on large US cities. Implementation
of the strategies could not be examined in detail, and
assessments of the effectiveness of strategies
reflect the views of practitioners. There is a need for more in-
depth research on gun-related
enforcement and prevention practices, their effectiveness, and
the organizational and environmental
factors that facilitate or hinder them.
Practical implications – The study highlights strategies that
should be given priority consideration
in policy decisions. The findings also suggest that police efforts
to address gun crime can be enhanced
considerably – and that doing so may produce demonstrable
reductions in gun crime. Further
examination of policy changes necessary to facilitate these
efforts is warranted.
Originality/value – This study represents the first national
survey of gun violence reduction efforts
by police in the USA.
Keywords Police, Firearms, Violence, Enforcement, Prevention,
National, Survey, Urban,
Effectiveness, USA
Paper type Research paper
Introduction
Controlling gun crime continues to be a difficult challenge for
policymakers and
practitioners in the USA. In 2010, there were nearly 10,000
murders with firearms in
the USA[1] and another 3,38,000 non-fatal violent crimes with
guns (Truman, 2011).
3. The current issue and full text archive of this journal is
available at
www.emeraldinsight.com/1363-951X.htm
Received 18 June 2012
Revised 25 September 2012
29 October 2012
Accepted 1 November 2012
Policing: An International Journal of
Police Strategies & Management
Vol. 36 No. 3, 2013
pp. 577-603
r Emerald Group Publishing Limited
1363-951X
DOI 10.1108/PIJPSM-06-2012-0052
This research was supported by funding from the Joyce
Foundation and the Motorola
Foundation (the authors thank Chuck Wexler of the Police
Executive Research Forum for making
the latter funding available to support the study). The authors
thank Jacob Berman and Nathan
Ballard for additional assistance with data collection and
analysis. The authors also thank Nina
Vinik, Heath Grant, and Chuck Wexler for comments on an
earlier version of this manuscript.
The views expressed here are those of the authors and do not
represent the views of any of the
aforementioned persons or organizations.
4. 577
Gun violence
prevention
practices
The prevalence of guns is thought to contribute to particularly
high levels of homicide
in the USA (e.g. Hoskins, 2001; Zimring and Hawkins, 1997),
where some estimates
imply that the total costs of gun violence – including medical,
criminal justice, and
other costs – could be well over $100 billion per year
(calculated from Cohen et al., 2004;
Cook and Ludwig, 2000).
Yet finding common ground for legislative solutions to this
problem is quite
difficult, making it especially critical to effectively enforce
existing laws and utilize
other prevention approaches. Indeed, debates on controlling
firearms violence often
revolve around whether the nation needs tougher gun laws or
better enforcement of
laws that already exist. However, these debates are not well
informed by systematic
information on what law enforcement agencies are doing to
reduce gun violence,
the success of those efforts, and the factors that facilitate or
hinder those efforts. To
address these gaps, this paper presents results from a national
survey of gun violence
prevention efforts by local police in urban US jurisdictions. The
5. study describes
the range, scope, prevalence, and limitations of police efforts to
reduce gun violence,
and offers some preliminary assessments of the effectiveness
and impacts of
these practices.
Background: police and gun crime
Police typically handle gun crimes reactively, investigating
violent gun crimes and
making arrests for illegal possession or carrying when they
encounter violations
during routine activities (e.g. answering calls for service and
making traffic stops).
To varying degrees, police also use proactive strategies to
emphasize a focus on gun
crime. These include disrupting the illegal supply of firearms,
reducing illegal gun
possession and carrying, targeting known gun offenders and
others at high risk for
gun violence, undertaking educational and preventive activities,
and collaborating
with other criminal justice, government, and community
organizations on initiatives
that combine enforcement, prosecutorial, and prevention
elements (e.g. see Office of
Juvenile Justice and Delinquency Prevention (OJJDP), 1999).
However, despite efforts to promote many of these practices
among US police (e.g.
International Association of Chiefs of Police (IACP), 2008,
2011; OJJDP, 1999), relatively
little is known about how widely police use these various
strategies or about the
outcomes of these efforts. What is known of police efforts to
reduce gun violence is
6. largely anecdotal, based on descriptions or evaluations of
strategies in a relatively
small number of jurisdictions (e.g. Braga et al., 2001; Brill,
1977; Center to Prevent
Handgun Violence, 1998; Dunworth, 2000; Koper and Mayo-
Wilson, 2006; OJJDP, 1999).
Evidence suggests that there are substantial differences across
jurisdictions in the
intensity of gun enforcement and prevention efforts (e.g. Brill,
1977; Sherman and
Bridgeforth, 1994). However, there has been no systematic
research to examine the
range, scope, and prevalence of police efforts to reduce gun
violence across the nation.
Further, little is known about the effectiveness of many police
strategies to reduce
gun crime or whether levels of police enforcement and
prevention effort are related to
rates of gun crime.
Overall, available evidence suggests that police efforts targeted
on high-risk places,
behaviors, and actors are effective, particularly when conducted
in the context of
multi-agency problem-solving efforts. For example, crackdowns
on illegal gun
carrying in gun crime hot spots, often done through directed
patrols focussed on gun
detection, appear effective in reducing gun crime and improving
citizens’ perceptions
of neighborhood conditions in targeted areas (Cohen and
Ludwig, 2003; Koper and
578
PIJPSM
7. 36,3
Mayo-Wilson, 2006; McGarrell et al., 2001; Sherman and
Rogan, 1995; Villaveces et al.,
2000). Efforts targeted on high-risk groups such as gangs,
probationers, parolees,
and known chronic offenders are another important evidence-
based approach to
reducing gun crime (e.g. Bynum and Varano, 2003; Delaware
Statistical Analysis
Center, 1998). The “pulling levers” or “focused deterrence”
approach that concentrates
law enforcement, prosecution, and social service resources on
high-risk groups,
typically through face to face contacts known as “notification
meetings,” has become
a popular approach of this sort that has been evaluated
favorably in several sites (e.g.
Braga, 2008; Braga et al., 2001, 2008; McGarrell et al., 2006,
2009; Papachristos et al.,
2007; Tita et al., 2003). Pioneered in Boston, this strategy has
become a blueprint for
other successful local and national initiatives in the USA,
including the Federal
Government’s Project Safe Neighborhoods (PSN) program
(McGarrell et al., 2009, 2010).
The threat of federal prosecution for gun crimes, which often
provides for much
more harsh penalties than are available at the state level, is a
central component
of this approach.
More generally, it has become increasingly common for police
to work collaboratively
8. with other criminal justice, government, social service, and
community organizations to
diagnose and address gun violence problems using a multi-
faceted, problem-solving
approach (e.g. Koper et al., 2010; OJJDP, 1999). The pulling
levers strategy is a leading
example of this. The Federal Government has sponsored other
initiatives of this sort,
such as the Partnerships to Reduce Juvenile Gun Violence
Program (Sheppard et al.,
2000), the Strategic Approaches to Community Safety Initiative
(Roehl et al., 2006, 2008),
and PSN (McGarrell et al., 2009, 2010). The growing federal
role in addressing local
gun crime problems, largely through PSN, is also reflected by
the 73 percent increase
in federal firearms prosecutions that occurred from 2001
through 2005 (McDevitt et al.,
2006, p. ii).
In contrast, police efforts to attack the supply side of the gun
crime problem appear
to have little or unknown effectiveness. Gun buyback or
exchange programs that offer
cash or other reimbursements to persons who relinquish their
firearms to police do not
appear to be an effective way of disarming high-risk persons or
reducing the overall
criminal supply of firearms (Callahan et al., 1996; Kennedy et
al., 1996a; Romero et al.,
1998; Rosenfeld, 1996; also see reviews in National Research
Council (NRC), 2005,
pp. 95-96 and Sherman, 1997), though some argue that they
have value as a community
outreach and mobilization strategy (Police Executive Research
Forum (PERF),
9. 2010; Rosenfeld, 1996). At the same time, there is scant
evidence about the extent or
effectiveness of police efforts to disrupt illegal gun markets
through investigation of
gun theft, gun trafficking, and other illegal gun sales. Many US
agencies, particularly
in urban areas, appear to trace the sales histories of recovered
guns with the assistance
of the Federal Bureau of Alcohol, Tobacco, Firearms, and
Explosives (ATF) and to
work with ATF on efforts to attack illegal gun trafficking
(Bureau of Alcohol, Tobacco,
Firearms and Explosives (ATF), 2002; Bureau of Justice
Assistance, 2000; OJJDP, 1999).
However, there has been little in-depth study or assessment of
such efforts. The tools
available to police to address illegal gun markets vary
substantially depending on state
and local gun laws (for instance, many states have no provisions
for licensing gun
owners or gun dealers, regulating private gun sales, or requiring
citizens to report
stolen firearms). Yet even in jurisdictions with more restrictive
gun laws, there has
been little examination of police uses or experiences with these
laws. This constitutes
an important “missing link” in debates over the efficacy of
many gun control laws (e.g.
see Hahn et al., 2003). Some studies show that locally-based
efforts to disrupt gun
579
Gun violence
prevention
10. practices
trafficking, discourage straw purchasing and illegal secondhand
sales, regulate and
work cooperatively with licensed gun dealers, and investigate
corrupt or negligent
gun dealers can reduce the flow of new firearms to criminal
users (Braga and Pierce,
2005; Ridgeway et al., 2011; Webster et al., 2006a, b, 2009).
But whether such efforts
are commonplace and can reduce the gun supply sufficiently to
reduce gun crime are
unclear (also see Braga et al., 2002, 2012; NRC, 2005).
Finally, education and prevention strategies conducted by or
involving police
include teaching children and youth about gun safety and the
consequences of gun
violence, promoting safe storage of firearms by adults through
education and the
distribution of lock boxes, and participating in a variety of
other gang and violence
prevention programs (e.g. OJJDP, 1999, pp. 169-200). Research
suggests that efforts to
change gun-related attitudes and behaviors have not had great
success (NRC, 2005),
but many programs of these sorts have not been evaluated.
In sum, current knowledge is rather limited on the use and
effectiveness of police
strategies to reduce gun violence. In this study, we sought to
provide new insights into
these issues through a national survey of local US police
agencies in urban areas.
11. Study objectives, methods, and data
One objective of our study was to provide more extensive
information on the nature,
scope, and prevalence of various police efforts to reduce gun
crime, including
the extent to which police use evidence-based and other
“promising” strategies (e.g. see
OJJDP, 1999). A related objective was to examine police
enforcement of selected gun
control laws, particularly those that would seem to enhance the
ability of law
enforcement to prevent the transfer of guns to illegal possessors
(e.g. laws requiring
gun registration or regulating private gun transfers). We also
sought to determine
whether and how police efforts to address gun crime differ
between jurisdictions
with stronger and weaker gun controls. For example, do police
make greater efforts to
address illegal gun markets in jurisdictions with stronger gun
controls? A fourth
objective was to ascertain which strategies police consider to be
most effective for
reducing gun crime. Are police views on effective strategies
consistent with available
research evidence? And, given the limited evaluation research
on this topic, do police
views and experiences suggest additional strategies that may
have promise for
future evaluation and diffusion? Finally, a fifth objective of the
study was to gauge
variability across jurisdictions in the overall intensity of police
efforts to address gun
crime and to make some preliminary, exploratory assessments
of whether stronger
12. police efforts reduce gun crime.
To these ends, we developed a police agency survey instrument
that included
items on violent gun crime, weapons arrests (i.e. arrests for
illegal weapon possession
and carrying as reported to the Uniform Crime Reports), and
gun recoveries
(from all sources) in the study jurisdictions; state/local gun
laws and enforcement
activities related to those laws; and the use and perceived
effectiveness of an extensive
list of enforcement and prevention strategies that agencies
might use to address
gun crime.
In the fall of 2009, this survey was administered by the Police
Executive Research
Forum (PERF) to all 263 primary law enforcement agencies
serving cities of 1,00,000
or more people in the USA[2]. We focussed on police in large
cities due to the
concentration of gun crime in urban jurisdictions and the
likelihood that addressing
gun crime is a higher priority for police in these localities;[3]
thus the findings are not
representative of police practices in smaller cities, suburban
jurisdictions, rural areas,
580
PIJPSM
36,3
13. or the nation as a whole. Overall, 164 agencies (62 percent)
responded to the survey[4].
Selected characteristics of the study agencies and jurisdictions
are shown in Table I.
Analysis of responding and non-responding agencies showed
that the responding
sample is more heavily weighted toward larger agencies
policing larger cities with
more serious violence problems. Responding agencies served
populations averaging
over 4,00,000; in contrast, non-responding agencies served
populations of about
1,71,000. (Among agencies serving cities of 2,00,000 or more,
71 percent responded to
the survey.) Further, responding agencies had officer to
population ratios 18 percent
larger than those of non-responding agencies, and their cities
had homicide rates 55
percent higher than those of non-respondents[5]. These
comparisons suggest that the
responding agencies represent those for which the problem of
gun violence is most
salient[6]. Note, however, that the findings may not generalize
as well to agencies in
smaller cities with less serious gun violence problems.
Results
Gun laws and enforcement
We begin with an examination of selected gun laws in the study
cities and enforcement
activities related to these laws. Federal and state laws prohibit
certain categories
of people from gun ownership (e.g. convicted felons), and
federal law, as well as some
state laws, requires that people purchasing guns from firearms
14. dealers (who must
be licensed by the Federal Government and possibly by state or
local governments)
undergo background checks by law enforcement to confirm their
eligibility.
Our survey examined selected state and local laws that go
beyond these basic gun
controls, with an emphasis on laws that may enhance the ability
of police to attack the
supply of guns to offenders.
Only 31 percent of large city agencies reported that their state
or locality required
people to obtain a permit to purchase a firearm (Table II).
Further, roughly three-
quarters of the local agencies in jurisdictions requiring permits
did not have authority
or discretion over the granting of those permits. About one-third
of agencies
(35 percent) operated in a state or locality that required
registration of firearms with
law enforcement, and 40 percent were in a jurisdiction that
either prohibited carrying
of a concealed handgun (4 percent) or gave police discretionary
control over granting
permits to carry a concealed handgun (36 percent) (Table II)[7].
Turning to Table III,
38 percent of agencies indicated that their state or locality
required background checks
for private gun sales, while 29 percent reported that their state
or locality required gun
owners to report losses or thefts of firearms. Finally, 21 percent
of the agencies had
legal authority to inspect licensed gun dealers.
Average 25th percentile Median 75th percentile
15. (1) Officer strength 1,115 229 400 839
(2) Population 4,04,884 1,32,246 1,99,000 3,80,227
(3) Gun recovery rate (per 100K) 231 127 217 305
(4) Weapons arrest rate (per 100K) 118 62 97 156
(5) Violent gun crime rate (per 100K) 239 86 196 337
Notes: Statistics on gun crime, gun recoveries, and weapons
arrests were averaged for the years 2006
through 2008; the number of agencies with available data for
calculation was as follows: (1) n¼163;
(2) n¼164; (3) n¼149; (4) n¼146; (5) n¼147
Table I.
Descriptive statistics
for study respondents
581
Gun violence
prevention
practices
A caveat to the preceding figures is that they are based on
reports from the agencies.
We relied on agencies’ reports of gun laws based on the belief
that law enforcement
professionals would be knowledgeable about their state and
local firearms laws and
the complexities and nuances of how those laws operate. Even
allowing for some
16. Yes
(%)
No
(%)
State or locality requires that people have a permit to purchase a
firearm 31 69
If Yes, agency has responsibility for granting these permits 27
73
If Yes, agency has discretion in whether or not to grant permits
22 78
State or locality requires registration of firearms 35 65
If Yes, use system to identify cases of potential straw
purchasing and other illegal
transfers 60 40
If Yes, use system ensure compliance with laws by licensed gun
dealers 54 46
If Yes, use system to conduct audits to ensure possessors are
still lawful 53 47
If Yes, use system to identify cases of illegal gun trafficking 70
30
If Yes, use system to notify officers about possible presence of
firearms at locations 63 37
State or locality prohibits carrying of concealed weapons or
requires a permit that is
issued at the discretion of police 40 60
Note: Based on a survey of 164 urban police agencies. Unless
otherwise noted, missing data rates were
negligible
Table II.
Gun control laws and
enforcement activities
related to permit systems,
17. firearm registration, and
carrying of concealed
weapons
Yes (%)
Frequently/
regularly (%) Occasionally (%) Never (%)
State or locality requires background
checks for private gun sales 38 – – –
If yes, how frequently does agency
investigate cases of potentially illegal
transfers? – 28 40 32
States or locality requires gun owners to
report losses or thefts of firearms 29 – – –
If yes, how frequently does
agency investigate cases under
this law? – 44 44 12
Agency has responsibility for inspecting
local gun dealers 21 – – –
If yes, how often does agency inspect
dealers? – 27 61 12
If yes, how often does agency investigates
dealers suspected of making illegal sales? – 16 62 22
Agency collects or receives records
from NCIC or a state system on denied
gun purchases 36 – – –
If yes, how frequently does agency follow
up on these cases? – 45 47 8
Note: Based on a survey of 164 urban police agencies. Unless
otherwise noted, missing data rates were
negligible
Table III.
Gun control laws and
18. enforcement activities
related to private sales,
reporting of gun thefts,
regulation of licensed
dealers, and monitoring
of prohibited buyers
582
PIJPSM
36,3
respondent error, however, the data suggest that most urban
police operate in contexts
where gun laws are relatively limited[8].
Moreover, our greater interest was in examining how agencies
enforced or otherwise
used certain laws that they reported as being applicable in their
jurisdiction. Overall,
enforcement and other uses of several of these laws were rather
limited. Agencies
operating in a state or locality that required gun registration, for
instance, were asked
a series of questions about ways that they might use these
records of gun owners and
firearms to identify illegal gun transfers, illegal gun possessors,
and other situations
potentially involving firearms (Table II). Between 60 and 70
percent reported using
registration systems to identify “straw purchasing”[9] and other
forms of illegal
transfers and trafficking, while 54 percent reported using them
to ensure that licensed
19. gun dealers were operating in compliance with applicable laws
and reporting
requirements (these laws typically require gun dealers to report
their sales to police).
Gun registration systems can also be used to identify previously
lawful purchasers
who have become ineligible due to new convictions or other
reasons (Wright and
Wintemute, 2010). California authorities have instituted such a
program in recent years
and discovered that almost 36,000 handguns and assault
weapons are possessed by
previously legal California purchasers who are now ineligible to
have those weapons
(Associated Press, 2011; Connolly and Luo, 2011). However,
only about half (53 percent)
of the agencies with access to a gun registration system in our
sample reported
using the system in this manner. Finally, 63 percent of the
agencies in jurisdictions
with gun registration reported using the system to warn officers
of the possible
presence of firearms at locations to which they are responding
(for officer safety
purposes). Hence, while many agencies with access to gun
registration data report
using them in these strategic ways, many others do not.
We found similar patterns with respect to a number of
additional laws (Table III).
Only 28 percent of the agencies operating in a state or locality
that required
background checks on private gun sales investigated illegal
private sales on a regular
basis, and 32 percent indicated that they never conducted such
investigations. In a
20. follow-up item, 43 percent of the agencies that did not
investigate these cases regularly
cited resource constraints as a reason that they did not pursue
more such
investigations. Likewise, less than half (44 percent) of the
agencies in jurisdictions
requiring gun owners to report losses or thefts of firearms
investigated these types of
cases regularly, even though these laws are intended to provide
police with better
information on firearm thefts and to discourage people from
making straw purchases
or other illegal gun transfers and then falsely reporting the guns
as stolen or missing.
Law enforcement authority over licensed gun dealers can also
be significant tool for
curbing illegal gun markets. Corrupt licensed dealers can serve
as large sources
of firearms to illegal markets (ATF, 2000a), and some research
suggests that half of
licensed dealers in urban areas may be willing to sell guns in
potential straw
purchase situations (Sorenson and Vittes, 2003). Further,
studies suggest that closer
regulation of gun dealers by law enforcement and undercover
investigations directed at
problematic dealers help to reduce the flow of new firearms into
criminal markets
(Webster et al., 2006a, b, 2009). Yet among the sample of
agencies with authority for
inspecting gun dealers, only 27 percent inspected dealers on a
regular basis, and only
16 percent regularly investigated dealers suspected of making
illegal sales (though the
latter may reflect low levels of problems with illegal sales by
21. gun dealers).
Finally, only about a third of the agencies received data from
federal or state
systems on prospective or actual gun buyers who fail
background checks[10].
583
Gun violence
prevention
practices
Less than half (45 percent) of the agencies that received such
information followed up
on these cases regularly, though most of the remainder did so
occasionally.
Use of gun violence prevention strategies
All agencies were asked a series of questions regarding their
use of a wide range of gun
violence prevention strategies, beginning with whether they had
a special unit devoted
to gun enforcement operations. Less than six of every ten
agencies (57 percent)
indicated having such a unit. Functions performed by these
units included directed
patrol (62 percent), surveillance/investigation of known gun
offenders and other high-
risk groups (66 percent), investigation of gun trafficking (61
percent), monitoring of
gun dealers (34 percent), and working with federal and/or state
agencies on gun crime
22. problems (89 percent).
The responding agencies were also asked about the use of 41
gun enforcement and
potential gun violence prevention strategies that were identified
based on an extensive
review of research studies and other literature describing or
evaluating strategies to
reduce gun crime (e.g. IACP, 2008; Koper et al., 2010; Koper
and Mayo-Wilson, 2006;
NRC, 2005; OJJDP, 1999; Sherman and Eck, 2002). Below, the
strategies are grouped
into those emphasizing gun removal/disposal, gun trafficking,
illegal possession
and carrying, prevention and outreach, high-risk groups,
comprehensive approaches,
and gun safety. Agencies were asked to report the frequency
with which they used
these strategies on a three-point scale: never, occasionally, or
frequently/regularly
(Table IV)[11].
Removing guns from the community. Agencies did not report
extensive use of gun
acquisition strategies such as gun buyback programs. Nearly
two-thirds of the
agencies (61 percent) did not use gun buybacks, and most (55
percent) also reported
not having other programs for voluntary gun disposal. Although
the utility of gun
buyback programs is questionable, experts do recommend that
police establish
protocols for voluntary surrender of firearms (IACP, 2008).
Reducing gun trafficking. To address gun trafficking, virtually
all agencies
23. (99 percent) reported tracing the sales histories of recovered
guns with the assistance
of ATF. A gun trace conducted by ATF is an investigation that
typically tracks a
gun from its manufacture through its first point of retail sale by
a licensed dealer.
It thus provides police with information about where and when a
gun was first
purchased at retail and about the buyer and seller involved in
the transaction. Gun
traces can be used to solve particular crimes and as a tool for
assessing patterns in
illegal gun markets. Additional survey items on tracing
practices (not shown) indicated
that more than three-quarters of agencies that trace guns
reported tracing all recovered
guns (64 percent) or all guns associated with any crime (13
percent); only 17 percent
reported tracing guns only when needed on a case-by-case basis.
However, the use of
gun tracing for addressing illegal gun markets appears to be
more limited. Whereas
almost all respondents reported using tracing data to investigate
violent crimes, only
53 percent reported using tracing data to identify retail sources
of crime guns and
only 61 percent reported using tracing data to identify other
suppliers of crime guns
such as straw purchasers and gun traffickers.
Virtually all respondents (96 percent) also reported entering
information on
recovered bullets and ammunition casings into the National
Integrated Ballistics
Information System (NIBIN), a national system administered by
ATF to match images
24. of markings made on fired cartridges and bullets. This system
helps police to link
crimes involving the same firearm and serves primarily as an
investigative tool for
584
PIJPSM
36,3
Frequently/
regularly Occasionally Never
Gun removal/disposal
Gun buyback program (n¼163) 3 36 61
Programs or procedures (other than gun buyback) for voluntary
disposal (n¼159) 8 37 55
Gun trafficking
Trace recovered firearms (n¼162) 74 25 1
Check recovered firearms for ballistics matches (n¼159) 66 30
4
Investigate retail sources of crime guns (n¼161) 12 46 42
Investigate straw purchasing and unlawful transfers (n¼163) 20
43 37
Monitor gun shows for illegal buyers and sales (n¼159) 8 28 64
Debrief adult gun offenders about their gun sources (n¼162) 58
35 7
Debrief juvenile gun offenders about their gun sources (n¼163)
64 29 7
Local gun trafficking investigations with ATF (n¼164) 46 47 7
Multi-jurisdictional investigations with other local, state,
federal
agencies (n¼164) 27 53 20
Investigative and undercover operations to suppress unlawful
25. street sales of guns (n¼163) 19 55 26
In-depth investigations of gun thefts (n¼163) 39 53 8
Educational or cooperative efforts with dealers (n¼164) 7 23 70
Monitor denied gun sales (n¼164) 11 24 65
Link ATF data on multiple sales to crime gun information
(n¼163) 22 33 45
Illegal gun possession and carrying
Directed patrols or specialized units emphasizing gun detection
in
hot spots (n¼164) 43 30 27
Checkpoints for unlawful possession of guns in vehicles
(n¼164) 4 7 89
Hotlines or reward programs for tips on illegal gun possession,
carrying, use (n¼164) 41 35 24
Consent searches at homes of juveniles thought to illegally
possess
guns (n¼164) 15 64 21
Shot spotter listening devices (n¼161) 9 5 86
Prevention and outreach
Neighborhood meetings on the issue of gun crimes (n¼162) 15
53 32
Media/public education campaigns (n¼162) 8 56 36
Letters/information to gun buyers about pertinent laws (n¼163)
1 11 88
Gun safety education in schools (n¼162) 10 41 49
Violence prevention programs targeting youths in schools
(n¼163) 30 55 15
Targeting high-risk groups
Focusing on gangs (e.g. prevention programs, suppression
activities) (n¼163) 71 23 6
Shooting response protocol stressing prevention of retaliation
(n¼163) 36 33 31
Work with street/gang outreach workers (n¼163) 23 40 37
Targeting known gun offenders through investigation,
surveillance, warrants (n¼163) 49 45 6
Enhanced monitoring of high-risk probationers and parolees
26. (n¼160) 39 37 24
Joint ATF initiatives to target offenders and hot spots (e.g.
violent
crime impact teams) (n¼160) 41 32 27
Joint initiatives with state/local prosecutors to prioritize gun
offenders (n¼164) 38 42 20
(continued)
Table IV.
Use of gun violence
reduction strategies
(percentages using the
strategies frequently/
regularly, occasionally,
or never)
585
Gun violence
prevention
practices
solving gun crimes (e.g. see Bureau of Alcohol, Tobacco,
Firearms, and Explosives
(ATF), 2012; Braga and Pierce, 2004). However, we also list
ballistic matching as a
potential anti-trafficking strategy because, like tracing
information, these matches can
also be used to assess patterns in the movement of firearms.
This may be helpful in gun
27. trafficking investigations, particularly if a firearm is linked to
offenses involving
multiple people, thus providing an opportunity to track transfers
of the firearm. More
than half (57 percent) of the agencies using NIBIN reported
entering information for all
recovered bullets and casings rather than for just those linked to
specific investigations
(item not shown), but the survey did not ascertain further
information about specific
uses of this tool.
Other common strategies to address gun trafficking included
debriefing offenders
(adult and juvenile) about their gun sources (used frequently by
58-64 percent of
agencies and occasionally by 29-35 percent), conducting
investigations with ATF (and,
to a lesser extent, with other agencies) (used frequently by 46
percent and occasionally
by 47 percent), and investigating gun thefts (used frequently by
39 percent and
occasionally by 53 percent)[12]. Agencies reported more modest
use of several other
anti-gun trafficking strategies. Relatively few agencies (19
percent), for example,
reported frequent investigation of unlawful gun sales or sources
of recovered guns
(including retail and street sources), though most agencies
reported at least occasional
efforts along these lines. Most agencies did not monitor denied
gun sales (65 percent),
monitor gun shows (64 percent), or undertake educational or
cooperative efforts with
gun dealers (70 percent). However, the latter two activities may
have had limited
28. relevance to some agencies, depending on the number of gun
shows and gun dealers in
their jurisdiction[13].
Deterring illegal gun possession and carrying. Strategies most
commonly used by
police to target illegal gun possession and carrying included
directed patrols or
specialized units focussing on gun crime hot spots and hotlines
or reward programs for
Frequently/
regularly Occasionally Never
Submit information on felons with guns to the US Attorney’s
Office
(n¼164) 55 35 10
Remove guns from scenes of domestic violence calls (n¼161)
72 27 1
Check on gun ownership by people under restraining orders
(n¼161) 25 40 35
Cross-jurisdictional and information sharing efforts to track
violent
offenders (n¼162) 47 42 11
Notification meetings (n¼159) 14 30 56
Comprehensive approaches
Multi-agency and community partnerships to address
enforcement,
prosecution, and prevention (e.g. Project Safe Neighborhoods or
Weed and Seed) (n¼163) 64 20 16
Gun Safety
Distribution of gun storage or safety devices (n¼163) 20 61 19
Education campaigns to inform gun owners about safe storage
(n¼163) 8 60 32
Note: Based on a survey of 164 urban police agencies. Unless
29. otherwise noted, missing data rates were
negligibleTable IV.
586
PIJPSM
36,3
tips on guns. Nearly half of the agencies made frequent use of
these strategies, and
about three-quarters used them at least occasionally. Most
agencies (79 percent)
conducted occasional consent searches at the homes of juveniles
thought to be in
possession of weapons (e.g. see Decker and Rosenfeld, 2004),
but few (15 percent) did so
regularly. Few agencies (11-14 percent) reported any use of
roadblock checkpoints for
weapons or shot spotter listening devices.
Prevention and outreach. Although most agencies made at least
occasional use of
most of the listed prevention and outreach strategies, few used
them regularly. Almost
one-third reported frequent use of youth violence prevention
programs in schools.
However, no more than 15 percent reported regular use of a
number of additional
strategies focussed on education and awareness. These included
general efforts to raise
public awareness about gun violence as well as more targeted
efforts to teach gun
safety in schools or to educate gun buyers about pertinent laws
regarding firearm uses
30. and transfers (e.g. see Ridgeway et al., 2011).
Targeting high-risk groups. Half or more of the agencies
reported regular use
of strategies to target and/or disarm gangs (71 percent), known
gun offenders
(49 percent), and domestic violence offenders (72 percent).
Likewise, just over half
(55 percent) frequently submitted gun cases to the US
Attorney’s Office for federal
prosecution. (Ballistic matching, discussed above, was also used
regularly by two-
thirds of agencies. This investigative tool is also worth noting
here as it can facilitate
the identification of repeat gun offenders.) Strategies used by a
majority of agencies
but with less frequency included targeting offenders and hot
spots with ATF (used
frequently by 41 percent and occasionally by 32 percent),
shooting response protocols
(used frequently by 36 percent and occasionally by 33 percent),
working with gang
outreach workers (used frequently by 23 percent and
occasionally by 40 percent),
enhanced monitoring of probationers and parolees (used
frequently by 39 percent and
occasionally by 37 percent), working with state prosecutors to
prioritize gun offenders
(used frequently by 38 percent and occasionally by 42 percent),
and removing guns
from persons under restraining orders (used frequently by 25
percent and occasionally
by 40 percent). In contrast, more than half of the agencies (56
percent) did not use
notification meetings with high-risk groups (see the earlier
discussion of the pulling
31. levers strategy), and only 14 percent used them regularly[14].
Comprehensive approaches. Most agencies reported
involvement in multi-agency
partnerships to address enforcement, prosecution, and
prevention approaches to gun
violence. These include federally sponsored efforts such as
PSNs and Weed and Seed,
as well as locally initiated efforts. Approximately two-thirds of
agencies (64 percent)
reported regular participation in these efforts, and 84 percent
reported at least
occasional participation.
Promoting gun safety. Finally, most agencies engaged in some
efforts to promote
gun safety, including the distribution of gun storage and gun
safety devices and
participation in public education efforts. However, no more than
20 percent of agencies
engaged in these efforts regularly (similarly, see the response
on school-based gun
safety education listed in the section on prevention and
outreach).
Summarizing strategy utilization. The survey results show that
urban police use a
wide variety of strategies to address gun crime. However, only
eight of the 41 strategies
we examined were used on a regular or frequent basis by the
majority of responding
agencies: tracing recovered guns (74 percent), removing guns
from the scenes of
domestic violence (72 percent), focussing on gangs (71
percent), checking recovered
firearms for ballistics matches (66 percent), multi-agency and
32. community partnerships
587
Gun violence
prevention
practices
(64 percent), debriefing juvenile and adult offenders about their
gun sources (64 and 58
percent, respectively), and submitting cases to the US
Attorney’s Office (55 percent).
This suggests that strategies to reduce gun violence may be
somewhat underutilized or
underdeveloped relative to the seriousness of the problem. In
other words, there may be
considerable room for police to expand on these efforts,
particularly with respect to
the use of other tested and evidence-based strategies (e.g.
crackdowns on illegal gun
carrying, use of notification meetings, and enhanced monitoring
of high-risk
probationers and parolees).
The effects of gun crime and gun laws on the use of gun
violence reduction strategies
To assess how use of these strategies varied with a
jurisdiction’s gun laws and level of
gun crime, we ran a series of ordinal and generalized logistic
regression models (not
shown) that predicted how extensively the agencies used each
strategy (on our three-
point scale) as a function of the jurisdiction’s gun laws and
33. whether the jurisdiction’s
rate of violent gun crime was above or below the median value
of this rate across
all cities[15]. As expected, levels of gun crime prompted greater
use of the listed
strategies, as nearly half were used more frequently in
jurisdictions with higher levels
of gun crime[16].
Gun laws, in contrast, had more limited effects. Most notably,
agencies with the
authority to inspect licensed dealers used many of the strategies
more frequently,
including several oriented toward gun markets and gun
trafficking – debriefing
gun offenders about gun sources, investigating straw
purchasing, investigating retail
and street sources of crime guns, monitoring gun shows,
working with licensed gun
dealers, and linking information on recovered guns to ATF data
on multiple sales
(i.e. purchases of multiple guns by the same individual from the
same dealer at one
time or in a short span of days)[17]. Other gun laws, however,
were not as strongly
related to the practices reported by the agencies. For example,
agencies with access to
gun registration systems were more likely to check on firearms
possession by persons
under restraining orders. However, they were no more likely
than other agencies to
investigate straw purchasing or retail sources of crime guns,
both of which can be
facilitated by the availability of gun registration data. Similarly,
agencies in jurisdictions
regulating private sales were no more likely to investigate straw
34. purchasing and other
illegal gun transfers.
For further assessment, cities located in states with the most
restrictive
combinations of state gun laws were compared with the rest of
the sample. Using
the state gun law rankings of the Brady Campaign to Prevent
Gun Violence (which are
based on the totality of gun laws in each state) and other
selected sources on gun laws
(e.g. Legal Community Against Violence, 2008; Vernick and
Hepburn, 2003), 11 states
were designated as high gun control states[18]. (Among other
measures, these states
generally have some form of licensing for gun owners, gun
registration, and/or
regulation of private gun sales.) This enabled us to determine
whether police practices
varied based on the overall level of gun control in a
jurisdiction, and it provided an
additional data source with which to validate results found
using the gun law
designations reported by the agencies. Police in the high-control
jurisdictions did not
make greater use of the gun-related strategies overall, nor did
they have a strong
tendency to make more use of market-oriented strategies as
might be expected based
on their laws. Of note, however, police in the more restrictive
states were more likely to
monitor gun buyers, check on gun ownership among people with
restraining orders,
investigate unlawful street sales of firearms, and conduct gun
buybacks. Strategies
35. 588
PIJPSM
36,3
they used less often included initiatives with prosecutors,
perhaps signaling less
reliance on more punitive, deterrence-oriented strategies to
reduce gun crime in areas
where gun availability is more limited.
Perceived effectiveness of gun violence prevention strategies
Agencies were asked to rate the effectiveness of strategies they
used on a three-point
scale: little or no effectiveness, moderate effectiveness, or very
effective. In total,
80 percent or more of users provided effectiveness ratings for
two-thirds (68 percent) of
the strategies, and at least 70 percent of users provided
effectiveness ratings for
90 percent of the strategies (the few remaining strategies were
rated by roughly
two-thirds of their users)[19]. For each strategy, Table V shows
the percentage of
agencies using the strategy at least occasionally and the
strategy’s effectiveness as
rated by users that provided an effectiveness rating. (Note that
the effectiveness ratings
for some strategies may reflect their usefulness in solving
particular cases as well
as their effectiveness in reducing gun crime more generally.)
%
Used
36. Very
effective
Moderate
effectiveness
Little or no
effectiveness
Gun removal/disposal
Gun buyback program 39 9 24 67
Programs or procedures (other than gun buyback)
for voluntary disposal 45 2 26 72
Gun trafficking
Trace recovered firearms 99 22 59 19
Check recovered firearms for ballistics matches 96 39 46 15
Investigate retail sources of crime guns 58 10 56 34
Investigate straw purchasing and unlawful transfers 63 20 52 28
Monitor gun shows for illegal buyers and sales 36 6 67 27
Debrief adult gun offenders about their gun sources 93 16 49 35
Debrief juvenile gun offenders about their gun
sources 93 14 55 31
Local gun trafficking investigations with ATF 93 47 44 9
Multi-jurisdictional investigations with other local,
state, federal agencies 80 37 52 11
Investigative and undercover operations to suppress
unlawful street sales of guns 74 25 65 10
In-depth investigations of gun thefts 92 16 67 17
Educational or cooperative efforts with dealers 30 17 65 17
Monitor denied gun sales 35 15 49 36
Link ATF data on multiple sales to crime gun
information 55 19 64 17
Illegal gun possession and carrying
Directed patrols or specialized units emphasizing
37. gun detection in hot spots 73 46 44 10
Checkpoints for unlawful possession of guns in
vehicles 11 22 61 17
Hotlines or reward programs for tips on illegal gun
possession, carrying, use 76 11 50 39
(continued)
Table V.
Perceived effectiveness of
gun violence prevention
strategies (percentages
using the strategies and
percentages of users
rating them as very
effective, moderately
effective, or not effective)
589
Gun violence
prevention
practices
With the exception of gun removal strategies, the strategies
were rated as
moderately or very effective by the majority of agencies. In
most cases, a plurality
or majority of agencies rated each strategy in Table V as
moderately effective. Two
38. strategies that were rated very effective by the majority of users
were submitting cases
to the US Attorney for prosecution (rated as very effective by
60 percent) and removing
guns from the scenes of domestic violence calls (rated as very
effective by 56 percent).
%
Used
Very
effective
Moderate
effectiveness
Little or no
effectiveness
Consent searches at homes of juveniles thought to
illegally possess guns 79 21 58 21
Shot spotter listening devices 14 17 55 28
Prevention and outreach
Neighborhood meetings on the issue of gun crimes 68 8 58 34
Media/public education campaigns 64 9 59 32
Letters/information to gun buyers about pertinent
laws 12 15 39 46
Gun safety education in schools 51 11 76 13
Violence prevention programs targeting youths in
schools 85 16 71 13
Targeting high-risk groups
Focusing on gangs (e.g. prevention programs,
suppression activities) 94 42 60 6
Shooting response protocol stressing prevention of
retaliation 69 37 59 4
Work with street/gang outreach workers 63 20 60 20
39. Targeting known gun offenders through
investigation, surveillance, warrants 94 45 48 7
Enhanced monitoring of high-risk probationers and
parolees 76 47 43 10
Joint ATF initiatives to target offenders and hot spots
(e.g. violent crime impact teams) 73 45 47 8
Joint initiatives with state/local prosecutors to
prioritize gun offenders 80 44 51 5
Submit information on felons with guns to the US
Attorney’s Office 90 60 34 6
Remove guns from scenes of domestic violence calls 99 56 37 7
Check on gun ownership by people under restraining
orders 65 34 51 15
Cross-jurisdictional and information sharing efforts
to track violent offenders 89 37 58 5
Notification meetings 44 18 68 14
Comprehensive approaches
Multi-agency and community partnerships to
address enforcement, prosecution, and prevention
(e.g. Project Safe Neighborhoods or Weed and Seed) 84 49 47 4
Gun safety
Distribution of gun storage or safety devices 81 24 44 32
Education campaigns to inform gun owners about
safe storage 68 20 60 28
Note: Based on a survey of 164 urban police agencies. See text
for response rates to effectiveness
ratings
Table V.
590
PIJPSM
36,3
40. Several other strategies targeting high-risk groups, such as
those focussing on known
gun offenders, gangs, probationers, and parolees, were also
rated as very effective by
nearly half of the agencies and as at least moderately effective
by nearly all.
Agencies gave similarly high effectiveness ratings to directed
patrols/specialized units
focussed on gun crime hot spots, local gun trafficking
investigations with ATF, and
multi-agency community partnerships.
Gun removal strategies, such as gun buybacks, were the only
strategies considered
ineffective by the majority of users (67-72 percent). Other
strategies that received
relatively low effectiveness ratings included neighborhood
meetings, educational
efforts (including media campaigns and sending information to
gun buyers), hotlines
or tip programs to report illegal guns, and distribution of gun
storage and safety
devices. Generally, these strategies were rated as ineffective by
roughly one-third of
the agencies that had used them, though a majority still
considered them to be at
least moderately effective. This was also true for a few market-
oriented strategies
including investigation of retail sources of crime guns,
debriefing offenders about their
gun sources, and monitoring denied gun sales.
To summarize some key findings, Table VI presents the
strategies that agencies
41. were most likely to both use frequently and rate as very
effective. Submitting cases to
the US Attorney’s Office for prosecution was the leading
strategy, with 39 percent
of agencies using it frequently and rating it as very effective.
Other common and highly
rated strategies involving cooperation with federal authorities
included participation
in multi-agency initiatives like PSNs and working with ATF on
gun trafficking
investigations and targeted enforcement initiatives (e.g. the
Violent Crime Impact
Team program – see Bureau of Alcohol, Tobacco, Firearms, and
Explosives (ATF),
2005; Chipman and Pappas, 2006). Other strategies in this top
list included
efforts focussed on high-risk groups (e.g. gangs), places (i.e.
gun crime hot spots), and
situations (e.g. domestic violence incidents). Further, local
police put substantial
emphasis on collaborative efforts with other federal, state, and
local criminal
justice agencies.
Strategy
% of
respondents
Submit information on felons with guns to the US Attorney’s
Office for prosecution 39
Remove guns from scenes of domestic violence calls 37
Multi-agency and community partnerships to address
enforcement, prosecution, and
prevention (e.g. Project Safe Neighborhoods or Weed and Seed)
34
42. Focusing on gangs (e.g. prevention programs, suppression
activities) 32
Check recovered firearms for ballistic matches 29
Directed patrols or specialized units emphasizing gun detection
in gun crime hot spots 29
Targeting known gun offenders through investigation,
surveillance, and warrants 29
Local gun trafficking investigations with ATF 27
Enhanced monitoring of high-risk probationers and parolees 24
Joint initiatives with ATF to target gun offenders and hot spots
(e.g. violent crime
impact teams) 24
Joint initiatives with state/local prosecutors to prioritize gun
offenders 23
Cross-jurisdictional and information sharing efforts to track
violent offenders 21
Note: Based on a survey of 164 urban police agencies
Table VI.
Strategies most likely to
be used frequently and
rated very effective
591
Gun violence
prevention
practices
The most extensively used and effective strategies were very
comparable between
43. cities with high and low levels of gun crime based on a
comparison of cities above and
below the median rate of gun crime. Top strategies (ranking in
or near the top 10) were
also very similar between agencies in states with stronger and
weaker gun controls.
(This was examined using the high/low state-level gun control
indicator discussed
above and by comparing jurisdictions having both gun
registration and regulation of
private sales, as reported by the agencies, to other
jurisdictions[20].) However, agencies
in states with less restrictive gun controls tended to put more
emphasis on working
with federal prosecutors and ATF. This suggests that police in
these states are
more reliant on federal assistance for prosecuting and punishing
gun criminals
and attacking illegal gun trafficking. In places with more
restrictive gun laws (such as
those having gun registration and regulation of private gun
sales), agencies put
somewhat more emphasis on gun tracing and checks on gun
ownership among people
with restraining orders. This likely reflects the ability of police
to do more with these
tools in places where police can more readily link a firearm and
its chain of custody to
particular individuals.
Assessing overall police efforts and their impacts
For the final set of analyses, we created three measures of a
police agency’s
overall effort level in targeting firearms: gun recoveries per
violent gun crime, weapons
arrests (for illegal weapons possession and carrying) per violent
44. gun crime, and
gun enforcement/prevention strategies used regularly (as
reported in the survey) per
violent gun crime. (The gun recovery, weapons arrests, and gun
crime figures are
based on three-year averages for 2006-2008[21].) In general,
rates of gun crime, gun
recoveries, and weapons arrests varied substantially among the
cities (Table I).
However, the effort measures presented here (see Table VII)
provide a method of
standardizing for population size and levels of gun availability
and gun violence when
comparing gun recoveries, weapons arrests, and strategies
utilized across jurisdictions.
The logic is that agencies making greater proactive efforts to
target guns will recover
greater numbers of guns, make more weapons arrests, and use
more gun violence
reduction strategies relative to their level of gun crime. Others
have used similar
measures to examine variation in firearms enforcement efforts
across agencies and
over time (Brill, 1977; Sherman, 2000; Sherman and
Bridgeforth, 1994). Using these
measures, we sought to describe the variability in gun-related
effort levels across
the sample and to make some preliminary assessments of
whether these effort levels
Weapons arrests per 100
gun crimes (1)
Gun recoveries per 100
gun crimes (2)
45. Strategies used regularly
per 100 gun crimes (3)
Average 80 154 5
Percentiles
25th 31 62 1
Median 50 106 3
75th 93 174 5
Notes: The weapons arrests, gun recovery, and gun crime
figures are based on data for 2006, 2007,
and 2008. The gun crime figures are based on homicides,
robberies, and assaults with guns. The
number of agencies with available data for each calculation
were as follows: (1) n¼136; (2) n¼135;
(3) n¼147
Table VII.
Effort levels in gun
enforcement and gun
violence prevention
strategies
592
PIJPSM
36,3
are related to levels of gun crime across cities. In other words,
do more intensive police
efforts to target firearms help to reduce gun crime?
For every 100 gun crimes, agencies on average recovered 154
46. guns, made 80
weapons arrests, and used five strategies regularly to reduce
gun crime (Table VII).
There was considerable variation, however, in the agencies’
effort levels. The bottom 25
percent, at most, made 31 weapons arrests, recovered 62
firearms, and utilized one
strategy regularly per 100 gun crimes, while the top 25 percent
made at least 93 arrests,
recovered at least 174 guns, and utilized at least five strategies
regularly for every 100
gun crimes. The three effort measures had statistically
significant correlations ranging
from 0.36 to 0.57, showing that agencies scoring higher on one
also tended to score
highly on the others.
Police tended to make more weapons arrests per gun crime in
states with high levels
of gun control; this was particularly true in jurisdictions with
more restrictive gun
carrying laws. In other regards, however, an agency’s effort
levels were not related to
the jurisdiction’s gun laws (whether based on the state-level
high/low-gun control
indicator or the individual laws reported by the agencies) or the
availability of firearms
in the state (approximated by the percentage of suicides
committed with guns – see
NRC, 2005). Hence, police in jurisdictions with stricter gun
laws do not necessarily put
greater effort into weapons enforcement or achieve more
substantial results. To a
considerable degree, these ratios may reflect both the agency’s
emphasis on guns and
its overall emphasis on proactive policing activities (e.g. its use
47. traffic stops, pedestrian
checks, etc.) that can lead to more gun detection. Additional
study of the variation in
these effort levels, and the organizational and environmental
factors that facilitate or
hinder gun violence prevention efforts, would seem useful.
To assess the association between the effort measures and gun
crime in the study
cities, Figure 1 contrasts the percentage of violent crimes
(murders, robberies, and
aggravated assaults) committed with guns between cities where
police agencies scored
in the top 50 percent on the effort measures (i.e. high-effort
cities) and cities where the
police scored in the bottom 50 percent (i.e. low-effort cities).
For each effort measure, the
percentage of violent crimes committed with guns was around
25 percent in the high-
effort jurisdictions and around 35 percent in the low-effort
jurisdictions. More
specifically, the share of violent crimes involving guns was 25
percent to 33 percent
lower (in relative terms) in cities where police put greater
emphasis on gun-related
Weapons
arrests
Note: High effort = top 50 percent on weapons arrests, gun
recoveries,
and gun violence reduction strategies used per gun crime
Gun
recoveries
50. enforcement and prevention. These patterns were consistent for
larger and smaller
cities (based on a comparison of cities with populations above
and below 2,50,000) and
in jurisdictions with stronger and weaker gun controls (based on
a comparison of cities
using the state-level high/low global gun control indicator and a
comparison of
cities with and without the combination of gun registration and
regulation of private
sales as reported in the survey). Similarly, rates of violent gun
crime per population
were also considerably lower in the high-effort jurisdictions,
regardless of city size or
the restrictiveness of applicable gun laws (analyses not shown).
These patterns should be interpreted with caution. In places
with less severe crime
problems, for instance, police may have more time to utilize
proactive strategies
that lead to more gun recoveries and weapons arrests, and thus
higher effort ratios.
If so, this would tend to overstate the impact of police efforts
on gun crime. On the
other hand, police could also be expected to put a greater
emphasis on strategies
targeting gun crime in places where gun violence is more
prevalent (as found in our
earlier analyses). This tendency would lead to higher effort
ratios in places with more
gun crime and potentially mask some of the impact of police
activity. To some degree,
these patterns might also reflect the workings of other social
51. factors that affect both
police activities and gun crime. Nevertheless, the data provide
intriguing indications
of the potential for police to reduce gun crime through enhanced
gun enforcement and
gun violence prevention efforts.
Discussion
This study represents the first national survey examination of
gun violence reduction
efforts by local police in the USA, and it provides a number of
insights that may be
useful in guiding future research and policy development. One
caveat to the study is
that it is based on large US cities, so the results may not
generalize well to other nations
or types of jurisdictions. Further, we could not provide detailed
information on how the
agencies were implementing their strategies. Care should also
be taken in judging
the effectiveness of strategies based on these data, as they
reflect the impressions of
practitioners rather than evidence from scientific assessments.
Further, a notable
minority of agencies using many of the strategies did not
provide effectiveness ratings.
That said, we offer some tentative generalizations and
implications from the results.
Urban police engage in a wide array of enforcement and
prevention efforts to reduce
gun crime. Targeted policing efforts focussed on high-risk
places and groups – such
as gun detection in hot spots, targeting of violent gangs, and
removal of guns from
domestic violence offenders (which is required in some states) –
52. are some of the
most frequently used and effective strategies as rated by police.
Further, police give
substantial emphasis to multi-agency investigations and
comprehensive approaches
that combine enforcement, prosecution, and prevention efforts.
Ballistics matching
technology is enhancing the ability of police to solve gun
crimes, and investigation of
gun trafficking with ATF, facilitated by gun tracing, is the most
frequently used and
effective supply-side strategy for disrupting illegal gun markets.
These practices
are largely consistent with research evidence and expert opinion
on effective strategies
to reduce gun violence and should arguably be given strong
consideration in policy and
funding decisions.
At the same time, the findings suggest that police efforts to
address gun crime can
be enhanced considerably – and that doing so may produce
demonstrable reductions in
gun crime. Many evidence-based and promising strategies for
reducing gun violence,
including directed patrols in gun crime hot spots and enhanced
monitoring of
594
PIJPSM
36,3
probationers and parolees, are not used regularly by most urban
53. police agencies.
Other innovative approaches, such as consent searches at the
homes of at-risk
juveniles and notification meetings with high-risk groups,
receive relatively little use.
With some exceptions, local police efforts focussed on illegal
gun markets, prevention
and outreach, and gun safety appear to be particularly
underdeveloped. Even among
agencies that trace recovered firearms, many do not report using
them to address
illegal trafficking. The need for these strategies is, of course,
greater in places with
more gun crime. Care should also be taken in recommending
these strategies because
some have not been carefully evaluated. Yet given the
seriousness and costliness of
gun violence, these efforts should perhaps be given higher
priority by police,
particularly in urban areas. Further, the strategies examined in
this study were usually
considered to be at least moderately effective by agencies using
them. At a minimum,
further experimentation and testing with a wider variety of
strategies would seem
beneficial, as would further research on the factors that
influence the strategies that
police choose to address gun crime.
Similarly, there are substantial gaps in the enforcement of many
gun laws. Agencies
operating in states and localities with gun registration,
regulation of private sales,
theft/loss reporting requirements, and regulation of licensed gun
dealers engage in
limited efforts to enforce or use these laws, despite their
54. potential to enhance law
enforcement efforts directed at disrupting illegal gun markets.
In some of these
jurisdictions, state police agencies may take the primary role in
enforcing these laws.
Nonetheless, heavier involvement by local police agencies could
perhaps improve the
rigor, comprehensiveness, and effectiveness of supply-side
efforts. Resource limitations
appear to be a significant impediment to better enforcement of
gun laws for many
police agencies. Others may include weak or vaguely worded
laws that make
investigation and prosecution of illegal sales difficult or a lack
of significant penalties
for violations like straw purchasing. Policy changes, including a
reprioritization
of gun enforcement efforts and better cooperative and data
sharing arrangements
among local, state, and federal agencies, may also be necessary
to facilitate these
efforts. These issues warrant greater attention in future research
and policy
discussions (e.g. PERF, 2010).
Local police also depend heavily on cooperation with federal
authorities in their
efforts to reduce gun crime, particularly in jurisdictions with
less restrictive gun
controls. Submitting cases to the US Attorney for prosecution
was the leading strategy
identified by local agencies for addressing gun crime. Local
police also emphasize
cooperation with federal authorities in multi-agency programs
like PSNs and Weed
and Seed, and they rely heavily on collaboration with ATF for
55. gun trafficking
investigations and some targeted enforcement efforts.
Furthermore, in many
jurisdictions, ATF is the primary or only agency that regulates
licensed gun dealers.
Continued and expanded federal support for these cooperative
efforts would thus seem
critical to local police efforts to reduce gun crime. Because ATF
resources are stretched
thin, local police might also consider devoting more officers to
ATF task forces.
ATF can deputize officers participating in these task forces to
give them federal
authority in conducting gun enforcement operations. This could
bolster strategically
targeted operations to disrupt illicit gun markets, for example.
The reliance of local police on federal prosecution of gun
offenders also reflects the
general laxity with which many gun offenses are treated at the
state level. A problem
commonly cited by police officials is that state-level penalties
are slight for offenses like
illegal gun possession, illegal gun carrying, and even illegal
gun sales (e.g. straw
595
Gun violence
prevention
practices
purchasing) (PERF, 2010). Further, gun charges are often
56. dismissed in plea bargaining
arrangements. Penalties for gun violations are often much more
severe in the federal
system, and the threat of federal prosecution is a key element of
successful gun
violence reduction programs like PSNs. In comments provided
with the survey, police
frequently cited the need for tougher punishment for gun
offenses including illegal
possession and carrying, and some agencies reported that recent
changes to this effect
in their state or local laws had improved their ability to reduce
gun crime. Offenders
and victims involved in serious gun violence often have long
criminal histories,
including prior weapons violations (e.g. Cook et al., 2005;
Kennedy et al., 1996b; Scocas
et al., 1997; Tierney et al., 2001). All of this suggests there may
be a need for state
and local officials – including prosecutors, judges, and
legislators, as well as police – to
treat gun violations of all sorts with greater priority and
severity. Cooperation between
police and state prosecutors to prioritize gun offenders is a
helpful step in this regard
and one that police often rated as highly effective.
To conclude, police are using a wide variety of strategies to
reduce gun violence, and
there are many that they find to be effective. These efforts
could be intensified
and strengthened in various ways that could further enhance the
effectiveness of police
in suppressing gun crime. However, the success of these efforts
will also be tied to the
resources and emphasis given to gun crime by other local, state,
57. and federal officials.
These issues, and others identified in this paper, may provide a
fruitful basis for future
research on police approaches to reducing gun violence.
Notes
1. Calculated from the Federal Bureau of Investigation’s
Uniform Crime Reports statistics
(available at: www.fbi.gov/about-us/cjis/ucr/ucr).
2. The survey was addressed to the chief executive of each
agency (i.e. the chief, commissioner,
or Sheriff) and that person was asked to complete the survey or
to designate an agency
representative to complete the survey. Roughly 70 percent of
the persons that completed the
surveys had a rank of lieutenant or higher and approximately 20
percent were sergeants or
detectives. The remainder consisted primarily of police officers,
planning and research staff,
or crime analysts.
3. In 2007 (the most recent year for which national UCR data
were available at the start of our
study), roughly 56 percent of the nation’s murders, 60 percent
of its gun robberies, and 53
percent of its gun assaults occurred in cities of 1,00,000 or
more people.
4. Based on the size of the population under study, we sought to
achieve at least a 60 percent
response rate in order to obtain estimates with projected 95
percent confidence intervals of
plus or minus 5 percent for the full sample (Van Bennekom,
2002).
58. 5. For these comparisons, we used total homicide rates as a
proxy for gun crime (nationally,
approximately two-thirds of homicides are committed with
guns). In 2009, the total homicide
rates for the responding and non-responding cities (as reported
in the Uniform Crime
Reports) were 8.91 and 5.73, respectively.
6. For this reason, we did not weight the survey data to adjust
for differences between the
responding and non-responding agencies.
7. Laws regarding the issuance of permits to carry concealed
weapons are often referred
to as “shall issue” or “may issue” laws. Shall issue laws require
that police issue permits to
those who pass requirements stipulated in the law (e.g. criminal
history and training
requirements). May issue laws, in contrast, give police
discretion in granting these permits
even when applicants are legally eligible. In may issue
jurisdictions, police may require
596
PIJPSM
36,3
applicants to show good cause of why they need a permit and/or
give greater scrutiny to the
character of applicants (Legal Community Against Violence,
2008).
59. 8. Conducting in-depth legal research on the state and local gun
laws of these jurisdictions
was beyond the scope of our study. As noted, we believed that
local police would have
reasonably accurate knowledge of the workings of these laws in
practice, which can be
complex and ambiguous to discern from the written statutes
(indeed, legal researchers
often seem to disagree in their coding of gun laws). As one
illustration of a rough
external check, 84 percent of the agencies reporting that their
state or locality required
background checks for private sales were in a state that
appeared to have some form
of this regulation according to at least one of a number of
sources including the Legal
Community Against Violence (2008), Vernick and Hepburn
(2003), and the Brady
Campaign to Prevent Gun Violence. The remaining agencies
may have mistakenly
reported that their state or locality had this form of regulation,
or they may have been
alluding to a local statute. Similarly, we examined the reports of
agencies in seven states
that have regulation of private sales according to the Brady
Campaign and at least
one of the other aforementioned legal sources. Among these
agencies, 85 percent reported
that their state or locality had regulation of private sales. To
compensate for potential
respondent error in the gun law measures, we also used a state-
level gun control indicator
in some of the correlational analyses described below. Our other
primary use of the
reported gun law measures was to examine how agencies
enforced the laws that they
60. reported for their jurisdiction.
9. Straw purchasers are legally eligible gun buyers who
purchase guns for ineligible buyers or
gun traffickers.
10. In some states, local police have responsibility for
conducting background checks on
prospective gun buyers (Bureau of Justice Statistics, 2006). In
other states, local police would
need to obtain data on denied gun sales from federal and/or
state authorities. Nationally,
between 1,20,000 and 1,50,000 gun purchase applicants are
typically denied per year
(Bowling et al., 2010).
11. These terms were left open to the respondent’s
interpretation.
12. All agencies reported checking recovered guns against
databases of guns reported stolen to
the Federal Bureau of Investigation’s National Crime
Information System (NCIC).
13. Though not listed in Table IV as an anti-trafficking strategy,
nearly all of the agencies
(91 percent) also attempted to restore obliterated serial numbers
on recovered firearms.
An obliterated serial number is widely recognized as an
indicator that a firearm was illegally
trafficked. However, over half of these agencies (55 percent)
only attempted to restore the
serial numbers of guns that were linked to specific
investigations.
14. Notification meetings entail face-to-face meetings between
61. high-risk groups (i.e. gangs,
probationers, and/or parolees) and a variety of criminal justice
and community representatives,
including local and federal law enforcement and prosecutors,
other criminal justice officials
(e.g. probation and parole authorities), social service providers,
and community members.
In these meetings, practitioners seek to: promise a coordinated
and aggressive law enforcement
response to gun violence; make offenders more visible to law
enforcement and the community,
thus reducing offenders’ sense of anonymity; and offer support
services such as employment
assistance and substance abuse treatment (e.g. see McDevitt et
al., 2006). Available accounts
suggest that these meetings are typically conducted in
cooperation with US Attorneys
through the PSN program or similar efforts. As shown below,
most agencies reported
involvement in multi-agency initiatives like PSN, but these
agencies may not have all taken
active part in notification meetings run by US Attorneys. It is
also possible, however, that some
respondents did not make the connection between PSN and
notification meetings when
answering the survey.
597
Gun violence
prevention
practices
62. 15. In cases where the outcome variable had insufficient
variation across the three usage
response categories (never, occasionally, and
frequently/regularly), we collapsed the
categories into a dichotomy as appropriate and used regular
logistic regression.
16. Even in the high gun crime cities, however, only 13 of the
41 strategies were used on a
frequent/regular basis by a majority of agencies (and only five
were used by 70 percent
or more).
17. Federal regulations require licensed dealers to notify ATF
whenever they sell multiple
handguns to any one individual within five consecutive business
days (Bureau of Alcohol,
Tobacco, Firearms and Explosives (ATF), 1995). These
transactions, referred to as multiple
sales, are considered to be a potential indicator of gun
trafficking (e.g. see ATF, 2000b;
Koper, 2005, 2007).
18. The states in this group include California, New Jersey,
New York, Connecticut, Hawaii,
Maryland, Massachusetts, Michigan, Pennsylvania, Rhode
Island, and Illinois. We based
these selections on the Brady Campaign’s 2008 rankings, which
were closest in time to the
survey period. However, the Brady Campaign’s top rankings
were the same in 2011, giving
consistency to our measure.
19. The effectiveness items also had a response option for
“unknown” effectiveness (agencies
selecting this option were counted among those that did not
63. provide effectiveness ratings).
It is notable in this regard that a substantial minority of
agencies using many of these
strategies had insufficient information to judge the effectiveness
of their practices. This
arguably underscores the need for further evaluation of many
gun violence prevention
practices, a point to which we return in the discussion section.
20. We chose these particular gun laws for this comparison
because their combination would
seem to provide police with some of the most effective tools for
identifying patterns of illegal
gun transfers.
21. The weapons arrests and gun recovery ratios were calculated
for each year and averaged
across years with non-missing values. The strategies ratio
measure is based on the number
of strategies the agencies reported using in 2009 and the
average annual number of violent
gun crimes based on non-missing values from 2006 to 2008. For
the strategies ratio measure,
the strategies were summed regardless of their perceived
effectiveness.
References
Associated Press (2011), “California agents seize 1,200 firearms
from people who cannot legally
own them, say 34,000 remain”, June 16, available at:
www.washingtonpost.com (accessed
June 17, 2011).
Bowling, M., Frandsen, R.J., Lauver, G.A., Boutilier, A.D. and
Adams, D.B. (2010), Background
64. Checks for Firearms Transfers, 2009 – Statistical Tables,
Bureau of Justice Statistics, US
Department of Justice, Washington, DC.
Braga, A.A. (2008), “Pulling levers focused deterrence
strategies and the prevention of gun
homicide”, Journal of Criminal Justice, Vol. 36 No. 4, pp. 332-
343.
Braga, A.A. and Pierce, G.L. (2004), “Linking gun crimes: the
impact of ballistics imaging
technology on the productivity of the Boston police
department’s ballistics unit”, Journal of
Forensic Sciences, Vol. 46 No. 4, pp. 701-706.
Braga, A.A. and Pierce, G.L. (2005), “Disrupting illegal
firearms markets in Boston: the effects of
operation ceasefire on the supply of new handguns to
criminals”, Criminology and Public
Policy, Vol. 4 No. 4, pp. 717-748.
Braga, A.A., Cook, P.J., Kennedy, D.M. and Moore, M.H.
(2002), “The illegal supply of firearms”, in
Tonry, M. (Ed.), Crime and Justice: A Review of Research, The
University of Chicago,
Chicago, IL, Vol. 29, pp. 319-352.
598
PIJPSM
36,3
Braga, A.A., Kennedy, D.M., Waring, E.J. and Piehl, A.M.
(2001), “Problem-oriented policing,
65. deterrence, and youth violence: an evaluation of Boston’s
operation ceasefire”, Journal of
Research in Crime and Delinquency, Vol. 38 No. 3, pp. 195-
225.
Braga, A.A., Pierce, G.L., McDevitt, J., Bond, B.J. and Cronin,
S. (2008), “The strategic prevention
of gun violence among gang-involved offenders”, Justice
Quarterly, Vol. 25 No. 1,
pp. 132-162.
Braga, A.A., Wintemute, G.J., Pierce, G.L., Cook, P.J. and
Ridgeway, G. (2012), “Interpreting
the evidence on illegal gun market dynamics”, Journal of Urban
Health, Vol. 89 No. 5,
pp. 779-793.
Brill, S. (1977), Firearm Abuse: A Research and Policy Report,
Police Foundation, Washington,
DC.
Bureau of Alcohol, Tobacco, Firearms and Explosives (ATF)
(1995), Federal Firearms
Regulations Reference Guide, US Department of the Treasury,
Washington, DC.
Bureau of Alcohol, Tobacco, Firearms and Explosives (ATF)
(2000a), Following the Gun:
Enforcing Federal Firearms Laws Against Firearms Traffickers,
Bureau of Alcohol,
Tobacco, Firearms, US Department of the Treasury,
Washington, DC.
Bureau of Alcohol, Tobacco, Firearms and Explosives (ATF)
(2000b), Crime Gun Trace Reports
(1999): National Report, Bureau of Alcohol, Tobacco, Firearms,
66. US Department of the
Treasury, Washington, DC.
Bureau of Alcohol, Tobacco, Firearms, and Explosives (ATF)
(2002), Crime Gun Trace Reports
(2000): National Report, Bureau of Alcohol, Tobacco, Firearms,
and Explosives, United
States Department of Justice, Washington, DC, available at:
www.atf.gov/firearms/ycgii/
2000/index.htm
Bureau of Alcohol, Tobacco, Firearms, and Explosives (ATF)
(2005), Violent Crime Impact
Teams: Best Practices, Bureau of Alcohol, Tobacco, Firearms,
and Explosives, United
States Department of Justice, Washington, DC, available at:
www.justice.gov/olp/pdf/vcit-
best-practices.pdf
Bureau of Alcohol, Tobacco, Firearms, and Explosives (ATF)
(2012), National Integrated Ballistic
Information Network (NIBIN), Fact Sheet Bureau of Alcohol,
Tobacco, Firearms, and
Explosives, United States Department of Justice, Washington,
DC, available at:
www.atf.gov/publications/factsheets/factsheet-nibin.html
Bureau of Justice Assistance (2000), Reducing Illegal Firearms
Trafficking: Promising Practices
and Lessons Learned, US Department of Justice, Washington,
DC.
Bureau of Justice Statistics (2006), Survey of State Procedures
Related to Firearm Sales, 2005, US
Department of Justice, Washington, DC.
67. Bynum, T.S. and Varano, S.P. (2003), “The anti-gang initiative
in Detroit: an aggressive
enforcement approach to gangs”, in Decker, S. (Ed.), Policing
Gangs and Youth Violence,
Wadsworth, Belmont, CA, pp. 214-238.
Callahan, C., Rivara, F. and Koepsell, T. (1996), “Money for
guns: evaluation of the Seattle gun
buy-back program”, in Plotkin, M.R. (Ed.), Under Fire: Gun
Buy-Backs, Exchanges, and
Amnesty Programs, Police Executive Research Forum,
Washington, DC, pp. 81-96.
Center to Prevent Handgun Violence (1998), On the Front Line:
Making Gun Interdiction Work,
Center to Prevent Handgun Violence, Washington, DC.
Chipman, D.H. and Pappas, C.E. (2006), Violent Crime Impact
Teams (VCIT) Initiative: Focus on
Partnerships, Office of Community Oriented Policing Services,
US Department of Justice,
Washington, DC.
Cohen, J and Ludwig, J. (2003), “Policing crime guns”, in
Ludwig, J. and Cook, P.J. (Eds),
Evaluating Gun Policy: Effects on Crime and Violence,
Brookings Institution Press,
Washington, DC, pp. 217-250.
599
Gun violence
prevention
practices
68. Cohen, M.A., Rust, R.T., Steen, S. and Tidd, S.T. (2004),
“Willingness-to-pay for crime control
programs”, Criminology, Vol. 42 No. 1, pp. 89-109.
Connolly, E. and Luo, M. (2011), “States struggle to disarm
people who’ve lost right to own guns”,
New York Times, February 5, p. A1, available at:
www.nytimes.com (accessed February 8,
2011).
Cook, P.J. and Ludwig, J. (2000), Gun Violence: The Real
Costs, Oxford University Press, New
York, NY.
Cook, P.J., Ludwig, J. and Braga, A.A. (2005), “Criminal
records of homicide offenders”, JAMA,
Vol. 294 No. 5, pp. 598-601.
Decker, S.H. and Rosenfeld, R. (2004), Reducing Gun Violence:
The St. Louis Consent-to-Search
Program, National Institute of Justice, US Department of
Justice, Washington, DC.
Delaware Statistical Analysis Center (1998), The Impact of
Operation Safe Streets on Shootings in
Wilmington, State of Delaware, Dover, DE.
Dunworth, T. (2000), National Evaluation of the Youth
Firearms Violence Initiative, NCJ-184482
National Institute of Justice, US Department of Justice,
Washington, DC.
Hahn, R.A., Bilukha, O.O., Crosby, A., Fullilove, M.T.,
Liberman, A., Moscicki, E.K., Snyder, S.,
69. Tuma, F. and Briss, P. (2003), “First reports evaluating the
effectiveness of strategies for
preventing violence: firearms laws”, Morbidity and Mortality
Weekly Report, Vol. 52
No. RR-14, pp. 11-20.
Hoskins, A.W. (2001), “Armed Americans: the impact of
firearm availability on national homicide
rates”, Justice Quarterly, Vol. 18 No. 3, pp. 569-592.
International Association of Chiefs of Police (IACP) (2008),
Taking a Stand: Reducing Gun
Violence in Our Communities, Author, Alexandria, VA.
International Association of Chiefs of Police (IACP) (2011),
Reducing Gun Violence in Our
Communities: A Leadership Guide for Law Enforcement on
Effective Strategies and
Programs, Author, Alexandria, VA.
Kennedy, D., Piehl, A. and Braga, A. (1996a), “Gun buy-backs:
where do we stand and where do
we go?”, in Plotkin, M.R. (Ed.), Under Fire: Gun Buy-Backs,
Exchanges, and Amnesty
Programs, Police Executive Research Forum, Washington, DC,
pp. 141-174.
Kennedy, D.M., Piehl, A.M. and Braga, A.A. (1996b), “Youth
violence in Boston: gun markets,
serious youth offenders, and a use-reduction strategy”, Law and
Contemporary Problems,
Vol. 59 No. 1, pp. 147-196.
Koper, C.S. (2005), “Purchase of multiple firearms as a risk
factor for criminal gun use:
implications for gun policy and enforcement”, Criminology and
70. Public Policy, Vol. 4 No. 4,
pp. 749-778.
Koper, C.S. (2007), “Crime gun risk factors: buyer, seller,
firearm, and transaction characteristics
associated with criminal gun use and trafficking”, report to the
National Institute of
Justice, Jerry Lee Center of Criminology, University of
Pennsylvania, Philadelphia, PA,
available at: www.ncjvs.gov/pdffiles1/nij/grants/221074.pdf
Koper, C.S. and Mayo-Wilson, E. (2006), “Police crackdowns
on illegal gun carrying: a systematic
review of their impact on gun crime”, Journal of Experimental
Criminology, Vol. 2 No. 2,
pp. 227-261.
Koper, C.S., Hoffmaster, D., Luna, A., McFadden, S. and
Woods, D. (2010), Developing a St. Louis
Model for Reducing Gun Violence: A Report from the Police
Executive Research Forum to
the St. Louis Metropolitan Police Department, Police Executive
Research Forum,
Washington, DC.
Legal Community Against Violence (2008), Regulating Guns in
America: An Evaluation and
Comparative Analysis of Federal, State and Selected Local Gun
Laws, Legal Community
Against Violence, San Francisco, CA.
600
PIJPSM
36,3
71. McDevitt, J., Decker, S.H., Hipple, N.K., McGarrell, E.F.,
Klofas, J. and Bynum, T. (2006), Offender
Notification Meetings: Case Study 2, Project Safe
Neighborhoods: Strategic Interventions,
US Department of Justice, Washington, DC.
McGarrell, E.F., Chermak, S., Weiss, A. and Wilson, J. (2001),
“Reducing firearms violence
through directed police patrol”, Criminology and Public Policy,
Vol. 1 No. 1, pp. 119-148.
McGarrell, E.F., Chermak, S., Wilson, J.M. and Corsaro., N.
(2006), “Reducing homicide through
a ‘lever-pulling’ strategy”, Justice Quarterly, Vol. 23 No. 2, pp.
214-231.
McGarrell, E.F., Corsaro, N., Hipple, N.K. and Bynum, T.S.
(2010), “Project safe neighborhoods
and violent crime trends in US cities: assessing violent crime
impact”, Journal of
Quantitative Criminology, Vol. 26 No. 2, pp. 165-190.
McGarrell, E.F., Hipple, N.K., Corsaro, N., Bynum, T.S., Perez,
H., Zimmerman, C.A. and Garmo,
M. (2009), “Project safe neighborhoods – a national program to
reduce gun crime: final
project report”, report to the National Institute of Justice, US
Department of Justice, School
of Criminal Justice, Michigan State University, East Lansing,
MI.
National Research Council (NRC) (2005), Firearms and
Violence: A Critical Review, National
Academies Press, Washington, DC.
72. Office of Juvenile Justice and Delinquency Prevention (OJJDP)
(1999), Promising Strategies to
Reduce Gun Violence, United States Department of Justice,
Washington, DC.
Papachristos, A.V., Meares, T.L. and Fagan, J. (2007),
“Attention felons: evaluating project safe
neighborhoods in Chicago”, Journal of Empirical Legal Studies,
Vol. 4 No. 2, pp. 223-272.
Police Executive Research Forum (PERF) (2010), Guns and
Crime: Breaking New Ground by
Focusing on the Local Impact, Author, Washington, DC.
Ridgeway, G., Braga, A.A., Tita, G. and Pierce, G.L. (2011),
“Intervening in gun markets: an
experiment to assess the impact of targeted gun-law
messaging”, Journal of Experimental
Criminology, Vol. 7 No. 1, pp. 103-109.
Roehl, J., Rosenbaum, D.P., Costello, S.K., Coldren, J.R. Jr,
Schuck, A.M., Kunard, L. and Forde, D.R.
(2006), “Strategic approaches to community safety initiative
(SACSI) in 10 US cities: the
building blocks for project safe neighborhoods”, report to the
National Institute of Justice,
Center for Research in Law and Justice, University of Illinois,
Chicago, IL.
Roehl, J., Rosenbaum, D.P., Costello, S.K., Coldren, J.R. Jr,
Schuck, A.M., Kunard, L. and Forde, D.R.
(2008), Paving the Way for Project Safe Neighborhoods: SACSI
in 10 US Cities, National
Institute of Justice, US Department of Justice, Washington, DC.
73. Romero, M.P., Wintemute, G.J. and Vernick, J.S. (1998),
“Characteristics of a gun exchange
program, and an assessment of potential benefits”, Injury
Prevention, Vol. 4 No. 3,
pp. 206-210.
Rosenfeld, R. (1996), “Gun buy-backs: crime control or
community mobilization?”, in Plotkin,
M.R. (Ed.), Under Fire: Gun Buy-Backs, Exchanges, and
Amnesty Programs, Police
Executive Research Forum, Washington, DC, pp. 1-28.
Scocas, E., Harris, R., Huenke, C. and Cecere, L. (1997),
Wilmington Shootings 1996: A
Comparative Study of Victims and Offenders in Wilmington,
Delaware, Statistical Analysis
Center and Criminal Justice Council, State of Delaware, Dover,
DE.
Sheppard, D., Grant, H., Rowe, W. and Jacobs, N. (2000),
Fighting Juvenile Gun Violence,
Office of Juvenile Justice and Delinquency Prevention, US
Department of Justice,
Washington, DC.
Sherman, L.W. (1997), “Policing for crime prevention”, in
Sherman, L.W., Gottfredson, D.,
MacKenzie, D., Eck, J., Reuter, P. and Bushway, S. (Eds),
Preventing Crime: What Works,
What Doesn’t, What’s Promising: A Report to the United States
Congress, Department
of Criminology and Criminal Justice, University of Maryland,
College Park, MD,
pp. 8-1 to 8-65.
601
74. Gun violence
prevention
practices
Sherman, L.W. (2000), “Gun carrying and homicide
prevention”, JAMA, Vol. 283 No. 9,
pp. 1193-1195.
Sherman, L.W. and Bridgeforth, C. (1994), Getting Guns off the
Streets, 1993: A Survey of Big-City
Police Agencies, Crime Control Institute, Washington, DC.
Sherman, L.W. and Eck, J.E. (2002), “Policing for crime
prevention”, in Sherman, L.W.,
Farrington, D.P., Welsh, B.C. and MacKenzie, D.L. (Eds),
Evidence-Based Crime Prevention,
Routledge, New York, NY, pp. 295-329.
Sherman, L.W. and Rogan, D.P. (1995), “Effects of gun seizures
on gun violence: ‘hotspots’ patrol
in Kansas City”, Justice Quarterly, Vol. 12 No. 4, pp. 673-693.
Sorenson, S.B. and Vittes, K.A. (2003), “Buying a handgun for
someone else: firearm dealer
willingness to sell”, Injury Prevention, Vol. 9 No. 2, pp. 147-
150.
Tierney, J.P., McClanahan, W.S. and Hangley, B. Jr (2001),
Murder is No Mystery: An Analysis of
Philadelphia Homicides, 1996-1999, Public/Private Ventures,
Philadelphia, PA.
75. Tita, G., Riley, J.K., Ridgeway, G., Grammich, C., Abrahamse,
A.F. and Greenwood, P.W. (2003),
Reducing Gun Violence: Results from an Intervention in East
Los Angeles, RAND,
Santa Monica, CA.
Truman, J.L. (2011), Criminal Victimization, 2010, Bureau of
Justice Statistics, US Department of
Justice, Washington, DC.
Van Bennekom, F.C. (2002), Customer Surveying: A Guidebook
for Service Managers, Customer
Service Press, Bolton, MA.
Vernick, J.S. and Hepburn, L.M. (2003), “State and federal gun
laws: Trends for 1970-99”, in
Ludwig, J. and Cook, P.J. (Eds) Evaluating Gun Policy: Effects
on Crime and Violence,
Brookings Institution Press, Washington, DC, pp. 345-411.
Villaveces, A., Cummings, P., Espitia, V.E., Koepsell, T.D.,
McKnight, B. and Kellerman, A.L.
(2000), “Effect of a ban on carrying firearms on homicide rates
in 2 Columbian cities”,
JAMA, Vol. 283 No. 9, pp. 1205-1209.
Webster, D.W., Vernick, J.S. and Bulzacchelli, M.T. (2006b),
“Effects of a gun dealer’s change in
sales practices on the supply of new guns to criminals”, Journal
of Urban Health, Vol. 83
No. 5, pp. 778-787.
Webster, D.W., Vernick, J.S. and Bulzacchelli, M.T. (2009),
“Effects of state-level firearm seller
accountability policies on firearm trafficking”, Journal of Urban
Health, Vol. 86 No. 4,
76. pp. 525-537.
Webster, D.W., Bulzacchelli, M.T., Zeoli, A.M. and Vernick,
J.S. (2006a), “Effects of undercover
police stings of gun dealers on the supply of new guns to
criminals”, Injury Prevention,
Vol. 12 No. 4, pp. 225-230.
Wright, M.A. and Wintemute, G.J. (2010), “Felonious or violent
criminal activity that prohibits
gun ownership among prior purchasers of handguns: incidence
and risk factors”, The
Journal of Trauma, Vol. 69 No. 4, pp. 948-955.
Zimring, F.E. and Hawkins, G. (1997), Crime Is Not the
Problem: Lethal Violence in America,
Oxford University Press, New York, NY.
Further reading
Harlow, C.W. (2001), Firearm Use by Offenders, Bureau of
Justice Statistics, US Department of
Justice, Washington, DC.
About the authors
Dr Christopher S. Koper (PhD, Criminology and Criminal
Justice, University of Maryland) is an
Associate Professor in the Department of Criminology, Law and
Society at George Mason
602
PIJPSM
36,3
77. University. He is also a senior fellow and co-director of the
evidence-based policing research
program in George Mason’s Center for Evidence-Based Crime
Policy. Dr Koper was formerly the
Director of Research at the Police Executive Research Forum
and has also worked for
organizations including the University of Pennsylvania, the
Urban Institute, the Rand Corporation,
and the Police Foundation. He specializes in issues related to
policing and firearms policy.
Christopher S. Koper is the corresponding author and can be
contacted at: [email protected]
Daniel J. Woods is a Research Associate at the Police Executive
Research Forum (PERF).
While at PERF he has worked on survey construction, data
management and analysis in
different areas of law enforcement. Prior to joining PERF, he
worked as a Research Specialist
with the Jerry Lee Center of Criminology at the University of
Pennsylvania. He was primarily
responsible for analyzing data from the Reintegrative Shaming
Experiments (RISE), conducted
in Canberra, Australia. He received a M.A. in Criminology &
Criminal Justice from the University
of Maryland and his PhD in Criminology from the University of
Pennsylvania.
Bruce Kubu is a Senior Research Associate at the Police
Executive Research Forum (PERF)
and has been with PERF since 1999. He has over 16 years of
experience in the field dealing with
survey methodology. On behalf of PERF, Kubu directs the Law
Enforcement Center for Survey
Research (LECSR). He has managed numerous projects since
78. joining PERF, including dozens of
projects involving surveys. Prior to joining PERF, Kubu worked
at the Washington/Baltimore
High Intensity Drug Trafficking Area (W/B HIDTA), which is
part of the Office of National
Drug Control Policy. He earned his Master’s degree in
Criminology from the University
of Maryland.
To purchase reprints of this article please e-mail:
[email protected]
Or visit our web site for further details:
www.emeraldinsight.com/reprints
603
Gun violence
prevention
practices
Reproduced with permission of the copyright owner. Further
reproduction prohibited without
permission.
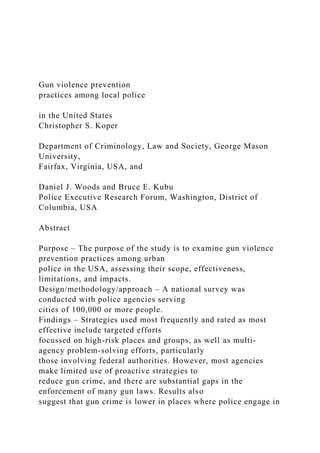
![more intensive gun-related
enforcement and prevention efforts.
Research limitations/implications – The survey focussed only
on large US cities. Implementation
of the strategies could not be examined in detail, and
assessments of the effectiveness of strategies
reflect the views of practitioners. There is a need for more in-
depth research on gun-related
enforcement and prevention practices, their effectiveness, and
the organizational and environmental
factors that facilitate or hinder them.
Practical implications – The study highlights strategies that
should be given priority consideration
in policy decisions. The findings also suggest that police efforts
to address gun crime can be enhanced
considerably – and that doing so may produce demonstrable
reductions in gun crime. Further
examination of policy changes necessary to facilitate these
efforts is warranted.
Originality/value – This study represents the first national
survey of gun violence reduction efforts
by police in the USA.
Keywords Police, Firearms, Violence, Enforcement, Prevention,
National, Survey, Urban,
Effectiveness, USA
Paper type Research paper
Introduction
Controlling gun crime continues to be a difficult challenge for
policymakers and
practitioners in the USA. In 2010, there were nearly 10,000
murders with firearms in
the USA[1] and another 3,38,000 non-fatal violent crimes with
guns (Truman, 2011).](data:image/gif;base64,R0lGODlhAQABAIAAAAAAAP///yH5BAEAAAAALAAAAAABAAEAAAIBRAA7)