Data Visualization Project Schedule
•
0 likes•210 views

This 3-page document outlines the steps and timeline for Project 3. It includes: 1. An estimated 12 hours to complete the project, broken into 4 steps over 3 hours each. 2. The first step involves reviewing materials on data visualization and choosing a data set. 3. The second step has students create an outline and wireframe for an infographic. 4. Step three is to create the infographic using provided options. 5. The final step involves creating a screencast to justify design choices. All deliverables are due by Sunday at 11:59 PM and must be submitted through the online portal.

Recommended
Recommended
More Related Content
What's hot
What's hot (15)
Similar to Data Visualization Project Schedule
Similar to Data Visualization Project Schedule (20)
More from Victoria Arthur
More from Victoria Arthur (20)
Recently uploaded
Recently uploaded (20)
Data Visualization Project Schedule
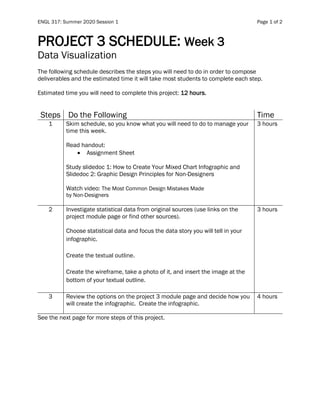
- 1. ENGL 317: Summer 2020 Session 1 Page 1 of 2 PROJECT 3 SCHEDULE: Week 3 Data Visualization The following schedule describes the steps you will need to do in order to compose deliverables and the estimated time it will take most students to complete each step. Estimated time you will need to complete this project: 12 hours. Steps Do the Following Time 1 Skim schedule, so you know what you will need to do to manage your time this week. Read handout: • Assignment Sheet Study slidedoc 1: How to Create Your Mixed Chart Infographic and Slidedoc 2: Graphic Design Principles for Non-Designers Watch video: The Most Common Design Mistakes Made by Non-Designers 3 hours 2 Investigate statistical data from original sources (use links on the project module page or find other sources). Choose statistical data and focus the data story you will tell in your infographic. Create the textual outline. Create the wireframe, take a photo of it, and insert the image at the bottom of your textual outline. 3 hours 3 Review the options on the project 3 module page and decide how you will create the infographic. Create the infographic. 4 hours See the next page for more steps of this project.
- 2. ENGL 317: Summer 2020 Session 1 Page 2 of 2 Steps Do the Following Time 4 Review the options on the project 2 module page and decide how you will create the screencast. Do a test recording. If you encounter a technical issue, follow the troubleshooting steps below the options. Study slidedoc 3: How to Create Your Screencast to Justify Design Choices. Follow the requirements and guidelines in slidedoc 3 to write the script, practice it, and record your screencast. 2 hours PROJECT 3 DELIVERABLES DUE: Sunday 6/6 before 11:59 PM Submit your work to the project 3 submissions drop box as follows: 1. Self-Evaluation: submit a Word or PDF file. Note: you are not required to write a self- evaluation, but it is to your benefit to write one. If you wrote one, cut and paste the URL at the top of your self-evaluation or in the comment section of the drop box. 2. Process Work: • Textual Outline, submit a Word or PDF document file. • Wireframe, insert the photo at the bottom of your textual outline. 3. Deliverable 1: Infographic, submit an image (jpg, png) file, PDF, Word, PPT, or the URL address if your infographic is hosted in the cloud. You may cut and paste the URL in the comment box or your self-evaluation. 4. Deliverable 2: Screencast Design Justification, submit the URL address where your digital media file is hosted. You may cut and paste the URL in the comment box or your self-evaluation. 5. To avoid a point penalty, verify your submission.
- 3. ENGL 317: Summer 2020 Session 1 Page 3 of 2 This page has been left intentionally blank.