SlideShare a Scribd company logo
1 of 33
2/2/2019 Internal Analysis: Strengths, Weaknesses, and
Competitive Advantage
https://edugen.wileyplus.com/edugen/courses/crs12076/ebook/c
03/dyer9781119411697c03xlinks.xform?id=c03-sec-7026 1/10
CASE 3
ESPN in 2015
Continued Dominance in Sports Television?
“If you're a fan, what you'll see in the next minutes, hours, and
days to follow may convince you, you've gone to sports
heaven.”
—Lee Leonard, September 7, 1979. The first on-air words at
ESPN
John Skipper, president and CEO of ESPN since 2012, sat at his
desk and intently reviewed comments by Bob Iger, Disney CEO,
and his direct boss,
during last night's earnings call: “I'd like to address an issue
that has been receiving a fair amount of interest and attention
these days and that's the
rapidly changing media landscape especially as it relates to
ESPN. We are realists about the business and about the impact
technology has had on how
product is distributed, marketed, and consumed. We are also
quite mindful of potential trends among younger audiences, in
particular many of whom
consume television in very different ways than the generations
before them … ESPN is the number one brand in sports media
and one of the most
valuable brands in all sports and among the most popular,
respected and valuable brands in media, by consumers,
advertisers, and distributors. This is
supported by the fact that in the first calendar quarter of this
year alone, 83% of all multichannel households turn to ESPN at
some point.”
As Skipper looked up, his eyes focused on ESPN's newest
building at the sprawling 200-plus acre Bristol, Connecticut
campus, DC-2. DC-2 was
ESPN's 18th building and featured the state of the art in
television broadcasting, with 194,000 square feet, 114
television screens and monitors, 1,100
miles of copper wire, the ability to broadcast SportsCenter in 4
K, 8 K, 3-D, and even a floating “CableCam” that treated
visitors to an NFL playing
field experience. He reflected on the vast size of ESPN's
current campus, remembering that ESPN originated from
temporary trailers on a less than a
single acre in 1979.
Skipper's mind raced forward, wondering if and how this new
investment would pay off in a world with almost overwhelming
technological risk to
media companies. When sports news traveled instantaneously
over Twitter and social media, and with the rise of free video
streaming, Skipper
wondered about ESPN's relevance, competitive advantage, and
revenue stream. Was ESPN ready for the next wave of
disruption? How could ESPN
maintain and grow its dominant position in sports
programming?
The Beginning
The idea that gave birth to ESPN hatched over two days, May
30–31, 1978. Bill Rasmussen, an ex-collegiate baseball player
and sports nut, had just
been fired as the communications director for the New England
(Hartford) Whalers hockey club. As Bill and his son Scott sat
around the house the
night of May 30, Bill discussed a vague set of ideas about using
the new technology of cable TV to broadcast New England
sports. The next day Bill
and Scott watched intently as two of their associates played
videotapes of local hot air balloons and spoke about a local
show broadcasting live sports.
Suddenly, Rasmussen blurted out an idea: “What about live
sports? Just Connecticut sports on cable. Could we do that?”
The new dream proved exciting, but Rasmussen lacked three
critical resources: access to the satellite technology to provide a
cable feed, programming
content to fill the airwaves, and money to make the whole
project work. Cable TV was a nascent industry mostly limited to
rural viewers, and RCA
Corporation had launched a communications satellite three
years earlier in hopes of selling transponder time to buyers
hoping to reach the cable
market. By mid-1978, RCA was desperate to find buyers.
Rasmussen approached RCA about buying transponder time for
five hours per night. The
price? $1,250 per night. Al Parinello, the RCA salesman, told
Rasmussen that he could lease another transponder, one that
would provide the buyer
with 24/7 transmission capability for $35,000 per month.
Rasmussen's network could broadcast all day and night for less
than it could for five hours
per day. The new network would be Rasmussen's (and other
fans') dream: all sports, all the time.
Realizing that 24/7 programming would outstrip every event in
Connecticut, Rasmussen worked his relationship with John
Toner, the University of
Connecticut's athletic director. Toner put Rasmussen in touch
with Walt Byers, the powerful head of the NCAA. Rasmussen's
proposal to the NCAA
outlined the network's, now named Entertainment and Sports
Programming TV (ESP-TV), early strategy:
ESP-TV intends to complement rather than compete with
current NCAA television contractual agreements. We propose to
extend football's national
television coverage to more schools and to add many other
sports, including every championship, to our nationwide
network … [ESP-TV will] provide
national exposure to more institutions and student athletes than
ever before possible…. ESP-TV proposes to work very closely
with the NCAA to
develop schedules in all sports that will maximize our mutually
stated goals.
The NCAA held out, partially because Byers didn't believe that
Rasmussen's network would see the light of day. Bill and Scott
had convinced several
local backers to throw in money, and they had maxed out their
own personal credit cards to start the venture. J. B. Doherty,
one of those investors,
contacted Stuart Evey, vice president of Getty Oil's diversified
division. Evey, a huge sports fan and astute investor, saw the
opportunity in cable and
convinced Getty to invest $10 million into the fledgling ESP-
TV. On the day in February 1979 that Getty Oil invested,
Rasmussen closed the deal with
1
2
3
4
5
2/2/2019 Internal Analysis: Strengths, Weaknesses, and
Competitive Advantage
https://edugen.wileyplus.com/edugen/courses/crs12076/ebook/c
03/dyer9781119411697c03xlinks.xform?id=c03-sec-7026 2/10
the NCAA. With the addition of a $1.38 million advertising
contract from Anheuser-Busch, brewers of Budweiser beer, the
new network, rechristened
as ESPN, was ready to launch.
Evey soon realized that making ESPN successful would require
more than Bill Rasmussen's vision and sales abilities. Evey
recruited Chet Simmons,
who had helped launch ABC's Wide World of Sports and
currently the head of NBC's sports, to lead the new network.
Simmons raided NBC for other
talent, none more important than Scotty Connal, a thirty-year
NBC veteran and excellent producer. Connal would use all of
his skills to stretch ESPN's
meager resources to bring a champagne product to market on a
beer budget. Connal taught his staff to make two cameras do the
work of five. Connal
exemplified the new hires, and the hiring policy, at ESPN. The
first question for potential hires: “What section of the
newspaper do you read first?” If
the answer wasn't the sports section, the interview often ended.
If sports was first, the next questions dealt with the greatest
successes and heartaches
of the candidate's favorite teams. If the new network delivered
content to sports fanatics, that content would be produced,
directed, and delivered by
sports fanatics.
Rasmussen's initial pitch to the NCAA became the bedrock of
ESPN's search for content. Shut out from the “big time” of
sports—the NFL, the
NCAA's best football games, Major League Baseball, and the
NBA—ESPN filled the airwaves with all types of NCAA sports,
from expanded football
coverage, including every bowl game not televised by the major
networks, to volleyball to hockey to Division III events. The
new network took other
big risks, reaching out to underserved sports fans like NASCAR
fans, contracting to broadcast NASCAR events in 1981.
Simmons convinced the
NFL, whose owners had rejected a cable contract to televise
games by a vote of 32-0, to allow ESPN to broadcast the annual
NFL draft in April 1980.
Roger Werner, ESPN's third CEO, reflected on this early
strategy: “I think one of the smartest things the company did in
the early days was to look at
the marketplace and ask ourselves: Where can we build
consumer franchises that are really unique and where none of
the big competitors are playing
to any significant degree?…. We carved out a lot of new
territory.” The new network, even with taped-delay games and
a schedule filled with minor
sporting events, continued to gain a loyal and growing viewer
base among sports fans. In fact, by 1982 the network had been
named in a divorce suit
by a woman in Texas who claimed ESPN ruined her marriage by
capturing the entire attention of her husband.
The 1980s and 1990s: Growth and Expansion
ESPN continued to gain viewers, content, and advertisers, but
Getty Oil still pumped money into the venture. By 1984, Getty
would invest a total of
$67 million to keep the venture afloat. Chet Simmons left ESPN
to run a new professional football league, the USFL, in 1982.
Bill Grimes, a former
CBS executive, took the helm at ESPN. That same year, Evey
hired McKinsey and Company to help figure out how to make
the business profitable.
Roger Werner acted as lead consultant on that engagement.
ESPN originally hoped to attract viewers on an individual
subscription basis, but the small
numbers of cable viewers in the late 1970s doomed this revenue
model before it launched. ESPN viewed itself as a nationwide
network, and so it
adopted the business model common in the Big 3 (ABC, CBS,
and NBC) networks: the network paid local affiliates a small fee
for the right to
transmit its content to the local station, and the bulk of revenue
came from advertising.
Werner realized that ESPN had one revenue source
(advertising), but three cost sources (programming costs, off-
camera costs, and the affiliate fee).
He proposed a new model: If ESPN could “flip” the affiliate fee
and get cable providers to pay the network for the right to carry
it to viewers, then
ESPN could use the new revenue to improve the breadth and
quality of its content. Werner and Grimes bet that a better
product would attract more
viewers to cable, and both the providers and ESPN would
benefit. In 1983, ESPN began charging providers $0.05 per
subscriber per month. The fee
rose rapidly, first to $0.20 per month, and reached $0.70 per
month by the end of the decade. With its newfound revenue,
ESPN turned a profit by
1985. Exhibit 1 displays ESPN's financial data, including its
subscription fees. Figure 1 illustrates long-term financial trends
at ESPN.
ESPN only, all numbers in 000s
1990 1995 2000 2005 2010 2011 2012 2013 2014
2015
(est)
Net
Advertising
Revenue
240,000 395,000 825,000 1,117,695 1,585,184 1,691,694
1,769,830 1,868,350 1,950,389 2,079,281
Affiliate
Revenue
295,944 524,649 1,080,294 3,307,567 5,235,612 5,693,335
5,972,561 6,501,108 7,007,944 7,506,226
Other
Operating
Revenue
15,000 80,000 108,000 83,338 33,163 78,993 71,093 75,359
30,144 31,952
Net
Operating
Revenue
550,944 999,649 2,013,294 4,508,600 6,853,959 7,464,021
7,813,484 8,444,817 8,988,477 9,617,459
6
7
2/2/2019 Internal Analysis: Strengths, Weaknesses, and
Competitive Advantage
https://edugen.wileyplus.com/edugen/courses/crs12076/ebook/c
03/dyer9781119411697c03xlinks.xform?id=c03-sec-7026 3/10
ESPN only, all numbers in 000s
1990 1995 2000 2005 2010 2011 2012 2013 2014
2015
(est)
Operating
SG&A
94,400 162,300 216,710 235,217 264,310 267,548 260,859
271,555 279,701 288,092
Programming
Expense
321,000 539,397 1,212,200 3,086,272 4,746,929 4,984,276
5,333,175 5,706,497 6,230,952 6,729,428
Total
Operating
Expense
415,400 701,697 1,428,910 3,321,489 5,011,239 5,251,824
5,594,034 5,978,052 6,510,653 7,017,520
Cash Flow
($000)
135,544 297,952 584,384 1,187,111 1,842,720 2,212,197
2,219,450 2,466,765 2,477,823 2,599,938
Affiliate
Revenue per
Average
Subscriber
per Month
($)
0.44 0.67 1.14 3.08 4.39 4.77 5.04 5.54 6.10 6.61
Change in
Subscription
Rate
52.3% 70.1% 170.2% 42.5% 8.7% 5.7% 9.9% 10.1% 8.4%
Subscribers
(millions)
57.3 68 80.5 90.1 99.8 99 98.5 97 94.6 94.5
Change in
Total
Subscribers
19% 18% 12% 11% –1% –1% –2% –2% –0.1%
Source: SNL
Kagan
1990 1995 2000 2005 2010 2011 2012 2013 2014 2015
(est)
Net
Operating
Revenue
550,944 999,649 2,013,294 4,508,600 6,853,959 7,464,021
7,813,484 8,444,817 8,988,477 9,617,459
Total
Operating
Expense
415,400 701,697 1,428,910 3,321,489 5,011,239 5,251,824
5,594,034 5,978,052 6,510,653 7,017,520
Cash Flow
($000)
135,544 297,952 584,384 1,187,111 1,842,720 2,212,197
2,219,450 2,466,765 2,477,823 2,599,938
Exhibit 1ESPN Selected Financial Data
2/2/2019 Internal Analysis: Strengths, Weaknesses, and
Competitive Advantage
https://edugen.wileyplus.com/edugen/courses/crs12076/ebook/c
03/dyer9781119411697c03xlinks.xform?id=c03-sec-7026 4/10
Figure 1ESPN Financial Performance, 1990–2015
ESPN continued to search for new and innovative content
throughout the late 1980s and early 1990s. The network
broadcast the finals of the
America's Cup yachting race in 1983 and broadcast the entire
event in 1987 from Australia. ESPN placed a mini-cam and live
microphones on
American skipper Dennis Connor's yacht to capture the
excitement and intensity of the race. Viewed as a risky venture
in 1987, new camera angles,
“mic'd up” athletes, and complete coverage soon became the
norm in cutting-edge sports television.
ESPN contracted with the NFL in 1987 to broadcast eight games
per year for $55 million per game: The network had arrived in
the Big Time! Within
10 years, the network would hold broadcast rights for every
major professional league and sport in the United States, and
other global leagues. Exhibit
2 presents a timeline of many of these key events. The network
continued to expand its content offerings and its international
presence as well. By the
early 1990s, a viewer could find some form of ESPN in 120
countries. In 1993, ESPN founded the ESPYs, the sporting
world's version of the
Academy Awards. The show became an instant hit and has
provided many memorable moments, such as cancer-stricken
NCAA basketball coach Jim
Valvano's moving speech in 1993.
Date President Owner Growth Notable
1979 Getty Oil $10MM investment grows to $67MM
1979 Chet Simmons Started ABC's Wide World of Sports
1980 NFL Draft Coverage First entry into NFL programming
1981 NASCAR Contract Brings NASCAR to national scene
1983 Bill Grimes Former CBS executive
1984 ABC Buys ESPN for $237MM
1987 Americas Cup First “mic'd up” performer
1987 First NFL Contract $55MM per game for 8 games/year
1988 Roger Werner Architect of business model change
1990 Steve Bornstein Started at ESPN in 1980
1992 ESPN Radio Sports Talk Radio
1993 ESPN2 X-Games, new demographic
1993 ESPYs Sporting equivalent to Academy Awards
1994 ESPN.com Original Web Presence
8
9
2/2/2019 Internal Analysis: Strengths, Weaknesses, and
Competitive Advantage
https://edugen.wileyplus.com/edugen/courses/crs12076/ebook/c
03/dyer9781119411697c03xlinks.xform?id=c03-sec-7026 5/10
Date President Owner Growth Notable
1996 Disney ESPN Valued at $5BB of $19BB purchase
1996 ESPNews News & entertainment
1997 ESPN Classic Archived Sporting Events
1998 George Bodenheimer Begins at ESPN as mail clerk
1998 ESPN the Magazine Compete with Sports Illustrated
1998 ESPN Zone Restaurants
2001 ESPN Deportes Spanish Language Channel & Radio
2002 ESPN+ Expansion to South America
2005 ESPNU Focus on Collegiate Sports
2008 ESPN Films Scripted Drama, Documentary
2011 Grantland.com Journalistic website and blog posts
2011 Longhorn Network First entry into regional TV markets
2012 John Skipper Founded ESPN The Magazine
2014 SEC Network Focus on SEC Sporting Events
2014 Disney ESPN valued at $50BB
Sources: Case writer compilation from sources in footnotes
Exhibit 2ESPN Selected Timeline of Key Events
By decade's end, the E (entertainment) in ESPN would expand
as the network created a new division, ESPN films, to create
original content, both
documentary and dramatic. The division's first project was the
Sports Century series. The project began with a panel of forty-
eight experts who
identified the top 100 athletes of the twentieth century. Sports
Century created fifty 30-minute documentaries on the top 50
athletes and events. ESPN
supplemented these films with complementary materials on its
website, magazine, radio network, and across all other media
platforms in the company.
The series garnered an Emmy for the network and its first
Peabody Award for excellence in radio and television
broadcasting. More importantly,
Sports Century turned a profit and highlighted the power of
ESPN's integrated media empire in bringing content to viewers.
SportsCenter and the ESPN Brand
At the center of that sprawling empire lay ESPN's initial
program. What began in 1979 as Sports Central had morphed
into SportsCenter, the heart and
soul of ESPN's value proposition and business culture. George
Grande and Lee Leonard, decked out in orange sport coats on an
orange set—to
highlight the ownership of Getty Oil—ad libbed most of the
first 30-minute segment because few people really imagined that
a sports report, usually
limited to two minutes at the end of a newscast, could find
enough content to fill 30 minutes. By the time Keith Olbermann
and Dan Patrick turned
SportsCenter into must-see-TV, their 30-minute segment would
be repeated four to six times each day with little loss in
viewership.
The appeal of a 30-minute sports show appealed to sports
broadcasters because they loved the idea of plying their trade
for 10 to 15 times the amount
of time they were allowed at local stations. Thirty minutes
provided ample time to report the news, but also to provide
analysis, deeper stories, and
ample doses of humor. From Leonard and Grande onward,
SportsCenter anchors adopted an attitude that “What do we have
to lose—no one is
watching anyway.”
But viewers did watch, and the off-beat nature of SportsCenter
changed in June 1980 when Chris (“Boomer”) Berman
transformed Kansas City
Royals first baseman John Mayberry into “John Mayberry
RFD.” Berman's improvisational nicknames for other baseball
players, such as Sammy “say
10
11
2/2/2019 Internal Analysis: Strengths, Weaknesses, and
Competitive Advantage
https://edugen.wileyplus.com/edugen/courses/crs12076/ebook/c
03/dyer9781119411697c03xlinks.xform?id=c03-sec-7026 6/10
it ain't” Sosa and Albert “Winnie the” Pujols, and his role as the
“Swami” transformed SportsCenter into an entertaining improv
performance that
attracted a dedicated following. Berman would anchor
SportsCenter until 1986, and remains one of the networks
premier personalities today.
The nature of SportsCenter changed in 1988 when Steve
Bornstein, then Executive VP of Programming and Production,
brought in John Walsh,
founder of Inside Sports and former head of Rolling Stone
Magazine, to look at SportsCenter. Bornstein, who would
become ESPN's fourth president
two years later, told Walsh: “SportsCenter is the only thing we
don't pay rights for, so this is our most efficient financial
vehicle, and I want you to turn
it into the Sports Illustrated of television.”
Walsh, with a degree in journalism and a history in print media,
began to hire sports journalists—not merely on-camera
personalities—to staff and
lead SportsCenter. The show transformed from a lovable and
entertaining 30 minutes with the likes of Boomer Berman into a
“virtual gathering place
where sports fans could ‘assemble’ every night, not just to hang
out but to learn something.” Walsh's imprint was to provide
more breaking news and
richer coverage from true journalists, and better highlights and
visuals to attract viewers. Walsh believed that the SportsCenter
franchise should always
be something bigger than a personality-driven program.
If Chris Berman brought SportsCenter into national prominence,
Keith Olbermann and Dan Patrick sent the show into the
stratosphere. The two men
co-anchored their first SportsCenter on April 5, 1992. During
that show, the anchors, the staff, and probably the viewers
sensed a special chemistry
between Keith and Dan. That chemistry, combined with their
innate talents as journalists and writers to create a SportsCenter
that one commentator
wrote “had all the qualities of chocolate cake: rich, filling
ingredients of news and highlights thickly frosted with humor.”
Their SportsCenter aired
live at 11:00 p.m. but would be rebroadcast six times in the next
24 hours. Bill Belichick, then coach of the Cleveland Browns,
typified many fans and
watched all six reruns. When asked by Olbermann why,
Belichick responded, “I know all the punch lines by then. I get
to do the jokes.” The
Olbermann and Patrick partnership ended in 1998 when the
mercurial Olbermann jumped to a new cable sports competitor:
Fox Sports 1.
Roger Werner began preaching about the importance of the
brand during his tenure as president (1988-1990); Steve
Bornstein (1990-1998) and George
Bodenheimer (1998-2012) continued to beat the drum. Lee Ann
Daly, a marketing executive with a New York advertising
background, helped
Bodenheimer refine and reframe the brand. From its position at
the top of the sports world, ESPN could call the shots on how
fans received their
sports, but Daly argued that the essence of ESPN's brand, a deep
and intimate human connection with fans and the sports they
loved, required a
humbler, kinder approach. The ESPN brand changed from being
the “worldwide leader in sports television” to “we're the world's
biggest sports fan,
and we exist solely to serve fans wherever they are.” The
company revised its mission statement to reflect this new
attitude: “to serve sports fans
wherever sports are watched, listened to, discussed, debated,
read about, or played.” Or, as Bodenheimer called it “sports
fans serving sports fans.”
The 21 Century: Continued Dominance & Looming Challenges
As the ESPN brand continued to grow, so did demand for sports
programming. In 1983, ESPN offered cable providers a radical
proposition, they
should pay ESPN $0.05 a month per subscriber for the right to
carry the network. These rates increased consistently over the
years to the point that in
2015, ESPN was charging a whopping $6.61 per subscriber
(Exhibit 3 compares subscription rates for the top 10 cable
channels in 2015). It was by far
the most expensive cable network on television, charging four
times more than the nearest competitor. That amount reflects
both the demand by sports
viewers as well as the market power of the ESPN brand in
creating and delivering sports content. Exhibit 4 lists the top 15
sports networks, the
estimated number of subscribers, and approximate amounts of
revenue (in 2014) generated by each.
Network Fee
ESPN $ 6.61
TNT $ 1.65
Disney Channel $ 1.34
NFL Network $ 1.31
Fox News $ 1.12
USA Network $ 1.00
FS1 (Fox Sports 1) $ 0.99
TBS $ 0.85
ESPN2 $ 0.83
Nickelodeon $ 0.73
12
13
14
15 16
St
2/2/2019 Internal Analysis: Strengths, Weaknesses, and
Competitive Advantage
https://edugen.wileyplus.com/edugen/courses/crs12076/ebook/c
03/dyer9781119411697c03xlinks.xform?id=c03-sec-7026 7/10
Source: SNL Kagan
Exhibit 3The Ten Most Expensive Cable Channels, 2015
Network Fee Subscribers (millions) Revenue (billions)
ESPN $ 6.61 94.5 $ 7.50
NFL Network $ 1.31 73.6 $ 1.16
FS1 $ 0.99 91.2 $ 1.08
ESPN2 $ 0.83 94.5 $ 0.94
SEC Network $ 0.66 69.1 $ 0.55
Golf Channel $ 0.35 79.4 $ 0.33
NBC Sports Network $ 0.30 83.1 $ 0.30
Big Ten Network $ 0.39 62 $ 0.29
MLB Network $ 0.26 71.3 $ 0.22
FS2 $ 0.28 64 $ 0.22
NBA TV $ 0.29 57.2 $ 0.20
ESPNU $ 0.22 74.9 $ 0.20
CBS Sports Network $ 0.26 61 $ 0.19
NHL Network $ 0.32 37.4 $ 0.14
Pac 12 Network $ 0.39 12.3 $ 0.06
Source: SNL Kagan
Exhibit 4The top 15 Sports Networks, 2015
By 2014, ESPN generated six times more revenue than its
nearest competitor. This allowed for continued separation from
other sports networks and,
according to some, complete domination of certain markets.
Expert reports estimated that ESPN spends roughly $1.9 billion
per year for Monday
Night Football, $1.47 billion for rights to NBA games, $700
million for Major League Baseball, and hundreds of millions for
college football (SEC,
ACC, Big 10, etc.). ESPN's broadcasting contracts put the
company on the hook for $6 billion dollars annually to
broadcast more than half the live
sports shown on TV. In the 1990s, ESPN helped NASCAR
move from a niche viewing audience to a national obsession. In
the 2000s, ESPN did the
same for college football.
College Football: ESPN as the Market Leader
Two things highlight ESPN's dominance of college football.
First, ESPN has turned the college bowl season into a national
event. By 1991, ESPN had
purchased enough rights to bowl games that it created a Bowl
Week promotion for the week between Christmas and New
Year's Day. In 2015, ESPN
still broadcast all but two games of the bowl season, which has
been retitled as Bowl Month. The 2015 bowl season featured a
record forty games,
and in order to fill all the bowl slots, the NCAA had to relax the
rule that no team with a losing record could play in a bowl.
Second, ESPN and its affiliate networks televised around 450
games in the 2015 season alone, almost 35 games each week.
The nearest competitor,
Fox Sports, broadcast around 50. All other sports networks
combined could not come close to competing with ESPN's total
domination of college
football. ESPN has transformed college football from games
played almost exclusively on Saturdays to a full slate of games
on Wednesday, Thursday,
and Friday nights, and 12-14 hours on Saturday, excluding its
fabled College Game Day pre-show and post-game wrap-ups.
17
18
19
2/2/2019 Internal Analysis: Strengths, Weaknesses, and
Competitive Advantage
https://edugen.wileyplus.com/edugen/courses/crs12076/ebook/c
03/dyer9781119411697c03xlinks.xform?id=c03-sec-7026 8/10
ESPN worked to create what it considered “ideal match-ups,”
and constantly brokered deals with schools and conferences to
create games that would
optimize viewership. ESPN also used the lure of viewers to
change game days (for example, from a Saturday afternoon to a
Monday night), or game
times (some games on the West Coast begin in the morning to
accommodate an East Coast audience). ESPN employed its long-
term contracts with
major conferences, as well as its promise of millions of eyeballs
to set up a growing number of one-off match-ups. Athletic
programs might feel
beholden to ESPN and see their schedules dictated by the
interests of the network. Some schools claimed that ESPN had
been overly involved in
conference realignments, to create to the most ideal potential
games in the best television markets. This would be a violation
of NCAA rules, and the
network vehemently denied any involvement at that level,
although it admits to playing an appropriate advisory role.
Other stakeholders have cried foul about ESPN's market power.
A spate of news reports signaled a growing discontent with
ESPN's apparent control
of college football. For example, one report proclaimed that
“ESPN has become both puppet-master and kingmaker,
arranging games, setting
schedules, and bestowing the gift of nationwide exposure on its
chosen universities, players, and coaches.” The shortened game
preparation time for
teams risked the quality of the on-field product, and increased
time away from class by players seemed to run counter to the
notion of student-athletes.
In spite of these criticisms and realities, most collegiate
programs would do nearly anything to be on ESPN because the
exposure proves vital for
recruiting. Players love to be seen on ESPN, and fans love to
watch their teams on ESPN.
The combination of access to enormous amounts of revenue and
an unflinching commitment to getting the best product on TV
has led to more serious
accusations as well. In the mid-2000s, the Justice Department
responded to complaints of the anti-competitive practice of
“warehousing” games. In an
effort to have access to the best possible match-ups, ESPN
bought the rights to as many teams and games as possible—
sometimes more than it even
had the capacity to broadcast. College Sports Television
(CSTV) accused ESPN of purchasing rights to games and then
not broadcasting them. CSTV
claimed that ESPN refused to sell those rights to competitors
and deprived teams of exposure, and the networks of revenues.
Although the Justice
Department took no action, the case illustrated the extent of
ESPN's distinctive advantage in the marketplace, an advantage
some say borders on an
anti-competitive monopoly. ESPN originally sought to
“complement” and enhance the NCAA in its quest for exposure.
As the twenty-first century
rolls on, many wonder if ESPN dictates rather than
complements college football.
Looming Challenges
Given ESPN's overwhelming brand power, revenue structure,
and the magnitude of its broadcast contracts, its market position
seemed insurmountable.
According to Forbes, in 2015, the network possessed the 32nd
most valuable brand…in the world. ESPN appeared to be in
solid position to continue
as the runaway market leader in sports entertainment. Yet, a
closer look at the future revealed uncertainties that could
seriously challenge ESPN's
position.
Since 2004, ESPN had seen the rise of potential disruptive
competitors in the form on social media (e.g., Facebook in
2004, Twitter in 2006, Instagram
in 2010) and streaming video services (e.g., YouTube in 2005,
Netflix in 2007). Social media allowed sports fanatics to get
“breaking stories” about
their favorite teams and players from the teams and players
themselves. One no longer had to wait until the evening's
SportsCenter to catch all the
latest news. Streaming video, whether legal or pirated,
threatened ESPN's ability to drive viewership. By 2013, the rise
of smartphone technology and
mobile viewing options allowed fans to catch games, or
highlights, anytime and anywhere on their phones. Exhibit 5A,
5B details changes in viewing
patterns between 2013 and 2014. With so many options for
entertainment, a growing number of individuals opted out of
their cable packages, or “cut
the cord” and relied solely on over-the-air or streaming content
to meet their entertainment needs. No one could count the “cord
nevers,” or young
people who never signed up for cable and opted for streaming
video instead.
COMPOSITE (Viewers,000s) COMPOSITE (Minutes)
Q3 14 Q3 13 Q3 14 Q3 13
On Traditional TV 282665 283682 141:19 147:01
Watching Time-shifted TV 173305 167142 14:20 13:12
Using a DVD/Blu-Ray Device 139273 141648 5:16 5:24
Using a Game Console 95315 94939 8:14 7:07
Using a Multimedia Device 26872 n/a 2:09 n/a
Using the Internet on a Computer 194527 200013 30:06 27:02
Watching Video on Internet 144141 147678 10:42 6:41
Using any App/Web on a Smartphone 162798 139136 47:35
35:44
20
21
22
23
2/2/2019 Internal Analysis: Strengths, Weaknesses, and
Competitive Advantage
https://edugen.wileyplus.com/edugen/courses/crs12076/ebook/c
03/dyer9781119411697c03xlinks.xform?id=c03-sec-7026 9/10
COMPOSITE (Viewers,000s) COMPOSITE (Minutes)
Q3 14 Q3 13 Q3 14 Q3 13
Watching Video on a Smartphone 125686 100588 1:46 1:25
Listening to AM/FMRadio 258734 257420 58:53 60:42
Exhibit 5ATrends in TV Viewership
Average Daily Minutes
Quintile # persons,000s Stream Internet TV
Top 24,552 23.8 62.2 251.0
2nd 24,552 2.7 30.3 237.9
Middle 24,543 0.7 17.9 243.0
Fourth 24,532 0.2 12.7 243.1
Bottom 24,558 0.0 7.2 245.0
Non Streamers 123,240 0.0 1.0 223.1
Total 245,977 2.8 13.6 233.7
Source: Neilsen, Total Audience Report, 2014
http://www.nielsen.com/us/en/insights/reports/20
Exhibit 5BCross-Platform Media Usage, All Groups
The number of ESPN subscribers peaked in 2010 at 99.8
million. As a result of the constantly shifting options for sports
programming consumption,
ESPN lost between 5 million and 7 million subscribers between
2011 and 2015. The loss of 5–7 percent of its viewer base
reduces both revenue
sources. With fewer viewers, ESPN loses clout with advertisers
and receives lower rates. The network also loses subscription
fees for all its network
offerings (ESPN, ESPN2, ESPNU, and ESPN Classic, for
example). And all indications are that this trend will continue in
the near-term.
In 1983 ESPN flipped the standard network revenue model by
charging cable providers for access rights to ESPN's
programming. This contributed to
the practice of “bundling” that has become the basic sales
platform of cable and satellite providers. Bundling created a
package of over-the-air
networks, basic programming such as CNN, TNT, and TBS, and
specialty channels such as ESPN, HBO, HGTV, and many
others. By purchasing the
bundle, viewers saved money and had a wider range of viewing
options. While some premium channels can be ordered
individually (i.e., HBO),
networks such as ESPN represented a critical part of a basic
bundle. Anyone purchasing a cable or satellite package pays for
ESPN—whether they
want it or not.
The implications of bundling matter for all networks, but for
ESPN bundling played an outsized role. A recent report by Fox
Sports did some back-of-
the-envelope math and drew the following conclusions:
(A)round 48 million cable and satellite subscribers watch ESPN
every month. That's a very big number. But it also means that
44 million cable and
satellite subscribers pay $6.60 a month for ESPN and don't
watch it in an average month. That means every month ESPN is
pocketing $290 million off
cable and satellite subscribers who don't watch the channel.
Over the course of a year ESPN makes over $3 billion a year off
consumers who don't
watch ESPN.
In another report, the same author asked, “Think about how
crazy this is. Does any other business—besides insurance—
make 75 percent of its money
off people who wouldn't choose to consume the product?” With
the advent of streaming video and the move to mobile devices,
the historical practice
of bundling packages for subscription exhibited signs of
vulnerability. Federal legislation had been introduced to break
up bundles and force providers
to offer a la carte packaging; a 2013 survey of cable subscribers
found 92 percent of subscribers willing to purchase cable
channels a la carte. The
legislation did not pass, but significant support still existed for
some sort of legislation, and analysts sensed continued and
growing animosity with the
practice of bundling in both the public and private sector.
24
25
26
27
2/2/2019 Internal Analysis: Strengths, Weaknesses, and
Competitive Advantage
https://edugen.wileyplus.com/edugen/courses/crs12076/ebook/c
03/dyer9781119411697c03xlinks.xform?id=c03-sec-7026 10/10
“Cord-cutting” could significantly affect ESPN's business
model. ESPN had already lost between 5 million and 7 million
subscribers, dropping almost
3 million since 2013. The network responded by firing 400
employees and cutting budgets by $400 million. Revenue
continued to climb, but only
because ESPN had increased its subscription fee by an average
of 9.5 percent per year since 2012. If ESPN unbundled itself
from cable, a standalone
ESPN, at current subscription rates, would be competitive with
monthly subscription offerings such as Netflix ($8), Hulu ($8),
or Amazon Prime
($8.25 or $99 per year). If, however, a standalone ESPN
attracted only half its current subscription base, it would need
to charge substantially more
than double $6.60 to make up for lost advertising revenue. A
Fox Sports report noted:
In order to net $6 billion … for all ESPN channels, ESPN would
need 20 million yearly subscribers all paying $300 a year just
for the ESPN channels.
Putting that into context, the NFL Sunday Ticket on DirecTV is
right at 2 million subscribers. If only 2 million households are
willing to pay around
$300 for every NFL game that they can't get for free on
traditional television, would 18 million more be willing to pay
that much for … ESPN?
What if the amount that cable can pay for those games has been
artificially inflated by the fact that nearly half of all sports
cable subscribers never
watch ESPN? Effectively, ESPN has been paying for sports with
money from people who would never pay for sports
themselves?”
As Skipper pondered the situation, he was struck by the
apparent paradox. His company dominated sports programming
and was a key player in every
sport, but that dominance belied tectonic changes in technology
that threatened ESPN's source of value added and revenue.
Skipper had several
questions: 1) how could he assess the real threat from
technological change to ESPN? 2) How should ESPN respond?
The network had plenty of live
sports programming, but how should bread-and-butter programs
such as SportsCenter change to be relevant in the new
environment? 3) Was
American culture changing in a way that threatened the
network's fundamental revenue model? 4) Would continuing to
bundle itself into cable
packages continue to create value for ESPN? 5) How should
ESPN position itself in the new entertainment world to both
regain its dominant position
and to continue to grow?
Copyright © 2018, 2016 John Wiley & Sons, Inc. All rights
reserved.
28
29
As we have seen in previous modules, there has been an
explosion of interest in studying the Transatlantic Slave Trade,
its volume, direction, and, as we will see in future modules, its
effects on Europe and Africa. Nevertheless, a glaring gap
remains in the literature on the role of West Africa. In Module
3, we examined African societies and states prior to and during
the Transatlantic Slave Trade era. While the readings for that
module present a concise narrative of a larger region of Africa,
the information can be daunting and difficult to understand on
its own. Students in the United States often have only a limited
knowledge of African history, a topic that is not studied
sufficiently in American schools. Furthermore, Africa in the
period 1500 to 1800 consisted of thousands of different
languages and ethnic groups, dozens of kingdoms and other
political entities, and various regional climates.
Lázaro Luis, map of Western Africa, 1563.Click on the image to
view in full-size.
A new approach to understanding Africa’s history of the slave
trade is to take micro or regional approaches. The Voyages
database now allows scholars to estimate which particular
regions of Africa supplied most of the captives in the trade.
Using this information, scholars conducted case studies of
individual regions of West Africa, or, in the case of the
historian we will study in this present module, an individual
port town.
Africa is perhaps the most diverse continent in the world,
consisting of a multitude of languages, ethnic groups, climates,
and geographies. These differences shaped the continent’s
history. Moreover, prior to and during the era of the
Transatlantic Slave Trade, there were massive political changes
in the Western portion of the continent (new political entities
rose and fell with significant regularity, for example) that
shaped the evolution of the trade.
Compounding the complexities of studying the trade, European
nations had shifting experiences in trading with West Africa.
Some European ships traded mainly with one particular region
of West Africa in order to develop relationships and establish
ties with communities. For example, Portuguese merchants
tended to trade predominantly in the region in the modern
nation of Angola, while English merchants traded heavily in the
regions in the modern nations of Ghana and Nigeria. The
French, on the other hand, traded overwhelmingly with the
regions in the modern nation of Senegal. However, some
European traders took the opposite approach and visited several
different regions during individual voyages to diversify the
ethnic origins of their slaves.
Individual African communities also had shifting experiences in
the trade, exporting many captives in one era, tapering off their
connection to the trade in another era, and re-entering the trade
again decades later. Given the number of variables involved,
arriving at a cohesive narrative of African history during this
era is rather complicated.
A depiction of Mansa Musa I of the Mali Empire holding a gold
nugget from the 1375 Catalan AtlasClick on the image to view
in full-size.
Randy Sparks’ Where the Negroes Are Masters (2014)
represents a new and innovative approach to the study of
Africa’s involvement in the slave trade. Sparks examines
Anomabo (also known as Anomabu or Annamaboe), a single
port town on the Gold Coast, which was one of the major
regions of West Africa supplying captives to the Transatlantic
Slave Trade. Today, the Gold Coast is part of the Republic of
Ghana (Links to an external site.)Links to an external site..
During the 1400s, European merchants (primarily the
Portuguese) began exploring this part of the coast for the
opportunity to develop profitable trading relationships.
Essentially, European merchants were looking for products that
Europe could not produce, including spices, tropical foodstuffs
such as cocoa, and gold. Europeans discovered plentiful gold
resources in this area of West Africa, resulting in the moniker
the “Gold Coast.” British, Dutch, Danish, Prussian, Swedish,
and Portuguese traders then came to the region to trade goods
like guns and rum for gold, making the area one of the largest
suppliers of gold on Earth. By the late 1600s, however, traders’
attention shifted from gold to captives who would be shipped to
the Americas.
Sparks’ study focuses on this transformation, from trading gold
to trading for humans, in the port town of Anomabo. He details
African responses to the trade, its development, expansion, and
ultimate collapse through examinations of the relationships
between a few key individuals. Such a micro approach allows
students to gain a greater understanding of how the
Transatlantic Slave Trade operated within Africa. It also
presents a detailed description of how Africans participated in
the trade and its effects on the sociopolitical conditions of one
port town. Such a focused approach also aids students’
comprehension of the trade during this complex era.

More Related Content

Similar to 222019 Internal Analysis Strengths, Weaknesses, and Competi.docx

ESPN_Peter Fox
ESPN_Peter FoxESPN_Peter Fox
ESPN_Peter FoxPeter Fox
 
Why the Next Big Thing is eSports
Why the Next Big Thing is eSports Why the Next Big Thing is eSports
Why the Next Big Thing is eSports Bob Snyder
 
Marketing & The Creative Industry
Marketing & The Creative IndustryMarketing & The Creative Industry
Marketing & The Creative Industrycallumsambridge01
 
Analysis report espn_jd_lyell
Analysis report espn_jd_lyellAnalysis report espn_jd_lyell
Analysis report espn_jd_lyellJamesLyell1
 
The Impact of ESPN Layoffs 22.pptx
The Impact of ESPN Layoffs 22.pptxThe Impact of ESPN Layoffs 22.pptx
The Impact of ESPN Layoffs 22.pptxjonemule
 
Research Paper On Academic Cheating. Online assignment writing service.
Research Paper On Academic Cheating. Online assignment writing service.Research Paper On Academic Cheating. Online assignment writing service.
Research Paper On Academic Cheating. Online assignment writing service.Monica Rivera
 
WINNING CAMPAIGN BOOK
WINNING CAMPAIGN BOOK WINNING CAMPAIGN BOOK
WINNING CAMPAIGN BOOK Morgan Hellwig
 
The Impact of ESPN Layoffs.pptx
The Impact of ESPN Layoffs.pptxThe Impact of ESPN Layoffs.pptx
The Impact of ESPN Layoffs.pptxjonemule
 
Will the Internet replace television?
Will the Internet replace television?Will the Internet replace television?
Will the Internet replace television?sanskover
 
Spotlight On_Fantasy Sports_May 2015
Spotlight On_Fantasy Sports_May 2015Spotlight On_Fantasy Sports_May 2015
Spotlight On_Fantasy Sports_May 2015Jason Blake
 
10 Factors Changing Our Media and Our Lives
10 Factors Changing Our Media and Our Lives10 Factors Changing Our Media and Our Lives
10 Factors Changing Our Media and Our LivesGigi Johnson
 
Chapter 4
Chapter 4Chapter 4
Chapter 4detjen
 
Bjmc i, dcm,unit-i, path towards convergence
Bjmc i, dcm,unit-i, path towards convergenceBjmc i, dcm,unit-i, path towards convergence
Bjmc i, dcm,unit-i, path towards convergenceRai University
 
Steeple Analysis of Fox Sports
Steeple Analysis of Fox SportsSteeple Analysis of Fox Sports
Steeple Analysis of Fox SportsRyanRoss77
 
Chapter 6
Chapter 6Chapter 6
Chapter 6detjen
 
Chapter 4
Chapter 4Chapter 4
Chapter 4detjen
 

Similar to 222019 Internal Analysis Strengths, Weaknesses, and Competi.docx (20)

R 172196
R 172196R 172196
R 172196
 
ESPN_Peter Fox
ESPN_Peter FoxESPN_Peter Fox
ESPN_Peter Fox
 
Why the Next Big Thing is eSports
Why the Next Big Thing is eSports Why the Next Big Thing is eSports
Why the Next Big Thing is eSports
 
Marketing & The Creative Industry
Marketing & The Creative IndustryMarketing & The Creative Industry
Marketing & The Creative Industry
 
Analysis report espn_jd_lyell
Analysis report espn_jd_lyellAnalysis report espn_jd_lyell
Analysis report espn_jd_lyell
 
2010 Marketing Yanks
2010 Marketing Yanks2010 Marketing Yanks
2010 Marketing Yanks
 
Sports & Media 2014
Sports & Media 2014Sports & Media 2014
Sports & Media 2014
 
먹튀사이트.pdf
먹튀사이트.pdf먹튀사이트.pdf
먹튀사이트.pdf
 
The Impact of ESPN Layoffs 22.pptx
The Impact of ESPN Layoffs 22.pptxThe Impact of ESPN Layoffs 22.pptx
The Impact of ESPN Layoffs 22.pptx
 
Research Paper On Academic Cheating. Online assignment writing service.
Research Paper On Academic Cheating. Online assignment writing service.Research Paper On Academic Cheating. Online assignment writing service.
Research Paper On Academic Cheating. Online assignment writing service.
 
WINNING CAMPAIGN BOOK
WINNING CAMPAIGN BOOK WINNING CAMPAIGN BOOK
WINNING CAMPAIGN BOOK
 
The Impact of ESPN Layoffs.pptx
The Impact of ESPN Layoffs.pptxThe Impact of ESPN Layoffs.pptx
The Impact of ESPN Layoffs.pptx
 
Will the Internet replace television?
Will the Internet replace television?Will the Internet replace television?
Will the Internet replace television?
 
Spotlight On_Fantasy Sports_May 2015
Spotlight On_Fantasy Sports_May 2015Spotlight On_Fantasy Sports_May 2015
Spotlight On_Fantasy Sports_May 2015
 
10 Factors Changing Our Media and Our Lives
10 Factors Changing Our Media and Our Lives10 Factors Changing Our Media and Our Lives
10 Factors Changing Our Media and Our Lives
 
Chapter 4
Chapter 4Chapter 4
Chapter 4
 
Bjmc i, dcm,unit-i, path towards convergence
Bjmc i, dcm,unit-i, path towards convergenceBjmc i, dcm,unit-i, path towards convergence
Bjmc i, dcm,unit-i, path towards convergence
 
Steeple Analysis of Fox Sports
Steeple Analysis of Fox SportsSteeple Analysis of Fox Sports
Steeple Analysis of Fox Sports
 
Chapter 6
Chapter 6Chapter 6
Chapter 6
 
Chapter 4
Chapter 4Chapter 4
Chapter 4
 

More from vickeryr87

COLLEGEPHYSICS LAB REPORTSTUDENTS NAME.docx
COLLEGEPHYSICS LAB REPORTSTUDENTS NAME.docxCOLLEGEPHYSICS LAB REPORTSTUDENTS NAME.docx
COLLEGEPHYSICS LAB REPORTSTUDENTS NAME.docxvickeryr87
 
Collins did not understand the events that led to the reasoning .docx
Collins did not understand the events that led to the reasoning .docxCollins did not understand the events that led to the reasoning .docx
Collins did not understand the events that led to the reasoning .docxvickeryr87
 
Define discrimination, victimization and affirmative actions; .docx
Define discrimination, victimization and affirmative actions; .docxDefine discrimination, victimization and affirmative actions; .docx
Define discrimination, victimization and affirmative actions; .docxvickeryr87
 
Define data mining. Why are there many names and definitions for d.docx
Define data mining. Why are there many names and definitions for d.docxDefine data mining. Why are there many names and definitions for d.docx
Define data mining. Why are there many names and definitions for d.docxvickeryr87
 
Define culture. How can culture be conceptionalizedDiscuss at l.docx
Define culture. How can culture be conceptionalizedDiscuss at l.docxDefine culture. How can culture be conceptionalizedDiscuss at l.docx
Define culture. How can culture be conceptionalizedDiscuss at l.docxvickeryr87
 
Define cultural relativism and how it is used by anthropologis.docx
Define cultural relativism and how it is used by anthropologis.docxDefine cultural relativism and how it is used by anthropologis.docx
Define cultural relativism and how it is used by anthropologis.docxvickeryr87
 
Define cost control and provide several examples of how it affec.docx
Define cost control and provide several examples of how it affec.docxDefine cost control and provide several examples of how it affec.docx
Define cost control and provide several examples of how it affec.docxvickeryr87
 
Define corporate governance.Discuss the events that led up.docx
Define corporate governance.Discuss the events that led up.docxDefine corporate governance.Discuss the events that led up.docx
Define corporate governance.Discuss the events that led up.docxvickeryr87
 
Define communication in your own words. Identify and distinguish amo.docx
Define communication in your own words. Identify and distinguish amo.docxDefine communication in your own words. Identify and distinguish amo.docx
Define communication in your own words. Identify and distinguish amo.docxvickeryr87
 
Define Civil Liberties. List 5 Civil Liberties. How do they differ.docx
Define Civil Liberties. List 5 Civil Liberties. How do they differ.docxDefine Civil Liberties. List 5 Civil Liberties. How do they differ.docx
Define Civil Liberties. List 5 Civil Liberties. How do they differ.docxvickeryr87
 
Define civilization. Do we really need it in order to survive and pr.docx
Define civilization. Do we really need it in order to survive and pr.docxDefine civilization. Do we really need it in order to survive and pr.docx
Define civilization. Do we really need it in order to survive and pr.docxvickeryr87
 
Define case management and care management and compare the dif.docx
Define case management and care management and compare the dif.docxDefine case management and care management and compare the dif.docx
Define case management and care management and compare the dif.docxvickeryr87
 
Define Bureaucracy.  Government at all levels has grown enormously, .docx
Define Bureaucracy.  Government at all levels has grown enormously, .docxDefine Bureaucracy.  Government at all levels has grown enormously, .docx
Define Bureaucracy.  Government at all levels has grown enormously, .docxvickeryr87
 
Define and explain how the Twitter search function works to search f.docx
Define and explain how the Twitter search function works to search f.docxDefine and explain how the Twitter search function works to search f.docx
Define and explain how the Twitter search function works to search f.docxvickeryr87
 
Define and relate these different terminologies and Information Gove.docx
Define and relate these different terminologies and Information Gove.docxDefine and relate these different terminologies and Information Gove.docx
Define and relate these different terminologies and Information Gove.docxvickeryr87
 
Define and provide examples of-Basic probability- Bayes the.docx
Define and provide examples of-Basic probability- Bayes the.docxDefine and provide examples of-Basic probability- Bayes the.docx
Define and provide examples of-Basic probability- Bayes the.docxvickeryr87
 
Define and discuss the phrase Manifest Destiny. Explain how this b.docx
Define and discuss the phrase Manifest Destiny. Explain how this b.docxDefine and discuss the phrase Manifest Destiny. Explain how this b.docx
Define and discuss the phrase Manifest Destiny. Explain how this b.docxvickeryr87
 
Define and discuss the differences between vision and mission stat.docx
Define and discuss the differences between vision and mission stat.docxDefine and discuss the differences between vision and mission stat.docx
Define and discuss the differences between vision and mission stat.docxvickeryr87
 
Define and discuss the four types of innovation. How might these.docx
Define and discuss the four types of innovation. How might these.docxDefine and discuss the four types of innovation. How might these.docx
Define and discuss the four types of innovation. How might these.docxvickeryr87
 
Define and discuss the data wiping process.Discuss how a cloud.docx
Define and discuss the data wiping process.Discuss how a cloud.docxDefine and discuss the data wiping process.Discuss how a cloud.docx
Define and discuss the data wiping process.Discuss how a cloud.docxvickeryr87
 

More from vickeryr87 (20)

COLLEGEPHYSICS LAB REPORTSTUDENTS NAME.docx
COLLEGEPHYSICS LAB REPORTSTUDENTS NAME.docxCOLLEGEPHYSICS LAB REPORTSTUDENTS NAME.docx
COLLEGEPHYSICS LAB REPORTSTUDENTS NAME.docx
 
Collins did not understand the events that led to the reasoning .docx
Collins did not understand the events that led to the reasoning .docxCollins did not understand the events that led to the reasoning .docx
Collins did not understand the events that led to the reasoning .docx
 
Define discrimination, victimization and affirmative actions; .docx
Define discrimination, victimization and affirmative actions; .docxDefine discrimination, victimization and affirmative actions; .docx
Define discrimination, victimization and affirmative actions; .docx
 
Define data mining. Why are there many names and definitions for d.docx
Define data mining. Why are there many names and definitions for d.docxDefine data mining. Why are there many names and definitions for d.docx
Define data mining. Why are there many names and definitions for d.docx
 
Define culture. How can culture be conceptionalizedDiscuss at l.docx
Define culture. How can culture be conceptionalizedDiscuss at l.docxDefine culture. How can culture be conceptionalizedDiscuss at l.docx
Define culture. How can culture be conceptionalizedDiscuss at l.docx
 
Define cultural relativism and how it is used by anthropologis.docx
Define cultural relativism and how it is used by anthropologis.docxDefine cultural relativism and how it is used by anthropologis.docx
Define cultural relativism and how it is used by anthropologis.docx
 
Define cost control and provide several examples of how it affec.docx
Define cost control and provide several examples of how it affec.docxDefine cost control and provide several examples of how it affec.docx
Define cost control and provide several examples of how it affec.docx
 
Define corporate governance.Discuss the events that led up.docx
Define corporate governance.Discuss the events that led up.docxDefine corporate governance.Discuss the events that led up.docx
Define corporate governance.Discuss the events that led up.docx
 
Define communication in your own words. Identify and distinguish amo.docx
Define communication in your own words. Identify and distinguish amo.docxDefine communication in your own words. Identify and distinguish amo.docx
Define communication in your own words. Identify and distinguish amo.docx
 
Define Civil Liberties. List 5 Civil Liberties. How do they differ.docx
Define Civil Liberties. List 5 Civil Liberties. How do they differ.docxDefine Civil Liberties. List 5 Civil Liberties. How do they differ.docx
Define Civil Liberties. List 5 Civil Liberties. How do they differ.docx
 
Define civilization. Do we really need it in order to survive and pr.docx
Define civilization. Do we really need it in order to survive and pr.docxDefine civilization. Do we really need it in order to survive and pr.docx
Define civilization. Do we really need it in order to survive and pr.docx
 
Define case management and care management and compare the dif.docx
Define case management and care management and compare the dif.docxDefine case management and care management and compare the dif.docx
Define case management and care management and compare the dif.docx
 
Define Bureaucracy.  Government at all levels has grown enormously, .docx
Define Bureaucracy.  Government at all levels has grown enormously, .docxDefine Bureaucracy.  Government at all levels has grown enormously, .docx
Define Bureaucracy.  Government at all levels has grown enormously, .docx
 
Define and explain how the Twitter search function works to search f.docx
Define and explain how the Twitter search function works to search f.docxDefine and explain how the Twitter search function works to search f.docx
Define and explain how the Twitter search function works to search f.docx
 
Define and relate these different terminologies and Information Gove.docx
Define and relate these different terminologies and Information Gove.docxDefine and relate these different terminologies and Information Gove.docx
Define and relate these different terminologies and Information Gove.docx
 
Define and provide examples of-Basic probability- Bayes the.docx
Define and provide examples of-Basic probability- Bayes the.docxDefine and provide examples of-Basic probability- Bayes the.docx
Define and provide examples of-Basic probability- Bayes the.docx
 
Define and discuss the phrase Manifest Destiny. Explain how this b.docx
Define and discuss the phrase Manifest Destiny. Explain how this b.docxDefine and discuss the phrase Manifest Destiny. Explain how this b.docx
Define and discuss the phrase Manifest Destiny. Explain how this b.docx
 
Define and discuss the differences between vision and mission stat.docx
Define and discuss the differences between vision and mission stat.docxDefine and discuss the differences between vision and mission stat.docx
Define and discuss the differences between vision and mission stat.docx
 
Define and discuss the four types of innovation. How might these.docx
Define and discuss the four types of innovation. How might these.docxDefine and discuss the four types of innovation. How might these.docx
Define and discuss the four types of innovation. How might these.docx
 
Define and discuss the data wiping process.Discuss how a cloud.docx
Define and discuss the data wiping process.Discuss how a cloud.docxDefine and discuss the data wiping process.Discuss how a cloud.docx
Define and discuss the data wiping process.Discuss how a cloud.docx
 

Recently uploaded

Arihant handbook biology for class 11 .pdf
Arihant handbook biology for class 11 .pdfArihant handbook biology for class 11 .pdf
Arihant handbook biology for class 11 .pdfchloefrazer622
 
18-04-UA_REPORT_MEDIALITERAСY_INDEX-DM_23-1-final-eng.pdf
18-04-UA_REPORT_MEDIALITERAСY_INDEX-DM_23-1-final-eng.pdf18-04-UA_REPORT_MEDIALITERAСY_INDEX-DM_23-1-final-eng.pdf
18-04-UA_REPORT_MEDIALITERAСY_INDEX-DM_23-1-final-eng.pdfssuser54595a
 
Web & Social Media Analytics Previous Year Question Paper.pdf
Web & Social Media Analytics Previous Year Question Paper.pdfWeb & Social Media Analytics Previous Year Question Paper.pdf
Web & Social Media Analytics Previous Year Question Paper.pdfJayanti Pande
 
microwave assisted reaction. General introduction
microwave assisted reaction. General introductionmicrowave assisted reaction. General introduction
microwave assisted reaction. General introductionMaksud Ahmed
 
POINT- BIOCHEMISTRY SEM 2 ENZYMES UNIT 5.pptx
POINT- BIOCHEMISTRY SEM 2 ENZYMES UNIT 5.pptxPOINT- BIOCHEMISTRY SEM 2 ENZYMES UNIT 5.pptx
POINT- BIOCHEMISTRY SEM 2 ENZYMES UNIT 5.pptxSayali Powar
 
Grant Readiness 101 TechSoup and Remy Consulting
Grant Readiness 101 TechSoup and Remy ConsultingGrant Readiness 101 TechSoup and Remy Consulting
Grant Readiness 101 TechSoup and Remy ConsultingTechSoup
 
Organic Name Reactions for the students and aspirants of Chemistry12th.pptx
Organic Name Reactions  for the students and aspirants of Chemistry12th.pptxOrganic Name Reactions  for the students and aspirants of Chemistry12th.pptx
Organic Name Reactions for the students and aspirants of Chemistry12th.pptxVS Mahajan Coaching Centre
 
“Oh GOSH! Reflecting on Hackteria's Collaborative Practices in a Global Do-It...
“Oh GOSH! Reflecting on Hackteria's Collaborative Practices in a Global Do-It...“Oh GOSH! Reflecting on Hackteria's Collaborative Practices in a Global Do-It...
“Oh GOSH! Reflecting on Hackteria's Collaborative Practices in a Global Do-It...Marc Dusseiller Dusjagr
 
Introduction to AI in Higher Education_draft.pptx
Introduction to AI in Higher Education_draft.pptxIntroduction to AI in Higher Education_draft.pptx
Introduction to AI in Higher Education_draft.pptxpboyjonauth
 
CARE OF CHILD IN INCUBATOR..........pptx
CARE OF CHILD IN INCUBATOR..........pptxCARE OF CHILD IN INCUBATOR..........pptx
CARE OF CHILD IN INCUBATOR..........pptxGaneshChakor2
 
The basics of sentences session 2pptx copy.pptx
The basics of sentences session 2pptx copy.pptxThe basics of sentences session 2pptx copy.pptx
The basics of sentences session 2pptx copy.pptxheathfieldcps1
 
BASLIQ CURRENT LOOKBOOK LOOKBOOK(1) (1).pdf
BASLIQ CURRENT LOOKBOOK  LOOKBOOK(1) (1).pdfBASLIQ CURRENT LOOKBOOK  LOOKBOOK(1) (1).pdf
BASLIQ CURRENT LOOKBOOK LOOKBOOK(1) (1).pdfSoniaTolstoy
 
Kisan Call Centre - To harness potential of ICT in Agriculture by answer farm...
Kisan Call Centre - To harness potential of ICT in Agriculture by answer farm...Kisan Call Centre - To harness potential of ICT in Agriculture by answer farm...
Kisan Call Centre - To harness potential of ICT in Agriculture by answer farm...Krashi Coaching
 
Measures of Central Tendency: Mean, Median and Mode
Measures of Central Tendency: Mean, Median and ModeMeasures of Central Tendency: Mean, Median and Mode
Measures of Central Tendency: Mean, Median and ModeThiyagu K
 
Beyond the EU: DORA and NIS 2 Directive's Global Impact
Beyond the EU: DORA and NIS 2 Directive's Global ImpactBeyond the EU: DORA and NIS 2 Directive's Global Impact
Beyond the EU: DORA and NIS 2 Directive's Global ImpactPECB
 
Mastering the Unannounced Regulatory Inspection
Mastering the Unannounced Regulatory InspectionMastering the Unannounced Regulatory Inspection
Mastering the Unannounced Regulatory InspectionSafetyChain Software
 
A Critique of the Proposed National Education Policy Reform
A Critique of the Proposed National Education Policy ReformA Critique of the Proposed National Education Policy Reform
A Critique of the Proposed National Education Policy ReformChameera Dedduwage
 
1029-Danh muc Sach Giao Khoa khoi 6.pdf
1029-Danh muc Sach Giao Khoa khoi  6.pdf1029-Danh muc Sach Giao Khoa khoi  6.pdf
1029-Danh muc Sach Giao Khoa khoi 6.pdfQucHHunhnh
 

Recently uploaded (20)

Arihant handbook biology for class 11 .pdf
Arihant handbook biology for class 11 .pdfArihant handbook biology for class 11 .pdf
Arihant handbook biology for class 11 .pdf
 
Mattingly "AI & Prompt Design: Structured Data, Assistants, & RAG"
Mattingly "AI & Prompt Design: Structured Data, Assistants, & RAG"Mattingly "AI & Prompt Design: Structured Data, Assistants, & RAG"
Mattingly "AI & Prompt Design: Structured Data, Assistants, & RAG"
 
Staff of Color (SOC) Retention Efforts DDSD
Staff of Color (SOC) Retention Efforts DDSDStaff of Color (SOC) Retention Efforts DDSD
Staff of Color (SOC) Retention Efforts DDSD
 
18-04-UA_REPORT_MEDIALITERAСY_INDEX-DM_23-1-final-eng.pdf
18-04-UA_REPORT_MEDIALITERAСY_INDEX-DM_23-1-final-eng.pdf18-04-UA_REPORT_MEDIALITERAСY_INDEX-DM_23-1-final-eng.pdf
18-04-UA_REPORT_MEDIALITERAСY_INDEX-DM_23-1-final-eng.pdf
 
Web & Social Media Analytics Previous Year Question Paper.pdf
Web & Social Media Analytics Previous Year Question Paper.pdfWeb & Social Media Analytics Previous Year Question Paper.pdf
Web & Social Media Analytics Previous Year Question Paper.pdf
 
microwave assisted reaction. General introduction
microwave assisted reaction. General introductionmicrowave assisted reaction. General introduction
microwave assisted reaction. General introduction
 
POINT- BIOCHEMISTRY SEM 2 ENZYMES UNIT 5.pptx
POINT- BIOCHEMISTRY SEM 2 ENZYMES UNIT 5.pptxPOINT- BIOCHEMISTRY SEM 2 ENZYMES UNIT 5.pptx
POINT- BIOCHEMISTRY SEM 2 ENZYMES UNIT 5.pptx
 
Grant Readiness 101 TechSoup and Remy Consulting
Grant Readiness 101 TechSoup and Remy ConsultingGrant Readiness 101 TechSoup and Remy Consulting
Grant Readiness 101 TechSoup and Remy Consulting
 
Organic Name Reactions for the students and aspirants of Chemistry12th.pptx
Organic Name Reactions  for the students and aspirants of Chemistry12th.pptxOrganic Name Reactions  for the students and aspirants of Chemistry12th.pptx
Organic Name Reactions for the students and aspirants of Chemistry12th.pptx
 
“Oh GOSH! Reflecting on Hackteria's Collaborative Practices in a Global Do-It...
“Oh GOSH! Reflecting on Hackteria's Collaborative Practices in a Global Do-It...“Oh GOSH! Reflecting on Hackteria's Collaborative Practices in a Global Do-It...
“Oh GOSH! Reflecting on Hackteria's Collaborative Practices in a Global Do-It...
 
Introduction to AI in Higher Education_draft.pptx
Introduction to AI in Higher Education_draft.pptxIntroduction to AI in Higher Education_draft.pptx
Introduction to AI in Higher Education_draft.pptx
 
CARE OF CHILD IN INCUBATOR..........pptx
CARE OF CHILD IN INCUBATOR..........pptxCARE OF CHILD IN INCUBATOR..........pptx
CARE OF CHILD IN INCUBATOR..........pptx
 
The basics of sentences session 2pptx copy.pptx
The basics of sentences session 2pptx copy.pptxThe basics of sentences session 2pptx copy.pptx
The basics of sentences session 2pptx copy.pptx
 
BASLIQ CURRENT LOOKBOOK LOOKBOOK(1) (1).pdf
BASLIQ CURRENT LOOKBOOK  LOOKBOOK(1) (1).pdfBASLIQ CURRENT LOOKBOOK  LOOKBOOK(1) (1).pdf
BASLIQ CURRENT LOOKBOOK LOOKBOOK(1) (1).pdf
 
Kisan Call Centre - To harness potential of ICT in Agriculture by answer farm...
Kisan Call Centre - To harness potential of ICT in Agriculture by answer farm...Kisan Call Centre - To harness potential of ICT in Agriculture by answer farm...
Kisan Call Centre - To harness potential of ICT in Agriculture by answer farm...
 
Measures of Central Tendency: Mean, Median and Mode
Measures of Central Tendency: Mean, Median and ModeMeasures of Central Tendency: Mean, Median and Mode
Measures of Central Tendency: Mean, Median and Mode
 
Beyond the EU: DORA and NIS 2 Directive's Global Impact
Beyond the EU: DORA and NIS 2 Directive's Global ImpactBeyond the EU: DORA and NIS 2 Directive's Global Impact
Beyond the EU: DORA and NIS 2 Directive's Global Impact
 
Mastering the Unannounced Regulatory Inspection
Mastering the Unannounced Regulatory InspectionMastering the Unannounced Regulatory Inspection
Mastering the Unannounced Regulatory Inspection
 
A Critique of the Proposed National Education Policy Reform
A Critique of the Proposed National Education Policy ReformA Critique of the Proposed National Education Policy Reform
A Critique of the Proposed National Education Policy Reform
 
1029-Danh muc Sach Giao Khoa khoi 6.pdf
1029-Danh muc Sach Giao Khoa khoi  6.pdf1029-Danh muc Sach Giao Khoa khoi  6.pdf
1029-Danh muc Sach Giao Khoa khoi 6.pdf
 

222019 Internal Analysis Strengths, Weaknesses, and Competi.docx

  • 1. 2/2/2019 Internal Analysis: Strengths, Weaknesses, and Competitive Advantage https://edugen.wileyplus.com/edugen/courses/crs12076/ebook/c 03/dyer9781119411697c03xlinks.xform?id=c03-sec-7026 1/10 CASE 3 ESPN in 2015 Continued Dominance in Sports Television? “If you're a fan, what you'll see in the next minutes, hours, and days to follow may convince you, you've gone to sports heaven.” —Lee Leonard, September 7, 1979. The first on-air words at ESPN John Skipper, president and CEO of ESPN since 2012, sat at his desk and intently reviewed comments by Bob Iger, Disney CEO, and his direct boss, during last night's earnings call: “I'd like to address an issue that has been receiving a fair amount of interest and attention these days and that's the rapidly changing media landscape especially as it relates to ESPN. We are realists about the business and about the impact technology has had on how product is distributed, marketed, and consumed. We are also quite mindful of potential trends among younger audiences, in particular many of whom consume television in very different ways than the generations before them … ESPN is the number one brand in sports media and one of the most valuable brands in all sports and among the most popular,
  • 2. respected and valuable brands in media, by consumers, advertisers, and distributors. This is supported by the fact that in the first calendar quarter of this year alone, 83% of all multichannel households turn to ESPN at some point.” As Skipper looked up, his eyes focused on ESPN's newest building at the sprawling 200-plus acre Bristol, Connecticut campus, DC-2. DC-2 was ESPN's 18th building and featured the state of the art in television broadcasting, with 194,000 square feet, 114 television screens and monitors, 1,100 miles of copper wire, the ability to broadcast SportsCenter in 4 K, 8 K, 3-D, and even a floating “CableCam” that treated visitors to an NFL playing field experience. He reflected on the vast size of ESPN's current campus, remembering that ESPN originated from temporary trailers on a less than a single acre in 1979. Skipper's mind raced forward, wondering if and how this new investment would pay off in a world with almost overwhelming technological risk to media companies. When sports news traveled instantaneously over Twitter and social media, and with the rise of free video streaming, Skipper wondered about ESPN's relevance, competitive advantage, and revenue stream. Was ESPN ready for the next wave of disruption? How could ESPN maintain and grow its dominant position in sports programming? The Beginning The idea that gave birth to ESPN hatched over two days, May 30–31, 1978. Bill Rasmussen, an ex-collegiate baseball player and sports nut, had just been fired as the communications director for the New England (Hartford) Whalers hockey club. As Bill and his son Scott sat
  • 3. around the house the night of May 30, Bill discussed a vague set of ideas about using the new technology of cable TV to broadcast New England sports. The next day Bill and Scott watched intently as two of their associates played videotapes of local hot air balloons and spoke about a local show broadcasting live sports. Suddenly, Rasmussen blurted out an idea: “What about live sports? Just Connecticut sports on cable. Could we do that?” The new dream proved exciting, but Rasmussen lacked three critical resources: access to the satellite technology to provide a cable feed, programming content to fill the airwaves, and money to make the whole project work. Cable TV was a nascent industry mostly limited to rural viewers, and RCA Corporation had launched a communications satellite three years earlier in hopes of selling transponder time to buyers hoping to reach the cable market. By mid-1978, RCA was desperate to find buyers. Rasmussen approached RCA about buying transponder time for five hours per night. The price? $1,250 per night. Al Parinello, the RCA salesman, told Rasmussen that he could lease another transponder, one that would provide the buyer with 24/7 transmission capability for $35,000 per month. Rasmussen's network could broadcast all day and night for less than it could for five hours per day. The new network would be Rasmussen's (and other fans') dream: all sports, all the time. Realizing that 24/7 programming would outstrip every event in Connecticut, Rasmussen worked his relationship with John Toner, the University of Connecticut's athletic director. Toner put Rasmussen in touch with Walt Byers, the powerful head of the NCAA. Rasmussen's proposal to the NCAA outlined the network's, now named Entertainment and Sports
  • 4. Programming TV (ESP-TV), early strategy: ESP-TV intends to complement rather than compete with current NCAA television contractual agreements. We propose to extend football's national television coverage to more schools and to add many other sports, including every championship, to our nationwide network … [ESP-TV will] provide national exposure to more institutions and student athletes than ever before possible…. ESP-TV proposes to work very closely with the NCAA to develop schedules in all sports that will maximize our mutually stated goals. The NCAA held out, partially because Byers didn't believe that Rasmussen's network would see the light of day. Bill and Scott had convinced several local backers to throw in money, and they had maxed out their own personal credit cards to start the venture. J. B. Doherty, one of those investors, contacted Stuart Evey, vice president of Getty Oil's diversified division. Evey, a huge sports fan and astute investor, saw the opportunity in cable and convinced Getty to invest $10 million into the fledgling ESP- TV. On the day in February 1979 that Getty Oil invested, Rasmussen closed the deal with 1 2 3 4 5
  • 5. 2/2/2019 Internal Analysis: Strengths, Weaknesses, and Competitive Advantage https://edugen.wileyplus.com/edugen/courses/crs12076/ebook/c 03/dyer9781119411697c03xlinks.xform?id=c03-sec-7026 2/10 the NCAA. With the addition of a $1.38 million advertising contract from Anheuser-Busch, brewers of Budweiser beer, the new network, rechristened as ESPN, was ready to launch. Evey soon realized that making ESPN successful would require more than Bill Rasmussen's vision and sales abilities. Evey recruited Chet Simmons, who had helped launch ABC's Wide World of Sports and currently the head of NBC's sports, to lead the new network. Simmons raided NBC for other talent, none more important than Scotty Connal, a thirty-year NBC veteran and excellent producer. Connal would use all of his skills to stretch ESPN's meager resources to bring a champagne product to market on a beer budget. Connal taught his staff to make two cameras do the work of five. Connal exemplified the new hires, and the hiring policy, at ESPN. The first question for potential hires: “What section of the newspaper do you read first?” If the answer wasn't the sports section, the interview often ended. If sports was first, the next questions dealt with the greatest successes and heartaches of the candidate's favorite teams. If the new network delivered content to sports fanatics, that content would be produced, directed, and delivered by sports fanatics. Rasmussen's initial pitch to the NCAA became the bedrock of ESPN's search for content. Shut out from the “big time” of sports—the NFL, the
  • 6. NCAA's best football games, Major League Baseball, and the NBA—ESPN filled the airwaves with all types of NCAA sports, from expanded football coverage, including every bowl game not televised by the major networks, to volleyball to hockey to Division III events. The new network took other big risks, reaching out to underserved sports fans like NASCAR fans, contracting to broadcast NASCAR events in 1981. Simmons convinced the NFL, whose owners had rejected a cable contract to televise games by a vote of 32-0, to allow ESPN to broadcast the annual NFL draft in April 1980. Roger Werner, ESPN's third CEO, reflected on this early strategy: “I think one of the smartest things the company did in the early days was to look at the marketplace and ask ourselves: Where can we build consumer franchises that are really unique and where none of the big competitors are playing to any significant degree?…. We carved out a lot of new territory.” The new network, even with taped-delay games and a schedule filled with minor sporting events, continued to gain a loyal and growing viewer base among sports fans. In fact, by 1982 the network had been named in a divorce suit by a woman in Texas who claimed ESPN ruined her marriage by capturing the entire attention of her husband. The 1980s and 1990s: Growth and Expansion ESPN continued to gain viewers, content, and advertisers, but Getty Oil still pumped money into the venture. By 1984, Getty would invest a total of $67 million to keep the venture afloat. Chet Simmons left ESPN to run a new professional football league, the USFL, in 1982. Bill Grimes, a former CBS executive, took the helm at ESPN. That same year, Evey hired McKinsey and Company to help figure out how to make
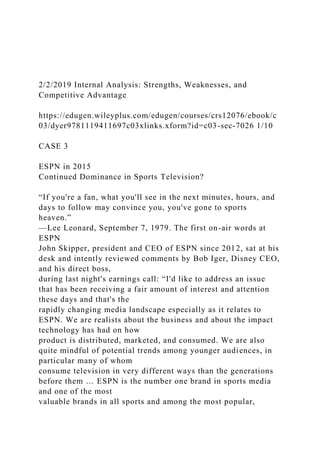
  • 7. the business profitable. Roger Werner acted as lead consultant on that engagement. ESPN originally hoped to attract viewers on an individual subscription basis, but the small numbers of cable viewers in the late 1970s doomed this revenue model before it launched. ESPN viewed itself as a nationwide network, and so it adopted the business model common in the Big 3 (ABC, CBS, and NBC) networks: the network paid local affiliates a small fee for the right to transmit its content to the local station, and the bulk of revenue came from advertising. Werner realized that ESPN had one revenue source (advertising), but three cost sources (programming costs, off- camera costs, and the affiliate fee). He proposed a new model: If ESPN could “flip” the affiliate fee and get cable providers to pay the network for the right to carry it to viewers, then ESPN could use the new revenue to improve the breadth and quality of its content. Werner and Grimes bet that a better product would attract more viewers to cable, and both the providers and ESPN would benefit. In 1983, ESPN began charging providers $0.05 per subscriber per month. The fee rose rapidly, first to $0.20 per month, and reached $0.70 per month by the end of the decade. With its newfound revenue, ESPN turned a profit by 1985. Exhibit 1 displays ESPN's financial data, including its subscription fees. Figure 1 illustrates long-term financial trends at ESPN. ESPN only, all numbers in 000s 1990 1995 2000 2005 2010 2011 2012 2013 2014 2015 (est)
  • 8. Net Advertising Revenue 240,000 395,000 825,000 1,117,695 1,585,184 1,691,694 1,769,830 1,868,350 1,950,389 2,079,281 Affiliate Revenue 295,944 524,649 1,080,294 3,307,567 5,235,612 5,693,335 5,972,561 6,501,108 7,007,944 7,506,226 Other Operating Revenue 15,000 80,000 108,000 83,338 33,163 78,993 71,093 75,359 30,144 31,952 Net Operating Revenue 550,944 999,649 2,013,294 4,508,600 6,853,959 7,464,021 7,813,484 8,444,817 8,988,477 9,617,459 6 7 2/2/2019 Internal Analysis: Strengths, Weaknesses, and Competitive Advantage
  • 9. https://edugen.wileyplus.com/edugen/courses/crs12076/ebook/c 03/dyer9781119411697c03xlinks.xform?id=c03-sec-7026 3/10 ESPN only, all numbers in 000s 1990 1995 2000 2005 2010 2011 2012 2013 2014 2015 (est) Operating SG&A 94,400 162,300 216,710 235,217 264,310 267,548 260,859 271,555 279,701 288,092 Programming Expense 321,000 539,397 1,212,200 3,086,272 4,746,929 4,984,276 5,333,175 5,706,497 6,230,952 6,729,428 Total Operating Expense 415,400 701,697 1,428,910 3,321,489 5,011,239 5,251,824 5,594,034 5,978,052 6,510,653 7,017,520 Cash Flow ($000) 135,544 297,952 584,384 1,187,111 1,842,720 2,212,197 2,219,450 2,466,765 2,477,823 2,599,938 Affiliate
  • 10. Revenue per Average Subscriber per Month ($) 0.44 0.67 1.14 3.08 4.39 4.77 5.04 5.54 6.10 6.61 Change in Subscription Rate 52.3% 70.1% 170.2% 42.5% 8.7% 5.7% 9.9% 10.1% 8.4% Subscribers (millions) 57.3 68 80.5 90.1 99.8 99 98.5 97 94.6 94.5 Change in Total Subscribers 19% 18% 12% 11% –1% –1% –2% –2% –0.1% Source: SNL Kagan 1990 1995 2000 2005 2010 2011 2012 2013 2014 2015 (est) Net Operating Revenue
  • 11. 550,944 999,649 2,013,294 4,508,600 6,853,959 7,464,021 7,813,484 8,444,817 8,988,477 9,617,459 Total Operating Expense 415,400 701,697 1,428,910 3,321,489 5,011,239 5,251,824 5,594,034 5,978,052 6,510,653 7,017,520 Cash Flow ($000) 135,544 297,952 584,384 1,187,111 1,842,720 2,212,197 2,219,450 2,466,765 2,477,823 2,599,938 Exhibit 1ESPN Selected Financial Data 2/2/2019 Internal Analysis: Strengths, Weaknesses, and Competitive Advantage https://edugen.wileyplus.com/edugen/courses/crs12076/ebook/c 03/dyer9781119411697c03xlinks.xform?id=c03-sec-7026 4/10 Figure 1ESPN Financial Performance, 1990–2015 ESPN continued to search for new and innovative content throughout the late 1980s and early 1990s. The network broadcast the finals of the America's Cup yachting race in 1983 and broadcast the entire event in 1987 from Australia. ESPN placed a mini-cam and live microphones on American skipper Dennis Connor's yacht to capture the excitement and intensity of the race. Viewed as a risky venture
  • 12. in 1987, new camera angles, “mic'd up” athletes, and complete coverage soon became the norm in cutting-edge sports television. ESPN contracted with the NFL in 1987 to broadcast eight games per year for $55 million per game: The network had arrived in the Big Time! Within 10 years, the network would hold broadcast rights for every major professional league and sport in the United States, and other global leagues. Exhibit 2 presents a timeline of many of these key events. The network continued to expand its content offerings and its international presence as well. By the early 1990s, a viewer could find some form of ESPN in 120 countries. In 1993, ESPN founded the ESPYs, the sporting world's version of the Academy Awards. The show became an instant hit and has provided many memorable moments, such as cancer-stricken NCAA basketball coach Jim Valvano's moving speech in 1993. Date President Owner Growth Notable 1979 Getty Oil $10MM investment grows to $67MM 1979 Chet Simmons Started ABC's Wide World of Sports 1980 NFL Draft Coverage First entry into NFL programming 1981 NASCAR Contract Brings NASCAR to national scene 1983 Bill Grimes Former CBS executive 1984 ABC Buys ESPN for $237MM 1987 Americas Cup First “mic'd up” performer
  • 13. 1987 First NFL Contract $55MM per game for 8 games/year 1988 Roger Werner Architect of business model change 1990 Steve Bornstein Started at ESPN in 1980 1992 ESPN Radio Sports Talk Radio 1993 ESPN2 X-Games, new demographic 1993 ESPYs Sporting equivalent to Academy Awards 1994 ESPN.com Original Web Presence 8 9 2/2/2019 Internal Analysis: Strengths, Weaknesses, and Competitive Advantage https://edugen.wileyplus.com/edugen/courses/crs12076/ebook/c 03/dyer9781119411697c03xlinks.xform?id=c03-sec-7026 5/10 Date President Owner Growth Notable 1996 Disney ESPN Valued at $5BB of $19BB purchase 1996 ESPNews News & entertainment 1997 ESPN Classic Archived Sporting Events 1998 George Bodenheimer Begins at ESPN as mail clerk
  • 14. 1998 ESPN the Magazine Compete with Sports Illustrated 1998 ESPN Zone Restaurants 2001 ESPN Deportes Spanish Language Channel & Radio 2002 ESPN+ Expansion to South America 2005 ESPNU Focus on Collegiate Sports 2008 ESPN Films Scripted Drama, Documentary 2011 Grantland.com Journalistic website and blog posts 2011 Longhorn Network First entry into regional TV markets 2012 John Skipper Founded ESPN The Magazine 2014 SEC Network Focus on SEC Sporting Events 2014 Disney ESPN valued at $50BB Sources: Case writer compilation from sources in footnotes Exhibit 2ESPN Selected Timeline of Key Events By decade's end, the E (entertainment) in ESPN would expand as the network created a new division, ESPN films, to create original content, both documentary and dramatic. The division's first project was the Sports Century series. The project began with a panel of forty- eight experts who identified the top 100 athletes of the twentieth century. Sports Century created fifty 30-minute documentaries on the top 50 athletes and events. ESPN supplemented these films with complementary materials on its website, magazine, radio network, and across all other media
  • 15. platforms in the company. The series garnered an Emmy for the network and its first Peabody Award for excellence in radio and television broadcasting. More importantly, Sports Century turned a profit and highlighted the power of ESPN's integrated media empire in bringing content to viewers. SportsCenter and the ESPN Brand At the center of that sprawling empire lay ESPN's initial program. What began in 1979 as Sports Central had morphed into SportsCenter, the heart and soul of ESPN's value proposition and business culture. George Grande and Lee Leonard, decked out in orange sport coats on an orange set—to highlight the ownership of Getty Oil—ad libbed most of the first 30-minute segment because few people really imagined that a sports report, usually limited to two minutes at the end of a newscast, could find enough content to fill 30 minutes. By the time Keith Olbermann and Dan Patrick turned SportsCenter into must-see-TV, their 30-minute segment would be repeated four to six times each day with little loss in viewership. The appeal of a 30-minute sports show appealed to sports broadcasters because they loved the idea of plying their trade for 10 to 15 times the amount of time they were allowed at local stations. Thirty minutes provided ample time to report the news, but also to provide analysis, deeper stories, and ample doses of humor. From Leonard and Grande onward, SportsCenter anchors adopted an attitude that “What do we have to lose—no one is watching anyway.” But viewers did watch, and the off-beat nature of SportsCenter changed in June 1980 when Chris (“Boomer”) Berman transformed Kansas City
  • 16. Royals first baseman John Mayberry into “John Mayberry RFD.” Berman's improvisational nicknames for other baseball players, such as Sammy “say 10 11 2/2/2019 Internal Analysis: Strengths, Weaknesses, and Competitive Advantage https://edugen.wileyplus.com/edugen/courses/crs12076/ebook/c 03/dyer9781119411697c03xlinks.xform?id=c03-sec-7026 6/10 it ain't” Sosa and Albert “Winnie the” Pujols, and his role as the “Swami” transformed SportsCenter into an entertaining improv performance that attracted a dedicated following. Berman would anchor SportsCenter until 1986, and remains one of the networks premier personalities today. The nature of SportsCenter changed in 1988 when Steve Bornstein, then Executive VP of Programming and Production, brought in John Walsh, founder of Inside Sports and former head of Rolling Stone Magazine, to look at SportsCenter. Bornstein, who would become ESPN's fourth president two years later, told Walsh: “SportsCenter is the only thing we don't pay rights for, so this is our most efficient financial vehicle, and I want you to turn it into the Sports Illustrated of television.” Walsh, with a degree in journalism and a history in print media, began to hire sports journalists—not merely on-camera personalities—to staff and lead SportsCenter. The show transformed from a lovable and
  • 17. entertaining 30 minutes with the likes of Boomer Berman into a “virtual gathering place where sports fans could ‘assemble’ every night, not just to hang out but to learn something.” Walsh's imprint was to provide more breaking news and richer coverage from true journalists, and better highlights and visuals to attract viewers. Walsh believed that the SportsCenter franchise should always be something bigger than a personality-driven program. If Chris Berman brought SportsCenter into national prominence, Keith Olbermann and Dan Patrick sent the show into the stratosphere. The two men co-anchored their first SportsCenter on April 5, 1992. During that show, the anchors, the staff, and probably the viewers sensed a special chemistry between Keith and Dan. That chemistry, combined with their innate talents as journalists and writers to create a SportsCenter that one commentator wrote “had all the qualities of chocolate cake: rich, filling ingredients of news and highlights thickly frosted with humor.” Their SportsCenter aired live at 11:00 p.m. but would be rebroadcast six times in the next 24 hours. Bill Belichick, then coach of the Cleveland Browns, typified many fans and watched all six reruns. When asked by Olbermann why, Belichick responded, “I know all the punch lines by then. I get to do the jokes.” The Olbermann and Patrick partnership ended in 1998 when the mercurial Olbermann jumped to a new cable sports competitor: Fox Sports 1. Roger Werner began preaching about the importance of the brand during his tenure as president (1988-1990); Steve Bornstein (1990-1998) and George Bodenheimer (1998-2012) continued to beat the drum. Lee Ann Daly, a marketing executive with a New York advertising background, helped
  • 18. Bodenheimer refine and reframe the brand. From its position at the top of the sports world, ESPN could call the shots on how fans received their sports, but Daly argued that the essence of ESPN's brand, a deep and intimate human connection with fans and the sports they loved, required a humbler, kinder approach. The ESPN brand changed from being the “worldwide leader in sports television” to “we're the world's biggest sports fan, and we exist solely to serve fans wherever they are.” The company revised its mission statement to reflect this new attitude: “to serve sports fans wherever sports are watched, listened to, discussed, debated, read about, or played.” Or, as Bodenheimer called it “sports fans serving sports fans.” The 21 Century: Continued Dominance & Looming Challenges As the ESPN brand continued to grow, so did demand for sports programming. In 1983, ESPN offered cable providers a radical proposition, they should pay ESPN $0.05 a month per subscriber for the right to carry the network. These rates increased consistently over the years to the point that in 2015, ESPN was charging a whopping $6.61 per subscriber (Exhibit 3 compares subscription rates for the top 10 cable channels in 2015). It was by far the most expensive cable network on television, charging four times more than the nearest competitor. That amount reflects both the demand by sports viewers as well as the market power of the ESPN brand in creating and delivering sports content. Exhibit 4 lists the top 15 sports networks, the estimated number of subscribers, and approximate amounts of revenue (in 2014) generated by each. Network Fee
  • 19. ESPN $ 6.61 TNT $ 1.65 Disney Channel $ 1.34 NFL Network $ 1.31 Fox News $ 1.12 USA Network $ 1.00 FS1 (Fox Sports 1) $ 0.99 TBS $ 0.85 ESPN2 $ 0.83 Nickelodeon $ 0.73 12 13 14 15 16 St 2/2/2019 Internal Analysis: Strengths, Weaknesses, and Competitive Advantage
  • 20. https://edugen.wileyplus.com/edugen/courses/crs12076/ebook/c 03/dyer9781119411697c03xlinks.xform?id=c03-sec-7026 7/10 Source: SNL Kagan Exhibit 3The Ten Most Expensive Cable Channels, 2015 Network Fee Subscribers (millions) Revenue (billions) ESPN $ 6.61 94.5 $ 7.50 NFL Network $ 1.31 73.6 $ 1.16 FS1 $ 0.99 91.2 $ 1.08 ESPN2 $ 0.83 94.5 $ 0.94 SEC Network $ 0.66 69.1 $ 0.55 Golf Channel $ 0.35 79.4 $ 0.33 NBC Sports Network $ 0.30 83.1 $ 0.30 Big Ten Network $ 0.39 62 $ 0.29 MLB Network $ 0.26 71.3 $ 0.22 FS2 $ 0.28 64 $ 0.22 NBA TV $ 0.29 57.2 $ 0.20 ESPNU $ 0.22 74.9 $ 0.20 CBS Sports Network $ 0.26 61 $ 0.19 NHL Network $ 0.32 37.4 $ 0.14
  • 21. Pac 12 Network $ 0.39 12.3 $ 0.06 Source: SNL Kagan Exhibit 4The top 15 Sports Networks, 2015 By 2014, ESPN generated six times more revenue than its nearest competitor. This allowed for continued separation from other sports networks and, according to some, complete domination of certain markets. Expert reports estimated that ESPN spends roughly $1.9 billion per year for Monday Night Football, $1.47 billion for rights to NBA games, $700 million for Major League Baseball, and hundreds of millions for college football (SEC, ACC, Big 10, etc.). ESPN's broadcasting contracts put the company on the hook for $6 billion dollars annually to broadcast more than half the live sports shown on TV. In the 1990s, ESPN helped NASCAR move from a niche viewing audience to a national obsession. In the 2000s, ESPN did the same for college football. College Football: ESPN as the Market Leader Two things highlight ESPN's dominance of college football. First, ESPN has turned the college bowl season into a national event. By 1991, ESPN had purchased enough rights to bowl games that it created a Bowl Week promotion for the week between Christmas and New Year's Day. In 2015, ESPN still broadcast all but two games of the bowl season, which has been retitled as Bowl Month. The 2015 bowl season featured a record forty games, and in order to fill all the bowl slots, the NCAA had to relax the rule that no team with a losing record could play in a bowl. Second, ESPN and its affiliate networks televised around 450 games in the 2015 season alone, almost 35 games each week.
  • 22. The nearest competitor, Fox Sports, broadcast around 50. All other sports networks combined could not come close to competing with ESPN's total domination of college football. ESPN has transformed college football from games played almost exclusively on Saturdays to a full slate of games on Wednesday, Thursday, and Friday nights, and 12-14 hours on Saturday, excluding its fabled College Game Day pre-show and post-game wrap-ups. 17 18 19 2/2/2019 Internal Analysis: Strengths, Weaknesses, and Competitive Advantage https://edugen.wileyplus.com/edugen/courses/crs12076/ebook/c 03/dyer9781119411697c03xlinks.xform?id=c03-sec-7026 8/10 ESPN worked to create what it considered “ideal match-ups,” and constantly brokered deals with schools and conferences to create games that would optimize viewership. ESPN also used the lure of viewers to change game days (for example, from a Saturday afternoon to a Monday night), or game times (some games on the West Coast begin in the morning to accommodate an East Coast audience). ESPN employed its long- term contracts with major conferences, as well as its promise of millions of eyeballs to set up a growing number of one-off match-ups. Athletic programs might feel
  • 23. beholden to ESPN and see their schedules dictated by the interests of the network. Some schools claimed that ESPN had been overly involved in conference realignments, to create to the most ideal potential games in the best television markets. This would be a violation of NCAA rules, and the network vehemently denied any involvement at that level, although it admits to playing an appropriate advisory role. Other stakeholders have cried foul about ESPN's market power. A spate of news reports signaled a growing discontent with ESPN's apparent control of college football. For example, one report proclaimed that “ESPN has become both puppet-master and kingmaker, arranging games, setting schedules, and bestowing the gift of nationwide exposure on its chosen universities, players, and coaches.” The shortened game preparation time for teams risked the quality of the on-field product, and increased time away from class by players seemed to run counter to the notion of student-athletes. In spite of these criticisms and realities, most collegiate programs would do nearly anything to be on ESPN because the exposure proves vital for recruiting. Players love to be seen on ESPN, and fans love to watch their teams on ESPN. The combination of access to enormous amounts of revenue and an unflinching commitment to getting the best product on TV has led to more serious accusations as well. In the mid-2000s, the Justice Department responded to complaints of the anti-competitive practice of “warehousing” games. In an effort to have access to the best possible match-ups, ESPN bought the rights to as many teams and games as possible— sometimes more than it even had the capacity to broadcast. College Sports Television (CSTV) accused ESPN of purchasing rights to games and then
  • 24. not broadcasting them. CSTV claimed that ESPN refused to sell those rights to competitors and deprived teams of exposure, and the networks of revenues. Although the Justice Department took no action, the case illustrated the extent of ESPN's distinctive advantage in the marketplace, an advantage some say borders on an anti-competitive monopoly. ESPN originally sought to “complement” and enhance the NCAA in its quest for exposure. As the twenty-first century rolls on, many wonder if ESPN dictates rather than complements college football. Looming Challenges Given ESPN's overwhelming brand power, revenue structure, and the magnitude of its broadcast contracts, its market position seemed insurmountable. According to Forbes, in 2015, the network possessed the 32nd most valuable brand…in the world. ESPN appeared to be in solid position to continue as the runaway market leader in sports entertainment. Yet, a closer look at the future revealed uncertainties that could seriously challenge ESPN's position. Since 2004, ESPN had seen the rise of potential disruptive competitors in the form on social media (e.g., Facebook in 2004, Twitter in 2006, Instagram in 2010) and streaming video services (e.g., YouTube in 2005, Netflix in 2007). Social media allowed sports fanatics to get “breaking stories” about their favorite teams and players from the teams and players themselves. One no longer had to wait until the evening's SportsCenter to catch all the latest news. Streaming video, whether legal or pirated, threatened ESPN's ability to drive viewership. By 2013, the rise of smartphone technology and
  • 25. mobile viewing options allowed fans to catch games, or highlights, anytime and anywhere on their phones. Exhibit 5A, 5B details changes in viewing patterns between 2013 and 2014. With so many options for entertainment, a growing number of individuals opted out of their cable packages, or “cut the cord” and relied solely on over-the-air or streaming content to meet their entertainment needs. No one could count the “cord nevers,” or young people who never signed up for cable and opted for streaming video instead. COMPOSITE (Viewers,000s) COMPOSITE (Minutes) Q3 14 Q3 13 Q3 14 Q3 13 On Traditional TV 282665 283682 141:19 147:01 Watching Time-shifted TV 173305 167142 14:20 13:12 Using a DVD/Blu-Ray Device 139273 141648 5:16 5:24 Using a Game Console 95315 94939 8:14 7:07 Using a Multimedia Device 26872 n/a 2:09 n/a Using the Internet on a Computer 194527 200013 30:06 27:02 Watching Video on Internet 144141 147678 10:42 6:41 Using any App/Web on a Smartphone 162798 139136 47:35 35:44 20 21
  • 26. 22 23 2/2/2019 Internal Analysis: Strengths, Weaknesses, and Competitive Advantage https://edugen.wileyplus.com/edugen/courses/crs12076/ebook/c 03/dyer9781119411697c03xlinks.xform?id=c03-sec-7026 9/10 COMPOSITE (Viewers,000s) COMPOSITE (Minutes) Q3 14 Q3 13 Q3 14 Q3 13 Watching Video on a Smartphone 125686 100588 1:46 1:25 Listening to AM/FMRadio 258734 257420 58:53 60:42 Exhibit 5ATrends in TV Viewership Average Daily Minutes Quintile # persons,000s Stream Internet TV Top 24,552 23.8 62.2 251.0 2nd 24,552 2.7 30.3 237.9 Middle 24,543 0.7 17.9 243.0 Fourth 24,532 0.2 12.7 243.1 Bottom 24,558 0.0 7.2 245.0
  • 27. Non Streamers 123,240 0.0 1.0 223.1 Total 245,977 2.8 13.6 233.7 Source: Neilsen, Total Audience Report, 2014 http://www.nielsen.com/us/en/insights/reports/20 Exhibit 5BCross-Platform Media Usage, All Groups The number of ESPN subscribers peaked in 2010 at 99.8 million. As a result of the constantly shifting options for sports programming consumption, ESPN lost between 5 million and 7 million subscribers between 2011 and 2015. The loss of 5–7 percent of its viewer base reduces both revenue sources. With fewer viewers, ESPN loses clout with advertisers and receives lower rates. The network also loses subscription fees for all its network offerings (ESPN, ESPN2, ESPNU, and ESPN Classic, for example). And all indications are that this trend will continue in the near-term. In 1983 ESPN flipped the standard network revenue model by charging cable providers for access rights to ESPN's programming. This contributed to the practice of “bundling” that has become the basic sales platform of cable and satellite providers. Bundling created a package of over-the-air networks, basic programming such as CNN, TNT, and TBS, and specialty channels such as ESPN, HBO, HGTV, and many others. By purchasing the bundle, viewers saved money and had a wider range of viewing options. While some premium channels can be ordered individually (i.e., HBO), networks such as ESPN represented a critical part of a basic bundle. Anyone purchasing a cable or satellite package pays for ESPN—whether they
  • 28. want it or not. The implications of bundling matter for all networks, but for ESPN bundling played an outsized role. A recent report by Fox Sports did some back-of- the-envelope math and drew the following conclusions: (A)round 48 million cable and satellite subscribers watch ESPN every month. That's a very big number. But it also means that 44 million cable and satellite subscribers pay $6.60 a month for ESPN and don't watch it in an average month. That means every month ESPN is pocketing $290 million off cable and satellite subscribers who don't watch the channel. Over the course of a year ESPN makes over $3 billion a year off consumers who don't watch ESPN. In another report, the same author asked, “Think about how crazy this is. Does any other business—besides insurance— make 75 percent of its money off people who wouldn't choose to consume the product?” With the advent of streaming video and the move to mobile devices, the historical practice of bundling packages for subscription exhibited signs of vulnerability. Federal legislation had been introduced to break up bundles and force providers to offer a la carte packaging; a 2013 survey of cable subscribers found 92 percent of subscribers willing to purchase cable channels a la carte. The legislation did not pass, but significant support still existed for some sort of legislation, and analysts sensed continued and growing animosity with the practice of bundling in both the public and private sector. 24 25
  • 29. 26 27 2/2/2019 Internal Analysis: Strengths, Weaknesses, and Competitive Advantage https://edugen.wileyplus.com/edugen/courses/crs12076/ebook/c 03/dyer9781119411697c03xlinks.xform?id=c03-sec-7026 10/10 “Cord-cutting” could significantly affect ESPN's business model. ESPN had already lost between 5 million and 7 million subscribers, dropping almost 3 million since 2013. The network responded by firing 400 employees and cutting budgets by $400 million. Revenue continued to climb, but only because ESPN had increased its subscription fee by an average of 9.5 percent per year since 2012. If ESPN unbundled itself from cable, a standalone ESPN, at current subscription rates, would be competitive with monthly subscription offerings such as Netflix ($8), Hulu ($8), or Amazon Prime ($8.25 or $99 per year). If, however, a standalone ESPN attracted only half its current subscription base, it would need to charge substantially more than double $6.60 to make up for lost advertising revenue. A Fox Sports report noted: In order to net $6 billion … for all ESPN channels, ESPN would need 20 million yearly subscribers all paying $300 a year just for the ESPN channels. Putting that into context, the NFL Sunday Ticket on DirecTV is right at 2 million subscribers. If only 2 million households are willing to pay around $300 for every NFL game that they can't get for free on
  • 30. traditional television, would 18 million more be willing to pay that much for … ESPN? What if the amount that cable can pay for those games has been artificially inflated by the fact that nearly half of all sports cable subscribers never watch ESPN? Effectively, ESPN has been paying for sports with money from people who would never pay for sports themselves?” As Skipper pondered the situation, he was struck by the apparent paradox. His company dominated sports programming and was a key player in every sport, but that dominance belied tectonic changes in technology that threatened ESPN's source of value added and revenue. Skipper had several questions: 1) how could he assess the real threat from technological change to ESPN? 2) How should ESPN respond? The network had plenty of live sports programming, but how should bread-and-butter programs such as SportsCenter change to be relevant in the new environment? 3) Was American culture changing in a way that threatened the network's fundamental revenue model? 4) Would continuing to bundle itself into cable packages continue to create value for ESPN? 5) How should ESPN position itself in the new entertainment world to both regain its dominant position and to continue to grow? Copyright © 2018, 2016 John Wiley & Sons, Inc. All rights reserved. 28 29
  • 31. As we have seen in previous modules, there has been an explosion of interest in studying the Transatlantic Slave Trade, its volume, direction, and, as we will see in future modules, its effects on Europe and Africa. Nevertheless, a glaring gap remains in the literature on the role of West Africa. In Module 3, we examined African societies and states prior to and during the Transatlantic Slave Trade era. While the readings for that module present a concise narrative of a larger region of Africa, the information can be daunting and difficult to understand on its own. Students in the United States often have only a limited knowledge of African history, a topic that is not studied sufficiently in American schools. Furthermore, Africa in the period 1500 to 1800 consisted of thousands of different languages and ethnic groups, dozens of kingdoms and other political entities, and various regional climates. Lázaro Luis, map of Western Africa, 1563.Click on the image to view in full-size. A new approach to understanding Africa’s history of the slave trade is to take micro or regional approaches. The Voyages database now allows scholars to estimate which particular regions of Africa supplied most of the captives in the trade. Using this information, scholars conducted case studies of individual regions of West Africa, or, in the case of the historian we will study in this present module, an individual port town. Africa is perhaps the most diverse continent in the world, consisting of a multitude of languages, ethnic groups, climates, and geographies. These differences shaped the continent’s history. Moreover, prior to and during the era of the Transatlantic Slave Trade, there were massive political changes in the Western portion of the continent (new political entities rose and fell with significant regularity, for example) that shaped the evolution of the trade. Compounding the complexities of studying the trade, European nations had shifting experiences in trading with West Africa.
  • 32. Some European ships traded mainly with one particular region of West Africa in order to develop relationships and establish ties with communities. For example, Portuguese merchants tended to trade predominantly in the region in the modern nation of Angola, while English merchants traded heavily in the regions in the modern nations of Ghana and Nigeria. The French, on the other hand, traded overwhelmingly with the regions in the modern nation of Senegal. However, some European traders took the opposite approach and visited several different regions during individual voyages to diversify the ethnic origins of their slaves. Individual African communities also had shifting experiences in the trade, exporting many captives in one era, tapering off their connection to the trade in another era, and re-entering the trade again decades later. Given the number of variables involved, arriving at a cohesive narrative of African history during this era is rather complicated. A depiction of Mansa Musa I of the Mali Empire holding a gold nugget from the 1375 Catalan AtlasClick on the image to view in full-size. Randy Sparks’ Where the Negroes Are Masters (2014) represents a new and innovative approach to the study of Africa’s involvement in the slave trade. Sparks examines Anomabo (also known as Anomabu or Annamaboe), a single port town on the Gold Coast, which was one of the major regions of West Africa supplying captives to the Transatlantic Slave Trade. Today, the Gold Coast is part of the Republic of Ghana (Links to an external site.)Links to an external site.. During the 1400s, European merchants (primarily the Portuguese) began exploring this part of the coast for the opportunity to develop profitable trading relationships. Essentially, European merchants were looking for products that Europe could not produce, including spices, tropical foodstuffs such as cocoa, and gold. Europeans discovered plentiful gold resources in this area of West Africa, resulting in the moniker the “Gold Coast.” British, Dutch, Danish, Prussian, Swedish,
  • 33. and Portuguese traders then came to the region to trade goods like guns and rum for gold, making the area one of the largest suppliers of gold on Earth. By the late 1600s, however, traders’ attention shifted from gold to captives who would be shipped to the Americas. Sparks’ study focuses on this transformation, from trading gold to trading for humans, in the port town of Anomabo. He details African responses to the trade, its development, expansion, and ultimate collapse through examinations of the relationships between a few key individuals. Such a micro approach allows students to gain a greater understanding of how the Transatlantic Slave Trade operated within Africa. It also presents a detailed description of how Africans participated in the trade and its effects on the sociopolitical conditions of one port town. Such a focused approach also aids students’ comprehension of the trade during this complex era.