How data driven entrepreneur analyzes imperfect information for business opportunity evaluation
•Download as DOCX, PDF•
1 like•257 views

The document describes how a data-driven entrepreneur analyzes past investment portfolio data using a partial observed Markov decision process (POMDP) model to identify business opportunities for optimal investment. Specifically, it downloads portfolio data from an organization, builds a POMDP model from the data, analyzes the model numerically to identify companies providing high, medium, and low returns, and generates a graph showing investment returns. The analysis finds that companies MA and PFE provided high returns while others provided low or medium returns based on the historical portfolio data.

Recommended
More Related Content
What's hot
What's hot (20)
Similar to How data driven entrepreneur analyzes imperfect information for business opportunity evaluation
Similar to How data driven entrepreneur analyzes imperfect information for business opportunity evaluation (20)
More from Venkat Projects
More from Venkat Projects (20)
Recently uploaded
Recently uploaded (20)
How data driven entrepreneur analyzes imperfect information for business opportunity evaluation
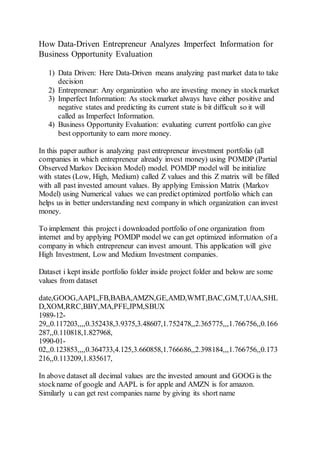
- 1. How Data-Driven Entrepreneur Analyzes Imperfect Information for Business Opportunity Evaluation 1) Data Driven: Here Data-Driven means analyzing past market data to take decision 2) Entrepreneur: Any organization who are investing money in stockmarket 3) Imperfect Information: As stockmarket always have either positive and negative states and predicting its current state is bit difficult so it will called as Imperfect Information. 4) Business Opportunity Evaluation: evaluating current portfolio can give best opportunity to earn more money. In this paper author is analyzing past entrepreneur investment portfolio (all companies in which entrepreneur already invest money) using POMDP (Partial Observed Markov Decision Model) model. POMDP model will be initialize with states (Low, High, Medium) called Z values and this Z matrix will be filled with all past invested amount values. By applying Emission Matrix (Markov Model) using Numerical values we can predict optimized portfolio which can helps us in better understanding next company in which organization can invest money. To implement this project i downloaded portfolio of one organization from internet and by applying POMDP model we can get optimized information of a company in which entrepreneur can invest amount. This application will give High Investment, Low and Medium Investment companies. Dataset i kept inside portfolio folder inside project folder and below are some values from dataset date,GOOG,AAPL,FB,BABA,AMZN,GE,AMD,WMT,BAC,GM,T,UAA,SHL D,XOM,RRC,BBY,MA,PFE,JPM,SBUX 1989-12- 29,,0.117203,,,,0.352438,3.9375,3.48607,1.752478,,2.365775,,,1.766756,,0.166 287,,0.110818,1.827968, 1990-01- 02,,0.123853,,,,0.364733,4.125,3.660858,1.766686,,2.398184,,,1.766756,,0.173 216,,0.113209,1.835617, In above dataset all decimal values are the invested amount and GOOG is the stockname of google and AAPL is for apple and AMZN is for amazon. Similarly u can get rest companies name by giving its short name
- 2. Screen shots Double click on ‘run.bat’ file to get below screen In above screen click on ‘Upload Investment Portfolio’ button to upload portfolio data After uploading portfolio will get below screen
- 3. In above screen now click on ‘Generate Model’ button to create matrix with Z values from portfolio
- 4. In above screen we can see portfolio contains total 7126 records which contains investment data. Now click on ‘Build POMDP Model’ button to build POMDP matrix model In above screen we can see total POMDP model tree length is 20 now click on ‘Optimal Investment Portfolio With Numerical Analysis’ to analyze model to get optimize portfolio
- 5. In above screen we can see some companies has given some returns and some returns 0% profit. Now see in below screen to see which company returns high, low and medium In above screen in POMDP model we can see in selected text that MA and PFE company returns high profit and other returns low and medium profit. To clearly see return values see below screen. Scroll down output textarea to view all output
- 6. In above screen we can see total annual returns and the companies which returns high and low profit. From above screen users can easily understand which company returns high profit and in which they have to invest. Now click on ‘Optimal Investment Portfolio Graph’ button to get below graph In above graph we are showing 3 investment records where investment1 showing high returns and investment3 showing 0 returns. In above graphs x- axis represents record no of each investment as Risk Aversion and y-axis represents returns on investment or optimized portfolio value.
- 7. From above screen shots by seeing high returns users can easily understand and invest in those companies which are returning high profits