Tembisa Central Terminating Pills +27838792658 PHOMOLONG Top Abortion Pills F...
Bus 308 week 5 final paper
1. Predictive Sales Report
BUS 308: Statistics for Managers
Provided below is a data that you will use to determine unemployment rate among
others from a retail store company. You will be hired as a consultant and it is
your job to determine how unemployment rate can affect the store’s inventory at
every store and how it can affect their cost-effective operation. You will also
determine how unemployment can affect sales and number of consumers coming in to
the store. A predictive sales report is expected from you.
Part I
YearJanFebMarAprMayJunJulAugSepOctNovDecAnnual19483.43.843.93.5
3.6
3.6
3.93.83.7
3.843.75
19494.34.75
5
.36
.16
.2
6
.76
.86
.6
7.96
.46
.6
6
.05
195
06
.5
6
.46
.35
.85
.5
5
.45
4.5
4.4
4.2
4.2
4.35
.2
1195
13.73.43.43.133.2
3.13.13.33.5
3.5
3.13.2
8195
2
3.2
3.12
.92
.9333.2
3.4
3.132
.82
.73.03195
32
.92
.6
2
.6
2
.72
.5
2
.5
2
.6
2
.72
.93.13.5
4.5
2
.93195
44.95
.2
5
.75
.95
.95
.6
5
.86
6
.15
.75
.35
5
.5
9195
5
4.94.74.6
4.74.34.2
44.2
4.14.34.2
4.2
4.37195
6
43.94.2
44.34.3
4.44.13.93.94.34.2
4.13195
74.2
3.93.73.94.14.34.2
4.14.44.5
5
.15
.2
4.30195
85
.86
.46
.7
7.47.47.37.5
7.47.16
.76
.2
6
.2
6
.84195
96
5
.95
.6
5
.2
5
.15
5
.15
.2
5
.5
5
.75
.85
.35
.45
196
05
.2
4.85
.45
.2
5
.15
.45
.5
5
.6
5
.5
6
.16
.16
.6
5
.5
4196
16
.6
6
.96
.977.16
.976
.6
6
.76
.5
6
.16
6
.6
9196
2
5
.85
.5
5
.6
5
.6
5
.5
5
.5
5
.45
.75
.6
5
.45
.75
.5
5
.5
7196
35
.75
.95
.75
.75
.95
.6
5
.6
5
.45
.5
5
.5
5
.75
.5
5
.6
4196
45
.6
5
.45
.45
.35
.15
.2
4.95
5
.15
.14.85
5
.16
196
5
4.95
.14.74.84.6
4.6
4.44.44.34.2
4.144.5
1196
6
43.83.83.83.93.83.83.83.73.73.6
3.83.79196
73.93.83.83.83.83.93.83.8
3.843.93.83.84196
83.73.83.73.5
3.5
3.73.73.5
3.43.43.43.43.5
6
196
93.43.43.43.43.43.5
3.5
3.5
3.73.73.5
3.5
3.4919703.94.2
4.44.6
4.84.95
5
.15
.45
.5
5
.96
.14.9819715
.95
.96
5
.9
5
.95
.96
6
.16
5
.86
6
5
.95
1972
5
.85
.75
.85
.75
.75
.75
.6
5
.6
5
.5
5
.6
5
.35
.2
5
.6
019734.95
4.95
4.9
4.94.84.84.84.6
4.84.94.86
19745
.15
.2
5
.15
.15
.15
.45
.5
5
.5
5
.96
6
.6
7.2
5
.6
41975
8.18.18.6
8.898.88.6
8.48.48.48.38.2
8.481976
7.97.77.6
7.77.47.6
7.87.87.6
7.77.87.87.7019777.5
7.6
7.47.2
77.2
6
.976
.86
.86
.86
.47.05
19786
.46
.36
.36
.16
5
.96
.2
5
.96
5
.85
.96
6
.0719795
.9
5
.95
.85
.85
.6
5
.75
.76
5
.96
5
.96
5
.85
19806
.36
.36
.36
.97.5
7.6
7.87.77.5
7.5
7.5
7.2
7.181981
7.5
7.47.47.2
7.5
7.5
7.2
7.47.6
7.98.38.5
7.6
2
1982
8.6
8.999.39.49.6
9.89.810.110.410.8
10.89.71198310.410.410.310.2
10.110.19.49.5
9.2
8.88.5
8.39.6
0198487.87.87.77.47.2
7.5
7.5
7.37.47.2
7.37.5
11985
7.37.2
7.2
7.37.2
7.47.47.17.17.1777.191986
6
.77.2
7.2
7.1
7.2
7.2
76
.9776
.96
.6
7.0019876
.6
6
.6
6
.6
6
.36
.36
.2
6
.16
5
.96
5
.85
.76
.1819885
.75
.75
.75
.4
5
.6
5
.45
.45
.6
5
.45
.45
.35
.35
.4919895
.45
.2
5
5
.2
5
.2
5
.35
.2
5
.2
5
.35
.35
.45
.45
.2
6
19905
.45
.3
5
.2
5
.45
.45
.2
5
.5
5
.75
.95
.96
.2
6
.35
.6
2
19916
.46
.6
6
.86
.76
.96
.96
.86
.96
.9777.36
.85
1992
7.37.47.47.47.6
7.87.77.6
7.6
7.37.47.47.4919937.37.177.17.176
.96
.86
.76
.86
.6
6
.5
6
.91
19946
.6
6
.6
6
.5
6
.46
.16
.16
.16
5
.95
.85
.6
5
.5
6
.101995
5
.6
5
.45
.45
.85
.6
5
.6
5
.75
.75
.6
5
.5
5
.6
5
.6
5
.5
91996
5
.6
5
.5
5
.5
5
.6
5
.6
5
.35
.5
5
.15
.2
5
.2
5
.45
.45
.4119975
.35
.2
5
.2
5
.14.95
4.94.84.9
4.74.6
4.74.9419984.6
4.6
4.74.34.44.5
4.5
4.5
4.6
4.5
4.44.44.5
019994.34.44.2
4.34.2
4.3
4.34.2
4.2
4.14.144.2
2
2
00044.143.84444.13.93.93.93.93.972
0014.2
4.2
4.34.44.34.5
4.6
4.95
5
.35
.5
5
.74.742
002
5
.75
.75
.75
.95
.85
.85
.85
.75
.75
.75
.96
5
.782
0035
.85
.95
.96
6
.16
.3
6
.2
6
.16
.16
5
.85
.75
.992
0045
.75
.6
5
.85
.6
5
.6
5
.6
5
.5
5
.45
.45
.5
5
.45
.45
.5
42
005
5
.35
.45
.2
5
.2
5
.15
5
4.95
5
5
4.95
.082
006
4.74.84.74.74.6
4.6
4.74.74.5
4.44.5
4.44.6
12
0074.6
4.5
4.44.5
4.44.6
4.74.6
4.74.74.75
4.6
2
2
0085
4.95
.15
5
.45
.6
5
.86
.16
.16
.5
6
.87.35
.802
0097.88.38.79
9.49.5
9.5
9.6
9.8109.99.99.2
82
0109.89.89.99.99.6
9.49.5
9.5
9.5
9.5
9.89.39.6
32
0119.19
8.9999.19998.98.6
8.5
8.932
012
8.38.38.2
8.18.2
8.2
8.2
8.17.87.97.87.88.082
0137.9
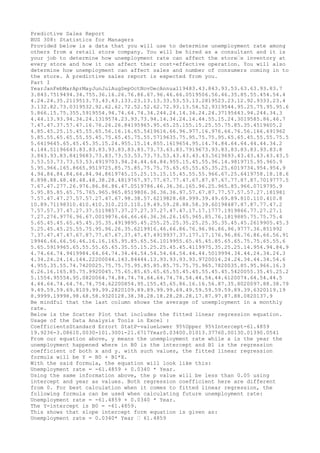
Be mindful that the last column shows the average of unemployment in a monthly
rate.
Below is the Scatter Plot that includes the fitted linear regression equation.
Usage of the Data Analysis Tools in Excel :
CoefficientsStandard Errort StatP-valueLower 95
%
Upper 95
%
Intercept-6
1.485
9
19.92
36
-3.086
10.0030-101.3001-2
1.6
717Year0.03400.01013.3776
0.00130.01390.05
41
From our equation above, y means the unemployment rate while x is the year the
unemployment happened where in B0 is the intercept and B1 is the regression
coefficient of both x and y. with such values, the fitted linear regression
formula will be Y = B0 + B1*X.
With the said formula, the equation will look like this:
Unemployment rate = -6
1.485
9 + 0.0340 * Year.
Using the same information above, the p value will be less than 0.05
using
intercept and year as values. Both regression coefficient here are different
from 0. For best calculation when it comes to fitted linear regression, the
following formula can be used when calculating future unemployment rate:
Unemployment rate = -6
1.485
9 + 0.0340 * Year.
The Y-intercept is B0 = -6
1.485
9.
This shows that slope intercept form equation is given as:
Unemployment rate = 0.0340* Year ’ 6
1.485
9
2. Actual Sufficiency of the Model:
ANOVAdfSSMSF
Significance F
Regression1
26.4258
26.4258
1
1
.4079
0.001
3
Residual63
1
45.9
3
672.3
1
65Total641
72.3
625
The ANOVA or F
is equal to 0.001
3
meaning it is lesser than 0.05 making the
coefficients significant to 0. The fitted model then competent to use for F
analysis.
Simple Linear Regression AnalysisRegression StatisticsMultiple R0.3
9
1
6R Square
0.1
53
3
Adjusted R Square0.1
3
9
9
Standard Error1
.5220Observations65
The above table is a Simple Linear Regression Analysis. F
rom the said table, we
can see that the r-square is 0.1
53
3
. This means that 1
5.3
3
% there is an
independent variable that can explain the unemployment rate annually and other
reasons for unemployment can be attributed to unknown factors.
Prediction of the unemployment rate for 201
6:
F
or predicting future unemployment rate like possibly for 201
6, the following
formula can be used using the fitted linear regression line formula:
Unemployment rate = 0.03
40* 201
6 – 61
.48
59
= 7.03
.
Residual sheets are used to calculate residuals using excel.
201
3
data shows the most updated unemployment rate at 6.9
3
(Unemployment rate =
0.03
40* 201
3
– 61
.48
59
= 6.9
3
).
There is a 0.03
40 regression coefficient here meaning to say that there is an
increase of unemployment annually.
Less employees means that there are less and less people working for the company
hence retail stores are in danger of closing down too.
F
or the unemployment rate, this includes everyone that is not working for a
certain day or week or time even those that are temporarily laid off. People
that are not working for another job after being laid off are not included on
the unemployed list. Imagine a lot of people looking for work and how they can
affect the earnings of a retail store whose consumers are getting less and less?
In the US, there have been spiked when it comes to sales earned by retail stores
at 3
7% according to Rogers (2009
). This is considered as a major and great year
for retail stores. By 201
3
, we forecast that unemployment will remain at the
highest of 8
% though hence it can mean a good year for retail stores, more
balanced business and they can go for their budgeting allocations as ahead as
the said year.
There are anti-developers out there though who predicts that pushing for more
new centers at times when unemployment is high is not a good idea
(Misonzhnik,201
1
). But if we will not put new shops and branches, this can keep
other stores from being introduced to a new market. F
or old retail stores
though, this can be a good thing because it cuts them off from competing with
new competitors and new brands of retail products that might be good for
consumer–s taste.
References
Bureau of labor statistics.(n.d.). Retrieved from website:
http://www.bls.gov/lau/
Misonzhnik, E. (201
1
). Building Tension: The pace of retail development remains
anemic. Retail Traffic, 40(2), 42-44.
Rogers, D. (2009
). RECENT TRENDS IN AMERICAN RETAILING.Retail Digest, 50-53
.
Tanner, D., & Youssef – Morgan, C. (201
3
).Statistics for Managers. San Diego,
CA: Bridgepoint Education, Inc.