
Recommended
Recommended
More Related Content
Similar to Statistical Process ControlAgendaIntroductionNumber of.docx
Similar to Statistical Process ControlAgendaIntroductionNumber of.docx (20)
More from susanschei
More from susanschei (20)
Recently uploaded
Recently uploaded (20)
Statistical Process ControlAgendaIntroductionNumber of.docx
- 1. Statistical Process Control Agenda Introduction Number of Ford Focus sold Number of Ford Focus recalled Summary and Recommendations References 2 Introduction Statistical Process Control Method used for quality control Ford Focus transmission problems Statistical Process Control is a process that is used for quality control of a item. It monitors and control any process to ensure operations are at the full potential. In this case, Ford has been having many transmission issues with the Focus since 2012. 3 Number of Ford Focus sold
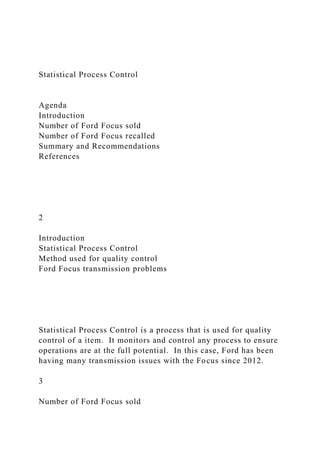
- 2. I Chart represents 1k units per month for last 40 months Second chart: Yearly sales Sales decreased by 89,133 Sales for the Focus have been on a rollercoaster ride since December 2015. When you observe the yearly sales you can see this vehicle has been on a rapid decline in sales. 4 I Control Chart Sample Means12345678910111213141516171819202122232425262728 29303132333435363738394011131919161719141211991010131 413171516131210131171216131611997544721UCL1234567891 01112131415161718192021222324252627282930313233343536 3738394015.45277698908495615.45277698908495615.4527769 8908495615.45277698908495615.45277698908495615.4527769 8908495615.45277698908495615.45277698908495615.4527769 8908495615.45277698908495615.45277698908495615.4527769 8908495615.45277698908495615.45277698908495615.4527769 8908495615.45277698908495615.45277698908495615.4527769 8908495615.45277698908495615.45277698908495615.4527769 8908495615.45277698908495615.45277698908495615.4527769 8908495615.45277698908495615.45277698908495615.4527769 8908495615.45277698908495615.45277698908495615.4527769 8908495615.45277698908495615.45277698908495615.4527769 8908495615.45277698908495615.45277698908495615.4527769 8908495615.45277698908495615.45277698908495615.4527769 8908495615.452776989084956Mean12345678910111213141516 17181920212223242526272829303132333435363738394011.47 511.47511.47511.47511.47511.47511.47511.47511.47511.47511 .47511.47511.47511.47511.47511.47511.47511.47511.47511.47 511.47511.47511.47511.47511.47511.47511.47511.47511.47511 .47511.47511.47511.47511.47511.47511.47511.47511.47511.47 511.475LCL123456789101112131415161718192021222324252
- 3. 627282930313233343536373839407.4972230109150447.49722 30109150447.4972230109150447.4972230109150447.49722301 09150447.4972230109150447.4972230109150447.49722301091 50447.4972230109150447.4972230109150447.49722301091504 47.4972230109150447.4972230109150447.4972230109150447. 4972230109150447.4972230109150447.4972230109150447.497 2230109150447.4972230109150447.4972230109150447.497223 0109150447.4972230109150447.4972230109150447.497223010 9150447.4972230109150447.4972230109150447.497223010915 0447.4972230109150447.4972230109150447.497223010915044 7.4972230109150447.4972230109150447.4972230109150447.4 972230109150447.4972230109150447.4972230109150447.4972 230109150447.4972230109150447.4972230109150447.4972230 10915044 Time Point Thousand Per Month Value Equipped cars with new shifting transmission (bad concept) First year 3,469 reported problems Consistent software updates or replacing transmission Number of Ford Focus recalled Vehicles were equipped with a “dry” method clutch instead of a “wet” one. Caused vehicles to have problems downshifting. When accelerating, vehicle would hesitate and keep it from reaching speeds of a normal vehicle. There have been consistent software updates and even replacing the transmission 2-4 times within a 3-4 year of ownership. This is clearly a Lean Six Sigma Waste. It would fall under defects.
- 4. 5 Summary and Recommendations Remove defected vehicles from roadways Offer incentives to help remove defected vehicles Should settle any pending lawsuits Because the Focus has taken such a devasting lost over the years. It is best for Ford to stop production on this vehicle. If they continue to produce this vehicle, it could put someone in the biggest danger, death. For the vehicles that are currently being used, incentives should be given to return the vehicle. These incentives would be use to purchased another vehicle in Ford’s lineup. This should settle any lawsuits and help with Ford’s market value and image. 6 References Ford Focus Sales Numbers(2019). Retrieved from http://fordauthority.com/fmc/ford-motor-company-sales- numbers/ford-sales-numbers/ford-focus-sales-numbers/ Ford Focus - Problems, Statistics, and Analysis(2019). Retrieved from http://www.carproblemzoo.com/ford/focus/ Ford's Transmission Problem(n.d.). Retrieved from http://www.fordtransmissionproblems.com/fords-transmission- problem/ 7
- 5. 9 Executive Summary Starbuck's Inc business operations dataset (Net revenues from 2000 to 2018) is used in developing and analyzing the three quantitative forecasts. The three quantitative forecasts will be compared against each other to identify the best method for Starbuck Inc. · Linear Regression Forecasting · Simple Moving Average · Exponential Moving Average Linear Regression Forecasting The linear regression technique is used to show a straight line to data in the past. · Regression is a functional relationship between two or more correlated variables. · Used for both time and relationship forecasting. Y = B0 + B1X1, where B0 is the y-intercept, B1 is the gradient, X is the independent variable, and Y is the dependent variable (Box, Jenkins, Reinsel, & Ljung, 2015). The table below shows the line of best fit to the data set. Figure 1: Graph of a linear regression forecasting 10 = X- bar 11358.47 = Y-bar
- 6. 1208.01 = b -721.67 = a Regression Equation is Y = 1,208.01X + 721.66667 Simple Moving Average (SMA) quantitative forecast The simple moving average quantitative method · Used to represent an average that "moves" through the time series · Arithmetic moving average obtained by calculating the average net revenues over a given number of periods. · Computed from the company's closing sales. · 3-year simple moving average will be computed by adding the annual net revenue for the last 3 years and dividing the summative by 3. Table 1: Table of 3-year Simple Moving Average The computation is repeated for each net revenue on the chart, and the average is calculated by dropping the oldest observation and adding the newest observation (Liu, & Li, 2015). The graph below is a plot which demonstrate data sequence in the table above. The SMA begins on year 2003 and continues. The number of periods in SMA is 3. Moreover, the values of mean squared error (MSE) and mean absolute deviation (MAD) and are 2561.46 and 8307494.37 respectively. Figure 2: Graph of a simple moving average. Exponential Moving Average (EMA) quantitative forecast The Exponential Moving Averages is decreasing the lag by applying the weighting factor which reduces exponentially. · The weighting factors is based on the most recent data as well as the total number of periods required. · Three phases involved during the computation. · First phase involves computing for SMA · Second phase involve the computation of weighting factor · Last phase involves the calculation of exponential weighted moving average
- 7. Table 2: Exponential Moving Average The weighting factor applied to the most recent data depends on the number of period in the moving average. Weighting for a short period is preferred than for a longer period. Therefore, Starbuck`s 3-year period can be said to be more relevant. The chart below illustrates the sequence of data and the exponential smoothing from Table 2. Figure 3: Graph of Exponential Moving Average The best forecasts method for the company Based on the three quantitative forecasts methods, exponential moving average (EMA) forecast technique is more effective and it should be employed in the company. Though this forecast method seems more complex when compared to the other two techniques, EMA forecast indicates a well-calculated forecast value which considers all factors of production within a company, hence producing an accurate and reasonable forecast. Moreover, the EMA technique lowers the lag which is available in SMA through advocating and implementing the use of shorter-predictive periods as a way of improving the company`s levels of accuracy. Impact this forecast on the firm's financial metrics standpoint The exponential moving-average forecast method will result in several positive impacts on Starbucks' financial metrics. The forecast technique will produce accurate and precise net revenue forecast which will aid the management sector to come up with more quality products and services catering to the needs of all the customers. Customers satisfactory is directly proportional to the company`s performance. Furthermore, exponential moving-average forecast method will help Starbuck company in the creation of more effective adverts to attract the attention of more customers. Business companies should consider exponential moving-average technique as the best method for predicting the nature and performance of the company. Conclusion
- 8. According to the three quantitative forecast methods, the exponential moving average appears to be the best method for Starbuck Company and other business companies as well. The EMA responds to the data fluctuation quicker than a simple moving average. Therefore, it produces accurate and price forecast. References Box, G. E., Jenkins, G. M., Reinsel, G. C., & Ljung, G. M. (2015). Time series analysis: forecasting and control. John Wiley & Sons. Liu, D. J., & Li, L. (2015). Application study of comprehensive forecasting model based on entropy weighting method on trend of PM2. 5 concentration in Guangzhou, China. International journal of environmental research and public health, 12(6), 7085-7099.. Flowchart Improvement Process
- 9. Overview An “as is” shows the current logistics of a business process in a organization. The process shows how business process works today. An “as is” processes of sales department in a local organization will help us understand how the stakeholders routinely perform business To understand the current state, interviews is among the common techniques used to collect information. Analyzing business process helps business: Minimize waste of resources Clarify actual- operation step-by-step Business analysts are able to ask the right questions. Both current and future state are important because they help an organization become more client-focused. An organization can adjust to meet its team needs.. * Current State Quotation Customer agree to buy End Sign the contract Stock? Deliver soon after receiving payment Deliver goods Receipt of goods After sales services Prepare production Arrange deposit
- 10. Yes No No Yes Process Improvement The process of sales runs through various steps as indicated in the current flowchart.Once a customer agrees to buy our products he/she signs a contract. If the customer agrees to proceed with the process products are delivered after receiving the payment.Goods are then delivered and receipts of goods issued. Lastly after sales services such as transportation or discounts are extended to customers. Process improvement is a process of identifying, analyzing as well as improving the current processes to meet new goals and objectives (Davenport, 2015). Process improvement: Define, measure, analyze, improve and control internal processes. * Future State
- 11. Business has remarkably transformed. In the current environment consumers want a simplified process Unlike in the current state, sales process should be simplified to minimize time and reduce cost. Start Look for a product Did you find it? Did you need it? No Yes Forecast Due to advancement in technology, it is essential to embrace technology in sales process (Taylor & Letham, 2018).The current state is more of traditional and lengthy.To eliminate delay, the future state should be made simple by eliminating various logistics such as manual processing of receipts.From a judgmental forecasting, the future process will be efficient considering that it has minimized time and will reduce cost of operations.Reduction in overall cost will increase the business profit margins. Forecasting helps in taking proactive measures. Helps to make logical decisions. Helps to cut business costs. * Summary Ultimately a process improvement process aims at improving results. Apparently improving results is a challenging tasks for project managers.As such, leaders needs a
- 12. proven methodology to help accomplish set goals and objectives. Using six Sigma roadmap managers are able to improve results. The first step is to set the project up for successMeasure the current baseline for the process- data collection is necessary at this point. Analyze the root cause of the problem- In regard to the bank time completion and costly process are the major problems. Understanding what needs to change- Make the process more efficient. Understand how to maintain the process- In this case it should be done through data collection and conducing surveys to understand customers feelings and satisfaction. The ultimate goal of the improved process is to reduce the time the bank takes to process loan to book (Wang, Ashfaq & Fu, 2015). The new process also hopes to increase efficiency Reduce unnecessary costs * References Wang, X. Z., Ashfaq, R. A. R., & Fu, A. M. (2015). Fuzziness based sample categorization for classifier performance improvement. Journal of Intelligent & Fuzzy Systems, 29(3), 1185-1196.Davenport, T. H. (2015). Process management for knowledge work. In Handbook on Business Process Management 1 (pp. 17-35). Springer, Berlin, Heidelberg.Taylor, S. J., & Letham, B. (2018). Forecasting at scale. The American Statistician, 72(1), 37-45. Project Management Agenda Introduction Problem Definition
- 13. Customer surveys Data Gathering Plant tours/audits Data Analysis and Solution Development Statistical tools Cost Impact and Payoff Analysis Decision trees Implementation Responsibility charts References Ralph Lauren Corporation A global leader in the apparel Also in designing, marketing and distributing premium lifestyle products The company has experienced challenges with regard to its operating model and therefore experiencing poor performance levels.
- 14. Introduction Ralph Lauren Corporation was started in 1967 with just men’s ties. Now it’s a global leader in the apparel especially in designing, marketing and distributing premium lifestyle products. The company has experienced challenges with regard to its operating model and therefore experiencing poor performance levels. 3 Problem Definition Excess Inventory Problems The lead-time for production and delivery of products Approximately 15 months Problematic leads to mismatch between supply and demand Lacks a centralized system of controlling inventory and optimization Led to an inventory growth of 26% against a 7% growth in sales Discounting and transfers to outlets have resulted in extra costs and lower profit margins The lead-time for production and delivery of products is
- 15. approximately 15 months which is very long. This is problematic because it leads to a mismatch between supply and demand at the time the products are available for consumption. In addition, the company lacks a centralized system of controlling inventory and optimization. This has led to an inventory growth of 26% against a 7% growth in sales for the past three years. Moreover, discounting and transfers to outlets have resulted in extra costs and lower profit margins. 4 Reduced focus on core brand strength Ralph Lauren, Polo, and Lauren account for a vast majority of the brand strength and performance 30% of the styles make up 70% of the business while 65% of the styles are considered unproductive Developing a transformational plan, to Streamline operations and raise the operations margins Problem Definition (cont) The company’s three core brands are Ralph Lauren, Polo, and Lauren. They account for a vast majority of the brand strength and performance. However, 30% of the styles make up 70% of
- 16. the business while 65% of the styles are considered unproductive. The company is therefore in the process of developing a transformational plan to streamline operations and raise the operations margins by end of the financial year 2019. For the plan to succeed the company needs to adopt important items from the operations toolkit for supply chain management. 5 Customer survey Customers form the bedrock of the business Conduct an extensive customer survey to understand several things First, understand who its customers are How and where to reach them effectively Secondly, provide insight on changing demand patterns Explain reasons for low sales and identify potential gaps within the market Finally, identify idle products Channel resources to more in demand products. Since customers form the bedrock of the business or rather determine the success of the business. Ralph Lauren needs to conduct an extensive customer survey to understand several
- 17. things. First, the company needs to understand who its customers are and how and where to reach them effectively. Secondly, a customer survey will provide insight on changing demand patterns, explain reasons for low sales and identify potential gaps within the market. Finally, a customer survey will help the company identify idle products and channel resources to more in demand products. 6 Gathering Data To effectively understand the extent of the problems Plan or make decisions on the most needed transformations Collect data on all its processes, employees, inventory, costs and organizational structure Data collection is very important and serves various purposes Provides a basis for decision making Identify the exact value of its problems and their underlying causes Gathering data is to effectively understand the extent of the problems facing the company and plan or make decisions on the
- 18. most needed transformations.The company needs to collect data on all its processes, employees, inventory, costs and organizational structure. Data provides a basis for decision making. It also enables the company identify the exact value of its problems and their underlying causes. 7 Plant tours/Audits Conduct an extensive audit of all its warehouses and stores Identify all inventories held Analysis actual costs associated with holding the inventory Enables the company to segment or categorize inventory stocks Idle inventory, fast moving and moderately moving inventory Focus on reducing or doing away with some of its inventory lines Low demand or even the costly inventory lines in terms of storage and cost. The company needs to conduct an extensive audit of all its warehouses and stores to identify all inventories held and the actual costs associated with holding the inventory.This is a very useful exercise as it enables the company to segment or
- 19. categorize inventory stocks into idle inventory, fast moving and moderately moving inventory. Once this is done the company can now focus on reducing or doing away with some of its inventory lines especially those that have low demand or even the costly inventory lines in terms of storage and cost. 8 Data Analysis and