
Recommended
More Related Content
What's hot
What's hot (20)
Similar to First Law of Thermodynamics.ppt
Similar to First Law of Thermodynamics.ppt (20)
Recently uploaded
Recently uploaded (20)
First Law of Thermodynamics.ppt
- 2. Work Done by a Gas Suppose you had a piston filled with a specific amount of gas. As you add heat, the temperature rises and thus the volume of the gas expands. The gas then applies a force on the piston wall pushing it a specific displacement x. Thus it can be said that a gas can do WORK. PA F The negative sign is explained on the next page. F x Remember Area x Depth = Volume
- 3. P V Graphs ) ( ) ( ) ( ) ( positive W negative W gas the ON done is Work decrease volume V gas the BY done is Work increase volume V V P W on by The ‘negative’ sign in the equation for WORK is often misunderstood. Since work done BY a gas has a positive volume change we must understand that the gas itself is USING UP ENERGY or in other words, it is losing energy, thus the negative sign shows a loss of energy. When work is done ON a gas the change in volume is negative. This cancels out the negative sign in the equation. This makes sense as some EXTERNAL agent is ADDING energy to the gas. i = initial, f = final V P W graph pv under area P Pi = Pf Vi Vf V V P W area W ΔV Pressure against Volume Graphs W = Work done
- 4. Internal Energy (ΔU) and Heat Energy (Q) All of the energy inside a system is called INTERNAL ENERGY, ΔU. It usually consists of the sum of the potential and kinetic energies of the working gas molecules. When you add HEAT(Q), you are adding energy and the internal energy INCREASES. Both are measured in joules. But when you add heat, there is usually an increase in temperature associated with the change. 0 , 0 , U T if U T if T and U released absorbed Q Q
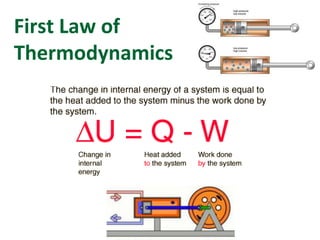
- 5. First Law of Thermodynamics “The internal energy of a system tends to increase when HEAT is added and work is done ON the system.” by Add on Add W Q U or W Q U W Q U Suggests a CHANGE could be + or - You are really adding a negative here! The bottom line is that if you ADD heat then transfer work TO the gas, the internal energy must obviously go up as you have MORE than what you started with.
- 6. Example 1 Sketch a PV diagram and find the work done by the gas during the following stages. a) A gas is expanded from a volume of 1.0 L to 3.0 L at a constant pressure of 3.0 atm. b) The gas is then cooled at a constant volume until the pressure falls to 2.0 atm V P WBY - 600 J 0 V since P V 5 10 3 3 atm N/m2 = 3 10 300 N/m2 3 3 3 10 1 001 . 0 1 m m L 3 3 3 10 3 003 . 0 m m L 3 1 2 0 4 3 100 200 300 400 x 10-3 x 10 3 ) 001 . 0 003 . 0 ( 10 300 3 Work Out (Area under Graph) 5 10 2 2 atm N/m2 = 3 10 200 N/m2 V P WBY 0 (No change in the Work Done) (b) (a)
- 7. Example 1 (continued) c) The gas is then compressed at a constant pressure of 2.0 atm from a volume of 3.0 L to 1.0 L. d) The gas is then heated until its pressure increases from 2.0 atm to 3.0 atm at a constant volume. P V 1 2 0 4 3 100 200 300 400 x 10-3 x 10 3 5 10 2 2 atm N/m2 = 3 10 200 N/m2 V P WON + 400 J 3 3 3 10 1 001 . 0 1 m m L 3 3 3 10 3 003 . 0 m m L 3 ) 003 . 0 001 . 0 ( 10 200 3 Work In (Area under Graph) (d) (c) (b) (a) 0 V since V P WBY 0 (No change in the Work Done)
- 8. What is the NET WORK? The area inside the shape General Rule : If the system rotates Clockwise, the NET work is negative. If the system rotates Anticlockwise, the NET work is postitive. 1 2 4 3 100 200 300 400 x 10-3 x 10 3 (d) (c) (b) (a) Example 1 (continued) - 600 J + 400 J = - 200 J NET work is the area inside the shape
- 9. Example 2 A series of thermodynamic processes is shown in the PV - diagram. In process a) 150 J of heat is added to the system, in process b) 600J of heat is added and in process c) 300J of heat is lost. No heat is lost or gained in process d). Fill in the chart. P V 1 2 0 4 3 20 40 60 80 x 10-3 x 10 3 (b) (a) 5 30 (c) (d) Conclusion – Heat energy has increased by 450J Work has decreased by 150J Internal Energy has increased by 300J Step Q W ΔU = Q + W a b c d Total Step Q W ΔU = Q + W a +150 0 b +600 c -300 d 0 Total Step Q W ΔU = Q + W a +150 0 150 J b +600 -240 c -300 0 d 0 Total Step Q W ΔU = Q + W a +150 0 b +600 -240 c -300 0 d 0 +90 Total Step Q W ΔU = Q + W a +150 0 b +600 -240 c -300 0 d 0 +90 Total +450 Step Q W ΔU = Q + W a +150 0 b +600 -240 c -300 0 d 0 +90 Total +450 -150 Step Q W ΔU = Q + W a +150 0 150 J b +600 -240 c -300 0 d 0 +90 Total +450 -150 Step Q W ΔU = Q + W a +150 0 150 J b +600 -240 360 J c -300 0 d 0 +90 Total +450 -150 Step Q W ΔU = Q + W a +150 0 150 J b +600 -240 360 J c -300 0 -300 d 0 +90 Total +450 -150 Step Q W ΔU = Q + W a +150 0 150 J b +600 -240 360 J c -300 0 -300 d 0 +90 +90 Total +450 -150 Step Q W ΔU = Q + W a +150 0 150 J b +600 -240 360 J c -300 0 -300 d 0 +90 +90 Total +450 -150 +300 J Net Work Done -150J
- 10. Example 3 A series of thermodynamic processes is shown in the PV - diagram. In process q) 100 J of heat is lost by the system, in process r) 400J of heat is lost and in process s) 300J of heat is added to the system. No heat is lost or gained in process t). Fill in the chart. P V 1 2 0 4 3 20 40 60 80 x 10-3 x 10 3 (s) (t) 5 (r) (q) Conclusion – Heat energy has decreased by 200J Work energy has increased by 160J Internal Energy has decreased by 40J Step Q W ΔU = Q + W q r s t Total Step Q W ΔU = Q + W q -100 r -400 0 s +300 t 0 0 0 Total Step Q W ΔU = Q + W q -100 -80 r -400 0 s +300 t 0 0 0 Total Step Q W ΔU = Q + W q -100 -80 r -400 0 s +300 +240 t 0 0 Total Step Q W ΔU = Q + W q -100 -80 r -400 0 s +300 +240 t 0 0 0 Total -200 Step Q W ΔU = Q + W q -100 -80 r -400 0 s +300 +240 t 0 0 0 Total -200 +160 Step Q W ΔU = Q + W q -100 -80 -180 J r -400 0 s +300 +240 t 0 0 0 Total -200 +160 Step Q W ΔU = Q + W q -100 -80 -180 J r -400 0 -400 J s +300 +240 t 0 0 0 Total -200 +160 Step Q W ΔU = Q + W q -100 -80 -180 J r -400 0 -400 J s +300 +240 +540 t 0 0 0 Total -200 +160 Step Q W ΔU = Q + W q -100 -80 -180 J r -400 0 -400 J s +300 +240 +540 t 0 0 0 Total -200 +160 -40 J Net Work Done 160J
- 11. First Law of Thermodynamics Question 1) A 2L sample of oxygen gas has an initial temperature and pressure of 200K and 1 atm. The gas undergoes four processes. Find the net work completed. ab - heated at constant volume to 400K - ISOCHORIC bc - heated at constant pressure to 800K - ISOBARIC cd - cooled at constant volume back to 1atm - ISOCHORIC da -cooled at constant pressure back to 200K - ISOBARIC P V 2 0 1 x 10 5 a (da) d c b (cd) (bc) (ab) x 10-3 PV Diagram
- 12. Using Gas Laws Process ab – Constant Volume (ISOCHORIC) – Pressure Law Add to graph Process cab – Constant Pressure (ISOBARIC) – Charles Law Add to graph
- 13. Using Characteristic Gas Law Process cd – Constant Volume (ISOCHORIC) – Pressure Law Using Gas Laws
- 14. P 2 0 1 a (da) d c b (cd) (bc) (ab) PV Diagram 2 4 V x 10 5 x 10⁻³ Process ab – Constant Volume (ISOCHORIC) Add to Table
- 15. Process bc – Constant Pressure (ISOBARIC) Add to Table
- 16. Thermodynamic Processes - Isothermal To keep the temperature constant both the pressure and volume change to compensate. (Volume goes up, pressure goes down) i.e. BOYLES’ LAW P V 0 2 1 Isotherm Isothermal T1 = T2 (Constant Temperature) V1 V2 T1 = T2 Q -W 0 T 0 U V Since By W Q U By W Q 0 By W Q Net Work Done
- 17. Thermodynamic Processes - Isobaric Heat is added to the gas which increases the Internal Energy (U). Work is done by the gas as it changes in volume. The path of an isobaric process is a horizontal line called an isobar. 0 2 1 V1 V2 Isobar T1 T2 T2>T1 Q -W Isobaric P1 = P2 (Constant Pressure) By W Q U P V Net Work Done
- 18. Thermodynamic Processes – Isovolumetric (Isochoric) 0 2 1 V1= V2 Isomet T1 T2 T2>T1 P V Isovolumetric V1 = V2 (Constant Volume) Q W = 0 0 V Since By W Q U 0 Q U Q U
- 19. Thermodynamic Processes - Adiabatic ADIABATIC- GREEK (adiabatos- "impassable") In other words, NO HEAT can leave or enter the system, it is fully insulated. 0 V1 V2 P V Adiabatic = Nothing is Constant T1 T2 T1>T2 2 1 Adiabat Q = 0 -W 0 Q Since By W Q U By W U 0 By W U
- 20. In Summary 0 P V (b) (a) (c) (d) Label Process Important Points Gas Law a Isothermal Constant T, ΔU = Q , Q = WBy Boyles Law b Isovolumetric (isochoric) Constant V, W = 0, ΔU = Q Charles Law c Isobaric Constant P, ΔU = Q - WBy Pressure Law d Adiabatic Nothing is Constant, Q = 0, ΔU = -WBy Combined Gas Law Isobaric Isothermal Isochoric Adiabatic