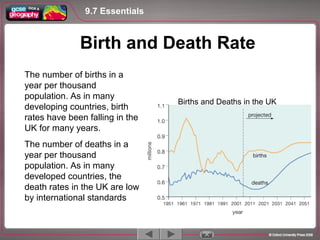
1. The number of births in a
year per thousand
population. As in many
developing countries, birth
rates have been falling in the
UK for many years.
The number of deaths in a
year per thousand
population. As in many
developed countries, the
death rates in the UK are low
by international standards
9.7 Essentials
1 / 5
Birth and Death Rate
Births and Deaths in the UK
2. 9.7 Essentials
1 / 5
Population: UK and
Poland
This shows the population structure of a
place by displaying the numbers in
each age group as a bar graph.
The shape of the pyramid shows the
proportion of young and older people,
males and females and indicates the
birth and death rates.
Pyramids allow us to predict future
natural increases, as they show the
numbers of people of child-rearing age.
http://www.medindia.net/patients/calculators/worldpopulation.asp
3. • Natural increase
The number of births minus the number of deaths, i.e. the change in population due to
the differences between birth and death rates.
• Life expectancy
The average number of years a person born in a particular country is expected to live.
• Ageing population
The process taking place in many developed countries, where fewer people are being
born, leading to an increase in the average age of the population. An ageing
population can put more strain on the working population to supply funding for
pensions and healthcare.
• Fertility rate
The average number of children born per
Woman. In the UK the fertility rate has fallen
9.7 Essentials
4. 9.7 Essentials
1 / 5
9.7 Essentials 9.7 Essentials
Total UK net migration 1991-2006
Migration
The permanent, seasonal, or temporary movement of
people. This can range from permanent international
migration to daily flow of commuters from the suburbs, to
the city centre
Immigration
The movement of people into a country from outside. In
2006, 591,000 people entered the UK. 68,000 were from
Poland.
Emigration
The movement of people outward from a country. In 2006,
400,000 people emigrated from the UK- mainly to
Australia, Spain, France and New Zealand
Net Migration
The number of people arriving (immigrants) minus the
amount leaving (emigrants). In 2006, net migration to the
UK was 191,000
Migration
5. The expected future changes in a country’s
population on which many government and
planning decisions are based. The UK
population is projected to increase 10.5
million, from 60.6 million in 2006, to 71.1
million by 2031. 53 per cent of this will be
due to natural increase and 47 per cent due
to migration.
Dependency ratio
The number too old or young to be working
divided by the number of working age (16-
64 years). This ratio is increasing in the UK
and Poland, as birth rate declines, the
population ages and larger number of
retired people are no longer working.
Population Project
9.7 Essentials
6. The expected future changes in a country’s
population on which many government and
planning decisions are based. The UK
population is projected to increase 10.5
million, from 60.6 million in 2006, to 71.1
million by 2031. 53 per cent of this will be
due to natural increase and 47 per cent due
to migration.
Dependency ratio
The number too old or young to be working
divided by the number of working age (16-
64 years). This ratio is increasing in the UK
and Poland, as birth rate declines, the
population ages and larger number of
retired people are no longer working.
Population Project
9.7 Essentials