
Recommended
Recommended
More Related Content
Similar to Elevated Blood Lead Levels in Children AssociatedWith the Fl.docx
Similar to Elevated Blood Lead Levels in Children AssociatedWith the Fl.docx (20)
More from toltonkendal
More from toltonkendal (20)
Recently uploaded
Recently uploaded (20)
Elevated Blood Lead Levels in Children AssociatedWith the Fl.docx
- 1. Elevated Blood Lead Levels in Children Associated With the Flint Drinking Water Crisis: A Spatial Analysis of Risk and Public Health Response Mona Hanna-Attisha, MD, MPH, Jenny LaChance, MS, Richard Casey Sadler, PhD, and Allison Champney Schnepp, MD Objectives. We analyzed differences in pediatric elevated blood lead level incidence before and after Flint, Michigan, introduced a more corrosive water source into an aging water system without adequate corrosion control. Methods. We reviewed blood lead levels for children younger than 5 years before (2013) and after (2015) water source change in Greater Flint, Michigan. We assessed the percentage of elevated blood lead levels in both time periods, and identified geo- graphical locations through spatial analysis. Results. Incidence of elevated blood lead levels increased from 2.4% to 4.9% (P < .05) after water source change, and neighborhoods with the highest water lead levels ex- perienced a 6.6% increase. No significant change was seen
- 2. outside the city. Geospatial analysis identified disadvantaged neighborhoods as having the greatest elevated blood lead level increases and informed response prioritization during the now-declared public health emergency. Conclusions. The percentage of children with elevated blood lead levels increased after water source change, particularly in socioeconomically disadvantaged neighbor- hoods. Water is a growing source of childhood lead exposure because of aging infra- structure. (Am J Public Health. 2016;106:283–290. doi:10.2105/AJPH.2015.303003) See also Rosner, p. 200. In April 2014, the postindustrial city ofFlint, Michigan, under state-appointed emergency management, changed its water supply from Detroit-supplied Lake Huron water to the Flint River as a temporary measure, awaiting a new pipeline to Lake Huron in 2016. Intended to save money, the change in source water severed a half- century relationship with the Detroit Water and Sewage Department. Shortly after the switch to Flint River water, residents voiced concerns regarding water color, taste, and
- 3. odor, and various health complaints in- cluding skin rashes.1 Bacteria, including Escherichia coli, were detected in the distri- bution system, resulting in Safe Drinking Water Act violations.2 Additional disinfec- tion to control bacteria spurred formation of disinfection byproducts including total tri- halomethanes, resulting in Safe Drinking Water Act violations for trihalomethane levels.2 Water from the Detroit Water and Sewage Department had very low corrosivity for lead as indicated by low chloride, low chloride-to-sulfate mass ratio, and presence of an orthophosphate corrosion inhibitor.3,4 By contrast, Flint River water had high chloride, high chloride-to-sulfate mass ratio, and no corrosion inhibitor.5 Switching from Detroit’s Lake Huron to Flint River water created a perfect storm for lead leach- ing into drinking water.6 The aging Flint water distribution system contains a high percentage of lead pipes and lead plumbing, with estimates of lead service lines ranging from 10% to 80%.7 Researchers from Virginia Tech University reported increases in water lead levels (WLLs),5 but changes in blood lead levels (BLLs) were unknown. Lead is a potent neurotoxin, and child- hood lead poisoning has an impact on many developmental and biological pro- cesses, most notably intelligence, behavior,
- 4. and overall life achievement.8 With estimated societal costs in the billions,9–11 lead poi- soning has a disproportionate impact on low-income and minority children.12 When one considers the irreversible, life-altering, costly, and disparate impact of lead exposure, primary prevention is necessary to eliminate exposure.13 Historically, the industrial revolution’s introduction of lead into a host of products has contributed to a long-running and largely silent pediatric epidemic.14 With lead now removed from gasoline and paint, the incidence of childhood lead poisoning has decreased.15 However, lead contamina- tion of drinking water may be increasing because of lead-containing water in- frastructures, changes in water sources, and changes in water treatment including disin- fectant.16–18 A soluble metal, lead leaches into drinking water via lead-based plumbing or lead particles that detach from degrading plumbing components. (“Plumbing” is derived from the Latin word for lead, ABOUT THE AUTHORS Mona Hanna-Attisha and Allison Champney Schnepp are with Hurley Children’s Hospital/Michigan State University College of Human Medicine, Department of Pediatrics and Human Development, Flint, MI. Jenny LaChance is with Hurley Medical Center Research, Flint. Richard Casey Sadler is with Michigan State University College of Human Medicine, Division of Public Health, Flint. Correspondence should be sent to Mona Hanna-Attisha, MD,
- 5. MPH, FAAP, Hurley Medical Center, Pediatrics 3W, One Hurley Plaza, Flint, MI 48503 (e-mail: [email protected]). Reprints can be ordered at http://www.ajph.org by clicking the “Reprints” link. This article was accepted November 21, 2015. doi: 10.2105/AJPH.2015.303003 February 2016, Vol 106, No. 2 AJPH Hanna-Attisha et al. Peer Reviewed Research 283 AJPH RESEARCH mailto:[email protected] http://www.ajph.org “plumbum.”) Lead was restricted in plumb- ing material in 1986, but older homes and neighborhoods may still contain lead service lines, lead connections, lead solder, or other lead-based plumbing materials. Lead solubility and particulate release is highly variable and depends on many factors in- cluding water softness, temperature, and acidity.19–21 The US Environmental Pro- tection Agency (EPA) regulates lead in public water supplies under the Safe Drinking Water Act Lead and Copper Rule, which requires action when lead levels reach 15 parts per billion (ppb). Lead in drinking water is different from lead from other sources, as it disproportion- ately affects developmentally vulnerable children and pregnant mothers. Children can
- 6. absorb 40% to 50% of an oral dose of water-soluble lead compared with 3% to 10% for adults.22 In a dose–response relationship for children aged 1 to 5 years, for every 1-ppb increase in water lead, blood lead increases 35%.23 The greatest risk of lead in water may be to infants on reconstituted formula. Among infants drinking formula made from tap water at 10 ppb, about 25% would ex- perience a BLL above the Centers for Disease Control and Prevention (CDC) elevated blood lead level (EBLL) of 5 micrograms per deciliter (mg/dL).24 Tap water may account for more than 85% of total lead exposure among infants consuming reconstituted formula.25 A known abortifacient, lead has also been implicated in increased fetal deaths and reduced birth weights.26 As recommended by the CDC and supported by the American Academy of Pediatrics, blood lead screening is routine for high-risk populations and for children insured by Medicaid at age 1 and 2 years.27 The CDC-recommended screening ages are based on child development (increased oral–motor behavior), which places a child most at risk for house-based lead exposure (e.g., peeling paint, soil, dust). State and national blood lead–screening programs, however, do not adequately capture the risk of lead in water because infants are at greatest risk. Armed with reports of elevated WLLs
- 7. and recognizing the lifelong consequences of lead exposure, our research team sought to analyze blood lead data before (pre) and after (post) the water source switch with a geographic information system (GIS) to determine lead exposure risk and prioritize responses. This research has immediate public policy, public health, environmental, and socioeconomic implications. This research includes Flint, Michigan, and surrounding municipalities in Genesee County (Greater Flint). Greater Flint is a postindustrial region of nearly 500 000 people struggling from years of disinvestment by the automobile industry and associated manufacturing activities: the region has lost 77% of its manufacturing employment and 41% of employment overall since 1980.28 National and local data sources demonstrate dismal indicators for children, especially within Flint city limits.29–32 Greater Flint ranks toward the bottom of the state in rates of childhood poverty (42% in Flint vs 16.2% in Michigan and 14.8% in the United States), unemployment, violent crime, illicit drug use, domestic violence, preterm births, infant mortality, and overall health outcomes (81st out of 82 Michigan counties). Greater Flint’s struggles have been am- plified by a history of racial discrimination, whereby exclusionary housing practices were common.33,34 Such attitudes toward in-
- 8. tegration later precipitated White flight and emboldened home-rule governance,35,36 causing a massive decline in tax revenue for the city. The declining industrial and resi- dential tax bases strained the city’s ability to provide basic services and reversed the public health fortunes of the city and suburbs.37 Severely reduced city population densities reduced water demand in the distribution system, exacerbating problems with lead corrosion. METHODS This retrospective study includes all chil- dren younger than 5 years who had a BLL processed through the Hurley Medical Center’s laboratory, which runs BLLs for most Genesee County children. The pre time period (before the water source change) was January 1, 2013, to September 15, 2013, and the post time period (after the water source change) was January 1, 2015, to September 15, 2015. The primary study group comprised children living within the city of Flint (n = 1473; pre = 736; post = 737) who received water from the city water system. Children living outside the city where the water source was unchanged served as a comparison group (n = 2202; pre = 1210; post = 992). After institutional review board approval
- 9. and Health Insurance Portability and Accountability Act waiver, we drew data from the Epic electronic medical record system including BLL, medical record number, date of birth, date of blood draw, full address, sex, and race. For each child, only the highest BLL was maintained in the data set. We coded timing (pre or post) of the BLL on the basis of the date of blood draw. We calculated age at time of blood draw. We geocoded the data set with a dual- range address locator, and manually con- firmed accuracy of geocoded addresses. We conducted a series of spatial joins to assign participant records to Greater Flint munici- palities and Flint wards (including those with high WLL), enabling the calculation of the number and percentage of children with EBLLs in each geographic region for both time periods. The reference value for EBLL was 5 mg/dL or greater. We identified Flint wards with high WLLs with water lead sampling maps.38 Wards 5, 6, and 7 had the highest WLLs; in each ward, more than 25% of samples had a WLL higher than 15 ppb. We theorized that children living in this combination of wards would have the highest incidence of EBLLs (referred to as “high WLL Flint”; the remainder of Flint was referred to as “lower WLL Flint”). We derived overall neighborhood-level socioeconomic disadvantage from census block group variables intended to measure material and social deprivation. We calculated
- 10. these scores from an unweighted z score sum of rates of lone parenthood, poverty, low educational attainment, and unemployment (adapted from Pampalon et al.39; used pre- viously in Flint by Sadler et al.40), and assigned these to each child on the basis of home address. Positive values denote higher disad- vantage, and negative values denote lower disadvantage. Table 1 highlights the overall socioeconomic disadvantage score compari- son by time period and area. We created spatial references for EBLL risk and a predictive surface for BLL by using GIS, providing the ability to see otherwise invisible spatial–temporal patterns in envi- ronmental exposure.17 Because of the need to AJPH RESEARCH 284 Research Peer Reviewed Hanna-Attisha et al. AJPH February 2016, Vol 106, No. 2 understand spatial variations and geo- graphically target resources, we also ran ordinary Kriging with a spherical semivario- gram model on the entire data set for Greater Flint, allowing interpolation of associated BLL risks with lead in water. Previous methods for evaluating spatial variation in lead levels have ranged from multivariable analyses at the individual level41 to in- terpolation methods such as inverse distance weighting42 and Kriging.43 Given our as-
- 11. sumption that lead risk is spatially correlated in Greater Flint because of the age and condition of pipes, interpolation methods are appro- priate for building a preliminary risk surface. Both inverse distance weighting and Kriging derive such surfaces by calculating values at unmeasured locations based on weighting nearby measured values more strongly than distant values.44 Whereas inverse distance weighting is a deterministic procedure and relies on predetermined mathematical for- mulae, Kriging has the added sophistication of using geostatistical models that consider spatial autocorrelation, thereby improving accuracy of prediction surfaces (ArcGIS Desktop version 10.3, Environmental Sys- tems Research Institute, Redlands, CA). As well, Kriging can be run with relatively few input points: adequate ranges fall be- tween 30 and 100 total points, although Kriging has been conducted with just 7.44 Our city of Flint sample included 736 children in the pre period and 737 children in the post period, which amounts to a density of approximately 22 points per square mile. Kriging has become an increasingly common method for measuring variations in soil lead, and is given more in-depth treat- ment elsewhere.45 To examine change in proportion of children with EBLL from the pre to post time periods, we used c2 analysis with continuity correction for each area (outside Flint, all Flint, high WLL Flint, and lower WLL Flint). In addition, we ex-
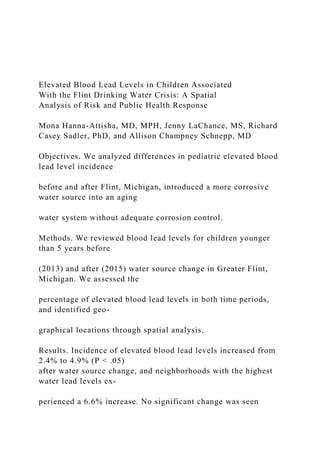
- 12. amined differences in overall socioeconomic disadvantage scores from the pre to post time periods by using the independent t test. Finally, we used both c2 analysis with con- tinuity correction and 1-way ANOVA to assess demographic differences by area. We used post hoc least significant difference analysis following statistically significant 1-way ANOVAs. RESULTS We uncovered a statistically significant increase in the proportion of Flint children with EBLL from the pre period to the pro- portion of Flint children in the post period. In the pre period, 2.4% of children in Flint had an EBLL; in the post period, 4.9% of children had an EBLL (P < .05). By compar- ison, outside of Flint water, the change in EBLL was not statistically significant (0.7% to 1.2%; P > .05). In high WLL Flint, EBLL increasedfrom4.0%to10.6%(P < .05).Figure1 shows the EBLL percentage change per area. Results of the GIS analyses show signifi- cant clustering of EBLLs within the Flint city limits. According to ordinary Kriging, Figure 2 shows a predicted surface based on observations of actual child BLL geocoded to home address to visualize BLL variation over space (measured in mg/dL). The darkest shades of red represent the highest risk for EBLL based on existing observations. Outside Flint, the entire county falls entirely within the lowest half of the range (in shades of blue);
- 13. the only locations where predicted BLL is greater than 1.75 mg/dL is within Flint city limits. Within Figure 2, each ward is also labeled according to the percentage of water samples that exceeded 15 ppb. The areas with the highest WLLs strongly coincide with the areas with the highest predicted BLLs. In addition, the high percentage of EBLL in wards 5, 6, and 7 also correspond with the high WLLs in wards 5, 6, and 7 (the labels in Figure 2). Table 2 shows ward-specific WLLs, pre period and post period EBLL percentages, and predicted BLL and predicted change in BLL from Kriging. Areas experiencing the highest predicted BLL in the post period (Figure 2) are generally also areas with greatest change in predicted BLL (measured in mg/dL) when compared with the pre period (Table 2; Figure A, available as a supplement to the online ver- sion of this article at http://www.ajph.org). Figure A quantifies this rate of change with a green to red scale: large increases are shown in increasingly darker shades of red, whereas large decreases are shown in in- creasingly darker shades of green. These once again match with city wards that ex- perienced greater rates of EBLL percentage increase (Figure 1, Table 2). In wards 5 and 6 (which experienced a predicted 0.51 and 0.27 mg/dL increase, respectively), the EBLL percentage more than tripled. In ward 5, the EBLL percentage increased from 4.9% to
- 14. 15.7% (P < .05). The area of intersection between wards 3, 4, and 5 (in the east side of the city) also appeared high in the Kriging analysis of Figure 2, and with a different unit of aggregation this neighborhood would also exhibit a significant increase in EBLL percentage. Ward 7 had high pre period and post period EBLL percentage levels above 5% (with a particularly high rate in the western portion of the ward). Citywide, TABLE 1—Demographic Comparison of the Time Periods Before (Pre) and After (Post) Water Source Change From Detroit-Supplied Lake Huron Water to the Flint River, by Area: Flint, MI, 2013 and 2015 Outside Flint All Flint High WLL Flint Lower WLL Flint Characteristic Pre Post Pre Post Pre Post Pre Post Gender, % Male 51.6 49.5 48.6 52.9 47.6 54.4 49.1 52.3 Female 48.4 50.5 51.4 47.1 52.4 45.6 50.9 47.7 Race/ethnicity, % African American 24.3 24.5 69.4 70.6 74.9 78.8 67.0 66.9 Other categories 75.7 75.5 30.6 29.4 25.1 21.2 33.0 33.1 Age, y, mean 1.89 1.83 2.09 2.06 2.06 2.02 2.11 2.07 Overall socioeconomic
- 15. disadvantage score –0.83 –0.98 2.94 2.88 2.18 2.39 3.28 3.10 Note.WLL = water lead level. No statistically significant differences were found in any pre–post value within any of the 4 geographical areas. AJPH RESEARCH February 2016, Vol 106, No. 2 AJPH Hanna-Attisha et al. Peer Reviewed Research 285 http://www.ajph.org 4 wards (1, 4, 7, and 9) experienced decreases in predicted BLL, 3 wards (2, 5, and 6) experienced large increases, and 2 wards (3 and 8) remained largely the same (Figure A). Overall, statistically significant differences exist between the areas examined (outside Flint, high WLL Flint, and lower WLL Flint) in all demographic characteristics except sex. The overall percentage of African American children is 24.4% outside Flint, compared with 76.8% in high WLL Flint and 67.0% in lower WLL Flint (P < .001). Children outside Flint were younger (mean = 1.86 years [SD = 1.10]) than high WLL Flint (mean = 2.04 years [SD = 1.02]) and lower WLL Flint (mean = 2.09 years [SD = 1.07]; P < .001). Differences in overall socioeco- nomic disadvantage scores are likewise sig-
- 16. nificant (P < .001). Post hoc least significant difference analysis shows statistically signifi- cant differences for overall socioeconomic disadvantage between outside Flint and high WLL Flint (P < .001), between outside Flint and lower WLL Flint (P < .001), and between high WLL Flint and lower WLL Flint (P < .001). DISCUSSION Our findings reveal a striking increase in the percentage of Flint children with EBLL when we considered identical seasons before and after the water source switch, with no statistically significant increase in EBLL outside Flint. The spatial and statistical ana- lyses highlight the greatest EBLL increase within certain wards of Flint, which corre- spond to the areas of elevated WLLs. A review of alternative sources of lead exposure reveals no other potential envi- ronmental confounders during the same time period. Demolition projects by the Genesee County Land Bank Authority (Heidi Phaneuf, written communication, October 29, 2015) showed no spatial relationship to the areas of increased EBLL rates. As well, no known new lead-producing factories nor changes in indoor lead remediation programs were implemented during the study period. Although Flint has a significant automobile history, the historical location of potentially lead-using manufacturing (e.g.,
- 17. battery plants, paint and pigment storage, production plants) do not align with current exposures. Because there was no known alternative source for increased lead exposure during this time period, the geospatial WLL results, the innate corrosive properties of Flint River water, and, most importantly, the lack of corrosion control, our findings strongly implicate the water source change as the probable cause for the dramatic increase in EBLL percentage. As in many urban areas with high levels of socioeconomic disadvantage and minority populations,46 we found a preexisting dis- parity in lead poisoning. In our pre water source switch data, the EBLL percentage in Flint was 2.4% compared with 0.7% outside Flint. This disparity widened with a post water source switch Flint EBLL of 4.8%, with no change in socioeconomic or demographic variables (Table 1). Flint children already suffer from risk factors that innately increase their lead exposure: poor nutrition, con- centrated poverty, and older housing stock. With limited protective measures, such as low rates of breastfeeding,47,48 and scarce resources for water alternatives, lead in water further exacerbates preexisting risk factors. Increased lead-poisoning rates have profound implications for the life course potential of an entire cohort of Flint children already rattled with toxic stress contributors (e.g.,
- 18. poverty, violence, unemployment, food insecurity). This is particularly troublesome in light of recent findings of the epigenetic effects of lead exposure on one’s grandchildren.49 The Kriging analysis showed the highest predicted BLLs within the city along a wide swath north and west of downtown. This area has seen significant demographic change, an increase in poverty, and an increase in vacant properties, especially over the past 25 years (Richard Sadler, written commu- nication, October 5, 2015). Higher BLLs were also predicted northeast of downtown and in other older neighborhoods where poverty and vacancy rates have been high for many decades. Significantly, the biggest changes in predicted BLL since 2013 were also found in these impoverished neighbor- hoods; more stable neighborhoods in the far north and south of the city may have experienced improved predicted BLLs be- cause of prevention efforts taken by the more-often middle-class residents in response to the water source change. Of considerable interest is that the areas shown as having the best public health indices by Board and Dunsmore in Figure 2 of their 1948 article37 are virtually identical to the areas with the worst lead levels today. After our preliminary zip code–based findings (pre to post water source switch 0.7
- 19. 2.4 4 1.8 1.2 4.9 10.6 2.3 0 2 4 6 8 10 12 Outside Flint All Flint* High WLL Flint* Lower WLL Flint Pe rc en ta
- 20. g e Pre Post Area Examined Note. WLL = water lead level. *P < .05. FIGURE 1—Comparison of Elevated Blood Lead Level Percentage, Before (Pre) and After (Post) Water Source Change From Detroit-Supplied Lake Huron Water to the Flint River: Flint, MI, 2013 and 2015 AJPH RESEARCH 286 Research Peer Reviewed Hanna-Attisha et al. AJPH February 2016, Vol 106, No. 2 EBLL = 2.1% to 4.0%; P < .05) were shared at a press conference,50 the City of Flint and the Genesee County Health Department released health advisories,51 and the county health department subsequently declared a public health emergency.52 Shortly after, the State of Michigan released an action plan with short- and long-term solutions focusing on additional sampling, filter dis- tribution, and corrosion control.53 One week later, Michigan’s governor revealed WLLs in 3 schools to be in the toxic range
- 21. with 1 school showing a water lead level of 101 ppb, almost 7 times the level that requires remediation.54 A $12 million plan to reconnect to Detroit’s water source was announced.54 We undertook our current spatial analytic approach to overcome limitations of zip code boundaries and to develop a more thorough understanding of specific areas in Flint where EBLL risk is more severe (post office addresses often do not align with municipal boundaries in Michigan, and one third of Flint mailing addresses are not in the city of Flint). This spatial analysis is valuable for understanding subneighborhood patterns in EBLL risk because aggregation by zip code or ward minimizes the richness of spatial variation and creates artificial barriers that may obscure hot spots (as in the confluence of wards 3, 4, and 5). Such use of spatial analysis for estimating lead exposure risk has been used to target blood lead–screening programs. In our case, in addition to identifying areas of risk, spatial analysis helps guide municipal and nongovernmental relief efforts aimed at identifying vulnerable populations in specific neighborhoods for priority distribution of resources (e.g., bottled water, filters, pre- mixed formula). Limitations
- 22. Our research contains a few limitations. First, we may have underestimated water- based lead exposure. Our sample included all children younger than 5 years with blood lead screening, although the greatest risk from lead in water is in utero and during infancy when lead screening is not done. If lead screening were recommended at a younger age (e.g., 6 or 9 months) for children who live in homes with potential lead piping or lead service lines, more children with EBLL from water could be identified, although state and national comparison rates would be lacking. Second, lead screening is not completed for all children. It is mandated by Medicaid and CDC-recommended for other high-risk groups; such data may be skewed toward higher-risk children and thus overestimate EBLL, especially in non–high-risk areas. Third, the underserved population of Flint has significant housing instability: lead levels may reflect previous environmental expo- sure, and exposure often cannot be ade- quately estimated on the basis of current residence alone.55 Fourth, although large, our sample does not reflect all lead screening from Flint. We estimate that our data capture approxi- mately 60% to 70% of the Michigan Child- hood Lead Poisoning Prevention Program data for Flint. Annual data released from this program further support our findings, revealing an annual decrease in EBLL per-
- 23. centage from May to April 2010 to 2011 until the same period in 2013 to 2014 (4.1%, Ward 2 WLL = 25% Ward 6 WLL = 28% Ward 7 WLL = 28% Ward 8 WLL = 20% 0.7–0.75 (more optimal) 0.76–1 1.01–1.25 1.26–1.5 1.51–1.75 1.76–2 2.01–2.25 2.26–2.5 2.51–2.75 2.76–3.36 (more hazardous) *Nonresidential zones screened from results *Ward labels indicate % of ward where any water sample exceeded 15 ppb
- 24. Flint City Wards Major streets Predicted BLL Based on Ordinary Kriging (μg/dL) Ward 9 WLL = 20% 0 0.25 0.5 1 Miles N Ward 5 WLL = 32% Ward 3 WLL = 18% Ward 4 WLL = 6% Ward 1 WLL = 10% Note. BLL = blood lead level; WLL = water lead level. FIGURE 2—Predicted Surface of Child Blood Lead Level and Ward-Specific Elevated Water Lead Level After (Post) Water Source Change From Detroit- Supplied Lake Huron Water to the Flint River: Flint, MI, 2015 AJPH RESEARCH February 2016, Vol 106, No. 2 AJPH Hanna-Attisha et al. Peer Reviewed Research 287 3.3%, 2.7%, 2.2%, respectively56; Robert L.
- 25. Scott, e-mail correspondence, September 25, 2015). Following the water switch in April 2014, the 4-year declining trend (as seen nationally) reversed with an annual EBLL of 3.0%. We found consistent results (with control for age and methodology) when we analyzed Michigan Childhood Lead Poisoning Prevention Program data for both high WLL Flint (EBLL percentage in- creased: 6.6% to 9.6%) and outside Flint (EBLL percentage remained virtually unchanged: 2.2% to 2.3%). Our institution- processed laboratory blood lead tests, how- ever, had an even greater proportion of children with EBLLs versus state data in the post period. This may reflect that the BLLs processed at Hurley Medical Center, the region’s only safety-net public hospital, represent a patient population most at risk with limited resources to afford tap water alternatives. Conclusions and Future Research Future research directions include con- ducting more detailed geospatial analyses of lead service-line locations with locations of elevated BLLs and WLLs; repeating identical spatial and statistical analyses in the same time period in 2016 reflecting changes associated with the health advisory and return to Lake Huron source water; analyzing feeding type (breastfed or recon-
- 26. stituted formula) for children with EBLLs; analyzing cord blood lead of Flint newborns compared with non-Flint newborns; and conducting water lead testing from homes of children with EBLLs. A once celebrated cost-cutting move for an economically distressed city, the water source change has now wrought untold economic, population health, and geo- political burdens. With unchecked lead ex- posure for more than 18 months, it is fortunate that the duration was not longer (as was the case in Washington, DC,’s lead-in- water issue).16 Even so, the Flint drinking water crisis is a dramatic failure of primary prevention. The legal safeguards and regu- lating bodies designed to protect vulnerable populations from preventable lead exposure failed. The Lead and Copper Rule requires water utilities to notify the state of a water source or treatment change recognizing that such changes can unintentionally have an impact on the system’s corrosion control.57 Although a review is required before implementing changes, the scope of risk as- sessment is not specified and is subject to misinterpretation. In response to the Flint drinking water crisis, the EPA recently re- leased a memo reiterating and clarifying the need for states to conduct corrosion control reviews before implementing
- 27. changes.58 This recommendation is especially relevant for communities with aging in- frastructures, usurped city governance, and minimal water utility capacity; in such situ- ations, there is an increased need for state and federal expertise and oversight to support decisions that protect population health. Through vigilant public health efforts, lead exposure has fallen dramatically over the past 30 years.13 With the increasing recog- nition that no identifiable BLL is safe and without deleterious and irreversible health outcomes,13 Healthy People 2020 identified the elimination of EBLLs and underlying disparities in lead exposure as a goal.59 Regrettably, our research reveals that the potentially increasing threat of lead in drinking water may dampen the significant strides in childhood lead-prevention efforts. As our aging water infrastructures continue to decay, and as communities across the nation struggle with finances and water supply sources, the situation in Flint, Michigan, may be a harbinger for future safe drinking-water challenges. Ironically, even when one is surrounded by the Great Lakes, safe drinking water is not a guarantee. CONTRIBUTORS M. Hanna-Attisha originated the study, developed methods, interpreted analysis, and contributed to the writing of the article. J. LaChance and R. Casey Sadler assisted with the development of the methods, analyzed
- 28. results, interpreted the findings, and contributed to the writing of the article. A. Champney Schnepp assisted with the interpretation of the findings and contributed to the writing of the article. ACKNOWLEDGMENTS We would like to thank Marc Edwards, PhD, and Elin Betanzo, MS, for their expert assistance with un- derstanding the historical and scientific background of lead in water. HUMAN PARTICIPANT PROTECTION This study was reviewed and approved by Hurley Medical Center institutional review board. REFERENCES 1. Associated Press. “I don’t even let my dogs drink this water.” CBS News. March 4, 2015. Available at: http:// www.cbsnews.com/news/flint-michigan-break-away- detroit-water-riles-residents. Accessed October 3, 2015. 2. City of Flint 2014 Annual Water Quality Report. 2014. Available at: https://www.cityofflint.com/wp-content/ uploads/CCR-2014.pdf. Accessed September 30, 2015. 3. Edwards M, Triantafyllidou S. Chloride to sulfate mass ratio and lead leaching to water. J Am Water Works Assoc. 2007;99(7):96–109. TABLE 2—Ward-Based Comparison of WLL Percentages, Pre- and Post-Switch EBLL Percentages, and Predicted Post BLL and Change in Predicted BLL by Ordinary Kriging Geostatistical Analysis: Flint, MI, 2013 and 2015 Ward WLL % > 15 ppb Pre EBLL% Post EBLL% Predicted Post
- 29. BLLa Change in Predicted BLL From Pre to Post, mg/dL 1 10 0.0 2.8 1.4 –0.10 2 25 0.0 1.4 0.7 0.19 3 18 1.0 4.5 2.9 0.05 4 6 3.1 1.7 2.4 –0.15 5b 32 4.9 15.7 10.3 0.51 6b 28 2.2 9.3 5.5 0.27 7b 28 5.4 5.9 5.7 -0.26 8 20 2.7 1.4 2.0 0.01 9 20 3.4 1.6 2.5 –0.43 Note. BLL = blood lead level; EBLL = elevated blood lead level; WLL = water lead level. aOrdinary Kriging geostatistical analysis. bIndicates wards defined as high WLL risk in this study. AJPH RESEARCH 288 Research Peer Reviewed Hanna-Attisha et al. AJPH February 2016, Vol 106, No. 2 http://www.cbsnews.com/news/flint-michigan-break-away- detroit-water-riles-residents http://www.cbsnews.com/news/flint-michigan-break-away- detroit-water-riles-residents
- 30. http://www.cbsnews.com/news/flint-michigan-break-away- detroit-water-riles-residents https://www.cityofflint.com/wp-content/uploads/CCR-2014.pdf https://www.cityofflint.com/wp-content/uploads/CCR-2014.pdf 4. Edwards M, McNeill LS. Effect of phosphate inhibitors on lead release from pipes. J Am Water Works Assoc. 2007; 94(1):79–90. 5. Edwards M, Falkinham J, Pruden A. Synergistic impacts of corrosive water and interrupted corrosion control on chemical/microbiological water quality: Flint, MI. National Science Foundation Grant abstract. Avail- able at: http://www.nsf.gov/awardsearch/showAward? AWD_ID=1556258&HistoricalAwards=false. Accessed September 10, 2005. 6. Guyette C. Scary: leaded water and one Flint family’s toxic nightmare. Deadline Detroit. July 9, 2015. Available at: http://www.deadlinedetroit.com/articles/12697/ scary_leaded_water_and_one_flint_family_s_toxic_ nightmare#.VfYm6eeZZJN. Accessed September 13, 2015. 7. Fonger R. Flint data on lead water lines stored on 45,000 index cards. Mlive Media Group. October 1, 2015. Available at: http://www.mlive.com/news/flint/index. ssf/2015/10/flint_official_says_data_on_lo.html. Accessed October 4, 2015. 8. Centers for Disease Control and Prevention. Pre- venting lead poisoning in young children. 2005. Available at: http://www.cdc.gov/nceh/lead/publications/ PrevLeadPoisoning.pdf. Accessed September 30, 2015.
- 31. 9. Gould E. Childhood lead poisoning: conservative estimates of the social and economic benefits of lead hazard control. Environ Health Perspect. 2009;117(7): 1162–1167. 10. Landrigan PJ, Schechter CB, Lipton JM, Fahs MC, Schwartz J. Environmental pollutants and disease in American children: estimates of morbidity, mortality, and costs for lead poisoning, asthma, cancer, and de- velopmental disabilities. Environ Health Perspect. 2002;110 (7):721–728. 11. Schwartz J. Societal benefits of reducing lead expo- sure. Environ Res. 1994;66(1):105–124. 12. Pamuk E, Makuc D, Heck K, Reuben C, Lochner K. Socioeconomic status and health chartbook. Health, United States, 1998. Centers for Disease Control and Prevention. 1998. Available at: http://www.cdc.gov/ nchs/data/hus/hus98cht.pdf. Accessed October 1, 2015. 13. Low level lead exposure harms children. A renewed call for primary prevention. Report of the Advisory Committee on Childhood Lead Poisoning Prevention. Centers for Disease Control and Prevention. 2012. Available at: http://www.cdc.gov/nceh/lead/acclpp/ final_document_030712.pdf. Accessed September 2015. 14. Landrigan PJ, Graef JW. Pediatric lead poisoning in 1987: the silent epidemic continues. Pediatrics. 1987; 79(4):582–583. 15. Shannon MW. Etiology of childhood lead poisoning. In: Pueschel SM, Linakis JG, Anderson AC, eds. Lead Poisoning in Childhood. Baltimore, MD: Paul H. Brookes Publishing Company; 1996:37–58.
- 32. 16. Edwards M, Triantafyllidou S, Best D. Elevated blood lead in young children due to lead-contaminated drinking water: Washington, DC. Environ Sci Technol. 2009;43(5):1618–1623. 17. Miranda ML, Kim D, Hull AP, Paul CJ, Overstreet Galeano MA. Changes in blood lead levels associated with use of choramines in water treatment systems. En- viron Health Perspect. 2007;111(2):221–225. 18. Edwards M. Designing sampling for targeting lead and copper: implications for exposure. Lecture presented to: the US Environmental Protection Agency National Drinking Water Advisory Group; September 18, 2014. 19. Davidson CI, Rabinowitz M. Lead in the environ- ment: from sources to human receptors. In: Needleman HL, ed. Human Lead Exposure. Boca Raton, FL: CRC Pres; 1991. 20. Gaines RH. The corrosion of lead. J Ind Eng Chem. 1913;5(9):766–768. 21. Raab GM, Laxen DPH, Anderson N, Davis S, Heaps M, Fulton M. The influence of pH and household plumbing on water lead concentration. Environ Geochem Health. 1993;15(4):191–200. 22. Toxicological profile for lead. US Department of Health and Human Services, Public Health Service, Agency for Toxic Substances and Diseases Registry. 2007. Available at: http://www.atsdr.cdc.gov/toxprofiles/ tp13.pdf. Accessed October 6, 2015. 23. Ngueta G, Belkacem A, Tarduf R, St-Laurent J,
- 33. Levallois P. Use of a cumulative exposure index to es- timate the impact of tap-water lead concentration on blood lead levels in 1-to 5-year-old children (Montreal, Canada). Environ Health Perspect. 2015; Epub ahead of print. 24. Triantafyllidou S, Gallagher D, Edwards M. Assessing risk with increasingly stringent public health goals: the case of water lead and blood lead in children. J Water Health. 2014;12(1):57–68. 25. US Environmental Protection Agency. Safe Drinking Water Act Lead and Copper Rule (LCR). Fed Regist. 1991;56:26460–26564. 26. Edwards M. Fetal death and reduced birth rates as- sociated with exposure to lead-contaminated drinking water. Environ Sci Technol. 2014;48(1):739–746. 27. Advisory Committee on Childhood Lead Poisoning Prevention. Recommendations for blood lead screening of young children enrolled in Medicaid: tar- geting a group at high risk. MMWR Recomm Rep. 2000; 49(RR-14):1–13. 28. Jacobs AJ. The impacts of variations in development context on employment growth: a comparison of cen- tral cities in Michigan and Ontario, 1980–2006. Econ Dev Q. 2009;23(4):351–371. 29. Kids Count Data Center. A project of the Annie E Casey Foundation. Available at: http://datacenter. kidscount.org/data#MI/3/0. Accessed September 26, 2015. 30. County health rankings and roadmaps: building
- 34. a culture of health, county by county. Available at: http:// www.countyhealthrankings.org/app/michigan/2015/ overview. Accessed September 26, 2015. 31. Michigan MIECHV Needs Assessment FY2015. Available at: http://www.michigan.gov/documents/ homevisiting/Updated_MHVI_Needs_Assessment_ 2014_All_counties_474015_7.pdf. Accessed October 5, 2015. 32. US Census Bureau. Quick Facts Beta. Available at: http://www.census.gov/quickfacts/table/PST045214/ 00, 2629000,26. Accessed September 2015. 33. Lewis PF. Impact of Negro migration on the electoral geography of Flint, Michigan, 1932–1962: a cartographic analysis. Ann Assoc Am Geogr. 1965;55(1): 1–25. 34. Taeuber KE, Taeuber AF. Negroes in Cities: Residential Segregation and Neighborhood Change. Chicago, IL: Aldine Publishing Company: 1969. 35. Highsmith AR. Demolition means progress: urban renewal, local politics, and state-sanctioned ghetto formation in Flint, Michigan. J Urban Hist. 2009;35: 348–368. 36. Zimmer BG, Hawley AH. Approaches to the so- lution of fringe problems: preferences of residents in the Flint metropolitan area. Public Adm Rev. 1956;16(4): 258–268. 37. Board LM, Dunsmore HJ. Environmental health problems related to urban decentralization: as observed in a typical metropolitan community. Am J Public Health
- 35. Nations Health. 1948;38(7):986–996. 38. Martin R, Tang M. Percent lead in water by Flint ward. Flint Water Study. 2015. Available at: http://i0.wp. com/flintwaterstudy.org/wp-content/uploads/2015/ 09/Flint-Ward-Map_252-989x1280-2.jpg. Accessed September 26, 2015. 39. Pampalon R, Hamel D, Gamache P, Raymond G. A deprivation index for health planning in Canada. Chronic Dis Can. 2009;29(4):178–191. 40. Sadler RC, Gilliland JA, Arku G. Community de- velopment and the influence of new food retail sources on the price and availability of nutritious food. J Urban Aff. 2013;35(4):471–491. 41. Hastings D, Miranda ML. Using GIS-based models to protect children from lead exposure in international series in operations research and management science. In: Johnson M, ed. Community-Based Operations Research: Decision Modeling for Local Impact and Diverse Populations. 1st ed. New York, NY: Springer-Verlag New York; 2012: 173–187. 42. Schwarz K, Pickett STA, Lathrop RG, Weathers KC, Pouyat RV, Cadenasso ML. The effects of the urban built environment on the spatial distribution of lead in residential soils. Environ Pollut. 2012;163:32–39. 43. Griffith DA, Doyle PG, Wheeler DC, Johnson DL. A tale of two swaths: urban childhood blood-lead levels across Syracuse, New York. Ann Assoc Am Geogr. 1998;88 (4):640–665.
- 36. 44. Jernigan RW. A Primer on Kriging. Washington, DC: US Environmental Protection Agency; 1986. 45. Markus J, McBratney AB. A review of the contam- ination of soil with lead: II. Spatial distribution and risk assessment of soil lead. Environ Int. 2001;27(5): 399–411. 46. Schulz A, Northridge ME. Social determinants of health: implications for environmental health promotion. Health Educ Behav. 2004;31(4):455–471. 47. Genesee County Health Department. Re: Breast- feeding initiation challenge. 2010. Available at: http:// www.gchd.net/PressReleases/20100923bfeeding_ challenge.asp. Accessed October 6, 2015. 48. Sherlock JC, Quinn MJ. Relationship between blood lead concentrations and dietary lead intake in infants: the Glasgow Duplicate Diet Study 1979–1980. Food Addit Contam. 1986;3(2):167–176. 49. Sen A, Heredia N, Senut M-C, et al. Multigenera- tional epigenetic inheritance in humans: DNA methyl- ation changes associated with maternal exposure to lead can be transmitted to the grandchildren. Sci Rep. 2015;5:14466. 50. Fonger R. Elevated lead found in more Flint kids after water switch, study finds. Mlive Media Group. September 24, 2015. Available at: http://www.mlive.com/news/ flint/index.ssf/2015/09/study_shows_twice_as_many_ flin.html. Accessed November 8, 2015. 51. Fonger R. Flint makes lead advisory official, suggests water filters and flushing. Mlive Media Group. September
- 37. 25, 2015. Available at: http://www.mlive.com/news/ flint/index.ssf/2015/09/flint_makes_lead_advisory_offi. html. Accessed October 6, 2015. AJPH RESEARCH February 2016, Vol 106, No. 2 AJPH Hanna-Attisha et al. Peer Reviewed Research 289 http://www.nsf.gov/awardsearch/showAward?AWD_ID=155625 8&HistoricalAwards=false http://www.nsf.gov/awardsearch/showAward?AWD_ID=155625 8&HistoricalAwards=false http://www.deadlinedetroit.com/articles/12697/scary_leaded_wa ter_and_one_flint_family_s_toxic_nightmare#.VfYm6eeZZJN http://www.deadlinedetroit.com/articles/12697/scary_leaded_wa ter_and_one_flint_family_s_toxic_nightmare#.VfYm6eeZZJN http://www.deadlinedetroit.com/articles/12697/scary_leaded_wa ter_and_one_flint_family_s_toxic_nightmare#.VfYm6eeZZJN http://www.mlive.com/news/flint/index.ssf/2015/10/flint_officia l_says_data_on_lo.html http://www.mlive.com/news/flint/index.ssf/2015/10/flint_officia l_says_data_on_lo.html http://www.cdc.gov/nceh/lead/publications/PrevLeadPoisoning. pdf http://www.cdc.gov/nceh/lead/publications/PrevLeadPoisoning. pdf http://www.cdc.gov/nchs/data/hus/hus98cht.pdf http://www.cdc.gov/nchs/data/hus/hus98cht.pdf http://www.cdc.gov/nceh/lead/acclpp/final_document_030712.p df http://www.cdc.gov/nceh/lead/acclpp/final_document_030712.p df http://www.atsdr.cdc.gov/toxprofiles/tp13.pdf http://www.atsdr.cdc.gov/toxprofiles/tp13.pdf http://datacenter.kidscount.org/data#MI/3/0
- 39. _lead_advisory_offi.html http://www.mlive.com/news/flint/index.ssf/2015/09/flint_makes _lead_advisory_offi.html http://www.mlive.com/news/flint/index.ssf/2015/09/flint_makes _lead_advisory_offi.html 52. Johnson J. Don’t drink Flint’s water, Genesee County leaders warn. Mlive Media Group. October 1, 2015. Available at: http://www.mlive.com/news/flint/index. ssf/2015/10/genesee_county_leaders_warn_do.html. Accessed October 6, 2015. 53. Erb R, Gray K. State to tackle unsafe water in Flint with tests, filters. Detroit Free Press. October 2, 2015. Available at: http://www.freep.com/story/news/local/ michigan/2015/10/02/state-officials-outline-plan-flint- water/73200250. Accessed October 6, 2015. 54. J. Snyder announces $12 million-plan to fix Flint water. Detroit Free Press. October 8, 2015. Available at: http://www.freep.com/story/news/local/michigan/ 2015/10/08/snyder-flint-water-reconnect/73567778. Accessed October 8, 2015. 55. Kestens Y, Lebel A, Chaix B, et al. Association be- tween activity space exposure to food establishments and individual risk of overweight. PLoS One. 2012;7(8): e41418. 56. Tanner K, Kaffer N. State data confirms higher blood-lead levels in Flint kids. Detroit Free Press. Sep- tember 29, 2015. Available at: http://www.freep.com/ story/opinion/columnists/nancy-kaffer/2015/09/26/ state-data-flint-lead/72820798. Accessed October 7, 2015.
- 40. 57. US Environmental Protection Agency, Office of Water. Lead and Copper Rule 2007 short-term regula- tory revisions and clarifications state implementation guidance. June 2008. Available at: http://water.epa.gov/ lawsregs/rulesregs/sdwa/lcr/upload/New-Lead-and- Copper-Rule-LCR-2007-Short-Term-Regulatory- Revisions-and-Clarifications-State-Implementation- Guidance.pdf. Accessed October 25, 2015. 58. Grevatt PC. Lead and Copper Rule requirements for optimal corrosion control treatment for large drinking water systems. Memo to EPA Regional Water Division Directors, Regions I-X. November 3, 2015. Available at: http://flintwaterstudy.org/wp-content/uploads/2015/ 11/LCR-Requirements-for-OCCT-for-Large-DW- Systems-11-03-2015.pdf. Accessed December 8, 2015. 59. Healthy People 2020: topics and objectives index. Washington, DC: US Department of Health and Human Services; 2012. Available at: http://www.healthypeople. gov/2020/topicsobjectives2020. Accessed October 27, 2015. AJPH RESEARCH 290 Research Peer Reviewed Hanna-Attisha et al. AJPH February 2016, Vol 106, No. 2 http://www.mlive.com/news/flint/index.ssf/2015/10/genesee_co unty_leaders_warn_do.html http://www.mlive.com/news/flint/index.ssf/2015/10/genesee_co unty_leaders_warn_do.html http://www.freep.com/story/news/local/michigan/2015/10/02/sta te-officials-outline-plan-flint-water/73200250 http://www.freep.com/story/news/local/michigan/2015/10/02/sta