
Recommended
Recommended
More Related Content
What's hot
What's hot (20)
Similar to Off-price q2 20
Similar to Off-price q2 20 (20)
More from thomas paulson
More from thomas paulson (20)
Off-price q2 20
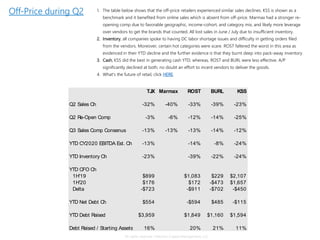
- 1. TJX Marmax ROST BURL KSS Q2 Sales Ch -32% -40% -33% -39% -23% Q2 Re-Open Comp -3% -6% -12% -14% -25% Q3 Sales Comp Consenus -13% -13% -13% -14% -12% YTD CY2020 EBITDA Est. Ch -13% -14% -8% -24% YTD Inventory Ch -23% -39% -22% -24% YTD CFO Ch 1H'19 $899 $1,083 $229 $2,107 1H'20 $176 $172 -$473 $1,657 Delta -$723 -$911 -$702 -$450 YTD Net Debt Ch $554 -$594 $485 -$115 YTD Debt Raised $3,959 $1,849 $1,160 $1,594 Debt Raised / Starting Assets 16% 20% 21% 11% Off-Price during Q2 1. The table below shows that the off-price retailers experienced similar sales declines. KSS is shown as a benchmark and it benefited from online sales which is absent from off-price. Marmax had a stronger re- opening comp due to favorable geographic, income-cohort, and category mix, and likely more leverage over vendors to get the brands that counted. All lost sales in June / July due to insufficient inventory. 2. Inventory, all companies spoke to having DC labor shortage issues and difficulty in getting orders filed from the vendors. Moreover, certain hot categories were scare. ROST faltered the worst in this area as evidenced in their YTD decline and the further evidence is that they burnt deep into pack-away inventory. 3. Cash, KSS did the best in generating cash YTD; whereas, ROST and BURL were less effective. A/P significantly declined at both, no doubt an effort to incent vendors to deliver the goods. 4. What's the future of retail, click HERE. All rights reserved, Inflection Capital Management, LLC
- 2. 25%*** 75% Retailer** Market Captured Captured NAICS Retail Sales* - 2019 Off-Price*** Supply Share by by Code $millions Category Addressible Destruction Disrupted Digital Stores 442 Furniture and home furnishingsstores $117,815 $29,454 15% $4,418 $1,105 $3,314 448 Clothingand clothingaccess.stores $266,903 $106,761 20% $21,352 $5,338 $16,014 4521 Department stores $135,026 $54,010 20% $10,802 $2,701 $8,102 Totals $190,225 $36,572 $9,143 $27,429 ROST (2019) $16,039 Share 8% Eliminated $36,572 Remainder of SurvingStore Sales $137,614 (Total - ROST - Eliminated) Share 72% ROST + Remainder Share 81% ROST Adj Share (post COVID) 10% (simply 8% / 81%) Share Post COVID 10% Addressibly Market (stores) $181,082 ($190,225 - $9,143) ROST $of Share post-COVID $18,902 Notes: * Census Bureau MRTSreport ** Based upon our analysis of announced closings and Census data. *** Questimates 2 ROST: Sales Outlook All rights reserved, Inflection Capital Management, LLC We and other investors own ROST because we expect it to survive to the other side of the COVID-valley and then thrive. Based upon the merits of ROST's offering to the consumer, the durability of its business model, and the reliability of management's execution, we expect ROST to at least retain is pro-forma market share from pre-COVID, which we quantify as 8%. Based upon our analysis of the current retail industry, we forecast that the retailers the NAICS codes 442, 448, & 4521 will loose 15-20% of their share due to store closures and unsatisfactory customer service. We questimate that: 1) only a portion of these retailers' sales are addressable by off-price retailers and that 2) of the share loss, remaining traditional retailers capture 75% of that lost share, while digital retailers (Amazon, Shopify sellers, ThreadUP, Revolve, and other digital natives) capture 25%.
- 3. All rights reserved, Inflection Capital Management, LLC Ross Stores $5m per penny 2018 2019 2020E 1Q 2Q 3Q 4Q 2021E 2022E Comps 4% 4% -10% 125% 71% 36% 29% 62% 6% Guide 1-2% Net Sales $14,983 $16,039 $11,955 $4,196 $4,671 $4,679 $5,355 $18,902 $20,785 Cost of sales $10,726 $11,536 $3,063 $3,410 $3,416 $3,909 $13,798 $15,142 Gross profit $4,258 $4,503 $1,133 $1,261 $1,263 $1,446 $5,104 $5,643 SG & A expense $2,217 $2,357 $586 $622 $635 $632 $2,474 $2,663 Operating profit $2,041 $2,146 $547 $640 $629 $814 $2,629 $2,981 53-week Interest expense ($9) ($18) $20 $15 $15 $15 $65 $8 Pretax income $2,050 $2,164 $527 $625 $614 $799 $2,564 $2,973 Total Tax $463 $503 $129 $153 $150 $196 $628 $728 Tax rate 23% 23% 25% 25% 25% 25% 25% 25% Net Income $1,587 $1,661 $398 $472 $463 $603 $1,936 $2,244 Earnings per share $4.26 $4.60 $1.12 $1.33 $1.31 $1.71 $5.47 $6.49 Operating margin 13.6% 13.4% 13.0% 13.7% 13.4% 15.2% 13.9% 14.3%