We studied the earnings results from the 20 largest US retailers that have reported their Q1'20/C-19 period business results. From this we have distilled out what we believe to be the durable changes in consumer behavior and the retail industry.
Indian Call Girl In Dubai #$# O5634O3O18 #$# Dubai Call Girl
Observations from Q1 Retailer Earnings and C19 Durable Changes
1. Thomas Paulson Inflection Capital Management, LLC Thomas@InflectionCapital.Co 612-986-
6475
Our Observationsfrom Q1-Retailer Earnings
1) Certain retail offerings won unprecedented consumer choice during this initial C19-period, what's here to stay?
Contactless and safe offerings. Looking forward, retailers that offer "contactlesscommerce" will win repeat visits
and loyalty. Why would consumers prefer a touchscreen, cash, etc? Additionally, retailers that can incentivize
consumers into their apps for QR validated payment win the consumer data and the relationship to build loyalty
(see Target's).
Groceriesand category breadth. The broader a retailer's offering was, the larger the trip consideration and wallet
share capture. Evidence of this is Target's +12.5% average basket size growth and Walmart's +16.5%. Looking
forward, why would shoppers go back to spending more of their precious time in order to spread it with more
retailers? We expect trip consolidation to persist. Yes, there will be some give-back, but today is the moment for
such retailers to expand their brands and the quality-range of their offerings to leverage the moment and increase
their consideration and long-term wallet share capture. Moreover, other loyalty services may be considered like
"subscription pick-up" where a household details a standard shopping list for pick up each week at an appointed
time, making edits to the list the night before.
Curbside grocery offerings crushed it this quarter with Walmart's up 300% in April (to a $18B annualized
business) and Target's overall digital business up 280%. Target Drive-Up served over 5M guests in April and its
same-day offerings became 5% of company sales (a $4B annualized business). It was particularly noteworthy that
there was only a modest detrimental impact on company-wide marginsto fulfill this new curbside demand.
(We estimate the incremental cost at Target for curbside to be $1.15/order.) We suspect the more moderate
expense is due to a lower level of retailer promotions (as the data below shows) because of the surge in demand
and because digital has an inherently lower level of promotion for consumables. Moreover, as volumes further build
upon the fixed costs, as the operations are refined, and as retailers discover ways to sweeten the basket mix, the
adverse channel mix should narrow. At present, Walmart is limiting the availability of general merchandise and
Target needs to transition the service from mobile-only. Looking forward, should Target, Walmart, and Kroger be
able to drive curbside grocery towards 10% of company sales (without cannibalizing in-store sales, incrementality
is key here) that's $55B in sales out of a $700B industry. C19 was the shot-in-the-arm that "digital grocery"
needed to be embraced by a critical mass of households. That boost will give the three retailers further leverage to
increase and enhance their "alternative profit" streams: house brands, advertising, financial services, healthcare
services, and other new ones.
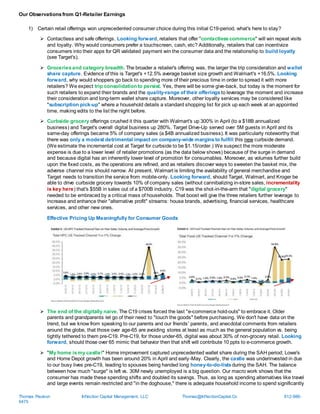
Effective Pricing Up Meaningfully for Consumer Goods
The end of the digitally naive. The C19 crises forced the last "e-commerce hold-outs" to embrace it. Older
parents and grandparents let go of their need to "touch the goods" before purchasing. We don't have data on the
trend, but we know from speaking to our parents and our friends' parents, and anecdotal comments from retailers
around the globe, that those over age-65 are avoiding stores at least as much as the general population vs. being
tightly tethered to them pre-C19. Pre-C19, for those under-65, digital was about 30% of non-grocery retail. Looking
forward, should those over 65 mimic that behavior then that shift will contribute 10 ppts to e-commerce growth.
"My home ismy castle!" Home improvement captured unprecedented wallet share during the SAH period; Lowe's
and Home Depot growth has been around 20% in April and early-May. Clearly, the castle was underinvested in due
to our busy lives pre-C19, leading to spouses being handed long honey-to-do-listsduring the SAH. The balance
between how much "surge" is left vs. 30M newly unemployed is a big question. Our macro work shows that the
consumer has made these spending shifts and doubled its savings. Thus, as long as spending alternatives like travel
and large events remain restricted and "in the doghouse," there is adequate household income to spend significantly
2. Thomas Paulson Inflection Capital Management, LLC Thomas@InflectionCapital.Co 612-986-
6475
more on home improvement. For consumers, this is an investment in an appreciating asset and their family's comfort
and safety. Looking forward, these should remain high consumer priorities. When cruises and trips to Mexico return,
watch out.
Changes in Wallet Share During the C19-April Period
2) In addition to home improvement and gardening, athletic, athleisure, home textiles / decor, and home office
electronics/ furniture categories have been outperforming during C19. The athletic and athleisure strength is a re-
enforcement of an ongoing trend (or perhaps consumers wanted new sneakers for their walktailsand a few additional
tracksuits for their WFH wardrobe.) Looking forward, the category that looks most at risk is career wear which is a
significant category for department stores and specialty retailers like Ann Taylor, J. Crew and Banana Republic. As to
other segments of apparel retail, given the importance of agility reinforced by C19, the product cycle should materially
shorten. This had been happening, looking forward this will accelerate as decision-layers will have been removed and
because consumer insights will have improved due to a higher level of digital and contactless sales. As such, inventory
levels should be lower and more on-trend for these retailers which improves their economics.
3) What happensto the mall? It's hard to imagine any other outcome then creative destruction. The existential
headwinds (such as e-Commerce) keep stacking and accelerating. Rents are being deferred and pushed lower, even
by healthy renters like Starbucks. Retailer bankruptcies will allow some to get out of higher than market-level rent—a
level that C19 has just set lower. Additionally, when large retailers (like Nordstrom and Neiman) leave a mall, co-
tenancy lease conditions allow others to escape—setting in a downward-spiral.
Consumer preference to open-air malls is making a big upward jump, whereas, indoor malls are suffering even more
loss of appeal. (Again, a trend that has been ongoing for some time that now gets a large shove.) We imagine a portion
of indoor mall space being flattened to make adjacent space for pedestrian walkways that wind through experiential
stores, outdoor garden features, and food halls (with plentiful outdoor patios). Illustrated differently, imagine something
like a locally-curated mini-Disneyland. Where we get stuck in this "dream" is an adequate return on the investment
for a transformation. Long-term economics generally prevail and so that's our outlook for the value of commercial real
estate land values. Indoor A-class rent as a percentage of retailer revenue is nearly 10%. If that's halved, a typical
retailer can lose 15% of its sales and have a similar operating margin. Alternatively, maybe all consumer experiences
and retail have lower profit margins and returns over the medium-term. The consequence of that would be less new
investment and new competition. In the passage of time, capitalism reliably findsthe balance between supply and
demand and capital flows to the highest return on investment.
$ Billions at a Seasonally Adjusted Annual Level April '19 SAAR April '20 SAAR YoY $ Ch YoY
Personal Consumption Expenditure
Census Bureau Retail Sales
Building mat. and garden equip. and supplies dealers 383 384 1 0%
Food and beverage stores 760 851 92 12%
Est. Grocery stores at clubs and superstores 248 283 35 14%
Nonstore retailers (Amazon, Etsy, QVC, etc.) 774 941 167 22%
Remainder of Retail Sales 4,019 2,389 -1,631 -41%
PCE Services
Housing and utilities 2,637 2,742 105 4%
Financial services and insurance 1,134 1,191 57 5%
Hotels and On Property Food Service 1,001 501 -501 -50%
Recreation services 582 233 -349 -60%
Transportation services 465 279 -186 -40%
Health care 2,442 2,076 -366 -15%
Sources: BEA, National Income & Product Accounts, Table 2.3.5U and Table 2.6. Census Bureau MARTS April Report. DPI consensus figure from BBG 5.15.20
Shaded figures are our estimates based upon BEA's monthly reported numbers, Table 2.6. Reported figures to come on May 30th.
Wallet share capture
Wallet share capture
Wallet share loss
Wallet share loss