
Recommended
Recommended
More Related Content
What's hot
What's hot (19)
Similar to Lowe's Accelerating Ecommerce Growth Sets Stage for Strong 2H Results
Similar to Lowe's Accelerating Ecommerce Growth Sets Stage for Strong 2H Results (20)
More from thomas paulson
More from thomas paulson (20)
Recently uploaded
Recently uploaded (20)
Lowe's Accelerating Ecommerce Growth Sets Stage for Strong 2H Results
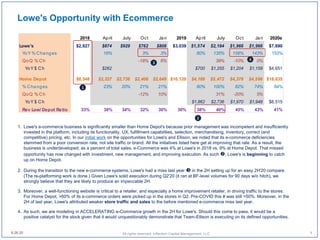
- 1. 2018 April July Oct Jan 2019 April July Oct Jan 2020e Lowe's $2,827 $874 $929 $762 $808 $3,039 $1,574 $2,184 $1,966 $1,966 $7,690 YoY % Changes 16% 3% 3% 80% 135% 158% 143% 153% QoQ % Ch -18% 6% 39% -10% 0% YoY $ Ch $262 $700 $1,255 $1,204 $1,158 $4,651 Home Depot $8,548 $2,327 $2,736 $2,408 $2,649 $10,120 $4,189 $5,472 $4,378 $4,596 $18,635 % Changes 23% 20% 21% 21% 80% 100% 82% 74% 84% QoQ % Ch -12% 10% 31% -20% 5% YoY $ Ch $1,862 $2,736 $1,970 $1,948 $8,515 Rev Low/ Depot Ratio 33% 38% 34% 32% 30% 30% 38% 40% 45% 43% 41% 1 2 3 4 All rights reserved, Inflection Capital Management, LLC Lowe's Opportunity with Ecommerce 1. Lowe's e-commerce business is significantly smaller than Home Depot's because prior management was incompetent and insufficiently invested in the platform, including its functionality, UX, fulfillment capabilities, selection, merchandising, inventory, correct (and competitive) pricing, etc. In our initial work on the opportunities for Lowe's and Ellison, we noted that its e-commerce deficiencies stemmed from a poor conversion rate, not site traffic or brand. All the initiatives listed here get at improving that rate. As a result, the business is underdeveloped; as a percent of total sales, e-Commerce was 4% at Lowe's in 2018 vs. 9% at Home Depot. That missed opportunity has now changed with investment, new management, and improving execution. As such , Lowe's is beginning to catch up on Home Depot. 2. During the transition to the new e-commerce systems, Lowe's had a miss last year in the 2H setting up for an easy 2H'20 compare. (The re-platforming work is done.) Given Lowe's solid execution during Q2'20 (it ran at BF-level volumes for 90 days w/o hitch), we strongly believe that they are likely to produce an impeccable 2H. 3. Moreover, a well-functioning website is critical to a retailer, and especially a home improvement retailer, in driving traffic to the stores. For Home Depot, >60% of its e-commerce orders were picked up in the stores in Q2. Pre-COVID this # was still >50%. Moreover, in the 2H of last year, Lowe's attributed weaker store traffic and sales to the before mentioned e-commerce miss last year. 4. As such, we are modeling in ACCELERATING e-Commerce growth in the 2H for Lowe's. Should this come to pass, it would be a positive catalyst for the stock given that it would unquestionably demonstrate that Team-Ellison is executing on its defined opportunities. 8.26.20 1
- 2. Pro Business 2019 April July Oct Jan 2020e Lowe's Domestic Pro Retail $15,108 $4,083 $5,469 $4,464 $3,962 $17,978 YoY $ Ch $337 $1,094 $835 $604 $2,870 YoY % Ch 4% 9% 25% 23% 18% 19% % of total Dom estic 23% 22% 21% 22% per Store $10.7 $12.8 Home Depot (all regions) $49,919 $12,346 $16,018 $13,768 $12,967 $55,099 YoY $ Ch $475 $2,089 $1,796 $1,179 $5,180 YoY % Ch 7% 4% 15% 15% 10% 10% % of total 45% 44% 42% 44% per Store $21.8 $24.0 LOW/ HD Pro Rev Ratio 30% 33% 34% 32% 31% 33% 1 2 Lowe's Opportunity with the Pro Context: Similar to the opportunity in eCommerce to narrow the gap, Lowe's business with commercial customers (contractors, multi-tenet managers, government, institutional, etc.) is significantly smaller than Depot's because prior management was incompetent and insufficiently invested in the right product, in-stock levels, services levels, delivery systems, business development people, etc. All of this can be found in our initial report. As is demonstrated below, Team-Ellison is executing on the opportunity and Lowe's is catching up . However, even with this better year, Lowe's Pro business on a per-store basis will still be only half the size of Depot's . As such, as all the elements of Team Ellison's plan come together and as won-over Pros repeat their business at Lowe's and spread the word, Pro should prove to be a strong driver of growth in the medium-term for Lowe's. Of note, HD+LOW only have about 27% of this market; thus, there are a lot of independents to beat. Comments: Pro comps +25% w/ "significant increases in the number of new Pro...customers" and with performance supported by "job lot quantities and improved service levels." McFarland, "We are beginning a multiyear national rollout of Lowe's tool rental program with the grand opening of our first location at our Central Charlotte store next week. As over 70% of pros are currently utilizing tool rental programs, this will provide a meaningful opportunity for Lowe's to deepen our relationship with this customer segment. After a successful pilot, we are launching this program nationwide with a broad product assortment, a fully equipped mechanic shop, a large store footprint and importantly, intuitive customer-facing technology that creates a fast, frictionless process for this time-pressed customer." All rights reserved, Inflection Capital Management, LLC8.26.20 2 In-home projects should pick-up which were skipped in the 1H
- 3. Allrightsreserved,InflectionCapitalManagement,LLC Guest and Employee Safety as a Competitive Strategy for Winning Loyalty Comments: We commented in our write-up on the mass merchants that the retailers that took highly visible actions to increase their health and safety PPE and protocols won repeat visits and increased customer loyalty. We do not have the NPS data, or other survey data, to explicitly reveal who did better - worse on these marks. However, from the pointed management commentary, clearly it was a differentiator during the quarter. One such KPI to evaluate the differences is reported comp traffic. From this measure, it would appear that Lowe's did a better job than Depot. However, Home Depot also faced more restrictions on the number of shoppers in the store and its hours of operations; as such, there are many dynamics at work on their traffic numbers. In the case of Walmart, the sequential deterioration is a bit confounding, or revealing. That said, we know from our store visits that all four made substantial efforts during COVID to make their stores safer for all. There were many retailers that didn't make this connection. CEO Ellison, "We've done an analysis that suggests that our COVID-19 safety protocols in our stores are amongst the strongest in the industry. And Forbes ranked Lowe's #6 on their list relative to that. And our research tells us that when customers show up in our environment, specifically during this COVID-19 crisis and they feel safe and they feel well taken care of, they come back. And when you look at our first half results, it demonstrates that customers are coming back over and over again. And so we believe that of all the things within our control, if we can execute these at a continual high level, then the rest will take care of itself." Q1 Q2 TGT Ticket 12.5% 18.8% More bundeling Traffic -1.5% 4.6% More visits WMT-US Ticket 16.5% 27.1% Much more bundeling Traffic -5.6% -14.0% Less visits HD Ticket 11.1% 10.1% Same amount of bundeling Traffic -4.0% 12.3% Much more visits LOW Ticket 9.6% 11.6% Same amount of bundeling Traffic 1.6% 20.3% Much much more visits 8.26.20 3
- 4. 1. Lowe's inventory position at quarter-end is astounding given that they were hit by +42% sales growth in May, followed by +34% in June, and ending at +28% in July. To keep the shelves stocked with this rate on consistently red-hot sales took herculean efforts and is even more impressive given Lowe's newer management team, newer merchant teams, and an out-of-date (or recently upgraded) business intelligence systems. If there was ever to be a quarter to test for executional miss-steps, Q2 was it; miss-steps were not apparent from our point of view. 2. Adding to the accolades on management's execution, Lowe's ended with more inventory than Home Depot despite Depot's higher starting level and larger sales. This in turn, should allow Lowe's to again outperform in FQ3; moreover, in-stocks and Pro job-lot- quantities are a key strategy for attracting and retaining Pro customers. Which they did. During our visits to stores during the quarter, we were shocked at the frequent out-of-stocks at Home Depot stores. In seasonal and lawn & garden, they were just sold through. 3. Logistics has been another competitive deficiency of Lowe's. Over the next 18 months, Lowe's is to open 50 cross-dock delivery terminals, 7 bulk DCs, and 4 e-commerce fulfillment centers. These investments are going to allow for faster deliveries, higher inventory turns, better in-stocks, more selection, higher customer satisfaction levels, more customer loyalty, and more sales. 4. CEO Ellison frequently discusses getting Lowe's back to "retail fundamentals." By nearly every metric and KPI, one can observe that Lowe's is solidly on that track. Allrightsreserved,InflectionCapitalManagement,LLC Lowe's Opportunity with Inventory: A Massive Win Management Comments: "In closing, I'd be remiss if I didn't again express our appreciation for our vendor partners, who again went above and beyond to help keep our shelves stocked despite facing unprecedented demand and their own operational challenges related to COVID-19. Across building products, home decor and our hard lines businesses, there were a number of standout performances again this quarter." April July April July Lowe's Inventory $15,026 $13,730 $14,283 $13,831 YoY % Ch -4.9% 0.7% Per Sq $71.96 $65.76 $68.73 $66.56 YoY % Ch -4.5% 1.2% Inventory Turns(annualized) 3.5 X 4.0 X 3.8 X 5.1 X Home Depot Inventory $15,495 $14,741 $14,989 $13,498 YoY % Ch -3.3% -8.4% Per Sq $65.11 $61.94 $62.98 $56.71 YoY % Ch -3.3% -8.4% Inventory Turns(annualized) 4.7 X 5.4 X 5.1 X 7.1 X 20019 2020 4
- 5. Homeownership Rates by Age of Householder YoY Ch 2018 3rd………....... 64.4 36.8 59.5 69.7 75.6 78.6 0.5 1.2 0.2 0.6 0.6 -0.3 4th……..…...... 64.8 36.5 61.1 70.1 75.5 78.8 0.6 0.5 2.2 0.6 0.2 -0.4 2019 1st…………....... 64.2 35.4 60.3 69.5 75.4 78.5 0.0 0.1 0.5 -0.5 0.0 0.0 2nd…….......... 64.1 36.4 59.4 70.1 74.8 78 -0.2 -0.1 -0.6 -0.5 -0.3 0.0 3rd………....... 64.8 37.5 60.3 70.1 75.1 78.9 0.4 0.7 0.8 0.4 -0.5 0.3 4th……..…...... 65.1 37.6 60.4 70.6 75.6 79.0 0.3 1.1 -0.7 0.5 0.1 0.2 2020 1st…………....... 65.3 37.3 61.5 70.3 76.3 78.7 1.1 1.9 1.2 0.8 0.9 0.2 2nd…….......... 67.9 40.6 64.3 72.2 77.4 80.4 3.8 4.2 4.9 2.1 2.6 2.4 Source: U.S. Census Bureau, Current Population Survey/ Housing Vacancy Survey, July 28, 2020. 65 years and over U.S. Under 35 years 35 to 44 years 45 to 54 years 55 to 64 years Year and Quarter 65 years and over Under 35 years 35 to 44 years 45 to 54 years 55 to 64 years U.S. How Changes in Consumer's Priorities May influence home improvement sales over the next five years. Comments: We have all seen the massive shift during Q2 of consumer's interest towards owning a home and investing in their home. As the table below shows, that trend started during Q1 and has since massively built (i.e. crises forward underlying trends vs. changing them). That inflection was most evident by those in the < 45-yrs of age cohort. This millennial cohort that we have all read about over the years of their forgoing home ownership in favor of student debt payments, urban high-rise living in concert with foreign vacations, primarily eating out, etc. has now inflected to nesting. Our prior work about this cohort's decisions on the place of live also pointed to the lack of entry-level homes for sale, amongst other reasons. Commentary from the publicly-traded homebuilders this Q2-reporting period (and in the press) was filled with comments about millennials moving in mass to the suburbs, the significant demand for homes that contained an office, another bedroom, and a big-big backyard, and the flight to non-coastal markets like Boise, Billings, Denver, and Salt Lake City. Moreover, July home orders for the builders were off the charts, conversion rates are compressing, and the builders need to quickly increase land buying and community counts to satisfy the surge in demand. Thus, COVID (and low mortgage rates) broke the jam in the housing market. A consequence of this cohort moving into the housing market is liquidity and the start of improving turnover across the price spectrum. The improvement in turnover will work to fuel increased confidence in new home construction, home upgrades, and more turn-over inspired home improvement spending. Thus, it's a major change. Is it sustainable? The two other large factors to homeownership are rates and incomes. We see these two having a positive correlation in the near-term, i.e. better COVID news will lead to higher job creation and confidence in one's income prospects which will in turn should prove to be bearish for 10-year Treasuries, thus, driving rates higher and lowering affordability. Another factor is demographics, and demographics are highly predicable. 5 Allrightsreserved,InflectionCapitalManagement,LLC
- 6. How Changes in Demographics May influence home improvement sales over the next five years. Comments: 1. Over our career we have observed that Wall Street and operating companies typically ignore important demographic trends. This is stupid because the changes are generally easy to anticipate as the changes in the teen and adult populations are already defined given that everyone is already born and is simply moving along in their ages and through various life-style windows. 2. When looking at the critical entry-level home buyer cohort, i.e. 30-44 years old. We can see is that a powerful number aged into the "home buyer life-style window" (4,273K) and didn't buy. This is now the tinder that COVID has ignited. Moreover, there is another powerful number also now entering the window over the next five years (4,205K) that will work to further wave the recently ignited tinder. Over the 2015-2025 period, this is 14% more people within the cohort. 3. In older life-style windows we can see that the "family-full cohort" has been in decline over the past then years and that that headwind will flatten. Moreover, the Boomers-cohort has been, well "booming." That will now moderate over the next five years, but not decline. We suspect that this will take some of the distortions out of the housing market that prioritized this cohort and allow more "equity" to be more broadly distributed. This is in sharp evidence in the homebuilder industry with it strongly pivoting to build entry-level houses. 2010 2015 2020 2025 Total (1) 304,279 316,167 332,638 344,236 Under 30 years 125,805 125,902 127,858 128,001 30 to 44 years of age 60,079 61,058 65,331 69,536 45 to 54 years 44,387 42,796 40,615 40,267 55 to 74 years 56,351 67,354 75,572 77,845 75 years and older 17,657 19,057 23,262 28,587 5-Year Changes 2010 2015 2020 2025 Under 30 years 97 1,956 143 30 to 44 years of age 979 4,273 4,205 45 to 54 years -1,591 -2,181 -348 55 to 74 years 11,003 8,218 2,273 75 years and older 1,400 4,205 5,325 Sources: 1) Projec ted 5-Year Age Groups and Sex Composition: Main Projec tions Series for the United States, 2017-2060. U.S. Census Bureau, Table-3 & U.S. Census Bureau, Current Population Surv ey, Annual Soc ial and Ec onomic Supplement, 2010 and 2015. Footnotes: Census Bureau Population Projections thousands Numbers 8.26.20 6 Allrightsreserved,InflectionCapitalManagement,LLC
- 7. 2010 2015 2020 2025 Total (1) 304,279 316,167 332,638 344,236 Under 30 years 125,805 125,902 127,858 128,001 30 to 44 years of age 60,079 61,058 65,331 69,536 45 to 54 years 44,387 42,796 40,615 40,267 55 to 74 years 56,351 67,354 75,572 77,845 75 years and older 17,657 19,057 23,262 28,587 5-Year Changes 2010 2015 2020 2025 Under 30 years 97 1,956 143 30 to 44 years of age 979 4,273 4,205 45 to 54 years -1,591 -2,181 -348 55 to 74 years 11,003 8,218 2,273 75 years and older 1,400 4,205 5,325 Household Model (2) Owner Occupied Homes 2010 2015 2019 2025 Under 30 years 4,752 4,207 4,534 4,480 30 to 44 years of age 18,260 16,340 17,408 19,887 45 to 54 years 17,365 15,469 14,688 14,899 55 to 74 years 26,094 29,572 32,098 33,863 75 years and older 8,988 9,425 10,592 13,436 Total 75,459 75,013 79,320 86,565 5-Year Changes 2010 2015 2019 2025 Under 30 years -545 327 -54 30 to 44 years of age -1,920 1,068 2,479 >2X lift 45 to 54 years -1,896 -781 211 absense of a drag 55 to 74 years 3,478 2,526 1,765 slower 75 years and older 437 1,167 2,844 >2X lift Total -446 4,307 7,245 Ownership Rate (2) 2010 2015 2019/ 20* 2025 Under 30 years 3.8% 3.3% 3.5% 3.5% 30 to 44 years of age 30.4% 26.8% 26.6% 28.6% 45 to 54 years 39.1% 36.1% 36.2% 37.0% 55 to 74 years 46.3% 43.9% 42.5% 43.5% 75 years and older 50.9% 49.5% 45.5% 47.0% Sources: 1) Projec ted 5-Year Age Groups and Sex Composition: Main Projec tions Series for the United States, 2017-2060. U.S. Census Bureau, Table-3 & U.S. Census Bureau, Current Population Surv ey, Annual Soc ial and Ec onomic Supplement, 2010 and 2015. 2) Sourc e: U.S. Census Bureau, Current Population Surv ey/Housing Vac anc y Surv ey 3) Home Improv ement Retail is 2019's CB MRTS report for NAICS # 444 Footnotes: table with row headers in column A and column headers in rows 3 through 4 (leading dots indicate sub-parts) Census Bureau Population Projections thousands Numbers How Owner-Occupied Housing May Grow Comments: 1. To the left we combine the two prior data tables, and by making assumptions on ownership levels by age-cohort we formulate a projection for owner-occupied housing numbers in the US. 2. We expect the biggest lifts in the ownership rate to be in the 30 - 44 age cohort over the next five years, and the >74 age cohort. We expect the 30 - 44 cohort to lift for the reasons just discussed. 3. We expect the >74 age cohort to lift because of their long-standing individualism and because of the COVID scares / scars which we believe will last a lifetime; Boomers are going to invest to age in place vs. willingly move to an old-age home. 4. Note all modeled cohorts are below the 2010-levels. That said, we are not making forecasts and adjustments for the two very large factors, interest rates and wage / job growth which will have influence on the eventual numbers. 7 Allrightsreserved,InflectionCapitalManagement,LLC
- 8. $-billion HI Industry and Mkt Share 2010 2015 2019 2025 Home Improv ement Retail (3) $261 $332 $385 $495 CAGR 4.9% 3.8% 4.3% per homeowner $3,453 $4,421 $4,848 $5,718 CAGR 5.1% 2.3% 2.8% Home Depot Domestic $61 $81 $101 $141 CAGR 5.9% 5.9% 5.7% M kt Share 23.2% 24.3% 26.4% 28.5% Lowe's Stores Domestic $49 $58 $68 $100 CAGR 3.7% 3.8% 6.7% M kt Share 18.7% 17.6% 17.6% 20.2% Others $151 $193 $215 $254 CAGR 5.0% 2.8% 2.8% M kt Share 58.0% 58.1% 56.0% 51.3% Notes: HD and LOW sales are relative to their FY. Category retail sales (444) are CY. HD and LOW domestic sales are ICM estimates. Sources: 3) Home Improv ement Retail is 2019's CB MRTS report for NAICS # 444 How Owner-Occupied Housing Grow May Drive HI Spending Comments: 1. Finally, we forecast HI retail sales through 2025 by taking the above assumptions for US owner-occupied house in conjunction with our assumptions of the growth in home improvement (HI) spending per home. 2. We expect the growth in HI retail per occupied home to be at a slightly faster rate than during the 2015-2019 period given the shifting consumer priories influenced by COVID; we believe those to be durable. 3. We expect Depot's market share gains between 2019 - 2025 to be roughly at the same level as the 2015 - 2019 window given Depot's enormous resources, impeccable execution, brand strength, increased investments, etc. 4. We expect Lowe's gains between 2019 - 2025 to be significant for all reasons that we have covered earlier in this report and HERE. 5. While we expect that "Remainder" to loose share between 2019- 2025, but that Remainder will still growth. Growth should allow for a financially healthy industry and rational competitive environment without significant disruptive promotions or competitive actions. 8.26.20 8 Allrightsreserved,InflectionCapitalManagement,LLC
- 9. Lowe's Earning and Stock Price in 4 Years Comments: 1. Assuming that the S&P 500 trades at 16X forward earnings at the end of 2024, and that LOW / HD still retain a 20% premium to the S&P 500 (for their stability, durability, and defensiveness from disruption), then 16 x 120% x $18.02 = $346, or a +19% IRR from today's levels ($169.86 on 8.26.20). 2. This estimate uses the $100B in domestic revenue shown in the prior page and $5.7B for Lowe's Canadian business. However, we would expect the company to exceed the $100B for the reasons discussed HERE and that the Canadian business to be spun- off to shareholders by 2025. 3. This estimate assumes a 14.4% OM (vs. HD's >14% target) with gains coming from management's previously articulated cost savings, new COVID-inspired cost and productivity savings, and sales leverage. INCOME STATEMENT 2019 2020e 2021e 2022e 2023e 2024e 2025e Total Revenues 72,148 86,274 84,565 91,034 95,693 100,592 105,744 YoY % Growth 1.2% 20% -2% 8% 5% 5% 5% Operating Profit 6,511 10,837 10,371 12,336 13,254 14,227 15,260 Interest Inc ome/(Expense) 691 864 820 820 820 820 820 PBT 5,820 9,973 9,551 11,516 12,434 13,407 14,440 Incom e Tax 1,399 2,454 2,292 2,764 2,984 3,218 3,466 Net Income-PF 4,421 7,519 7,259 8,752 9,450 10,190 10,974 Diluted EPS -- PF $5.68 $10.06 $10.05 $12.59 $14.18 $15.98 $18.02 Weighted Avg. Diluted Shares Outstanding (m n)778 747 722 695 666 638 609 Operating Margin 9.0% 12.6% 12.3% 13.6% 13.9% 14.1% 14.4% 8.26.20 9 Allrightsreserved,InflectionCapitalManagement,LLC