net lease research report q1 2018 | The Boulder Group
•
1 like•192 views

This report summarizes key metrics and trends in the net lease market in Q1 2018: - Cap rates remained stable for retail (6.1%) and office (7%), and increased slightly for industrial (7.29%). - Transaction volume in 2017 was similar to 2016 at $54 billion. Demand remains high for e-commerce resistant and experiential retail tenants. - The market remains bifurcated between high and lower quality properties. New construction supply is concentrated in dollar stores, restaurants, and medical properties.

Recommended
Recommended
More Related Content
What's hot
What's hot (20)
Similar to net lease research report q1 2018 | The Boulder Group
Similar to net lease research report q1 2018 | The Boulder Group (19)
More from The Boulder Group
More from The Boulder Group (20)
Recently uploaded
Recently uploaded (20)
net lease research report q1 2018 | The Boulder Group
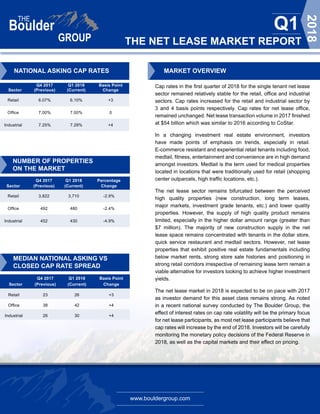
- 1. www.bouldergroup.com THE NET LEASE MARKET REPORT Q1 2018 Q4 2017 Q1 2018 Basis Point Sector (Previous) (Current) Change Retail 6.07% 6.10% +3 Office 7.00% 7.00% 0 Industrial 7.25% 7.29% +4 NUMBER OF PROPERTIES ON THE MARKET Q4 2017 Q1 2018 Percentage Sector (Previous) (Current) Change Retail 3,822 3,710 -2.9% Office 492 480 -2.4% Industrial 452 430 -4.9% MEDIAN NATIONAL ASKING VS CLOSED CAP RATE SPREAD MARKET OVERVIEW Cap rates in the first quarter of 2018 for the single tenant net lease sector remained relatively stable for the retail, office and industrial sectors. Cap rates increased for the retail and industrial sector by 3 and 4 basis points respectively. Cap rates for net lease office, remained unchanged. Net lease transaction volume in 2017 finished at $54 billion which was similar to 2016 according to CoStar. In a changing investment real estate environment, investors have made points of emphasis on trends, especially in retail. E-commerce resistant and experiential retail tenants including food, medtail, fitness, entertainment and convenience are in high demand amongst investors. Medtail is the term used for medical properties located in locations that were traditionally used for retail (shopping center outparcels, high traffic locations, etc.). The net lease sector remains bifurcated between the perceived high quality properties (new construction, long term leases, major markets, investment grade tenants, etc.) and lower quality properties. However, the supply of high quality product remains limited, especially in the higher dollar amount range (greater than $7 million). The majority of new construction supply in the net lease space remains concentrated with tenants in the dollar store, quick service restaurant and medtail sectors. However, net lease properties that exhibit positive real estate fundamentals including below market rents, strong store sale histories and positioning in strong retail corridors irrespective of remaining lease term remain a viable alternative for investors looking to achieve higher investment yields. The net lease market in 2018 is expected to be on pace with 2017 as investor demand for this asset class remains strong. As noted in a recent national survey conducted by The Boulder Group, the effect of interest rates on cap rate volatility will be the primary focus for net lease participants, as most net lease participants believe that cap rates will increase by the end of 2018. Investors will be carefully monitoring the monetary policy decisions of the Federal Reserve in 2018, as well as the capital markets and their effect on pricing. Q4 2017 Q1 2018 Basis Point Sector (Previous) (Current) Change Retail 23 26 +3 Office 38 42 +4 Industrial 26 30 +4 NATIONAL ASKING CAP RATES
- 2. www.bouldergroup.com THE NET LEASE MARKET REPORT Q1 2018 SELECTED SINGLE TENANT SALES COMPARABLES Sale Date Sector Tenant City State Price Price Per SF Cap Rate Lease Term Remaining Feb-18 Office Amazon Herndon VA $226,000,000 $560 5.46% 11 Years Mar-18 Industrial Quaker Sales & Distribution (Pepsi) Lakeland FL $59,600,000 $98 4.85% 10 Years Jan-18 Office Daimler Fort Mill SC $40,000,000 $266 5.91% 11 Years Jan-18 Office Go Daddy Gilbert AZ $39,000,000 $216 6.67% 10 Years Feb-18 Industrial FedEx Atlanta GA $32,250,000 $110 5.56% 5 Years Feb-18 Office PayPal Scottsdale AZ $30,500,000 $330 5.95% 10 Years Feb-18 Office Four Winds Interactive Denver CO $17,100,000 $329 7.75% 13 Years Feb-18 Retail Walmart Youngstown OH $13,575,000 $88 6.80% 4 Years Feb-18 Retail Walmart Neighborhood Market Kansas City OH $12,617,500 $307 5.75% 16 Years Jan-18 Retail AMC Springfield MO $11,138,000 $230 7.40% 17 Years Feb-18 Retail Walgreens Ewing NJ $10,645,000 $725 5.33% 20 Years Feb-18 Retail CVS Tujunga CA $10,400,000 $705 4.82% 10 Years Mar-18 Retail Walgreens Port Saint Lucie FL $8,400,000 $619 5.55% 17 Years Feb-18 Retail CVS Lawton OK $6,493,000 $481 5.40% 23 Years Mar-18 Retail Wawa (GL) Deerfield Beach FL $6,125,000 -- 4.57% 20 Years Jan-18 Retail Goodwill Fort Myers FL $6,077,000 $304 6.50% 15 Years Jan-18 Industrial Effox, INC West Chester OH $5,300,000 $55 8.20% 10 Years NET LEASE CAP RATE TRENDS Retail Office Industrial 5.75% 6.25% 6.75% 7.25% 7.75% 8.25% 8.75% Q3 2004 Q1 2005 Q3 2005 Q1 2006 Q3 2006 Q1 2007 Q3 2007 Q1 2008 Q3 2008 Q1 2009 Q3 2009 Q1 2010 Q3 2010 Q1 2011 Q3 2011 Q1 2012 Q3 2012 Q1 2013 Q3 2013 Q1 2014 Q3 2014 Q1 2015 Q3 2015 Q1 2016 Q3 2016 Q1 2017 Q3 2017 Q1 2018 Q1 2004
- 3. www.bouldergroup.com THE NET LEASE MARKET REPORT Q1 2018 © 2018. The Boulder Group. Information herein has been obtained from databases owned and maintained by The Boulder Group as well as third party sources. We have not verified the information and we make no guarantee, warranty or representation about it. This information is provided for general illustrative purposes and not for any specific recommendation or purpose nor under any circumstances shall any of the above information be deemed legal advice or counsel. Reliance on this information is at the risk of the reader and The Boulder Group expressly disclaims any liability arising from the use of such information. This information is designed exclusively for use by The Boulder Group clients and cannot be reproduced, retransmitted or distributed without the express written consent of The Boulder Group. FOR MORE INFORMATION John Feeney | Senior Vice President john@bouldergroup.com Asher Wenig | Vice President asher@bouldergroup.com Scott Harris | Senior Analyst scott@bouldergroup.com Jeff Weil | Analyst jeff@bouldergroup.com Tenant 2012-2018 2005-2011 2000-2005 Pre 2000 7-Eleven 4.83% 5.25% 5.85% 6.25% Advance Auto Parts 6.05% 6.50% 7.35% 7.75% AutoZone 5.25% 5.70% 6.30% 7.00% Bank of America N/A 5.00% 5.90% 6.35% Chase Bank N/A 4.70% 5.05% 5.75% CVS Pharmacy 5.00% 5.85% 6.00% 7.10% DaVita Dialysis Center 5.65% 6.20% 6.55% 7.00% Dollar General 6.90% 7.60% 8.00% 8.35% Family Dollar 7.30% 7.65% 8.15% 8.70% FedEx 6.00% 6.70% 7.00% 7.65% Fresenius 5.85% 6.50% 6.75% 7.60% McDonald's (GL) 4.00% 4.25% 4.70% 5.00% O'Reilly Auto Parts 5.65% 6.00% 6.15% 6.93% Rite Aid N/A 7.00% 7.75% 8.45% Starbucks 5.00% 5.40% 5.90% 6.40% Walgreens 5.40% 5.85% 6.70% 7.20% MEDIAN ASKING CAP RATES BY YEAR BUILT CONTRIBUTORS Randy Blankstein | President randy@bouldergroup.com Jimmy Goodman | Partner jimmy@bouldergroup.com AUTHOR