In Sharjah ௵(+971)558539980 *_௵abortion pills now available.
How T-Mobile & Sprint will win Deal Approval
1. All rights reserved,InflectionCapital Management, LLC
Thesis:
Should T-Mobile merge with Sprint and their combined 5G service launch as we describe, the stock
should generate nearly an 80% annualized return through 2020.
Key Points:
1) We think that the DOJ/FCC will approve S+TMUS with conditions in the 1H’19 because the
DOJ/FCC will admit that they failed consumers in broadband and paid-TV competition.
2) The regulatory approval conditions will include: 1) the commitment to a specified 5G wireless
nationwide service, 2) the commitment to a fixed wireless service broadband alternative in
many single-provider markets, 3) a commitment to a 5G price cap that references the 4G
price, and 4) a limit to wireless price inflation in prepaid and potentially divestiture.
3) Excitement for 5G wireless will build in the 1H’19. We expect TMUS to launch in 30 markets with
a $78/mo price single-line Unlimited price point for 4G+5G.
4) As Wall Street gets comfortable with TMUS’ 5G momentum including a step-up in postpaid
share gains in the 2H’19, we expect substantial favorableconsensus revisions. Our 2020 EBITDA
estimate for TMUS is 14% higher than consensus.
5) We expect TMUS EV/EBITDA NTM valuation multiple to expand from6.5X to 8.5X based upon
faster top- and bottom-line growth, larger sharegains, and new TAMS.
Stating the obvious:
There are no sound 80% projected annualized returns for large cap stocks. Consequently, you are
missing something basic and just being stupid.
ICM’s Response:
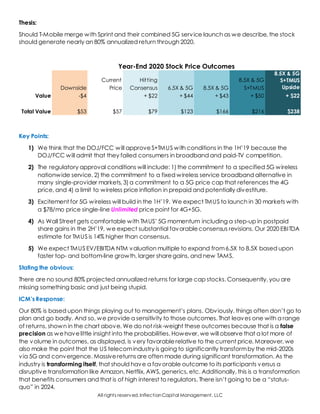
Our 80% is based upon things playing out to management’s plans. Obviously, things often don’t go to
plan and go badly. And so, we provide a sensitivity to those outcomes. That leaves one with a range
of returns, shown in the chart above. We do not risk-weight these outcomes because that is a false
precision as wehavelittle insight into the probabilities. However, we will observe that a lot more of
the volume in outcomes, as displayed, is very favorablerelative to the current price. Moreover, we
also make the point that the US telecomindustry is going to significantly transformby the mid-2020s
via 5G and convergence. Massivereturns are often made during significant transformation. As the
industry is transforming itself, that should have a favorable outcome to its participants versus a
disruptive transformation like Amazon, Netflix, AWS, generics, etc. Additionally, this is a transformation
that benefits consumers and that is of high interest to regulators. There isn’t going to be a “status-
quo” in 2024.
Year-End 2020 Stock Price Outcomes
Downside
Current
Price
Hitting
Consensus 6.5X & 5G 8.5X & 5G
8.5X & 5G
S+TMUS
8.5X & 5G
S+TMUS
Upside
Value -$4 + $22 + $44 + $43 + $50 + $22
Total Value $53 $57 $79 $123 $166 $216 $238
2. All rights reserved,InflectionCapital Management, LLC
Final point before weget into the details. People are highly dependent upon their phones; it’s their
lifeline to family, friends, work, and the community. They are using that device2-3 hours per day. It’s
like a “fifth appendage.” The utility of the appendage improves every year. 5G is going to be a
massive upgrade to that appendage (just like Steve Austin’s armin the Six Million Dollar Man). It will
unite the device and service with the cloud. The change is going to be as demonstrable as going
froma 32-bit desktop PC to the cloud, fromdial-up to 100 Gbps, fromlandline to mobile. The carriers
are going to pour $200B into upgrading the network. They are doing so because the ROI fromthis
investment is based upon a greatly expanded TAM. T-Mobile’s penetration of that larger TAM is not in
Wall Street estimates. If the reader believes that the TAM expansion is going to be zero and that T-
Mobile’s management won’t execute, then read no more. This piece isn’t going to convince any flat-
earth fanatic that the earth is spherical.
Below we address each of the five primary fears about buying TMUS here and now:
Fear-1: The wireless industry is mature and without pricing power. Eventually, margins and FCF are
going to decline. Cable entering the wireless market is just going to make matters worse.
Service revenue (as currentlydefined) for the industryis mature. That isn’t debated. Service revenue has been
down quarterlysince 2015. The move to “unlimited” undermined the industry’s abilityto get paid transparentlyfor
more data usage.
It is also not debatedthat the industryis without pricing power (for now). This is seen in the CPI index, especiallyin
2017 which Verizonand AT&T went unlimited.Pricing has now flattenedout and the industryparticipants generally
suggest that it will staythat way (i.e.not another decline).
However,the flipside of these falling prices is improving consumer satisfactionwiththe industryand the value
consumers get from the industry. This is shown in the table below from ACSI. In 2017,the wireless industry
acceleratedinits satisfactionimprovement.All other categories materiallydecelerated. Consumer affinityscores
(Net Promotor Scores)for the wireless companies are also on the rise and substantiallyabove cable and satellite
companies. These statistics suggest that the wireless industryhas “earned the right to price” when it brings
substantial new features to market. 5G is to allow for 15X-100X higher data speeds, better coverage,longer battery
life,push-to-talk,etc.(For reference,the 3G to 4G speed step was 3X.) 15X is a substantiallybetter product,like 6
seconds for a movie download. We have seen no evidence that the consumer will not be willing to pay more for
that product. For the industryto get a favorable ROI (11%) on its 5G investment, it willneed to price 5G at a
$7.50/mo premium to 4G (see 5G sectionbelow). We have seen no evidence that the industryis going to accept a
lower ROI. Consequently, +$7.50 is our base case assumptionfor 5G. Consumer demand for more data and the
umbrella of 5G should also foster +LSD 4Gpricing.
Series Title:
Area:
Item:
Year Jan Feb Mar Apr May Jun Jul Aug Sep Oct Nov Dec
2011 60.572 60.437 60.351 60.353 60.341 60.340 59.902 59.889 59.860 59.895 59.895 59.931
2012 59.919 59.919 59.935 59.953 60.008 60.005 59.582 59.138 59.294 59.492 59.445 59.447
2013 59.357 59.202 59.139 58.577 58.577 58.566 58.430 58.363 58.332 58.331 58.276 58.249
2014 58.137 57.852 57.775 57.872 57.709 57.677 57.677 57.653 57.599 56.507 56.179 55.894
2015 55.614 55.406 54.975 54.902 54.537 54.555 54.711 55.194 55.388 55.514 55.908 55.883
2016 55.850 55.267 55.280 55.294 54.967 54.989 54.848 54.786 54.033 53.739 53.578 53.522
2017 53.435 52.679 49.002 48.153 48.118 47.735 47.580 47.550 47.730 47.944 48.090 48.066
2018 47.972 47.712 47.822 47.835
2016 0% 0% 1% 1% 1% 1% 0% -1% -2% -3% -4% -4%
2017 -4% -5% -11% -13% -12% -13% -13% -13% -12% -11% -10% -10%
2018 -10% -9% -2% -1%
Wireless telephone services in U.S. city
average, all urban consumers, not seasonallyU.S. city average
Wireless telephone services
CPI-All Urban Consumers (Current Series)
3. All rights reserved,InflectionCapital Management, LLC
Margins
Are there costs rising inthe business that are outgrowing revenue resulting inmargin compression? There are some
transitoryfactors,but we can find no evidence of structural marginerosion,outside of the negative effect from the
move to Unlimited. Cost to serve remains relativelystable as shown in Verizon’s results inthe table below. There is
likelysome expense inflationfor marketing and retail,but those do not show through. (We use Verizon’s report
because AT&T doesn’t disclose the numbers and T-Mobile’s and Sprint’s numbers have noise.)
The second table shown below is an aggregationof Verizonand AT&T wireless results.We focus on the underlying
service marginby stripping-awaythe impact of equipment and adding back the impact to revenue and EBIT from
their 1-time moves to Unlimited.This analysis shows that margins have climbedeach of the past five quarters
excluding Unlimited. Consequently, for one to argue that industrymargins are going down from here, one needs to
argue that pricing is going lower.We argue the contraryabove,i.e. that pricing is going to rise.
Verizon Communications Inc.
2018
Unaudited 1Q 2Q 3Q 4Q 1Q 2Q 3Q 4Q 1Q
Operating Expenses
Cost of services 1,942 1,984 2,006 2,056 1,958 1,997 2,052 1,983 2,215
Total Pre- & Postpaid Connections 113 113 114 114 114 115 115 116 116
(millions)
Monthly Cost per Connection 5.75$ 5.84$ 5.88$ 6.00$ 5.73$ 5.81$ 5.93$ 5.69$ 6.35$
YoY % Ch 0% -1% 1% -5% -1%
Note: Q1'18 costs are reported under a new accounting treatment. We show the YoY change normalized for this.
Wireless - Selected Financial
2016 2017
Verizon & AT&T's Wireless Results
2016 2017 2018
1Q 2Q 3Q 4Q 1Q 2Q 3Q 4Q 1Q
Non-Equipment Revenue 32,800$ 32,856$ 32,879$ 32,288$ 31,582$ 31,455$ 31,703$ 31,578$ 31,078$
Non-Equipment EBIT 14,930 14,979 14,925 13,662 13,999 13,945 13,877 12,814 13,907
Margin 45.5% 45.6% 45.4% 42.3% 44.3% 44.3% 43.8% 40.6% 44.7%
Unlimited 's impact on Revenue & EBIT 1,476$ 1,479$ 1,480$ 1,453$ 1,421$
Adjusted Revenue 32,800$ 32,856$ 32,879$ 32,288$ 33,058$ 32,934$ 33,183$ 33,031$ 32,499$
Adjusted EBIT 14,930 14,979 14,925 13,662 15,475 15,424 15,356 14,267 15,328
Margin 45.5% 45.6% 45.4% 42.3% 46.8% 46.8% 46.3% 43.2% 47.2%
YoY Change 129 bps 124 bps 89 bps 88 bps 35 bps
4. All rights reserved,InflectionCapital Management, LLC
Cable’s Entrance
Comcast has enteredthe market, bundling wireless along withtheir other services.Charter is also expectedsoon.
Comcast/Charter’s primary objective is to reduce video/broadband churn and improve customer life-time-value
versus to earn significant profits from a wireless offering. Whenever a new entrant has a different economic
incentive fromthe incumbents,there is higher risk that the incumbents’and industry’s economics get disrupted.
Xfinity-Mobile’s offer is free voice andtiereddata at a price of $12-$45/mo (bundled withXfinity-TV & internet)per
line; the $45/mo- price is for unlimited.A subscriber can start at the lower price-tier for less monthlydata and if they
exceedtheir data limit choose to upgrade to a higher tier (and be charged a pro-rata amount). An industryprice
comparisonis shown below. Giventhat the Xfinityoffering is solelytargetedat its subscriber base,which are
families,its pricing plan is curious to us. Assuming 3.5 lines per HH, its service wouldcost ~$157/mo.which is higher
than Sprint,Verizon,and T-Mobile.Thus, their strategymust be to pick-off families that are interestedin saving
money and restraining their data usage. The researchthat we have seen suggests that this is a small part of the
market. User reviews of Xfinity-Mobile are generallyveryfavorable. But as currentlypriced,we don’t view Xfinity-
Mobile as disruptive to the market.
Xfinity-Mobile now has 577K service lines,including an added 196K in Q1. Giventhat Xfinity-Mobile is marketed only
to Xfinitycustomers,one needs to adjust for the footprint to compare to the other wireless operators. Xfinityhas
27.4m residential customers,meaning that they are only marketing to ~25% of US households. Consequently, their
comparative gross adds for Q1 were 784K (196K/.25). Shownin the table below is how Xfinity’s gross adds
compared to the incumbents. On a relative basis,theyare doing about half as well as Sprint whichwe would
characterize as “solid” giventhat Comcast is new to the market.
Price Comparison For Unlimited
5.25.18
Xfinity Sprint Verizon AT&T T-Mobile
1-Line $45 $60 $75 $80 $70
2-Lines $90 $100 $130 $150 $100
3-Lines $135 $130 $150 $170 $140
4-Lines $180 $160 $160 $190 $160
Unlimted Limit 20 GB 10 GB 22 GB 22 GB 50 GB
Bundling Free HBO Netflix
Required w/ 2 Lines Included
Postpaid Gross Additions
In thousands 1Q17 2Q17 3Q17 4Q17 1Q18
Postpaid
AT&T Mobility (connections) 2,563 2,446 2,577 2,914 2,413
Sprint (phone) 1,296 1,279 1,546 1,563 1,563
T-Mobile (phone) 1,920 1,854 2,032 2,086 1,722
Verizon (connections) 3,490 3,702 3,808 4,498 3,755
Charter (Grossed-up) 0 0
Xfinity (Grossed-up) 524 784
Total 9,269 9,281 9,963 11,584 10,237
5. All rights reserved,InflectionCapital Management, LLC
The Disconnects table shows that incumbent disconnects are below the level experiencedinQ1’16 despite the
intrusionof Xfinity. (Note the YoY decline reportedinQ1’18 is against a verydisruptive periodinQ1’17 when Verizon
and AT&T launched their own unlimitedplans.) The total WirelessSubscribers table shows that the entire industry
grew by 2.6% lines and +4% in post-paidphone subs. These examples suggest that the industry’s growthis able to
absorb Xfinity’s entry without disrupting the incumbents. Additionally,all the incumbents have recently stated that
their ARPUs should trendhigher and that they are pleased withthe trajectoryof their top-line.
Disconnects
Postpaid (thousands) 1Q16 2Q16 3Q16 4Q16 1Q17 2Q17 3Q17 4Q17 1Q18
AT&T Mobility 2,560 2,257 2,425 2,687 2,629 2,355 2,475 2,594 2,491
Sprint 1,596 1,448 1,419 1,578 1,661 1,573 1,541 1,526 1,364
T-Mobile 1,285 1,264 1,324 1,299 1,235 1,263 1,313 1,367 1,107
Verizon 3,098 3,051 3,398 3,611 3,797 3,088 3,205 3,324 3,495
Total 8,539 8,020 8,566 9,175 9,321 8,280 8,534 8,810 8,457
YoY Change % 9.2% 3.2% -0.4% -4.0% -9.3%
6. All rights reserved,InflectionCapital Management, LLC
Fear-2: AT&T is getting Time Warner and they will give away HBO to its wireless subscribers.
AT&T has been doing this since September 2017. As shown in the table below, the gross adds are worse during
Q4’17 and Q1’18 than when they didn’t offer HBO for free. Thus, free HBO appears to not be an effective strategy
for gaining more gross adds.
Fear-3: The 5G build-out is going to cost TMUS more than it expects, resulting in a FCF shortfall and a
decline in its enterprise value, whacking equity ownershard.
Giventhat TMUS’management has provided a budget and plan, having such a fear is like being of the opinion
that management is incompetent inthese types of projections.There is no such basis for such an opinion, but if
that’s one’s view, we would expect that one to have no interest inTMUS as an investment.
Fear-4: The stock is in deal-limbo and that deal is not likely to gain regulatory approval, so why
bother? It’s dead money at best and a likely underperformer in a robust economy where earnings
and estimates are rising for the S&P 500.
This is the equivalent of saying, “I can foresee what President Trump will do and he never surprises me.” We
ourselves have no such ability.We have also observedthat since the 2H’16, the unexpected oftenhappens and
that the conventional wisdom is frequentlywrong. Should President Trump implode, explode,or just die one day,
then we would be more willing to embrace the conventional regulatoryopinions about the deal probability.Until
that implosion/explosion,we are going to be rational and acknowledge that we have no basis for judging what
chances a TMUS+Sprint merger has,or its timing.Based upon our conversations withsell-side analysts,most of Wall
Street thinks the deal doesn’t have a chance. The sell-off post the deal announcement also supports that view.
Consequently, there is no optionvalue in TMUS’ stock for deal approval or synergies. Saiddifferently,that very
valuable outcome/option($55-$95/share)is currentlybeing offeredfor $0.00. If the deal doesn’t happen, the
optioninvestor doesn’t loose capital.If the deal does, they quickly make a lot.We like these situations.If you don’t,
go chase earnings momentum and revisions elsewhere.Also, would you please tell us if President Trump is going to
be re-electedin2020?
Fear-5: It’s too early to play 5G. Consumer adoption isn’t really going to start until 2020-2021 and so
we aren’t going to see strong 5G use cases or applications until 2021-2022. Thus, there are no real 5G
catalysts in 2018-2019.
This is a common naysayer complaint. If you believe our modeling, the end-value is there.Investors are going to
accrue that value.An investor couldbe there for the entire journey, or just the front, middle or rear. If the accrued
value potential is attractive,whycomplicate it and risk it,versus putting the time understanding and
dimensionalizing the end-value.If you put the opportunityaside, you are likelyto loose sight of the path and before
you turn your sight back on it,TMUS will be moving and you will have “missedit.” If the opportunityis as large as we
model, Wall Street is likelyto view it as a “sky-high opportunity” which typicallyresults inmaterial multiple expansion.
That higher valuationmultiple willmake a “miss-er” say, “Well I’mnot going to chase and buy at these levels.I’ll
wait for it to come back in.” They seldom do. Catching S-curve opportunities inthe front-endis where most of the
money is made. In the Catalyst Calendar sectionbelow,we project whenmaterial data points are likelyto appear.
In creating that section,it was clear to us that the catalysts are quicklyapproaching. Moreover,there are too many
events going on in the industryfor a generalist investor to keep track of.If you are a TMT specialist,totallyfocused
on 5G, then “God bless you.” If you are a generalist,like the end-point and our arguments, just make your life easier
by buying now. Then spend your time affirming and confirming that the industry and TMUS are traveling to our
projected end-points.
Volumes in thousands
3/31/16 6/30/16 9/30/16 12/31/16 3/31/17 6/30/17 9/30/17 12/31/17 3/31/18
Wireless Subscribers and Connections
Postpaid 65,739 65,772 65,767 66,100 65,692 65,570 65,388 65,683 65,489
Postpaid Net Adds 15 115 60 424 (282) (28) (46) 371 (64)
Postpaid Phone Churn 0.96% 0.84% 0.90% 0.98% 0.90% 0.79% 0.84% 0.89% 0.84%
Estimated Consumer Postpaid Disconnects 1,911 1,671 1,792 1,953 1,801 1,569 1,666 1,761 1,669
Estimated Gross Adds 1,926 2,377 2,132 1,605
AT&T Consumer Mobility
Three Months Ended
7. All rights reserved,InflectionCapital Management, LLC
In the above section,we review the five primaryfears or push-backs to buying TMUS today and at these levels. We argue
that these fears draw too much from the past, are reliant onthe unlikely scenario that T-Mobile management’s is
incompetent,and miss-caste the odds of outcomes.We acknowledge that the wireless industryand 5G are incredibly
complicatedand that the 5G transitionincreases uncertaintyas to the outcomes.However,all of this is what creates the
hugely favorable reward-to-risk at TMUS of $212 to $52. This is a potential “career making” opportunityof an investment.
TMUS’ Stand-alone 5G Plan
T-Mobile expects to have 30 cities live with5Gin 2019 and be nationwide before 2020.First adopters will needa
5G/4G phone, have to accept the partial 5G coverage and pass on the 5G battery-life savings.Giventhat these
phones will work withboth networks,that will allow a more secure QOS should there be initial 5Gservice issues.Such
a strategywill emboldenearlyadopters in 1H’19. Giventhat the launch cities are large metros like NY, LA, & LV,one
should expect that the press and Wall Street will quicklybe writing,analyzing, and valuing the service.Thus, the Q1
citylaunch is going to be a material catalyst.
T-Mobile is using its new 600 MHz spectrum and its millimeter wave (mmW)spectrum (30-300 GHz)for its 5G network.
The 600 spectrumis unencumbered by other uses (i.e. it’s not taking capacity froma network currentlyin use) and
it’s nationwide. (A good summary of the 600 MHz is attached below.) The more capital-intensive,higher capacity
mmW is for major metros where T-Mobile is now installing equipment.
Source:https://www.rcrwireless.com/20160406/analyst-angle/analyst-angle-600-mhz-spectrum-will-good-will-not-tag9
By Iain Gillott, President and Founder,iGR on APRIL 6, 2016
The 600 MHz auction is importantfor several reasons,notleastof which is that this is likely to be the lastauction in the U.S.
for some time and certainlythe last low band auction.The next auction will likely be for high band spectrum for “5G” services,
such as the 3.5 GHz band.Note that no such auctions are scheduled and no spectrum has been finalized;itis therefore likely
to be years before the next auctions.Chances to acquire licensed spectrum do notcome along very often, and for this reason,
operators usuallyjump atthe chance to acquire it (lastyear’s AWS-3 auctions being a good example).
Obviously, at this pointwe have no idea which operators will be successful acquiring spectrum,how much they will have to
pay or which regions theywill get licenses for.The only certainty is that those not participating (notablySprint) will not win
anything. You have to play to win.
So a little bit of physics.The higher the frequency of the radio signal,the less distance itcan travel through the air. Conversely,
the lower the frequency, the further it goes.This also applies to buildings,windows,trees,etc.; lower frequency signals g o
through more stuff. As an example,think aboutyour favorite radio station (mine is 90.5 MHz). You can more than likely get
that station miles from the transmitter,inside a building or in an underground garage.Now compare thatto your Wi -Fi at home
or in the office that is either 2.4 GHz or 5 GHz. Your Wi-Fi probablygoes a few hundred yards at best.(In our case,it barely
goes outside the house due to the type of windows we have.)
For small cells,mobile operators generallylike higher frequencies because itis easier to control the propagation and keep the
cell “small.” More small cells over a given area means more capacitythan a single cell.So when an operator needs to
increase the capacity in a given area, they usuallywill firstadd sectors to the macrocells and then try and put in small ce lls of
one type or another.
The original cellular systems in the U.S. used 850 MHz spectrum.LTE was originallylaunched with 700 MHz spectrum.
(AT&T, Verizon Wireless and T-Mobile all have 700 MHz bands in use.) These lower bands are greatfor covering wide areas
with signals and they will generallygo into buildings well.But,the fact the signals propagate well also means theyare harder
to control; deploying small cells with 700 MHz is very difficultand is the reason mostoperators are using 1.9 GHz or 1.7/2.1
GHz bands for this.Sprint uses its 2.5 GHz band.
Consider a macrocell using the 700 MHz band.To cover the same area with 1.9 GHz cells takes about2.5 cells.At 2.5 GHz,
about3.7 cells are required to cover the same area.This means 3.7 more infrastructure,towers/locations,etc. And of course ,
3.7-times as much capacityif the same amountofspectrum is used.
600 MHz is likely to need about0.8 cells to cover the same area as a 700 MHz cell. So 600 MHz will be excellent for providin g
coverage over a given area. And, as we said,the 600 MHz signal is likelyto penetrate mostbuildings – greatfor indoor
coverage. So providing mobile video over a given area or in-building will suit600 MHz well.
But, 600 MHz will not be good for small cells,as operators need higher bands for this.So 600 MHz will not enable the
operators to increase the capacity densityof their networks.
Ideally, an operator will have a selection oflow band (600 MHz, 700 MHz and 850 MHz) spectrum to provide wide coverage
and in-building coverage together with higher bands (1.9 GHz, 1.7/2.1 GHz, etc.) to provide capacity at given locations with
small cells,including in-building distributed antenna systems.The trick is in deploying the bands efficientlyand economicallyto
meetthe marketneeds.
Much has been said about5G networks being used to provide higher bandwidth and network speeds and this will take more
small cells.So 600 MHz should notbe thoughtof as “5G” spectrum – it is not. It will be used for LTE-Advanced networks (and
subsequentreleases),while the new 5G IMT-2020 networks will likelyuse higher bands,such as 3.5 GHz. But, 600 MHz still
8. All rights reserved,InflectionCapital Management, LLC
has value – all licensed spectrum has value.The mobile operators should never turn down the opportunity to acquire new
spectrum.600 MHz will be great for providing bandwidth over a wide area and in hard-to-reach places.
Map of TMUS 600 MHz spectrumacquired for $8B
9. All rights reserved,InflectionCapital Management, LLC
T-Mobile’s and Sprint’s Joint 5G Plan
The merger and 5G are intimatelyintertwined. The merger allows the companies to create a 5G network that is
significantlymore spectrum efficient,that significantlylowers the deployment expense, that allows a significantly
faster deployment speed, and that allows for a more compelling regulatoryapproval argument. Strategically,it
allows the companies to deploy nationwide significantly earlier thanAT&T and Verizon.It allows them to get a
significantlybetter service into the market before cable builds a significant wireless business. It allows themthe
credibilityto argue that they are bring 450 Mbps data speeds to the 50%of the US that has only one broadband
optionand that brings broadband to regions without it.
T-Mobile’s 600 MHz is going to be the nationwide 5G network. (600 MHz is a lower frequency, so long propagation
and strong penetration.) They will use the mmW spectrum(30 – 300 GHz) to builda high-capacity, high-speed
networks in urban geographies. mmW can penetrate rain, leaves,windows,and walls.But it can’t travel far,and
thus, its veryexpensive to deploygiventhe need for a lot of antennas.
QCOM Slide (May 2018)
Sprint’s mid-band (2.5 GHz) spectrum offers good propagation
characteristics andsupports wide-coverage with fewer base
stations.Sprint’s 2.5 is also the backbone for supporting their
current LTE service andso there is a challenge to redirecting
capacityfrom its 4G service for new 5G service. Consequently,
a merger allows Sprint’s 4G customers to obtaincoverage on T-
Mobile’s network and to transitionmore of the 2.5 faster to 5G.
This means getting to 450 Mps speeds for the entire customer
base by 2024.As a stand-alone,T-Mobile’s projected5G data
speeds are a slower 100-200 Mbps.
The merged companies will also deploy fixed-wireless
broadband at over 1Gps speeds as a cable replacement
(similar to Verizon’s and AT&T’s plans). The mergers also allows
them to do fixed-wireless onnationwide (market-by-market)
leveraging network assets that theyhave for wireless. (Both
companies have not discusseddoing so as stand-alones.)
Small mmW antennas
t hat need t o be
added all over in cit y
10. All rights reserved,InflectionCapital Management, LLC
FCC and DOJ Approval
As mentionedearlier,we believe that anapproval is viewed as extremelyunlikelyby Wall Street. The two reviewing
agencies are the FCC and the DOJ. We touchon the FCC and then the DOJ.
TMUS/S management is sticking to a 1H’19 approval based above three criteria:1)the FCC will rule that the US
“wireless market” is an antiquateddefinition and will transitionto define the market as “communicationand video
services,” 2)aggressivelydeploying 5G mobile broadband on a nationwide basis and that in turn fosters
technologyand business innovationwhichsolidifies the US as a 5G leader, and 3) the merger stimulates job
creation,investment,and GDP growth. Below, we address point-1.
Wall Street analyst primary reasonfor stating that the deal has a slimchance is that the FCC is quite proud of the US
wireless industry’s consumer value,service, and coverage.Those attributes are the consequence of the industry’s
high competitive intensity.US consumers generallyhave four choices for nationwide service. That intensityunleased
strong investment inLTEand 4G, unlimited service packaging,and little price inflation. As a consequence, analysts
argue that the FCC is unlikelyto disrupt an industry structure that achievedthat win.
TMUS/S is likelyto argue that while the FCC did secure a consumer-friendlywireless industry,it has been far less
successful instimulating competition andinnovationin broadband and paid-video services.TMUS/S will argue that
should the FCC define the market as to be inclusive of a combinationof these markets (complements of 5G) that
the merger will leadto a material increase in competition.It wouldaccelerate the deployment of 5G and bring
competitionto a cable broadband monopoly and a lethargic paid-TV industry. More specifically,TMUS/S will make
the case that the merger would moderate Comcast’s grip on its consumers. While video competitionand
innovation are unquestionablyimproving (YouTube-TV, Hulu-TV, Sling,etc.), no such improvement is happening in
broadband. Google Fiber has stopped. AT&T is laying new fiber only because they were forced to by the FCC to
get the DirecTV deal approved. AT&T and Verizonare building a fixedwireless broadband service,but that is going
to be market-by-market,avoiding regions that are remote or economicallystrained.
In exchange for granting a TMUS+S approval,FCC can make it conditional upon setting a price limit inflator to
wireless and a cap on the premium for 5G wireless service. They will also know that should TMUS+S be approved,
Verizonand AT&T will rapidly increase their 5G nationwide wireless plans.That would be pro-consumer, good for the
economy, and good for US industrial policy.
The prepaid market is a special considerationgiventhat Sprint andT-Mobile dominant this segment (54%combined
share), including brands such as MetroPCS,Boost Mobile,and VirginMobile.To win regulatoryapproval,TMUS/S
would likelyneed to spin-off or sell one or more of those brands. A sale would likelybe slightlydilutive to earnings.
The DOJ will relyon the Clayton Act.Section-7 of the Clayton Act is prettyclear and well understood. Section-7
states:If competition mightbe lessened in any line of commerce inany section of the country, the merger is
unlawful. That a merger might produce beneficial effects isnot a defense. We are not lawyers and do not have any
insight into TMUS/S’legal strategy.Consequently, we do not have a view onDOJ approval. However,we do ask
ourselves whyis TMUS/S willing to spend$100m+ on legal fees and change their capital returnstory(thus
undermining their stock price for 12 months+)if it is so clear cut? We trust this management and believe that they
think their DOJ approval chances are more than a zero.
AT&T & TWX Case
The Government argued that the merger would lessencompetitioninvideo programming and distribution.Thus, we
know that theyare concerned about competitioninthese markets.TMUS+S are going to bring new national
competitioninto the video market wholesaling Sling,Hulu-TV,or Google-TV over the merged company’s
distribution.This puts the Government in the uncomfortable positionof saying that they were concerned about
reduced competitioninthe case of AT&T+TWX,but not interestedin the increasedcompetitionthat TMUS+S would
bring to the consumer.
Also of note is that Judge Leon focused on AT&T+TWXbeing a vertical merger.TMUS+S is a horizontal merger which
limits drawing conclusions fromthe ruling to inform about the statutes onTMUS+S.
11. All rights reserved,InflectionCapital Management, LLC
5G Use Cases & TAMS
No, we are not going to opine about telemedicine,IoT,smart cities,autonomous vehicles andthe like. We are
going to focus on the two things that consumer care about--latencyand speed, especiallyin the context of the
cloud. This is because 5G is going to allow processing and storage to move to the cloud from the handset. This will
be particularlyacute in the mid-tier of the handset market as 5G will allow these phones will have significantlyless
commentary and cost.Offsetting some of that cost will be cloud service costs paidto the service provider bythe
subscriber.Saiddifferently,the economic rents for mobile service willmove to the provider fromthe handset and
componentry manufacturers. There will still be a $1K iPhone (and above) but the iPhone will likelylose the middle-
range of the market.5G should also be a large opportunityfor Google and Android as there will be significantly
more in cloud services.At the moment, there isn’t enough informationto sort out how the economic rent winnings
get split betweenthe service providers,Google,and others. However,it’s clear to us that the providers will be net
benefiters and iPhone and Samsung will be net losers.Notable is that we wrote “iPhone” and not “Apple.”
We didn’t write Apple, because 5G is likelyto yield Tony Stark Toys for Everyone. Apple is likelyto sell a lot of those
toys. There are going to be a lot of toys (watches,eyewear, etc.) because there isn’t going to be a lot of weight,
volume and componentry in those devices because the large memory and processing will be done in the cloud.
Those toys are going to have a service fee of $5-$10/mo along withother associated cloudusage costs. 5G devices
also have significantlylower power requirements (the current iWatchbattery-life goes up by 4,900x) which allows for
much smaller,lighter,and cheaper batteries. These toys’prices are going to be substantiallylower thanwhat these
heavier,clunker,slower toys currentlysell at. That is going to result insubstantiallyhigher adoptionof Tony Stark Toys.
12. All rights reserved,InflectionCapital Management, LLC
Return of Investment from the 5G Deployment
Below we model the industry’s returnfor its $200B 5Ginvestment (the various estimates center aroundthe $200B,but
those predate the TMUS+S news).In their announcement, TMUS+S saidthat theywould spend $40B. We have no
reason to be believe that AT&T’s or Verizon’s individual investments shouldnot be of similar magnitude;this sums to
$120B.We have no way to compare the plans of $40B to the assumptions behind the $200B. Consequently, we go
withthe more conservative $200B.
The minimum IRR that the industry should be willing to accept on such an investment is 11%.That is the plug that we
use to resolve what the industry’s assumptions are for the incremental profits fromthe 5-G investment.We model
out three:1) an incremental $7.50/mo service charge for 5G, 2) $5.00/mo in service revenue for Tony Stark Toys, and
3) fixed wireless residential broadbandfor $50/mo. The fixedwireless product is AT&T and Verizon’s 5G introduction
into the market. For this service,theylay fiber into high-prospect neighborhoods and then provide 1Gspeed
broadband to households via a 5G network antenna that works withina 2K foot radius. As such, it’s reallylike super-
charged Wi-Fi.There is no trenching unto homes and there is no truck-roll to deliver andinstall equipment.
Obviously,the cable incumbents are going to fight back. However,Comcasts reportedbroadband ARPU is $50/mo
and its unbundled price is $75+.Xfinitybroadband continues to be plagued by service outages,slow upload
speeds, and shared-line slowdowns. And so, Xfinitybroadband (as is)will likelybe an inferior product.What
happens if Comcast plays the price card and drops its price to $40/mo? If the wireless fixedwireless price is only
$40/mo. and keeping all the other assumptions consistent,the IRRfalls to 10.0%. That’s a significant reduction,but
not a thesis changer.
2019 2020 2021 2022 2023 2024 2025 2026 2027 2028 2029 2030
5G Mobile
Total Postpaid Wireless Subs 260,100 265,302 270,608 276,020 281,541 287,171 292,915 298,773 304,749 310,844 317,060 323,402
5G Subscribers 3,000 15,000 30,000 45,000 70,000 130,000 190,000 250,000 304,749 310,844 317,060 323,402
Penetration 1.2% 5.7% 11.1% 16.3% 24.9% 45.3% 64.9% 83.7% 100.0% 100.0% 100.0% 100.0%
ARPU lift $7.50 $7.65 $7.80 $7.96 $8.12 $8.28 $8.45 $8.62 $8.79 $8.96 $9.14 $9.33
Revenue $135 $826 $2,107 $3,582 $5,602 $9,937 $16,217 $22,744 $29,249 $33,106 $34,444 $35,835
NOPAT $85 $522 $1,332 $2,264 $3,540 $6,280 $10,249 $14,374 $18,485 $20,923 $21,768 $22,648
5G Wireless Accessories
Penetration of 5G Subs 50.0% 50.0% 50.0% 50.0% 50.0% 50.0% 50.0% 50.0% 50.0% 50.0% 50.0% 50.0%
5G Subscribers 1,500 7,500 15,000 22,500 35,000 65,000 95,000 125,000 152,374 155,422 158,530 161,701
ARPU lift $5.00 $5.25 $5.51 $5.79 $6.08 $6.38 $6.70 $7.04 $7.39 $7.76 $8.14 $8.55
Revenue $45 $284 $744 $1,302 $2,097 $3,829 $6,432 $9,287 $12,294 $14,325 $15,342 $16,431
NOPAT $36 $224 $588 $1,029 $1,656 $3,025 $5,082 $7,337 $9,712 $11,317 $12,120 $12,981
Fixed Broadband
Total Broadband Subscribers 97,000 98,940 100,919 102,937 104,996 107,096 109,238 111,423 113,651 115,924 118,242 120,607
5G Subscribers 1,000 5,000 10,000 15,000 17,400 19,890 21,848 22,285 22,730 23,185 23,648 24,121
Penetration 1.0% 5.1% 9.9% 14.6% 16.6% 18.6% 20.0% 20.0% 20.0% 20.0% 20.0% 20.0%
ARPU lift $50.00 $50.00 $50.00 $50.00 $50.00 $50.00 $50.00 $50.00 $50.00 $50.00 $50.00 $50.00
Revenue $300 $1,800 $4,500 $7,500 $9,720 $11,187 $12,521 $13,240 $13,504 $13,774 $14,050 $14,331
NOPAT $166 $995 $2,489 $4,148 $5,375 $6,186 $6,924 $7,322 $7,468 $7,617 $7,770 $7,925
New Revenue Pools
Revenue $50 $100 $200 $400 $800 $1,600 $3,200 $6,400 $12,800 $25,600 $35,000 $45,000
NOPAT $28 $55 $111 $221 $442 $885 $1,770 $3,539 $7,078 $14,157 $19,355 $24,885
Operator Investment -$20,000 -$25,000 -$30,000 -$30,000 -$30,000 -$30,000 -$15,000 -$10,000
Sum -$190,000
Cash Flow -$19,686 -$23,203 -$25,481 -$22,339 -$18,986 -$13,624 $9,024 $22,572 $42,744 $54,014 $61,013 $68,438
Discount Factor 0.90 0.81 0.72 0.65 0.58 0.52 0.47 0.42 0.38 0.34 0.34
Discounted Cash Flow -$19,686 -$20,820 -$20,515 -$16,138 -$12,307 -$7,924 $4,710 $10,570 $17,960 $20,364 $20,640 $23,151
Sum $4
IRR 11.4%
13. All rights reserved,InflectionCapital Management, LLC
Impact from Use Cases on TMUS’ Financials
Below we layer in the industry5G storyonto T-Mobile’s financials.The subscriber estimates shownin the first line are
ICM’s estimates basedupon the company’s and the industry’s current momentum, i.e. steady-state.We then
assume that T-Mobile’s lead in 5G allows it to take increasing share from the industry. This is shown in the middle
section.We do not assume anything for fixed-wireless as T-Mobile as a stand-alone company has articulatedno
plan for a fixedresidential. While 5Gwill spur a significant increase indata consumption (secondfigure), the
technologyalso lowers the cost by 10X. And so, on an unlimitedplan with usage going up 10X-20X, cost follow will a
lower trajectory.
TMUS Stand-Alone 2018E 2019E 2020E 2021E 2022E 2023E 2024E Comment
Postpaid
Subscribers 41,293 45,391 49,079 52,398 55,386 58,074 60,494 This is our base forecast based upon current momentum
% yoy growth 8.3% 9.9% 8.1% 6.8% 5.7% 4.9% 4.2%
5G Subs
Converted 908 3,177 6,288 9,969 16,261 27,222 This is the conversion of TMUS' current customer-base
% of Base 2% 7% 12% 18% 28% 45%
Non-TMUS Post Paid 214,957 219,256 223,641 228,114 232,676 237,330 242,076 This is the industry ex-TMUS
New 5G Subs 1.0% 3.0% 5.0% 5.5% 6.0% 6.5%
New 5G Subs to TMUS 2,193 6,709 11,406 12,797 14,240 15,735 This is additional share gains for being 1st to market nation-wide
Non-5G TMUS Subs 41,293 44,483 45,902 46,110 45,416 41,813 33,272
5G Subs 0 3,100 9,887 17,693 22,767 30,501 42,957
Total Postpaid Subs 41,293 47,584 55,788 63,804 68,183 72,314 76,229
Non-5G ARPU $43.96 $44.40 $44.84 $45.29 $45.74 $46.20 $46.66 Guidance is for flat. We assume slightly more
5G ARPU $51.46 $51.90 $52.34 $52.79 $53.24 $53.70 $54.16 We assume that 5G gets a $5/mo premium
Non-5G Service Revenue $20,948 $22,850 $24,318 $25,003 $25,120 $24,180 $21,022
5G Service Revenue $0 $965 $4,079 $8,736 $12,925 $17,163 $23,872
Phone Postpaid Service Revenue $20,948 $23,815 $28,396 $33,739 $38,045 $41,343 $44,893
Other Devices
Watch/Eyewear/etc. 5G Subs 4,943 8,847 11,383 15,250 21,479
Other Device Gross Profit/mo $5.00 $5.00 $5.00 $5.00 $5.00
Other Device Postpaid Rev/Profits $148 $414 $607 $799 $1,102
14. All rights reserved,InflectionCapital Management, LLC
TMUS & Sprint Synergies
Shown below is TMUS/S’slide on the projected cost synergies.Of the $6B/year total,$4B of that comes from lower
expense to tower companies, equipment providers,and back-hall providers.$1B comes out of marketing and
competing retail stores.The final $1B comes from redundant IT, billing,and corporate spend. The $43B NPV figure
incorporates a 8% WACC, little innear-term taxes,and a 21% long-termtax rate.
We have no basis to challenge any of TMUS/S’ synergy and NPV estimates.Moreover,T-Mobile was able to exceed
its synergy target fromMetroPCS by 40% and T-Mobile’s management guides to exceed. Consequently, we provide
a second scenario of $8.5/year in annual synergies, which has an NPV of $69B. Currently,the $43B number is now
only slightlyless than TMUS’$4pB market cap. That tells us that Wall Street sees no chance of a deal.
TMUS+Sprint Synergies
Shares Pre Post
TMUS 862 862
Sprint 4011 411
Conversion Ratio 9.75
Total Shares 1,273
Stated Synergy $43,000
Modeled Synergy $68,800
Per Share $54
$8.5B in annual $76
synergies vs. $6B
15. All rights reserved,InflectionCapital Management, LLC
TMUS/S Integration Risks
Without question,TMUS+S is a big merger and there is integrationrisk.Whenasked about how they will execute the
integration,T-Mobile’s management answers, “one bite at a time.” This means that they will do one market at a
time.And so, on a metro-basis,the New York and LA migrations withMetroPCS and T-Mobile are comparable to
TMUS+S.Also, the MetroPCS requiredmerging two different network technologies (CDMA & GSM) into one. With
Sprint,T-Mobile is going to push Sprint subscribers onto T-Mobile network and thenre-positionSprint’s network for 5G.
Additionally,two-thirds of Sprint’s customer handsets (iPhone & Samsung) are already compatible withT-Mobile’s
network.A significant portionof the remaining one-thirdcan be made compatible witha remote software update.
TMUS’ Stand-alone Business, Financials, & Value
Shown below is ICM’s estimates for T-Mobile stand-alone.One critical assumptionof this model is that service
revenue can grow from $32B to $58B withequipment subsidies only growing from $1.5B to $2.3B. The basis for that
view is the lower 5G handset costs and collecting a portionof the associatedoffsetting cloudrevenue.The
summation of the assumptions is a WAG;consequently, this is an expense line that has a wide range of possible
outcomes.Additionally, our estimated start-up (op-ex)costs for 5G are a WAG.
TMUS Stand-Alone 2018E 2019E 2020E 2021E 2022E 2023E 2024E Comment
Total Postpaid Service Revenue $20,948 $23,768 $28,350 $33,739 $38,045 $41,343 $44,893
Prepaid revenues $9,857 $10,157 $10,457 $10,757 $11,057 $11,357 $11,657 FactSet Consensus
Wholesale $1,048 $1,048 $1,048 $1,048 $1,048 $1,048 $1,048
Roaming and other $351 $351 $351 $351 $351 $351 $351
Service revenues $32,205 $35,325 $40,206 $45,895 $50,501 $54,099 $57,950
Other Revenue $1,182 $1,267 $1,271 $1,284 $1,297 $1,310 $1,323 FactSet Consensus
Equipment Revenue $9,803 $11,296 $13,244 $14,390 $14,608 $14,719 $14,740
2018E 2019E 2020E 2021E 2022E 2023E 2024E
Total Revenues $42,008 $46,621 $53,450 $60,285 $65,110 $68,818 $72,689
Equipment Expense $11,303 $13,025 $15,271 $16,591 $16,844 $16,971 $16,995 Expense per device comes down due to cloud transition
Equipment EBIT -$1,500 -$1,728 -$2,027 -$2,202 -$2,235 -$2,252 -$2,255
Total Subs 76,868 83,805 92,527 100,956 105,666 110,062 114,188
Non-5G Cost of Service $7.08 $7.08 $7.08 $7.08 $7.08 $7.08 $7.08
5G Cost of Service $8.08 $7.88 $7.69 $7.49 $7.31 $7.12 $6.94 At scale 5G is to be 10X cheeper per bit
Non-5G Cost of Service $6,535 $6,829 $7,495 $8,224 $8,782 $9,170 $9,532
5G Cost of Service $0 $147 $599 $1,240 $1,774 $2,277 $3,061
Total Cost of Service $6,535 $6,976 $8,094 $9,464 $10,556 $11,446 $12,593
SG&A % of Service Revenue 38.4% 37.0% 36.0% 35.0% 34.0% 33.0% 32.0%
Service SG&A $12,354 $13,070 $14,474 $16,063 $17,170 $17,853 $18,544
per sub/mo $13.39 $13.56 $13.68 $13.84 $13.85 $13.79 $13.78 Assume modest efficiencies
Service EBITDA $13,316 $15,278 $17,638 $20,368 $22,775 $24,800 $26,813
5G Start-up Costs $250 $750 $1,000 $1,000 WAG
Total EBITDA $12,998 $14,567 $16,132 $18,450 $20,836 $23,857 $25,880
16. All rights reserved,InflectionCapital Management, LLC
Next,we layer our EBITDA estimates into a cash-flow and valuation model.(T-Mobile has no cash tax expense until
2025.) We assume that 75%of the FCF is used to de-lever.The analysis outputs prospective stock prices,one for 6.5X
EBITDA and a second for 8.5X. The stock currentlytrades at 6.5X NTM. However,should the company execute on
the 5G plan that we describe above, 8.5X is more appropriate givenfaster growthand larger TAMS.
TMUS Stand-Alone 2018E 2019E 2020E 2021E 2022E 2023E
Total EBITDA $12,998 $14,583 $16,187 $18,538 $20,926 $23,926
YoY $ Ch $1,585 $1,604 $2,351 $2,388 $3,000
Interest Costs $1,700 $1,600 $1,500 $1,400 $1,300 $1,200
Cash Taxes $0 $0 $0 $0 $0 $0
Cap Ex $5,300 $5,400 $7,700 $7,700 $7,700 $6,200
Working Capital -$900 -$990 -$1,089 -$1,198 -$1,318 -$1,449
Free Cash Flow $5,098 $6,593 $5,898 $8,240 $10,609 $15,076
Debt Paydown $1,500 $4,945 $4,424 $6,180 $7,956 $11,307
Net Debt $29,000 $24,055 $19,632 $13,452 $5,495 -$5,812
Leverage 2.2 x 1.6 x 1.2 x 0.7 x 0.3 x
EV/EBITDA 6.5 x 6.5 x 6.5 x 6.5 x 6.5 x 6.5 x
Enterprise Value $84,487 $94,790 $105,216 $120,497 $136,021 $155,518
Equity Value $55,487 $70,735 $85,584 $107,046 $130,526 $161,330
Per Share $64 $81 $98 $123 $150 $185
EV/EBITDA 8.5 x 8.5 x 8.5 x 8.5 x 8.5 x 8.5 x
Per Share $94 $115 $136 $166 $198 $240
17. All rights reserved,InflectionCapital Management, LLC
2018, ’19, & ’20 Catalyst Calendar
5G Road Map
Q3'18
QCOM, Huawei, Samsung, Ericsson, and Nokia news
Q4'18
VZ & AT&T Updates on 5G fixed-broadband roll-out
TMUS Announces 30 cities for 2019 5G launch
Huawei starts to sell 5G chips and phones
Huawei and China mobile start 5G trials in 5 cities
Q1'19
5G Handset Annoucements
KT nationwide 5G mobile launch in Korea
World Radio Congress confirms 5G standards
CES and Mobile World Congress
Q2'19
TMUS starts 30 deployment: NYC, Dallas, SF, LA, LV
Media and Wall Street reviews
VZ & AT&T roll-out of 5G fixed broadband
Sprint launches 5G mobile service
Q3'19
Q4'19
TMUS nationwide mobile 5G launch
VZ & AT&T annouce nationalwide 5G launch date
China Mobile launch
1H'20
VZ & AT&T nationwide 5G mobile launch
18. All rights reserved,InflectionCapital Management, LLC
Catalyst Calendar + Enterprise Expansion + Stock Price Outcome
The first table below uses FactSet consensus at 6.5Xto projectedexpectedTMUS stock prices shouldthe company
hit current expectations.This is shown in the blue-highlight.Below that are rows of values for each of the
incremental wins discussedabove. These are summed and presented in the green-highlight along withthe
annualized returnfrom6.2.2018. The circled 78%figure is the annualized returnfrom 6.2.2018 to 12.30.2020 should
the 5G plan work, the stock trade at 8.5X, TMUS+S be approvedand the synergy guidance be increased to $8.5B.
Based upon the timeline above,we would expect most of the upside from the 5G and merger stories to be
reflectedinTMUS price by the end of 2020.
The subsequent table show price outcomes for less favorable events.These include:
✓ Negative consensus revisions of -7.5%.
✓ The valuationcompressing to 5.5X.
✓ Only 50% of the 5G scenario
✓ And no merger.
12/31/2018 12/31/2019 12/30/2020 12/30/2021 12/30/2022 12/30/2023
Hitting Consensus
EBITDA-NTM $12,780 $13,418 $14,123 $14,823 $15,523 $16,223
EV/EBITDA 6.5 x 6.5 x 6.5 x 6.5 x 6.5 x 6.5 x
Enterprise Value $83,070 $87,217 $91,800 $96,350 $100,900 $105,450
Net Debt $29,000 $26,212 $22,841 $18,919 $14,407 $9,679
FCF $3,718 $4,494 $5,230 $6,016 $6,304 $6,704
Debt Paydown $2,789 $3,371 $3,923 $4,512 $4,728 $5,028
Equity Value $54,070 $61,006 $68,959 $77,431 $86,493 $95,771
per Share $62 $70 $79 $89 $99 $110
6X 5G Scenario $98 $123 $150 $185 $215
8X 5G Scenario $136 $166 $198 $240 $274
$6B Sprint Synergies $54 $54 $54 $54 $54
$8.5B in Synergies $76 $76 $76 $76 $76
8X + Synergies $212 $242 $274 $316 $350
Annualized 140% 78% 57% 46% 39%
return from $56.87
on 6.2.2018
19. All rights reserved,InflectionCapital Management, LLC
Other Risk Factors
Amazon: Does Amazon buy DISH’s spectrumand launch its own competing mobile network?
12/31/2018 12/31/2019 12/30/2020 12/30/2021 12/30/2022 12/30/2023
Consensus high by 7.5%
EBITDA-NTM $11,822 $12,412 $13,064 $13,711 $14,359 $15,006
EV/EBITDA 5.5 x 5.5 x 5.5 x 5.5 x 5.5 x 5.5 x
Enterprise Value $65,018 $68,264 $71,851 $75,412 $78,973 $82,535
Net Debt $29,000 $26,769 $24,073 $20,935 $17,325 $13,543
FCF (80% of Ce) $2,974 $3,595 $4,184 $4,813 $5,043 $5,363
Debt Paydown $2,231 $2,696 $3,138 $3,610 $3,782 $4,022
Equity Value $36,018 $41,495 $47,778 $54,477 $61,648 $68,992
per Share $41 $48 $55 $63 $71 $79
50% of 5G Scenario $1 $6 $10 $18 $27 $39
8X 5G Scenario $0 $0 $0 $0 $0 $0
Sprint Synergies $0 $0 $0 $0 $0 $0
Total $42 $53 $65 $81 $98 $119
Annualized -4% 6% 11% 13% 14%
return from $56.87
on 6.2.2018