SlideShare a Scribd company logo
1 of 10
Download to read offline
The International Journal Of Engineering And Science (IJES)
|| Volume || 4 || Issue || 4 || Pages || PP.88-97 || 2015 ||
ISSN (e): 2319 – 1813 ISSN (p): 2319 – 1805
www.theijes.com The IJES Page 88
Constraints on labour productivity-a case study
Linjesh Sebastian1
, Prof. V Srinivasa Raghavan2
1
M.Tech student, Civil Engineering Department, Manipal University, Karnataka, India
2
Associate Professor, Civil Engineering Department, Manipal University, Karnataka, India
----------------------------------------------------------------ABSTRACT-----------------------------------------------------
Productivity always acts as a main factor influencing timely completion of the project and cost control in all
construction projects. Proper evaluation of labour productivity and corrective measures taken to achieve the
required level of productivity will always help to keep the project in track. In this research, observations were
conducted in a construction site in Kerala by adopting work sampling technique which revealed that workers
are engaged in unproductive activities during 30%-40% of the normal working time. The main factors which
are negatively affecting productivity were observed and their frequencies were also noted. Normality tests were
conducted to analyse the data. Baseline productivity measurement and variation coefficient indicates that there
is a good variation in daily productivity and so productivity can be improved by controlling these costraints on
labour productivity. It was observed that activities like being simply idle, unnecessary roaming, talking, waiting
for materials and tools are the main reasons for unproductiveness. Lack of proper managerial efficiency is the
basic reason for all these issues.
KEYWORDS: labour productivity, work sampling, coefficient of variation
---------------------------------------------------------------------------------------------------------------------------------------
Date of Submission: 31-March-2015 Date of Accepted: 15-April-2015
---------------------------------------------------------------------------------------------------------------------------------------
I. INTRODUCTION:
Understanding the various factors that affect labour productivity negatively or positively is very
important to form a strategy that will help the construction companies to reduce costs and time delays and thus
to improve overall project performance. Shehata and El-Gohary (2012) provides different definitions of labour
productivity, aspects, measurements, factors affecting it, techniques used for measuring it and modeling
techniques. The study focuses concentrates on baseline productivity which occurs when there are few or no
disruptions In simple terms productivity can be defined as a relation between output generated from a system
and input used to generate the output. Inputs generally are labour, materials, equipment etc which is brought into
the system. Output can be goods and services produced using these inputs. Accurate determination of
productivity is very important but productivity measurement in construction is a complex issue because of the
interaction of labour, capital, materials and equipment and varying effect of various site conditions on
productivity rates of most standard construction items. This paper covers data collection by work sampling
method, determination of baseline productivity and various constraints to productivity with their frequencies,
analysis of data, results and discussion and conclusion.
II. RESEARCH METHOD:
1.1 Methodology:
Work sampling method of evaluation has been recommended for measuring highly variable labor
productivity in construction (Kumaraswamy and Chan 1998). Work sampling is an indirect measuring method
that through instantaneous observations, allows to determine the amount of activity or inactivity in a production
process. It makes a random and instantaneous number of observations of a group of machines, process (activity)
or workers by the needs of each company. It is based on the fundamental law of probability: at any given time
an event can be present or absent.
Constraints on labour productivity-a case study
www.theijes.com The IJES Page 89
In this method works are classified into 3 groups namely
1. Productive work - the activities directly related with construction process and affects the output.
2. Contributory work - the activities that indirectly affects the output, but commonly needed in an
operation.
3. Unproductive work - idle or doing activities that is not related with the job. For example: take a walk
without bringing anything, doing activities which is out of procedures, chit chat, and so on.
This research aims to find the percentage productive time of various operations at the site, measuring
the productive rates of these activities, identifying various factors that contribute to unproductiveness with their
frequencies.
1.2 Data collection:
Data for this study is collected from a G+15 apartment building of a reputed builder in Kerala. Blockwork,
plastering and other general works are the various activities from which data is collected. In these plastering
works were given to subcontractors and payment were made on the basis of work done per day. The other two
works, blockwork and general works were on a daily labour basis and payments were not based on quantity of
work done per day.
To find the required number of observations in work sampling method, many construction and
industrial engineering journals provide the following equation for determining sample size based on desired
error, and anticipated category percentages (Groover, 2007; Picard, 2004; Stevens, 1969; Thomas Jr. et al.,
1982)
N=
𝑍^2∗𝑃∗(1−𝑃)
𝐿^2
(1)
Where, N= no. of observations required
P= estimated probability of observing a worker doing a certain activity
L=limit(in percentage)of accuracy required
Z=standard normal variable depending on the level of confidence
For maximum N,
𝑑𝑁
𝑑𝑃
=
𝑍2
𝐿2 1 − 𝑃 = 0 (2)
If the anticipated percentage P is unknown, avalue of 50% (0.5) may be used as a worst case scenario
ensuring the number of samples will be overestimated. Considering 95% confidence limits, corresponding Z
value = 1.96, required sample size is
N=
1.962∗0.5∗0.5
0.05^2
= 385
So minimum number of observations required is 30 observations per day for 13 days. But 30
observations for 20 days were done for each activity. The purpose for large data set gathering is for accuracy.
Workers were observed 30 times a day and noted were they are involved in some productive or
contributory work, or engaged in unproductive activities. If they are engaged in unproductive activities those
unproductive activities and their frequencies were noted.
Data were collected in the prescribed format. Observation time is determined by random number, in
order to no opportunity to have same time and also to guarantee the samples are taken by randomly
(Sutalaksana, 1979). Random timings were generated using excel and used for these observations. Time for
breakfast and lunch were excluded from the observations.
Table 1.Details of labours observed
Type of work No. of labours observed
mason helper
Blockwork 4 2
Plastering 12 6
General works - 10
Constraints on labour productivity-a case study
www.theijes.com The IJES Page 90
Thomas and Zavrski (1999a), 1999b) expressed the projects attributes in the following forms.
Cumulative productivity=
𝑡𝑜𝑡𝑎𝑙 𝑞𝑢𝑎𝑛𝑖𝑡𝑦 (𝑚3)
𝑡𝑜𝑡𝑎𝑙 𝑤𝑜𝑟𝑘 ℎ𝑜𝑢𝑟 (𝑤ℎ𝑟)
(3)
1.3 Baseline productivity:
Baseline productivity can be defined as the best performance a contractor can achieve, on a particular
project or activity. To compute baseline productivity following steps were adopted. It is determined with respect
to 10 % of the total workdays that have the highest daily output or production.
1. The number established in one above should be rounded off to the next highest odd number which
should not be less than (5) five. This number, n, explains the size of the baseline division.
2. The contents of the baseline division are the n workdays that have the highest daily production or
output.
3. The next step is to compute the summation of the work hours and quantities for these n workdays.
4. The baseline productivity can now be expressed as the ratio of work hours and the quantities contained
in the baseline division.
Variability in productivity is a determinant of performance of a construction project. Well performing projects
exhibit lower variability when compared to projects that perform poorly. Thomas et al. [10] emphasized the
necessity to reduce variability in labour productivity to improve performance of construction projects.
Variability in daily productivity is calculated using the following equation given by Thomas et al[1]:
Variation (Vj) =
∑√ (𝑑𝑝𝑖𝑗 −𝑏𝑎𝑠𝑒𝑙𝑖𝑛𝑒 𝑝𝑟𝑜𝑑𝑢𝑐𝑡𝑖𝑣𝑖𝑡𝑦𝑗 ^2)
𝑛
(4)
Where dpij= daily productivity (unit rate) for workday on project j and n = number of workdays on project j
The variation Vj for different projects cannot be compared directly unless the baseline productivity values are
the same. Therefore, coefficient of variation is calculated for each project as follows:
Coefficient of Variation (CVj) =
𝑉𝑗 ∗100
𝑏𝑎𝑠𝑒𝑙𝑖𝑛𝑒 𝑝𝑟𝑜𝑑𝑢𝑐𝑡𝑖𝑣𝑖𝑡𝑦 𝑗
(5)
Abdel – Razek et al. (2007) suggested that better labour and cost performance can be achieved by reducing
variability.
III. RESULTS AND DISCUSSION:
Table 2. Chart showing percentage productive time and daily quantity in plastering
Sl.no % productive time Average %
productive
time
Total area
plastered per
day(M2
)
M2
/whr Baseline
productivity
daysBatch 1 Batch 2 Batch 3
1 64.76 76.11 61.33 67.59 184.93 1.142
2 72.38 71.67 64 69.82 184.97 1.142
3 72.38 79.45 77.33 76.11 212.92 1.315 *
4 66.19 69.45 64 66.67 182.75 1.129
5 78.57 81.11 68 71.85 197.43 1.219
6 65.72 73.89 64 67.96 176.35 1.089
7 78.09 83.89 69.34 77.59 214.24 1.323 *
8 80.48 78.89 70.67 77.22 197.66 1.221
9 66.19 73.89 70 69.81 182.49 1.127
10 71.43 72.22 66.66 70.37 192.28 1.187
11 73.33 76.66 60 70.74 190.86 1.179
12 67.61 68.89 64 67.04 190.72 1.178
13 71.42 75.56 65.33 71.11 201.12 1.242 *
14 69.52 73.33 61.34 68.52 183.26 1.132
15 67.14 68.89 66.67 67.6 195.42 1.207
16 76.19 81.11 62.67 74.07 198.79 1.228 *
17 76.66 74.44 64.66 72.59 188.94 1.167
18 72.86 75.56 67.34 72.22 198.02 1.223 *
19 61.9 61.67 58 60.74 165.76 1.024
20 65.72 70.56 59.33 65.56 179.21 1.107
Average 70.927 74.362 65.45 70.259 190.91 1.179
Constraints on labour productivity-a case study
www.theijes.com The IJES Page 91
Figure 1. Relation showing percentage of productive time and quantity of plastering work done
Table 3. Chart showing percentage productive time and daily quantity in blockwork
Sl.No average % productive time quantity of work done each
day (m3
)
M3
/whr Baseline productivity
days
1 55.45 1.45 0.027
2 58.52 1.55 0.029
3 60.95 1.8 0.034
4 62.47 2.12 0.04
5 61.24 2.2 0.041 *
6 64.85 2.25 0.042 *
7 63.25 2.2 0.041 *
8 65.75 2.7 0.05 *
9 61.22 2.1 0.039
10 60.28 2.2 0.041
11 63.36 2.18 0.041
12 64.2 2.5 0.047 *
13 60.55 1.95 0.037
14 62.82 2.08 0.039
15 61.26 2.15 0.04
16 62 2.04 0.038
17 60.48 1.85 0.035
18 62.64 2.06 0.039
19 59.85 1.6 0.03
20 60.42 1.96 0.037
Constraints on labour productivity-a case study
www.theijes.com The IJES Page 92
Figure 2. Relation showing percentage of productive time and quantity of block work done
Table 4. Chart showing percentage productive time during general works
Sl.No. Average % productive time
1 64.67
2 63.67
3 65.33
4 65.33
5 65.67
6 63
7 66
8 62.67
9 62
10 62.67
11 63
12 60
13 60.33
14 62.33
15 66.67
16 61.33
17 57.33
18 59
19 64.33
20 60.5
Figure 3. Average percentage productive time during general works
Constraints on labour productivity-a case study
www.theijes.com The IJES Page 93
Table 5. Average % productive time of various activities
Nature of work Average % productive time
Blockwork 61.58
Plastering 70.26
General works 62.79
Average % productive time 64.88
From the data obtained and graphs plotted it is clear that there exists some relation between average %
productive time measured and quantity of work done. It can be noticed that in most cases the quantity of work
done increases when there is an increase in the observed percentage of productive time. The values show that
around 30%-40% of the time, workers are engaged in unproductive activities. This is a major contribution to
cost overrun and project delays. Results shows that, considering the 3 works observed, the average percentage
productive time is only 64.88% which means the labours were spending 35.12% of their time for non-productive
activities. Among these the subcontract works have more percentage of productive time compared to works
carried out using labours directly employed. This is because the subcontract works were paid according to the
quantity of work done and the more the quantity of work they can finish, the more payment they will receive.
Table 6. Performance measures:
Type of work Cumulative
productivity
Baseline
productivity
Mean median Variation(Vj) Coefficient of
Variation(CVj)
Blockwork 0.038 0.04 0.0384 0.039 0.0065 14.88
Plastering 1.179 1.266 1.1791 1.1785 0.097 7.71
The cumulative productivity, variation and coefficients of productivity variation were calculated as per
equations (3), (4) and (5) and the values are presented in table. These values shows that coefficient of variation
is 14.88 in block laying and 7.71 in plastering. This suggests that there is still room for improvement of
productivity. Reducing variability will bring about improvement in labour performance. From the percentage
productive time observations it is noticed that 30-40% time workers are engaged in unproductive activities.
While considering all these factors it is evident that there aa lot of spaces for improvement in productivity.
Normality test was conducted on the productivity data and observed that for plastering, the mean of the
estimate was higher than the median. This indicates that the frequency distribution is not symmetrical. It is a
skewed distribution. The analysis further indicates that the distribution is positively skewed having a skewness
value of 0.124 and standard deviation of 0.411.
For blockwork mean of the estimate was lower than median. This also indicates that the frequency
distribution is not symmetrical. The distribution is negatively skewed having a skewness value of -0.218 and
standard deviation of 0.668.
Constraints on labour productivity-a case study
www.theijes.com The IJES Page 94
Table 7. No.of observations for eachunproductive acitivity
Sl.
No.
Description of
distraction
Frequency of distractions
Blockwork Plastering General works Total
No. % No. % No. % No. %
1 Simply idle 769 56.3 1535 49.09 1238 56.02 3542 52.85
2 From stockyard 35 2.56 44 1.41 0 0 79 1.18
3 Waiting for
materials from
helpers
84 6.15 116 3.71 0 0 200 2.99
4 Waiting for tools
from store
13 0.95 6 0.2 264 11.95 283 4.23
5 Waiting for
materials from
other workers
5 0.36 78 2.5 11 0.5 94 1.41
6 Rework 12 0.88 249 7.97 0 0 261 3.9
7 Waiting for
instructions/
inspection
18 1.32 135 4.32 97 4.39 250 3.73
8 Waiting for co-
workers
0 0 47 1.51 43 1.95 90 1.35
9 Using mobile
phone
36 2.63 105 3.36 29 1.32 170 2.54
10 Roaming 198 14.5 419 13.4 270 12.22 887 13.24
11 Talking with co-
workers
168 12.3 351 11.23 208 9.42 727 10.85
12 Drinking water 12 0.88 26 0.84 43 1.95 81 1.21
13 Personal hygiene 16 1.17 16 0.52 7 0.32 39 0.59
Total 1366 100 3127 100 2210 100 6703 100
49%
1%4%0%3%8%
4%2%
3%
13%
11%
1%1%
PERCENTAGE OF VARIOUS DISTRACTIONS DURING PLASTERING
1 2 3 4 5 6 7 8 9 10 11 12 13
Constraints on labour productivity-a case study
www.theijes.com The IJES Page 95
Among the various unproductive activities, it is observed that being idle is the main reason for loss in
productivity while considering all the three works viz, blockwork, plastering and general works.
Eventhough a portion of idle observations can be considered as rest during the works, but a good
portion of idleness can be accounted to spend time without doing anything productive. It can be noticed that
more than half(52.85%) of the total unproductive observations accounts for being simply idle. These values are
exclusive of time spend for breakfast and lunch time. The second main reason for unproductiveness is unwanted
roaming which accounts for about 13.24% of the total unproductive observations. The other main reason for
unproductiveness is chatting with co-workers. It accounts for about 10.85% of the total unproductive
observations. This shows the workers negative attitude to work. The limited number of site
engineers/supervisors makes it difficult to supervise all activities when the work is carried out in many floors.
56%
3%6%
1%
0%1%
1%
0% 3%
15%
12% 1%1%
PERCENTAGE OF VARIOUS DISTRACTIONS DURING BLOCKWORK
1 2 3 4 5 6 7 8 9 10 11 12 13
41%
0%0%
22%
0%
0%4%
4%
0%
14%
10%
4% 1%
PERCENTAGE OF VARIOUS DISTRACTIONS DURING GENERAL WORKS
1 2 3 4 5 6 7 8 9 10 11 12 13
53%
1%3%4%
1%
4%
4%
1%
3%
13%
11%
1%1%
PROPORTION OF DISTRACTIONS WHILE CONSIDERING ALL WORKS
1 2 3 4 5 6 7 8 9 10 11 12 13
Constraints on labour productivity-a case study
www.theijes.com The IJES Page 96
The other reason is waiting for materials at job site from stock yard. This is mainly because there was
only one hoist for shifting materials to all the 15 floors and this hoist will be always busy due to shifting of
civil, electrical and plumbing materials to different contractors and labours at different floors and because of
these, there will be a long queue to shift materials near the hoist mostly at mornings. The company personnel
tried to arrange materials to all contractors by shifting materials during times other than normal working time
but it was not effective always.
The masons before starting plastering will be idle for some time at morning till their workplace is
cleaned and getting their mortar ready from the helpers. From the observations it is noticed that if there are no
sufficient number of helpers, the masons will be idle for more time. It is evident from the plastering activities in
which work is carried out by 3 teams comprising of different number of mason helper combination. In team A,
there were 5 masons and 2 helpers, in team B, there were 4 masons and 2 helpers and in team C, there were 3
masons and 2 helpers. The team A masons took more time to start their work at morning because of the
improper crew composition. It was noticed that the helpers were more engaged in contributory activities to
satisfy the requirements of masons and in many times masons were idle due to unavailability of mortar or tools.
But at the same time, team 3 having 3 helpers for 2 masons were also not a good combination because the
helpers were idle for more time as they have no work.
Workers waiting for tools were one of the main reasons for loss of productivity. It was because of the
delay in issuing tools to the labours. The daily work planning and deployment of labours for various works
which is done at morning takes some time. Also there was shortage of tools which makes the site engineers to
re-allot the labours to other works. All these are time consuming and will result in wastage of productive time.
The other issue is waiting for instructions or inspection. The direct employed labours will be waiting
for instructions from the site supervisors while doing general works like shifting materials, cleaning, chipping
and cutting etc. This may happen because of the poor communication problems between supervisors and labours
and also due to the different activities they are doing in different days. The labours mainly from other states may
not understand the instructions clearly even though the instructions were given in hindi as many labours know
their own local language only. Sometimes labours will be waiting for inspection from site supervisors or
engineers after completing the whole work or part of it. This is because the workers may not be sure about the
quality of work they have done and so a green signal from the engineers/supervisors will give confidence for
them to proceed the work.
Waiting for co-workers is other issue which arise due to the mistakes in labour allotment for various
works. Some works cannot be done individually and so labours will be waiting for their co-workers. Also when
working as a pair, one person will go for his hygiene requirements or drinking water or will be using mobile
phone which makes the other person idle. The solution to this problem is to provide sources of drinking water in
different floors of building. Also providing toilet facilities in 2 or 3 floors of the entire building will help to save
time for these purposes.
Rework was another hurdle for the progress of the work. Time taken for rework varies between 30-45
minutes per mason per day. Eventhough many factors contributed to rework, poor condition of tools, delay in
inspection or delay in giving instructions are the main causes of rework.
IV. CONCLUSION:
The study showing losses in productivity clearly indicates the improper management of a construction
project. Only 60-70 % of time the labours found working. Even by closing the gap between baseline
productivity and normal productivity rates, performance can be improved.
Improper material planning and insufficient number of tools and equipment contributed a lot to the loss
of productivity.
Lack of proper supervision due to insufficient number of supervisors and engineers also contributed
mainly to the productivity losses. All these factors mainly confirm to the managerial inefficiencies in most
cases.
As labourwages are high, labour productivity can be improved by raising human performance and by
reducing non value-added activities.Labour productivity improvement will automatically upgrade the level of
value added activities and thereby reduces the chances for cost overrun and time delays.
Constraints on labour productivity-a case study
www.theijes.com The IJES Page 97
REFERENCES:
[1]. Thomas, H. R. and Zavrski, I. (1999). “Construction baseline productivity: Theory and practice”. Journal of Construction
Engineering and Management, 125(5), pp.295 – 303.
[2]. Enshassi, A., Mohamed, S., Mayer, P. and Abed, K. (2007). “Benchmarking masonry labour productivity”. International Journal
of Productivity and Performance Management, 56(4),pp.358 – 368.
[3]. Thomas, H.R. and Zavrski, I. (1999 b). “Construction Baseline Productivity: Theory and Practice”. Journal of Construction
Engineering and management, 125(5).
[4]. Jarkas, A. M. and Bitar, C. G. (2012). Factors affecting construction labour productivity in Kuwait. Journal of Construction
Engineering and Management, 138(7), 811 – 820
[5]. Bandyopadhyay.A and Smith.R.(2004).”A Senior Project in Construction Management Technology Based on Work sampling”.
Proceedings of the 2004 American Society for Engineering Education Annual Conference & Exposition.
[6]. Gouett.M.C. (2010). “Activity Analysis for Continuous Productivity Improvement in Construction”. Ph. D. dissertation,
University of Waterloo, Canada.
[7]. Idiake, J. E. and Bala, K. (2014) “Diminution in Variability of Blockwork Labour Productivity: A Panacea for Improving Labour
Performance”. Journal of Economics and Sustainable Development, 5(4).
[8]. Ulubeyli, Serdar., Kazaz, Aynur., and Bayram.(2014)“Planning Engineers’ Estimates On Labor Productivity: Theory And
Practice”. Procedia - Social and Behavioral Sciences 119, pp. 12-19.
[9]. Shehata,Mostafa., El-Gohary, Khaled. (2011). “Towards improving construction labor productivity and projects’ performance”.
Alexandria Engineering Journal, 50, pp.321–330.
[10]. Idiake, J. E. and Bala, K. (2012). “Improving labour productivity in masonry work in Nigeria: The application of lean management
techniques”. Proceedings of 4th West Africa Built Environment Research Conference, Abuja, Nigeria, 24 – 26 July, 2012, pp. 677
– 686.
[11]. Ameh, O.J., &Osegbo, E.E. (2011). “Study of relationship between time overrun and productivity on construction sites”.
International Journal of Construction Supply Chain Management 1 (1). 56-67.

More Related Content

What's hot

Law of variable proportion and law of return to scale
Law of variable proportion and law of return to scaleLaw of variable proportion and law of return to scale
Law of variable proportion and law of return to scaleMohammed Jasir PV
 
Law of Variable Proportion By Mr. Prasant Kumar Behera
Law of Variable Proportion By Mr. Prasant Kumar BeheraLaw of Variable Proportion By Mr. Prasant Kumar Behera
Law of Variable Proportion By Mr. Prasant Kumar BeheraPrasant Kumar Behera
 
method study- micromotion vs memo motion
method study- micromotion vs memo motionmethod study- micromotion vs memo motion
method study- micromotion vs memo motionpranav teli
 
Work Center Scheduling
Work Center Scheduling Work Center Scheduling
Work Center Scheduling Shivangi Singh
 
travel chart for plant layout
travel chart for plant layouttravel chart for plant layout
travel chart for plant layoutYash Patel
 
Abhishek kansal presentation 02.09.2012
Abhishek kansal presentation 02.09.2012Abhishek kansal presentation 02.09.2012
Abhishek kansal presentation 02.09.2012Manav Arora
 
work measurement_operation management
work measurement_operation managementwork measurement_operation management
work measurement_operation managementSaravanan Murugan
 
Law Of Variable Proportions (Economics)
Law Of Variable Proportions (Economics)Law Of Variable Proportions (Economics)
Law Of Variable Proportions (Economics)market times
 
Research paper: Productivity Improvement in a Centralized Warehouse
Research paper: Productivity Improvement in a Centralized WarehouseResearch paper: Productivity Improvement in a Centralized Warehouse
Research paper: Productivity Improvement in a Centralized WarehouseFaizan Ali
 
Motion and time study
Motion and time studyMotion and time study
Motion and time studyNiket Kawale
 
Modul 1 process planning and standard time calculation
Modul 1 process planning and standard time calculationModul 1 process planning and standard time calculation
Modul 1 process planning and standard time calculationAmalia Syafitri
 

What's hot (19)

Law of variable proportion and law of return to scale
Law of variable proportion and law of return to scaleLaw of variable proportion and law of return to scale
Law of variable proportion and law of return to scale
 
Cumulative and flyback timing
Cumulative and flyback timingCumulative and flyback timing
Cumulative and flyback timing
 
Method study
Method studyMethod study
Method study
 
Law of Variable Proportion By Mr. Prasant Kumar Behera
Law of Variable Proportion By Mr. Prasant Kumar BeheraLaw of Variable Proportion By Mr. Prasant Kumar Behera
Law of Variable Proportion By Mr. Prasant Kumar Behera
 
Theory of production
Theory of productionTheory of production
Theory of production
 
method study- micromotion vs memo motion
method study- micromotion vs memo motionmethod study- micromotion vs memo motion
method study- micromotion vs memo motion
 
Seven quality tools
Seven quality toolsSeven quality tools
Seven quality tools
 
Work Center Scheduling
Work Center Scheduling Work Center Scheduling
Work Center Scheduling
 
Law of production
Law of productionLaw of production
Law of production
 
Basics of production
Basics of productionBasics of production
Basics of production
 
travel chart for plant layout
travel chart for plant layouttravel chart for plant layout
travel chart for plant layout
 
Abhishek kansal presentation 02.09.2012
Abhishek kansal presentation 02.09.2012Abhishek kansal presentation 02.09.2012
Abhishek kansal presentation 02.09.2012
 
work measurement_operation management
work measurement_operation managementwork measurement_operation management
work measurement_operation management
 
Law Of Variable Proportions (Economics)
Law Of Variable Proportions (Economics)Law Of Variable Proportions (Economics)
Law Of Variable Proportions (Economics)
 
Sample powerpoint
Sample powerpointSample powerpoint
Sample powerpoint
 
Research paper: Productivity Improvement in a Centralized Warehouse
Research paper: Productivity Improvement in a Centralized WarehouseResearch paper: Productivity Improvement in a Centralized Warehouse
Research paper: Productivity Improvement in a Centralized Warehouse
 
Motion and time study
Motion and time studyMotion and time study
Motion and time study
 
Unit 2
Unit 2Unit 2
Unit 2
 
Modul 1 process planning and standard time calculation
Modul 1 process planning and standard time calculationModul 1 process planning and standard time calculation
Modul 1 process planning and standard time calculation
 

Viewers also liked

Enterprise Architecture – A Tool for Business Innovation Realization in the E...
Enterprise Architecture – A Tool for Business Innovation Realization in the E...Enterprise Architecture – A Tool for Business Innovation Realization in the E...
Enterprise Architecture – A Tool for Business Innovation Realization in the E...theijes
 
Exposure to Ionizing Radiation and Radiological Implications: a review of ICR...
Exposure to Ionizing Radiation and Radiological Implications: a review of ICR...Exposure to Ionizing Radiation and Radiological Implications: a review of ICR...
Exposure to Ionizing Radiation and Radiological Implications: a review of ICR...theijes
 
Constraints on labour productivity-a case study
Constraints on labour productivity-a case studyConstraints on labour productivity-a case study
Constraints on labour productivity-a case studytheijes
 
Energy Proficient and Security Protocol for WSN: A Review
Energy Proficient and Security Protocol for WSN: A ReviewEnergy Proficient and Security Protocol for WSN: A Review
Energy Proficient and Security Protocol for WSN: A Reviewtheijes
 
F031101038043
F031101038043F031101038043
F031101038043theijes
 
Modeling of LDO-fired Rotary Furnace Parameters using Adaptive Network-based ...
Modeling of LDO-fired Rotary Furnace Parameters using Adaptive Network-based ...Modeling of LDO-fired Rotary Furnace Parameters using Adaptive Network-based ...
Modeling of LDO-fired Rotary Furnace Parameters using Adaptive Network-based ...theijes
 
Analysis of C-C Short Cylindrical Shells under Internal Pressure using Polyno...
Analysis of C-C Short Cylindrical Shells under Internal Pressure using Polyno...Analysis of C-C Short Cylindrical Shells under Internal Pressure using Polyno...
Analysis of C-C Short Cylindrical Shells under Internal Pressure using Polyno...theijes
 
Study Analysis & Application of Bio-Composite Smart Material
Study Analysis & Application of Bio-Composite Smart MaterialStudy Analysis & Application of Bio-Composite Smart Material
Study Analysis & Application of Bio-Composite Smart Materialtheijes
 
An Overview of FACTS Controllers for Power Quality Improvement
An Overview of FACTS Controllers for Power Quality ImprovementAn Overview of FACTS Controllers for Power Quality Improvement
An Overview of FACTS Controllers for Power Quality Improvementtheijes
 
when a coil is rotated or turned under a magnetic field, there occurs a force...
when a coil is rotated or turned under a magnetic field, there occurs a force...when a coil is rotated or turned under a magnetic field, there occurs a force...
when a coil is rotated or turned under a magnetic field, there occurs a force...theijes
 
Efficient Use of Rain Water by Altering Channel System
Efficient Use of Rain Water by Altering Channel SystemEfficient Use of Rain Water by Altering Channel System
Efficient Use of Rain Water by Altering Channel Systemtheijes
 
Wind Power Density Analysis for Micro-Scale Wind Turbines
Wind Power Density Analysis for Micro-Scale Wind TurbinesWind Power Density Analysis for Micro-Scale Wind Turbines
Wind Power Density Analysis for Micro-Scale Wind Turbinestheijes
 
H031101052058
H031101052058H031101052058
H031101052058theijes
 
Contribution of Competence Teacher (Pedagogical, Personality, Professional Co...
Contribution of Competence Teacher (Pedagogical, Personality, Professional Co...Contribution of Competence Teacher (Pedagogical, Personality, Professional Co...
Contribution of Competence Teacher (Pedagogical, Personality, Professional Co...theijes
 
Natural Image Based Visual Secret Sharing Scheme
Natural Image Based Visual Secret Sharing SchemeNatural Image Based Visual Secret Sharing Scheme
Natural Image Based Visual Secret Sharing Schemetheijes
 
A Probabilistic Approach Using Poisson Process for Detecting the Existence of...
A Probabilistic Approach Using Poisson Process for Detecting the Existence of...A Probabilistic Approach Using Poisson Process for Detecting the Existence of...
A Probabilistic Approach Using Poisson Process for Detecting the Existence of...theijes
 
Isolation and Growth Kinetic Studies Of Bacillus Methylotrophicus P10 & P11 ...
	Isolation and Growth Kinetic Studies Of Bacillus Methylotrophicus P10 & P11 ...	Isolation and Growth Kinetic Studies Of Bacillus Methylotrophicus P10 & P11 ...
Isolation and Growth Kinetic Studies Of Bacillus Methylotrophicus P10 & P11 ...theijes
 
D0311027032
D0311027032D0311027032
D0311027032theijes
 
G031101044051
G031101044051G031101044051
G031101044051theijes
 

Viewers also liked (19)

Enterprise Architecture – A Tool for Business Innovation Realization in the E...
Enterprise Architecture – A Tool for Business Innovation Realization in the E...Enterprise Architecture – A Tool for Business Innovation Realization in the E...
Enterprise Architecture – A Tool for Business Innovation Realization in the E...
 
Exposure to Ionizing Radiation and Radiological Implications: a review of ICR...
Exposure to Ionizing Radiation and Radiological Implications: a review of ICR...Exposure to Ionizing Radiation and Radiological Implications: a review of ICR...
Exposure to Ionizing Radiation and Radiological Implications: a review of ICR...
 
Constraints on labour productivity-a case study
Constraints on labour productivity-a case studyConstraints on labour productivity-a case study
Constraints on labour productivity-a case study
 
Energy Proficient and Security Protocol for WSN: A Review
Energy Proficient and Security Protocol for WSN: A ReviewEnergy Proficient and Security Protocol for WSN: A Review
Energy Proficient and Security Protocol for WSN: A Review
 
F031101038043
F031101038043F031101038043
F031101038043
 
Modeling of LDO-fired Rotary Furnace Parameters using Adaptive Network-based ...
Modeling of LDO-fired Rotary Furnace Parameters using Adaptive Network-based ...Modeling of LDO-fired Rotary Furnace Parameters using Adaptive Network-based ...
Modeling of LDO-fired Rotary Furnace Parameters using Adaptive Network-based ...
 
Analysis of C-C Short Cylindrical Shells under Internal Pressure using Polyno...
Analysis of C-C Short Cylindrical Shells under Internal Pressure using Polyno...Analysis of C-C Short Cylindrical Shells under Internal Pressure using Polyno...
Analysis of C-C Short Cylindrical Shells under Internal Pressure using Polyno...
 
Study Analysis & Application of Bio-Composite Smart Material
Study Analysis & Application of Bio-Composite Smart MaterialStudy Analysis & Application of Bio-Composite Smart Material
Study Analysis & Application of Bio-Composite Smart Material
 
An Overview of FACTS Controllers for Power Quality Improvement
An Overview of FACTS Controllers for Power Quality ImprovementAn Overview of FACTS Controllers for Power Quality Improvement
An Overview of FACTS Controllers for Power Quality Improvement
 
when a coil is rotated or turned under a magnetic field, there occurs a force...
when a coil is rotated or turned under a magnetic field, there occurs a force...when a coil is rotated or turned under a magnetic field, there occurs a force...
when a coil is rotated or turned under a magnetic field, there occurs a force...
 
Efficient Use of Rain Water by Altering Channel System
Efficient Use of Rain Water by Altering Channel SystemEfficient Use of Rain Water by Altering Channel System
Efficient Use of Rain Water by Altering Channel System
 
Wind Power Density Analysis for Micro-Scale Wind Turbines
Wind Power Density Analysis for Micro-Scale Wind TurbinesWind Power Density Analysis for Micro-Scale Wind Turbines
Wind Power Density Analysis for Micro-Scale Wind Turbines
 
H031101052058
H031101052058H031101052058
H031101052058
 
Contribution of Competence Teacher (Pedagogical, Personality, Professional Co...
Contribution of Competence Teacher (Pedagogical, Personality, Professional Co...Contribution of Competence Teacher (Pedagogical, Personality, Professional Co...
Contribution of Competence Teacher (Pedagogical, Personality, Professional Co...
 
Natural Image Based Visual Secret Sharing Scheme
Natural Image Based Visual Secret Sharing SchemeNatural Image Based Visual Secret Sharing Scheme
Natural Image Based Visual Secret Sharing Scheme
 
A Probabilistic Approach Using Poisson Process for Detecting the Existence of...
A Probabilistic Approach Using Poisson Process for Detecting the Existence of...A Probabilistic Approach Using Poisson Process for Detecting the Existence of...
A Probabilistic Approach Using Poisson Process for Detecting the Existence of...
 
Isolation and Growth Kinetic Studies Of Bacillus Methylotrophicus P10 & P11 ...
	Isolation and Growth Kinetic Studies Of Bacillus Methylotrophicus P10 & P11 ...	Isolation and Growth Kinetic Studies Of Bacillus Methylotrophicus P10 & P11 ...
Isolation and Growth Kinetic Studies Of Bacillus Methylotrophicus P10 & P11 ...
 
D0311027032
D0311027032D0311027032
D0311027032
 
G031101044051
G031101044051G031101044051
G031101044051
 

Similar to onstraints on labour productivity-a case study

IRJET - Productivity Improvement by Time Study and Motion Study
IRJET - Productivity Improvement by Time Study and Motion StudyIRJET - Productivity Improvement by Time Study and Motion Study
IRJET - Productivity Improvement by Time Study and Motion StudyIRJET Journal
 
Aggregate Production Planning for a Pump Manufacturing Company: Chase Strategy
Aggregate Production Planning for a Pump Manufacturing Company: Chase StrategyAggregate Production Planning for a Pump Manufacturing Company: Chase Strategy
Aggregate Production Planning for a Pump Manufacturing Company: Chase StrategyIRJET Journal
 
IRJET- Productivity Improvement in Manufacturing Industry using Lean Tools
IRJET- Productivity Improvement in Manufacturing Industry using Lean ToolsIRJET- Productivity Improvement in Manufacturing Industry using Lean Tools
IRJET- Productivity Improvement in Manufacturing Industry using Lean ToolsIRJET Journal
 
Industrial Engineering
Industrial EngineeringIndustrial Engineering
Industrial Engineeringvijay kumar
 
Introduction of Industrial Engineering
Introduction of Industrial EngineeringIntroduction of Industrial Engineering
Introduction of Industrial Engineeringvijay kumar
 
IRJET- A Case Study Approach of Quality Tools in Manufacturing Industry
IRJET- A Case Study Approach of Quality Tools in Manufacturing IndustryIRJET- A Case Study Approach of Quality Tools in Manufacturing Industry
IRJET- A Case Study Approach of Quality Tools in Manufacturing IndustryIRJET Journal
 
Production And Operation Materials
Production And Operation MaterialsProduction And Operation Materials
Production And Operation Materialspikuoec
 
Production And Operation Materials
Production And Operation MaterialsProduction And Operation Materials
Production And Operation Materialspikuoec
 
STUDIES ON AVAILABILITY AND UTILISATION OF MINING EQUIPMENT- AN OVERVIEW
STUDIES ON AVAILABILITY AND UTILISATION OF MINING EQUIPMENT- AN OVERVIEWSTUDIES ON AVAILABILITY AND UTILISATION OF MINING EQUIPMENT- AN OVERVIEW
STUDIES ON AVAILABILITY AND UTILISATION OF MINING EQUIPMENT- AN OVERVIEWIAEME Publication
 
IRJET- Preventive Maintenance of Utility Equipments at MANMUL, Gejjalagere Ma...
IRJET- Preventive Maintenance of Utility Equipments at MANMUL, Gejjalagere Ma...IRJET- Preventive Maintenance of Utility Equipments at MANMUL, Gejjalagere Ma...
IRJET- Preventive Maintenance of Utility Equipments at MANMUL, Gejjalagere Ma...IRJET Journal
 
International Journal of Engineering Research and Development
International Journal of Engineering Research and DevelopmentInternational Journal of Engineering Research and Development
International Journal of Engineering Research and DevelopmentIJERD Editor
 
Critical Study, Analysis and Suggestion for Labor Productivity Improvement in...
Critical Study, Analysis and Suggestion for Labor Productivity Improvement in...Critical Study, Analysis and Suggestion for Labor Productivity Improvement in...
Critical Study, Analysis and Suggestion for Labor Productivity Improvement in...IRJET Journal
 
IRJET- Application of Work Study in Construction Project
IRJET-  	  Application of Work Study in Construction ProjectIRJET-  	  Application of Work Study in Construction Project
IRJET- Application of Work Study in Construction ProjectIRJET Journal
 
J0371055062
J0371055062J0371055062
J0371055062theijes
 
TIME STUDY – A KEY TECHNIQUE FOR PRODUCTIVITY IMPROVEMENT
TIME STUDY – A KEY TECHNIQUE FOR PRODUCTIVITY IMPROVEMENTTIME STUDY – A KEY TECHNIQUE FOR PRODUCTIVITY IMPROVEMENT
TIME STUDY – A KEY TECHNIQUE FOR PRODUCTIVITY IMPROVEMENTIRJET Journal
 

Similar to onstraints on labour productivity-a case study (20)

IRJET - Productivity Improvement by Time Study and Motion Study
IRJET - Productivity Improvement by Time Study and Motion StudyIRJET - Productivity Improvement by Time Study and Motion Study
IRJET - Productivity Improvement by Time Study and Motion Study
 
Aggregate Production Planning for a Pump Manufacturing Company: Chase Strategy
Aggregate Production Planning for a Pump Manufacturing Company: Chase StrategyAggregate Production Planning for a Pump Manufacturing Company: Chase Strategy
Aggregate Production Planning for a Pump Manufacturing Company: Chase Strategy
 
IRJET- Productivity Improvement in Manufacturing Industry using Lean Tools
IRJET- Productivity Improvement in Manufacturing Industry using Lean ToolsIRJET- Productivity Improvement in Manufacturing Industry using Lean Tools
IRJET- Productivity Improvement in Manufacturing Industry using Lean Tools
 
K012556370
K012556370K012556370
K012556370
 
K012556370
K012556370K012556370
K012556370
 
Industrial Engineering
Industrial EngineeringIndustrial Engineering
Industrial Engineering
 
Introduction of Industrial Engineering
Introduction of Industrial EngineeringIntroduction of Industrial Engineering
Introduction of Industrial Engineering
 
IRJET- A Case Study Approach of Quality Tools in Manufacturing Industry
IRJET- A Case Study Approach of Quality Tools in Manufacturing IndustryIRJET- A Case Study Approach of Quality Tools in Manufacturing Industry
IRJET- A Case Study Approach of Quality Tools in Manufacturing Industry
 
Production And Operation Materials
Production And Operation MaterialsProduction And Operation Materials
Production And Operation Materials
 
Production And Operation Materials
Production And Operation MaterialsProduction And Operation Materials
Production And Operation Materials
 
Bus 103 final 2014
Bus 103 final 2014Bus 103 final 2014
Bus 103 final 2014
 
STUDIES ON AVAILABILITY AND UTILISATION OF MINING EQUIPMENT- AN OVERVIEW
STUDIES ON AVAILABILITY AND UTILISATION OF MINING EQUIPMENT- AN OVERVIEWSTUDIES ON AVAILABILITY AND UTILISATION OF MINING EQUIPMENT- AN OVERVIEW
STUDIES ON AVAILABILITY AND UTILISATION OF MINING EQUIPMENT- AN OVERVIEW
 
IRJET- Preventive Maintenance of Utility Equipments at MANMUL, Gejjalagere Ma...
IRJET- Preventive Maintenance of Utility Equipments at MANMUL, Gejjalagere Ma...IRJET- Preventive Maintenance of Utility Equipments at MANMUL, Gejjalagere Ma...
IRJET- Preventive Maintenance of Utility Equipments at MANMUL, Gejjalagere Ma...
 
International Journal of Engineering Research and Development
International Journal of Engineering Research and DevelopmentInternational Journal of Engineering Research and Development
International Journal of Engineering Research and Development
 
A Case Study on Reducing in Lead Time by Using Value Stream Mapping
A Case Study on Reducing in Lead Time by Using Value Stream MappingA Case Study on Reducing in Lead Time by Using Value Stream Mapping
A Case Study on Reducing in Lead Time by Using Value Stream Mapping
 
Critical Study, Analysis and Suggestion for Labor Productivity Improvement in...
Critical Study, Analysis and Suggestion for Labor Productivity Improvement in...Critical Study, Analysis and Suggestion for Labor Productivity Improvement in...
Critical Study, Analysis and Suggestion for Labor Productivity Improvement in...
 
IRJET- Application of Work Study in Construction Project
IRJET-  	  Application of Work Study in Construction ProjectIRJET-  	  Application of Work Study in Construction Project
IRJET- Application of Work Study in Construction Project
 
IJEBEA14-419
IJEBEA14-419IJEBEA14-419
IJEBEA14-419
 
J0371055062
J0371055062J0371055062
J0371055062
 
TIME STUDY – A KEY TECHNIQUE FOR PRODUCTIVITY IMPROVEMENT
TIME STUDY – A KEY TECHNIQUE FOR PRODUCTIVITY IMPROVEMENTTIME STUDY – A KEY TECHNIQUE FOR PRODUCTIVITY IMPROVEMENT
TIME STUDY – A KEY TECHNIQUE FOR PRODUCTIVITY IMPROVEMENT
 

Recently uploaded

TrustArc Webinar - Unlock the Power of AI-Driven Data Discovery
TrustArc Webinar - Unlock the Power of AI-Driven Data DiscoveryTrustArc Webinar - Unlock the Power of AI-Driven Data Discovery
TrustArc Webinar - Unlock the Power of AI-Driven Data DiscoveryTrustArc
 
Partners Life - Insurer Innovation Award 2024
Partners Life - Insurer Innovation Award 2024Partners Life - Insurer Innovation Award 2024
Partners Life - Insurer Innovation Award 2024The Digital Insurer
 
Data Cloud, More than a CDP by Matt Robison
Data Cloud, More than a CDP by Matt RobisonData Cloud, More than a CDP by Matt Robison
Data Cloud, More than a CDP by Matt RobisonAnna Loughnan Colquhoun
 
[2024]Digital Global Overview Report 2024 Meltwater.pdf
[2024]Digital Global Overview Report 2024 Meltwater.pdf[2024]Digital Global Overview Report 2024 Meltwater.pdf
[2024]Digital Global Overview Report 2024 Meltwater.pdfhans926745
 
From Event to Action: Accelerate Your Decision Making with Real-Time Automation
From Event to Action: Accelerate Your Decision Making with Real-Time AutomationFrom Event to Action: Accelerate Your Decision Making with Real-Time Automation
From Event to Action: Accelerate Your Decision Making with Real-Time AutomationSafe Software
 
Powerful Google developer tools for immediate impact! (2023-24 C)
Powerful Google developer tools for immediate impact! (2023-24 C)Powerful Google developer tools for immediate impact! (2023-24 C)
Powerful Google developer tools for immediate impact! (2023-24 C)wesley chun
 
Strategies for Landing an Oracle DBA Job as a Fresher
Strategies for Landing an Oracle DBA Job as a FresherStrategies for Landing an Oracle DBA Job as a Fresher
Strategies for Landing an Oracle DBA Job as a FresherRemote DBA Services
 
Automating Google Workspace (GWS) & more with Apps Script
Automating Google Workspace (GWS) & more with Apps ScriptAutomating Google Workspace (GWS) & more with Apps Script
Automating Google Workspace (GWS) & more with Apps Scriptwesley chun
 
Handwritten Text Recognition for manuscripts and early printed texts
Handwritten Text Recognition for manuscripts and early printed textsHandwritten Text Recognition for manuscripts and early printed texts
Handwritten Text Recognition for manuscripts and early printed textsMaria Levchenko
 
🐬 The future of MySQL is Postgres 🐘
🐬  The future of MySQL is Postgres   🐘🐬  The future of MySQL is Postgres   🐘
🐬 The future of MySQL is Postgres 🐘RTylerCroy
 
The 7 Things I Know About Cyber Security After 25 Years | April 2024
The 7 Things I Know About Cyber Security After 25 Years | April 2024The 7 Things I Know About Cyber Security After 25 Years | April 2024
The 7 Things I Know About Cyber Security After 25 Years | April 2024Rafal Los
 
Scaling API-first – The story of a global engineering organization
Scaling API-first – The story of a global engineering organizationScaling API-first – The story of a global engineering organization
Scaling API-first – The story of a global engineering organizationRadu Cotescu
 
Workshop - Best of Both Worlds_ Combine KG and Vector search for enhanced R...
Workshop - Best of Both Worlds_ Combine  KG and Vector search for  enhanced R...Workshop - Best of Both Worlds_ Combine  KG and Vector search for  enhanced R...
Workshop - Best of Both Worlds_ Combine KG and Vector search for enhanced R...Neo4j
 
Apidays New York 2024 - The value of a flexible API Management solution for O...
Apidays New York 2024 - The value of a flexible API Management solution for O...Apidays New York 2024 - The value of a flexible API Management solution for O...
Apidays New York 2024 - The value of a flexible API Management solution for O...apidays
 
2024: Domino Containers - The Next Step. News from the Domino Container commu...
2024: Domino Containers - The Next Step. News from the Domino Container commu...2024: Domino Containers - The Next Step. News from the Domino Container commu...
2024: Domino Containers - The Next Step. News from the Domino Container commu...Martijn de Jong
 
Axa Assurance Maroc - Insurer Innovation Award 2024
Axa Assurance Maroc - Insurer Innovation Award 2024Axa Assurance Maroc - Insurer Innovation Award 2024
Axa Assurance Maroc - Insurer Innovation Award 2024The Digital Insurer
 
Understanding Discord NSFW Servers A Guide for Responsible Users.pdf
Understanding Discord NSFW Servers A Guide for Responsible Users.pdfUnderstanding Discord NSFW Servers A Guide for Responsible Users.pdf
Understanding Discord NSFW Servers A Guide for Responsible Users.pdfUK Journal
 
How to Troubleshoot Apps for the Modern Connected Worker
How to Troubleshoot Apps for the Modern Connected WorkerHow to Troubleshoot Apps for the Modern Connected Worker
How to Troubleshoot Apps for the Modern Connected WorkerThousandEyes
 
Artificial Intelligence: Facts and Myths
Artificial Intelligence: Facts and MythsArtificial Intelligence: Facts and Myths
Artificial Intelligence: Facts and MythsJoaquim Jorge
 
How to Troubleshoot Apps for the Modern Connected Worker
How to Troubleshoot Apps for the Modern Connected WorkerHow to Troubleshoot Apps for the Modern Connected Worker
How to Troubleshoot Apps for the Modern Connected WorkerThousandEyes
 

Recently uploaded (20)

TrustArc Webinar - Unlock the Power of AI-Driven Data Discovery
TrustArc Webinar - Unlock the Power of AI-Driven Data DiscoveryTrustArc Webinar - Unlock the Power of AI-Driven Data Discovery
TrustArc Webinar - Unlock the Power of AI-Driven Data Discovery
 
Partners Life - Insurer Innovation Award 2024
Partners Life - Insurer Innovation Award 2024Partners Life - Insurer Innovation Award 2024
Partners Life - Insurer Innovation Award 2024
 
Data Cloud, More than a CDP by Matt Robison
Data Cloud, More than a CDP by Matt RobisonData Cloud, More than a CDP by Matt Robison
Data Cloud, More than a CDP by Matt Robison
 
[2024]Digital Global Overview Report 2024 Meltwater.pdf
[2024]Digital Global Overview Report 2024 Meltwater.pdf[2024]Digital Global Overview Report 2024 Meltwater.pdf
[2024]Digital Global Overview Report 2024 Meltwater.pdf
 
From Event to Action: Accelerate Your Decision Making with Real-Time Automation
From Event to Action: Accelerate Your Decision Making with Real-Time AutomationFrom Event to Action: Accelerate Your Decision Making with Real-Time Automation
From Event to Action: Accelerate Your Decision Making with Real-Time Automation
 
Powerful Google developer tools for immediate impact! (2023-24 C)
Powerful Google developer tools for immediate impact! (2023-24 C)Powerful Google developer tools for immediate impact! (2023-24 C)
Powerful Google developer tools for immediate impact! (2023-24 C)
 
Strategies for Landing an Oracle DBA Job as a Fresher
Strategies for Landing an Oracle DBA Job as a FresherStrategies for Landing an Oracle DBA Job as a Fresher
Strategies for Landing an Oracle DBA Job as a Fresher
 
Automating Google Workspace (GWS) & more with Apps Script
Automating Google Workspace (GWS) & more with Apps ScriptAutomating Google Workspace (GWS) & more with Apps Script
Automating Google Workspace (GWS) & more with Apps Script
 
Handwritten Text Recognition for manuscripts and early printed texts
Handwritten Text Recognition for manuscripts and early printed textsHandwritten Text Recognition for manuscripts and early printed texts
Handwritten Text Recognition for manuscripts and early printed texts
 
🐬 The future of MySQL is Postgres 🐘
🐬  The future of MySQL is Postgres   🐘🐬  The future of MySQL is Postgres   🐘
🐬 The future of MySQL is Postgres 🐘
 
The 7 Things I Know About Cyber Security After 25 Years | April 2024
The 7 Things I Know About Cyber Security After 25 Years | April 2024The 7 Things I Know About Cyber Security After 25 Years | April 2024
The 7 Things I Know About Cyber Security After 25 Years | April 2024
 
Scaling API-first – The story of a global engineering organization
Scaling API-first – The story of a global engineering organizationScaling API-first – The story of a global engineering organization
Scaling API-first – The story of a global engineering organization
 
Workshop - Best of Both Worlds_ Combine KG and Vector search for enhanced R...
Workshop - Best of Both Worlds_ Combine  KG and Vector search for  enhanced R...Workshop - Best of Both Worlds_ Combine  KG and Vector search for  enhanced R...
Workshop - Best of Both Worlds_ Combine KG and Vector search for enhanced R...
 
Apidays New York 2024 - The value of a flexible API Management solution for O...
Apidays New York 2024 - The value of a flexible API Management solution for O...Apidays New York 2024 - The value of a flexible API Management solution for O...
Apidays New York 2024 - The value of a flexible API Management solution for O...
 
2024: Domino Containers - The Next Step. News from the Domino Container commu...
2024: Domino Containers - The Next Step. News from the Domino Container commu...2024: Domino Containers - The Next Step. News from the Domino Container commu...
2024: Domino Containers - The Next Step. News from the Domino Container commu...
 
Axa Assurance Maroc - Insurer Innovation Award 2024
Axa Assurance Maroc - Insurer Innovation Award 2024Axa Assurance Maroc - Insurer Innovation Award 2024
Axa Assurance Maroc - Insurer Innovation Award 2024
 
Understanding Discord NSFW Servers A Guide for Responsible Users.pdf
Understanding Discord NSFW Servers A Guide for Responsible Users.pdfUnderstanding Discord NSFW Servers A Guide for Responsible Users.pdf
Understanding Discord NSFW Servers A Guide for Responsible Users.pdf
 
How to Troubleshoot Apps for the Modern Connected Worker
How to Troubleshoot Apps for the Modern Connected WorkerHow to Troubleshoot Apps for the Modern Connected Worker
How to Troubleshoot Apps for the Modern Connected Worker
 
Artificial Intelligence: Facts and Myths
Artificial Intelligence: Facts and MythsArtificial Intelligence: Facts and Myths
Artificial Intelligence: Facts and Myths
 
How to Troubleshoot Apps for the Modern Connected Worker
How to Troubleshoot Apps for the Modern Connected WorkerHow to Troubleshoot Apps for the Modern Connected Worker
How to Troubleshoot Apps for the Modern Connected Worker
 

onstraints on labour productivity-a case study

  • 1. The International Journal Of Engineering And Science (IJES) || Volume || 4 || Issue || 4 || Pages || PP.88-97 || 2015 || ISSN (e): 2319 – 1813 ISSN (p): 2319 – 1805 www.theijes.com The IJES Page 88 Constraints on labour productivity-a case study Linjesh Sebastian1 , Prof. V Srinivasa Raghavan2 1 M.Tech student, Civil Engineering Department, Manipal University, Karnataka, India 2 Associate Professor, Civil Engineering Department, Manipal University, Karnataka, India ----------------------------------------------------------------ABSTRACT----------------------------------------------------- Productivity always acts as a main factor influencing timely completion of the project and cost control in all construction projects. Proper evaluation of labour productivity and corrective measures taken to achieve the required level of productivity will always help to keep the project in track. In this research, observations were conducted in a construction site in Kerala by adopting work sampling technique which revealed that workers are engaged in unproductive activities during 30%-40% of the normal working time. The main factors which are negatively affecting productivity were observed and their frequencies were also noted. Normality tests were conducted to analyse the data. Baseline productivity measurement and variation coefficient indicates that there is a good variation in daily productivity and so productivity can be improved by controlling these costraints on labour productivity. It was observed that activities like being simply idle, unnecessary roaming, talking, waiting for materials and tools are the main reasons for unproductiveness. Lack of proper managerial efficiency is the basic reason for all these issues. KEYWORDS: labour productivity, work sampling, coefficient of variation --------------------------------------------------------------------------------------------------------------------------------------- Date of Submission: 31-March-2015 Date of Accepted: 15-April-2015 --------------------------------------------------------------------------------------------------------------------------------------- I. INTRODUCTION: Understanding the various factors that affect labour productivity negatively or positively is very important to form a strategy that will help the construction companies to reduce costs and time delays and thus to improve overall project performance. Shehata and El-Gohary (2012) provides different definitions of labour productivity, aspects, measurements, factors affecting it, techniques used for measuring it and modeling techniques. The study focuses concentrates on baseline productivity which occurs when there are few or no disruptions In simple terms productivity can be defined as a relation between output generated from a system and input used to generate the output. Inputs generally are labour, materials, equipment etc which is brought into the system. Output can be goods and services produced using these inputs. Accurate determination of productivity is very important but productivity measurement in construction is a complex issue because of the interaction of labour, capital, materials and equipment and varying effect of various site conditions on productivity rates of most standard construction items. This paper covers data collection by work sampling method, determination of baseline productivity and various constraints to productivity with their frequencies, analysis of data, results and discussion and conclusion. II. RESEARCH METHOD: 1.1 Methodology: Work sampling method of evaluation has been recommended for measuring highly variable labor productivity in construction (Kumaraswamy and Chan 1998). Work sampling is an indirect measuring method that through instantaneous observations, allows to determine the amount of activity or inactivity in a production process. It makes a random and instantaneous number of observations of a group of machines, process (activity) or workers by the needs of each company. It is based on the fundamental law of probability: at any given time an event can be present or absent.
  • 2. Constraints on labour productivity-a case study www.theijes.com The IJES Page 89 In this method works are classified into 3 groups namely 1. Productive work - the activities directly related with construction process and affects the output. 2. Contributory work - the activities that indirectly affects the output, but commonly needed in an operation. 3. Unproductive work - idle or doing activities that is not related with the job. For example: take a walk without bringing anything, doing activities which is out of procedures, chit chat, and so on. This research aims to find the percentage productive time of various operations at the site, measuring the productive rates of these activities, identifying various factors that contribute to unproductiveness with their frequencies. 1.2 Data collection: Data for this study is collected from a G+15 apartment building of a reputed builder in Kerala. Blockwork, plastering and other general works are the various activities from which data is collected. In these plastering works were given to subcontractors and payment were made on the basis of work done per day. The other two works, blockwork and general works were on a daily labour basis and payments were not based on quantity of work done per day. To find the required number of observations in work sampling method, many construction and industrial engineering journals provide the following equation for determining sample size based on desired error, and anticipated category percentages (Groover, 2007; Picard, 2004; Stevens, 1969; Thomas Jr. et al., 1982) N= 𝑍^2∗𝑃∗(1−𝑃) 𝐿^2 (1) Where, N= no. of observations required P= estimated probability of observing a worker doing a certain activity L=limit(in percentage)of accuracy required Z=standard normal variable depending on the level of confidence For maximum N, 𝑑𝑁 𝑑𝑃 = 𝑍2 𝐿2 1 − 𝑃 = 0 (2) If the anticipated percentage P is unknown, avalue of 50% (0.5) may be used as a worst case scenario ensuring the number of samples will be overestimated. Considering 95% confidence limits, corresponding Z value = 1.96, required sample size is N= 1.962∗0.5∗0.5 0.05^2 = 385 So minimum number of observations required is 30 observations per day for 13 days. But 30 observations for 20 days were done for each activity. The purpose for large data set gathering is for accuracy. Workers were observed 30 times a day and noted were they are involved in some productive or contributory work, or engaged in unproductive activities. If they are engaged in unproductive activities those unproductive activities and their frequencies were noted. Data were collected in the prescribed format. Observation time is determined by random number, in order to no opportunity to have same time and also to guarantee the samples are taken by randomly (Sutalaksana, 1979). Random timings were generated using excel and used for these observations. Time for breakfast and lunch were excluded from the observations. Table 1.Details of labours observed Type of work No. of labours observed mason helper Blockwork 4 2 Plastering 12 6 General works - 10
  • 3. Constraints on labour productivity-a case study www.theijes.com The IJES Page 90 Thomas and Zavrski (1999a), 1999b) expressed the projects attributes in the following forms. Cumulative productivity= 𝑡𝑜𝑡𝑎𝑙 𝑞𝑢𝑎𝑛𝑖𝑡𝑦 (𝑚3) 𝑡𝑜𝑡𝑎𝑙 𝑤𝑜𝑟𝑘 ℎ𝑜𝑢𝑟 (𝑤ℎ𝑟) (3) 1.3 Baseline productivity: Baseline productivity can be defined as the best performance a contractor can achieve, on a particular project or activity. To compute baseline productivity following steps were adopted. It is determined with respect to 10 % of the total workdays that have the highest daily output or production. 1. The number established in one above should be rounded off to the next highest odd number which should not be less than (5) five. This number, n, explains the size of the baseline division. 2. The contents of the baseline division are the n workdays that have the highest daily production or output. 3. The next step is to compute the summation of the work hours and quantities for these n workdays. 4. The baseline productivity can now be expressed as the ratio of work hours and the quantities contained in the baseline division. Variability in productivity is a determinant of performance of a construction project. Well performing projects exhibit lower variability when compared to projects that perform poorly. Thomas et al. [10] emphasized the necessity to reduce variability in labour productivity to improve performance of construction projects. Variability in daily productivity is calculated using the following equation given by Thomas et al[1]: Variation (Vj) = ∑√ (𝑑𝑝𝑖𝑗 −𝑏𝑎𝑠𝑒𝑙𝑖𝑛𝑒 𝑝𝑟𝑜𝑑𝑢𝑐𝑡𝑖𝑣𝑖𝑡𝑦𝑗 ^2) 𝑛 (4) Where dpij= daily productivity (unit rate) for workday on project j and n = number of workdays on project j The variation Vj for different projects cannot be compared directly unless the baseline productivity values are the same. Therefore, coefficient of variation is calculated for each project as follows: Coefficient of Variation (CVj) = 𝑉𝑗 ∗100 𝑏𝑎𝑠𝑒𝑙𝑖𝑛𝑒 𝑝𝑟𝑜𝑑𝑢𝑐𝑡𝑖𝑣𝑖𝑡𝑦 𝑗 (5) Abdel – Razek et al. (2007) suggested that better labour and cost performance can be achieved by reducing variability. III. RESULTS AND DISCUSSION: Table 2. Chart showing percentage productive time and daily quantity in plastering Sl.no % productive time Average % productive time Total area plastered per day(M2 ) M2 /whr Baseline productivity daysBatch 1 Batch 2 Batch 3 1 64.76 76.11 61.33 67.59 184.93 1.142 2 72.38 71.67 64 69.82 184.97 1.142 3 72.38 79.45 77.33 76.11 212.92 1.315 * 4 66.19 69.45 64 66.67 182.75 1.129 5 78.57 81.11 68 71.85 197.43 1.219 6 65.72 73.89 64 67.96 176.35 1.089 7 78.09 83.89 69.34 77.59 214.24 1.323 * 8 80.48 78.89 70.67 77.22 197.66 1.221 9 66.19 73.89 70 69.81 182.49 1.127 10 71.43 72.22 66.66 70.37 192.28 1.187 11 73.33 76.66 60 70.74 190.86 1.179 12 67.61 68.89 64 67.04 190.72 1.178 13 71.42 75.56 65.33 71.11 201.12 1.242 * 14 69.52 73.33 61.34 68.52 183.26 1.132 15 67.14 68.89 66.67 67.6 195.42 1.207 16 76.19 81.11 62.67 74.07 198.79 1.228 * 17 76.66 74.44 64.66 72.59 188.94 1.167 18 72.86 75.56 67.34 72.22 198.02 1.223 * 19 61.9 61.67 58 60.74 165.76 1.024 20 65.72 70.56 59.33 65.56 179.21 1.107 Average 70.927 74.362 65.45 70.259 190.91 1.179
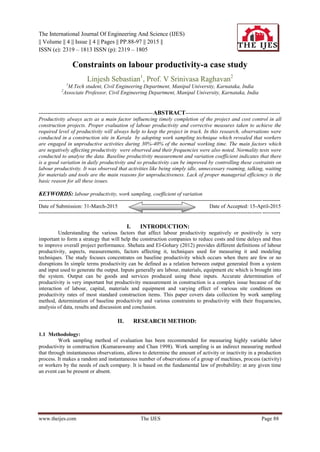
  • 4. Constraints on labour productivity-a case study www.theijes.com The IJES Page 91 Figure 1. Relation showing percentage of productive time and quantity of plastering work done Table 3. Chart showing percentage productive time and daily quantity in blockwork Sl.No average % productive time quantity of work done each day (m3 ) M3 /whr Baseline productivity days 1 55.45 1.45 0.027 2 58.52 1.55 0.029 3 60.95 1.8 0.034 4 62.47 2.12 0.04 5 61.24 2.2 0.041 * 6 64.85 2.25 0.042 * 7 63.25 2.2 0.041 * 8 65.75 2.7 0.05 * 9 61.22 2.1 0.039 10 60.28 2.2 0.041 11 63.36 2.18 0.041 12 64.2 2.5 0.047 * 13 60.55 1.95 0.037 14 62.82 2.08 0.039 15 61.26 2.15 0.04 16 62 2.04 0.038 17 60.48 1.85 0.035 18 62.64 2.06 0.039 19 59.85 1.6 0.03 20 60.42 1.96 0.037
  • 5. Constraints on labour productivity-a case study www.theijes.com The IJES Page 92 Figure 2. Relation showing percentage of productive time and quantity of block work done Table 4. Chart showing percentage productive time during general works Sl.No. Average % productive time 1 64.67 2 63.67 3 65.33 4 65.33 5 65.67 6 63 7 66 8 62.67 9 62 10 62.67 11 63 12 60 13 60.33 14 62.33 15 66.67 16 61.33 17 57.33 18 59 19 64.33 20 60.5 Figure 3. Average percentage productive time during general works
  • 6. Constraints on labour productivity-a case study www.theijes.com The IJES Page 93 Table 5. Average % productive time of various activities Nature of work Average % productive time Blockwork 61.58 Plastering 70.26 General works 62.79 Average % productive time 64.88 From the data obtained and graphs plotted it is clear that there exists some relation between average % productive time measured and quantity of work done. It can be noticed that in most cases the quantity of work done increases when there is an increase in the observed percentage of productive time. The values show that around 30%-40% of the time, workers are engaged in unproductive activities. This is a major contribution to cost overrun and project delays. Results shows that, considering the 3 works observed, the average percentage productive time is only 64.88% which means the labours were spending 35.12% of their time for non-productive activities. Among these the subcontract works have more percentage of productive time compared to works carried out using labours directly employed. This is because the subcontract works were paid according to the quantity of work done and the more the quantity of work they can finish, the more payment they will receive. Table 6. Performance measures: Type of work Cumulative productivity Baseline productivity Mean median Variation(Vj) Coefficient of Variation(CVj) Blockwork 0.038 0.04 0.0384 0.039 0.0065 14.88 Plastering 1.179 1.266 1.1791 1.1785 0.097 7.71 The cumulative productivity, variation and coefficients of productivity variation were calculated as per equations (3), (4) and (5) and the values are presented in table. These values shows that coefficient of variation is 14.88 in block laying and 7.71 in plastering. This suggests that there is still room for improvement of productivity. Reducing variability will bring about improvement in labour performance. From the percentage productive time observations it is noticed that 30-40% time workers are engaged in unproductive activities. While considering all these factors it is evident that there aa lot of spaces for improvement in productivity. Normality test was conducted on the productivity data and observed that for plastering, the mean of the estimate was higher than the median. This indicates that the frequency distribution is not symmetrical. It is a skewed distribution. The analysis further indicates that the distribution is positively skewed having a skewness value of 0.124 and standard deviation of 0.411. For blockwork mean of the estimate was lower than median. This also indicates that the frequency distribution is not symmetrical. The distribution is negatively skewed having a skewness value of -0.218 and standard deviation of 0.668.
  • 7. Constraints on labour productivity-a case study www.theijes.com The IJES Page 94 Table 7. No.of observations for eachunproductive acitivity Sl. No. Description of distraction Frequency of distractions Blockwork Plastering General works Total No. % No. % No. % No. % 1 Simply idle 769 56.3 1535 49.09 1238 56.02 3542 52.85 2 From stockyard 35 2.56 44 1.41 0 0 79 1.18 3 Waiting for materials from helpers 84 6.15 116 3.71 0 0 200 2.99 4 Waiting for tools from store 13 0.95 6 0.2 264 11.95 283 4.23 5 Waiting for materials from other workers 5 0.36 78 2.5 11 0.5 94 1.41 6 Rework 12 0.88 249 7.97 0 0 261 3.9 7 Waiting for instructions/ inspection 18 1.32 135 4.32 97 4.39 250 3.73 8 Waiting for co- workers 0 0 47 1.51 43 1.95 90 1.35 9 Using mobile phone 36 2.63 105 3.36 29 1.32 170 2.54 10 Roaming 198 14.5 419 13.4 270 12.22 887 13.24 11 Talking with co- workers 168 12.3 351 11.23 208 9.42 727 10.85 12 Drinking water 12 0.88 26 0.84 43 1.95 81 1.21 13 Personal hygiene 16 1.17 16 0.52 7 0.32 39 0.59 Total 1366 100 3127 100 2210 100 6703 100 49% 1%4%0%3%8% 4%2% 3% 13% 11% 1%1% PERCENTAGE OF VARIOUS DISTRACTIONS DURING PLASTERING 1 2 3 4 5 6 7 8 9 10 11 12 13
  • 8. Constraints on labour productivity-a case study www.theijes.com The IJES Page 95 Among the various unproductive activities, it is observed that being idle is the main reason for loss in productivity while considering all the three works viz, blockwork, plastering and general works. Eventhough a portion of idle observations can be considered as rest during the works, but a good portion of idleness can be accounted to spend time without doing anything productive. It can be noticed that more than half(52.85%) of the total unproductive observations accounts for being simply idle. These values are exclusive of time spend for breakfast and lunch time. The second main reason for unproductiveness is unwanted roaming which accounts for about 13.24% of the total unproductive observations. The other main reason for unproductiveness is chatting with co-workers. It accounts for about 10.85% of the total unproductive observations. This shows the workers negative attitude to work. The limited number of site engineers/supervisors makes it difficult to supervise all activities when the work is carried out in many floors. 56% 3%6% 1% 0%1% 1% 0% 3% 15% 12% 1%1% PERCENTAGE OF VARIOUS DISTRACTIONS DURING BLOCKWORK 1 2 3 4 5 6 7 8 9 10 11 12 13 41% 0%0% 22% 0% 0%4% 4% 0% 14% 10% 4% 1% PERCENTAGE OF VARIOUS DISTRACTIONS DURING GENERAL WORKS 1 2 3 4 5 6 7 8 9 10 11 12 13 53% 1%3%4% 1% 4% 4% 1% 3% 13% 11% 1%1% PROPORTION OF DISTRACTIONS WHILE CONSIDERING ALL WORKS 1 2 3 4 5 6 7 8 9 10 11 12 13
  • 9. Constraints on labour productivity-a case study www.theijes.com The IJES Page 96 The other reason is waiting for materials at job site from stock yard. This is mainly because there was only one hoist for shifting materials to all the 15 floors and this hoist will be always busy due to shifting of civil, electrical and plumbing materials to different contractors and labours at different floors and because of these, there will be a long queue to shift materials near the hoist mostly at mornings. The company personnel tried to arrange materials to all contractors by shifting materials during times other than normal working time but it was not effective always. The masons before starting plastering will be idle for some time at morning till their workplace is cleaned and getting their mortar ready from the helpers. From the observations it is noticed that if there are no sufficient number of helpers, the masons will be idle for more time. It is evident from the plastering activities in which work is carried out by 3 teams comprising of different number of mason helper combination. In team A, there were 5 masons and 2 helpers, in team B, there were 4 masons and 2 helpers and in team C, there were 3 masons and 2 helpers. The team A masons took more time to start their work at morning because of the improper crew composition. It was noticed that the helpers were more engaged in contributory activities to satisfy the requirements of masons and in many times masons were idle due to unavailability of mortar or tools. But at the same time, team 3 having 3 helpers for 2 masons were also not a good combination because the helpers were idle for more time as they have no work. Workers waiting for tools were one of the main reasons for loss of productivity. It was because of the delay in issuing tools to the labours. The daily work planning and deployment of labours for various works which is done at morning takes some time. Also there was shortage of tools which makes the site engineers to re-allot the labours to other works. All these are time consuming and will result in wastage of productive time. The other issue is waiting for instructions or inspection. The direct employed labours will be waiting for instructions from the site supervisors while doing general works like shifting materials, cleaning, chipping and cutting etc. This may happen because of the poor communication problems between supervisors and labours and also due to the different activities they are doing in different days. The labours mainly from other states may not understand the instructions clearly even though the instructions were given in hindi as many labours know their own local language only. Sometimes labours will be waiting for inspection from site supervisors or engineers after completing the whole work or part of it. This is because the workers may not be sure about the quality of work they have done and so a green signal from the engineers/supervisors will give confidence for them to proceed the work. Waiting for co-workers is other issue which arise due to the mistakes in labour allotment for various works. Some works cannot be done individually and so labours will be waiting for their co-workers. Also when working as a pair, one person will go for his hygiene requirements or drinking water or will be using mobile phone which makes the other person idle. The solution to this problem is to provide sources of drinking water in different floors of building. Also providing toilet facilities in 2 or 3 floors of the entire building will help to save time for these purposes. Rework was another hurdle for the progress of the work. Time taken for rework varies between 30-45 minutes per mason per day. Eventhough many factors contributed to rework, poor condition of tools, delay in inspection or delay in giving instructions are the main causes of rework. IV. CONCLUSION: The study showing losses in productivity clearly indicates the improper management of a construction project. Only 60-70 % of time the labours found working. Even by closing the gap between baseline productivity and normal productivity rates, performance can be improved. Improper material planning and insufficient number of tools and equipment contributed a lot to the loss of productivity. Lack of proper supervision due to insufficient number of supervisors and engineers also contributed mainly to the productivity losses. All these factors mainly confirm to the managerial inefficiencies in most cases. As labourwages are high, labour productivity can be improved by raising human performance and by reducing non value-added activities.Labour productivity improvement will automatically upgrade the level of value added activities and thereby reduces the chances for cost overrun and time delays.
  • 10. Constraints on labour productivity-a case study www.theijes.com The IJES Page 97 REFERENCES: [1]. Thomas, H. R. and Zavrski, I. (1999). “Construction baseline productivity: Theory and practice”. Journal of Construction Engineering and Management, 125(5), pp.295 – 303. [2]. Enshassi, A., Mohamed, S., Mayer, P. and Abed, K. (2007). “Benchmarking masonry labour productivity”. International Journal of Productivity and Performance Management, 56(4),pp.358 – 368. [3]. Thomas, H.R. and Zavrski, I. (1999 b). “Construction Baseline Productivity: Theory and Practice”. Journal of Construction Engineering and management, 125(5). [4]. Jarkas, A. M. and Bitar, C. G. (2012). Factors affecting construction labour productivity in Kuwait. Journal of Construction Engineering and Management, 138(7), 811 – 820 [5]. Bandyopadhyay.A and Smith.R.(2004).”A Senior Project in Construction Management Technology Based on Work sampling”. Proceedings of the 2004 American Society for Engineering Education Annual Conference & Exposition. [6]. Gouett.M.C. (2010). “Activity Analysis for Continuous Productivity Improvement in Construction”. Ph. D. dissertation, University of Waterloo, Canada. [7]. Idiake, J. E. and Bala, K. (2014) “Diminution in Variability of Blockwork Labour Productivity: A Panacea for Improving Labour Performance”. Journal of Economics and Sustainable Development, 5(4). [8]. Ulubeyli, Serdar., Kazaz, Aynur., and Bayram.(2014)“Planning Engineers’ Estimates On Labor Productivity: Theory And Practice”. Procedia - Social and Behavioral Sciences 119, pp. 12-19. [9]. Shehata,Mostafa., El-Gohary, Khaled. (2011). “Towards improving construction labor productivity and projects’ performance”. Alexandria Engineering Journal, 50, pp.321–330. [10]. Idiake, J. E. and Bala, K. (2012). “Improving labour productivity in masonry work in Nigeria: The application of lean management techniques”. Proceedings of 4th West Africa Built Environment Research Conference, Abuja, Nigeria, 24 – 26 July, 2012, pp. 677 – 686. [11]. Ameh, O.J., &Osegbo, E.E. (2011). “Study of relationship between time overrun and productivity on construction sites”. International Journal of Construction Supply Chain Management 1 (1). 56-67.