
Recommended
More Related Content
Similar to PS_Roundup_2015_EPPN.pdf
Similar to PS_Roundup_2015_EPPN.pdf (20)
More from tachet
Recently uploaded
Recently uploaded (20)
PS_Roundup_2015_EPPN.pdf
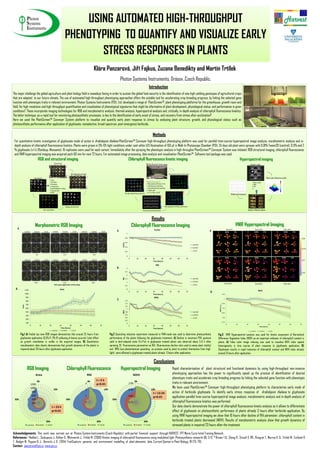
- 1. Klára Panzarová, Jiří Fajkus, Zuzana Benedikty and Martin Trtílek Photon Systems Instruments, Drásov, Czech Republic. USING AUTOMATED HIGH-THROUGHPUT PHENOTYPING TO QUANTIFY AND VISUALIZE EARLY STRESS RESPONSES IN PLANTS The major challenge the global agriculture and plant biology field is nowadays facing in order to sustain the global food security is the identification of new high-yielding genotypes of agricultural crops that are adapted to our future climate. The use of automated high-throughput phenotyping approaches offers the suitable tool for accelerating crop breeding progress, by linking the selected gene function with phenotypic traits in relevant environment. Photon Systems Instruments (PSI), Ltd. developed a range of PlantScreenTM, plant phenotyping platforms for the greenhouse, growth room and field, for high-resolution and high-throughput quantification and visualisation of phenotypical signatures that might be informative of plant development, physiological status, and performance in given conditions1. These incorporate imaging technologies for RGB and morphometric analysis, thermal analysis, hyperspectral analysis and, critically, in-depth analysis of chlorophyll fluorescence kinetics. The latter technique, as a rapid tool for monitoring photosynthetic processes, is key to the identification of early onset of stress, and recovery from stress after acclimation2. Here we used the PlantScreenTM Conveyer System platform to visualise and quantify early plant response to stress by analysing plant structure, growth, and physiological status such as photosynthetic performance after application of glyphosate, nonselective, broad-spectrum, post-emergence herbicide. RGB and structural imaging Chlorophyll fluorescence kinetic imaging Methods For quantitative kinetic investigation of glyphosate mode of action in Arabidopsis thaliana PlantScreenTM Conveyer high-throughput phenotyping platform was used for parallel time-course hyperspectral image analysis, morphometric analysis and in- depth analysis of chlorophyll fluorescence kinetics. Plants were grown in 12h-12h light conditions under cool-white LED illumination of 150 µE in Walk-In Phytoscope Chamber (PSI). 24 days old plant were sprayec with 0.01% Tween20 (control), 0.5% and 2 % glyphosate (v/v) (Rondoup, Monsanto). 16 replicates were used for each variant. Immediately after the spraying the phenotypic analysis in high-throughut PlantScreenTM Conveyer System was initiated. RGB structural imaging, chlorophyll fluorescence and VNIR hyperspectral imaging was acquired each 60 min for next 72 hours. For automated image processing, data analysis and visualisation PlantScreenTM Software tool package was used. Hyperspectral imaging Original image Watercontent NDVI PRI ..... Plant scale reflectance profile Specific reflective indices Reflectance histogram Fig.6 Rapid rehydration stress was used to asses rate of water content loss by water absorption measuremnt with SNIR hyperspectral camera. Acknowledgements: This work was carried out at Photon System Instruments (Czech Republic) with partial financial support through HARVEST FP7 Marie Curie Initial Training Network. References: 1 Nedbal L., Soukupova J., Kaftan D., Whitmarsh J., Trtilek M. (2000) Kinetic imaging of chlorophyll fluorescence using modulated light. Photosynthesis research 66, 3-12. 2 Brown T.B., Cheng R., Sirault X. RR., Rungrat T., Murray K. D., Trtilek M., Furbank R. T., Badger M., Pogson B. J. , Borevitz J. O. (2014) TraitCapture: genomic and environment modelling of plant phenomic data. Current Opinion in Plant Biology, 18 (73–79). Contact: panzarova@psi.cz, www.psi.cz Max light adapted fluorescence(Fp) Time (us) Time (us) Time (us) Time (us) Time (us) Time (us) Time (us) Time (us) Time (us) Time (us) Time (us) Time (us) Time (us) Time (us) Time (us) Time (us) Time (us) Time (us) Time (us) Time (us) PAM light LED panel for kinetic imaging FO, FM, FV, FO', FM', FV', Ft Max quantum efficinecy Fv/Fm Photochemical quenching Non-photochemical quenching Vitality index FV'/FM', PhiPSII , qN, qP Fluorescence kinetics measurement Mask application and bckgr substraction Fluorescence quenching kinetics Results Morphometric RGB Imaging VNIR Hyperspectral Imaging Chlorophyll Fluorescence Imaging 200 300 400 500 600 700 800 900 1000 1100 0 10 20 30 40 50 60 70 Area Time (hours) Area control 0.5% R 2 % R 0 h 15 h 30 h 40 h 50 h 60 h Time upon application of Roundup control 0.5% R 2 % R control 0.5% R 2 % R control 0.5% R 2 % R control 0.5% R 2 % R control 0.5% R 2 % R control 0.5% R 2 % R <0.75 <0.7 <0.6 <0.8 Time 0 h Time 10 h Time 20 h Time 30 h Time 40 h Time 50 h C 0.5% 2 % C 0.5% 2 % C 0.5% 2 % C 0.5% 2 % C 0.5% 2 % C 0.5% 2 % 0.75 0.8 0.85 0.9 0.95 1 1.05 0 10 20 30 40 50 60 70 NDVI (r.u.) Time (hours) NDVI control 0.5% R 2 % R Fig.1 A) Visible top view RGB images demonstrate that around 25 hours from glyphosate application (0.5% R, 2% R) yellowing of leaves occured. Later effect as growth retardation is visible in the acquired images. B) Quantitative morphometric data clearly demonstrate that growth dynamics of the plants is impaired about 20 hours after glyphosate application. 0 0.2 0.4 0.6 0.8 1 1.2 1.4 1.6 0 10 20 30 40 50 60 70 NPQ Time (hours) NPQ control 0.5% R 2 % R 0 0.5 1 1.5 2 2.5 3 0 10 20 30 40 50 60 70 Rfd Time (hours) Rfd control 0.5% R 2 % R 0 0.2 0.4 0.6 0.8 1 0 10 20 30 40 50 60 70 FV/Fm Time (hours) Fv/Fm control 0.5% R 2 % R A. B. A. B. C. Fig.2 Quenching induction experiment measured in PAM-mode was used to determine photosynthetic performance of the plants following the glyphosate treatment. A) Decline in maximum PSII quantum yield in dark-adapted state (Fv/Fm) in glyphosate treated plants was observed about 5-6 h after spraying. B) Fluorescence parametres as Rfd (fluorescence decline ratio used to asses plant vitality) and NPQ (non-photochemical quenching as process used by plant to protect themselves from high- light) were affected in glyphosate treated plants already 3 hours after application. Fig.3 VNIR Hyperspectral analysis was used for kinetic assesment of Normalized Difference Vegetation Index (NDVI) as an important indicator of chlorophyll content in plants. A) False color image indexing was used to visualise NDVI index spatial heterogeneity in time course of plant response to glyphosate application. B) Glyphosate results in rapid reduction of chlorophyll content and NDVI index already around 13 hours after application. A. B. Conclusions Introduction 0.75 0.85 0.95 1.05 control 0.5%R 2 % R 0 1 2 3 control 0.5%R 2 % R 200 400 600 800 1000 1200 control 0.5%R 2 % R Area Rfd NDVI t = 23 h p<0.01 t = 3 h p<0.01 t = 13.5h p<0.01 0h 50h 30h 10h 0h 50h 30h 10h 0h 50h 30h 10h Rapid characterisation of plant structural and functional dynamics by using high-throughput non-invasive phenotyping approaches has the power to significantly speed up the process of identification of desired phenotypic traits and accelerate crop breeding progress by linking the selected gene function with phenotypic traits in relevant environment. We have used PlantScreenTM Conveyer high-throughput phenotyping platform to characterise early mode of action of herbicide glyphosate. To identify early stress response of Arabidopsis thaliana to glyphosate application parallel time-course hyperspectral image analysis, morphometric analysis and in-depth analysis of chlorophyll fluorescence kinetics was performed. Our data clearly demonstrate the power of chlorophyll fluorescence kinetic analysis as it allows to differentiate effect of glyphosate on photosynthetic performace of plants already 3 hours after herbicide application. By using VNIR hyperspectral imaging we show that 10 hours after decline of Rfd parameter, chlorophyll content in herbicide treated plants decreased (NDVI). Results of morphometric analysis show that growth dynamics of stressed plants in impaired 23 hours after the treatment. RGB Imaging Chlorophyll Fluorescence Hyperspectral Imaging Original image Barrel distortion correction Color segmentation Background subtraction Maskdetection Area Perimeter Roundness Compactness Leafdevelopment tracking Greening index RLGR