SlideShare a Scribd company logo
1 of 54
PowerPoint presentation and a one page Word document:
You should focus on the following:
1: What is the issue/topic?
2: Why is it important? Who cares?
3: What did the authors find in their research?
4: What did you like about the research? What were potential
flaws/shortcomings of the research?
5: Propose your research that improves/expands upon what the
authors did in this study.
Discussion 1 (Emerging Threats and Counter Measures) 400
Words
Wikis for Learning and Collaboration
A wiki is a collaborative web site that collects and organizes
content, created and revised by its users. The most well-known
example is Wikipedia. Wikis are a way to grow a knowledge
base around a particular content area, be it best practices in a
particular field or how to use a specific piece of
hardware/software. A hallmark of Web 2.0 is that it improves as
more people use it and this approach underlies wiki-based
learning. It is based on the idea that within any enterprise, a
great deal of knowledge exists among the members. Sharing this
knowledge and information can raise the organization’s
intelligence level, be it a university, an association, a
corporation or club.
How basic discretion steps can help in countermeasures?
Conduct your own research and post a short relevant summary
of your findings. ( Post current information, not older than five
years ). Use not more than three (3) references.
TextBook:
Amoroso, E. G. (2012). Cyber-attacks: protecting national
infrastructure. Elsevier.
Discussion 2 (InfoTech in a Global Economy) – 400 words
Do you feel that countries and companies need explicit
strategies for technology development, given the tremendous
amount of largely spontaneous creativity that occurs today,
often in areas where new technologies are not expected to exert
a great influence. Why or why not?
Please make your initial post and two response posts
substantive. A substantive post will do at least TWO of the
following:
· Ask an interesting, thoughtful question pertaining to the topic
· Answer a question (in detail) posted by another student or the
instructor
· Provide extensive additional information on the topic
· Explain, define, or analyze the topic in detail
· Share an applicable personal experience
· Provide an outside source (for example, an article from the UC
Library) that applies to the topic, along with additional
information about the topic or the source (please cite properly
in APA)
· Make an argument concerning the topic.
At least one scholarly source should be used in the initial
discussion thread. Be sure to use information from your
readings and other sources from the UC Library. Use proper
citations and references in your post.
TextBook:
Bashir, I. (2017). Mastering Blockchain. Birmingham, UK:
Packt Publishing. (UC Library)
• Kressel, H., & Lento, T. V. (2012). Entrepreneurship in the
Global Economy : Engine for Economic Growth. Cambridge,
UK: Cambridge University Press. (Included through library
subscription)
• Medina, C. (2016). Federal Cybersecurity : Strategy and
Implementation for Research and Development. New York:
Nova Science Publishers, Inc. (Included through library
subscription)
• Olsen, S., & National Academy of Engineering (U.S.). (2011).
Global Technology : Changes and Implications: Summary of a
Forum. Washington, D.C.: National Academies Press. (UC
Library)
Journal of Travel Research
2017, Vol. 56(5) 563 –577
© The Author(s) 2016
Reprints and permissions:
sagepub.com/journalsPermissions.nav
DOI: 10.1177/0047287516657891
journals.sagepub.com/home/jtr
Research Article
Introduction
Technologies, such as the Internet and mobile technologies,
are particularly prominent in the travel industry (Giebelhausen
et al. 2014) and have become a major channel for travel com-
merce (Ert and Fleischer, 2016; Tussyadiah and Wang, 2016).
Hotels, airlines, and attractions are augmenting traditional
face-to-face service strategies with technology-enabled ser-
vice (TES) interactions. Businesses implement technologies
(e.g., online booking and review sites) to aid travelers’ deci-
sion marking and trip planning (Xiang et al. 2015). On-site,
technologies (e.g., podcast and smartphone) enable effective
problem solving for travelers and can offer effective means of
interpretations, significantly enhancing learning outcomes,
enjoyment, and experience (Kang and Gretzel 2012a, 2012b;
Wang, Xiang, and Fesenmaier 2016). Technologies also assist
with better engaging the new and existing (So, King, et al.
2016; So, King, and Sparks 2014) and technology-savvy gen-
eration of travelers (Kang and Gretzel 2012a, 2012b), as well
as offer customers efficiency, convenience, and greater con-
trol (Buell, Campbell, and Frei 2010). However, research has
highlighted the paradoxical nature of travelers’ technology-
related experiences, which not only provide benefits but can
also create feelings of frustration, anxiety, stress, isolation,
and chaos, resulting in dissatisfaction and leading to various
coping strategies such as avoidance (Johnson, Bardhi, and
Dunn 2008).
Tourist behavioral models recognize the critical influence
of personal/trip characteristics (e.g., attitude and personality)
and environment (i.e., physical and social entities of contact)
(Lamsfus et al. 2015). Travelers’ use of and satisfaction with
technologies hinges on their technology readiness (TR), a
personality trait defined as “ the propensity to embrace and
use new technologies for accomplishing goals” (Parasuraman
2000, 308). TR is an important determinant or moderator of
consumer attitudes toward and adoption of technologies
(e.g., Chen, Chen, and Chen 2009; Walczuch, Lemmink, and
Streukens 2007). The context within which technologies are
experienced is critical as it sets the basis for understanding
travel behavior (Lamsfus et al. 2015). Given that the travel
environment is increasingly digitized with tourists literally
traveling in physical and virtual IT-supported networks
(Lamsfus et al. 2015), the TR construct has never been more
relevant to tourism research than it is now. This study is a
657891 JTRXXX10.1177/0047287516657891Journal of Travel
ResearchWang et al.
research-article2016
1Department of Tourism, Sport and Hotel Management, Gold
Coast
campus, Griffith University, Queensland, Australia
2School of Hotel, Restaurant and Tourism Management, Center
of
Economic Excellence in Tourism and Economic Development,
University
of South Carolina, Columbia, SC, USA
Corresponding Author:
Ying Wang, Department of Tourism, Sport and Hotel
Management, Gold
Coast campus, Griffith University, Queensland 4222, Australia.
Email: [email protected]
Technology Readiness and Customer
Satisfaction with Travel Technologies:
A Cross-Country Investigation
Ying Wang1, Kevin Kam Fung So2, and Beverley A. Sparks1
Abstract
Technologies have dramatically transformed tourist experience.
However, research has largely focused on traveler attitudes
and technology adoption rather than their experience with travel
technologies. Taking a cross-country perspective, this study
examines the role of technology readiness (TR) as a personality
trait in shaping travelers’ satisfaction with travel technologies,
using airlines as a case study. Results of an online survey of
travelers in Australia, China, and the United States revealed the
moderating effects of the TR dimensions of optimism and
innovativeness as well as country of residence on the
relationships
between perceived quality of technology-enabled services
(TESs), satisfaction with TESs, overall satisfaction, and future
behavior. These relationships were stronger among travelers
with higher TR and varied across countries. The results suggest
that tourism and hospitality service providers should
incorporate measures of traveler TR and TESs’ performance
into their
customer-experience monitoring system.
Keywords
travel technologies, technology readiness, customer satisfaction,
airlines, cross-country comparison
564 Journal of Travel Research 56(5)
cross-country investigation of traveler experience with TESs
in the tourism consumption process. It uses consumer experi-
ence with airline TESs as a case study to evaluate a frame-
work for understanding satisfaction with TESs, which
includes the evaluation of TES quality, leading to satisfac-
tion with TESs and the overall trip experience, and future
behavioral intentions. The study’s major contributions are
(1) to conceptualize and examine the moderating role of trav-
elers' TR in shaping customer satisfaction and (2) to consider
TR’s role in the framework of satisfaction in a cross-country
sample including Australian, American, and Chinese travel-
ers. The airline sector is chosen because of its particularly
advanced TES offerings, ranging from self-check-in facili-
ties to onboard services such as entertainment systems and
Wi-Fi access (Wang and Sparks 2014; Wang, So, and Sparks,
2014). Research also posits that service provision in many
industries is affected by the introduction of Self-Service
Technology, none more so than in the airline industry, and
these services significantly impact the majority of airline
passengers (de Groot 2015), making TR a highly relevant
concept.
The study addresses significant literature gaps related to
TESs, satisfaction with TESs (Meuter et al. 2003; Makarem,
Mudambi, and Podoshen 2009), and the subsequent postser-
vice behaviors (Buell, Campbell, and Frei 2010). To date,
TES-related research has concentrated largely on customer
acceptance and adoption of these services (e.g., Lassar,
Manolis, and Lassar 2005; Walczuch, Lemmink, and
Streukens 2007) and the ways in which technologies shape
aspects of tourist behaviors and experiences (e.g., Kang and
Gretzel 2012a; Lamsfus et al. 2015; Kang and Gretzel 2012b;
Tussyadiah and Zach 2012; Wang, Park, and Fesenmaier
2012; Wang, Xiang, and Fesenmaier 2016; Xiang, Magnini,
and Fesenmaier 2015; Xiang et al. 2015). While an enhanced
understanding of these aspects of TESs is critical, further
insights into whether and why travelers feel satisfied with
TES offerings is equally, if not more, important. The primary
justification for focusing on satisfaction lies in its positive
association with key consumer outcomes such as customer
retention and loyalty, both online and offline (e.g., Lu, Wang,
and Hayes 2012). Nevertheless, adequate service quality
online is often lacking, calling for a better understanding of
consumers’ e-satisfaction and tech-satisfaction (Parasuraman,
Zeithaml, and Malhotra 2005; Zeithaml, Parasuraman, and
Malhotra 2002).
This study also responds to the need to incorporate per-
sonal characteristics beyond demographic factors in under-
standing travelers’ technology-assisted experience (Kang and
Gretzel 2012b). Personality research provides useful insights
as personality is particularly influential in predicting behavior
over time and across situations in relation to a wide range of
human behaviors (Yoo and Gretzel 2011). Previous TR stud-
ies reside largely within the research adopting Technology
Adoption Model (TAM) and related models; they are often in
the context of information and communication technologies
(e.g., Chen, Chen, and Chen 2009; Lin and Hsieh 2007).
Limited TR research in tourism investigates customers’ atti-
tude toward rather than experience of TESs (e.g., Wang and
Sparks 2014; Wang, So, and Sparks, 2014) and considers only
some aspects of TR (e.g., Kang and Gretzel 2012b), with little
focus on TR’s role in shaping tourist satisfaction. Investigators
outside the tourism field proposes a direct impact of TR on
satisfaction as a consumption outcome without considering
the antecedents and outcomes of satisfaction (Chen 2011; Lin
and Hsieh 2006, 2007). This study departs from previous
research by empirically verifying TR’s moderating role in the
framework of tourism satisfaction.
Researchers question the assumption of uniform influ-
ence of personality traits across countries (Truong 2013;
Tellis, Yin, and Bell 2009) and highlight the danger of over-
generalization of findings based on general technology
acceptance and adoption models (Truong 2013). Contextual
factors that shape technology related behavior vary from one
country to another (Gretzel, Kang, and Lee 2008), highlight-
ing the need for comparative studies of TR across countries
and cultures (Parasuraman 2000). Limited TR research into
the tourism domain (e.g., Lee, Castellanos, and Choi 2012;
Wang, So, and Sparks, 2014; Wang and Sparks 2014) lacks
the cross-country perspective and often examines data from
a developed country (e.g., Australia). The generalizability of
the findings remains unknown. This study collected data in
Australia, China, and the United States, providing a cross-
country sample, enabling exploration of the model’s applica-
bility across tourists of varying cultural background,
economic condition, and technological environment.
Theoretically, cross-country studies inform the subject of
technology adoption, diffusion, and evaluation across mar-
kets. Practically, such studies are particularly meaningful for
tourism businesses because of their global footprints and
international consumer bases, assisting service providers and
marketers who are facing the challenge of adapting to the
specific needs of segments within the markets (Gretzel,
Kang, and Lee 2008).
Literature Review
Service Quality, Tourist Satisfaction, and Posttrip
Behaviors
Service quality and satisfaction are separate constructs.
Evaluation of service quality is largely cognitive, emphasiz-
ing effectiveness and efficiency. Studies on the quality of
e-services and self-service technologies assess attributes
such as speed of delivery, ease of use, reliability, security,
and control (Dabholkar 1996; Elliott, Meng, and Hall 2012;
Zeithaml, Parasuraman, and Malhotra 2002). In contrast, sat-
isfaction is the overall cognitive or affective response to
product use (Oliver 1997). Superordinate to quality, it is a
more emotional response to service encounters (Bowen and
Clarke 2002). Researchers generally agree that cognitive
Wang et al. 565
evaluations of service quality precede emotional responses
and that service quality is a strong predictor of satisfaction in
TESs. Studies of hotel websites (Polites et al. 2012), online
travel agencies (Tsang, Lai, and Law 2010), and e-service
use (Chea and Luo 2008) validate this service quality–satis-
faction link.
Satisfaction leads to favorable consumer outcomes of posi-
tive word of mouth and repurchase intention (Szymanski and
Henard 2001) as satisfied consumers tell their relatives and
friends, providing free advertisement and promotion. User sat-
isfaction predicts e-loyalty (Anderson and Srinivasan 2003),
continued IT use intention (Son and Han 2011; Thong, Hong,
and Tam 2006), website revisit, WOM, repeat purchase
(Gounaris, Dimitriadis, and Stathakopoulos 2010), and recom-
mendation with regard to various e-services (Chea and Luo
2008). A study of hotel websites finds that e-satisfaction not
only significantly affects e-loyalty but also mediates the influ-
ence of positive website experience on e-loyalty (Polites et al.
2012). Evidence shows that satisfaction is formed on the basis
of evaluation of service quality against expectation, which
leads to future intentions, and this sequence of events applies
to various service sectors such as hotels (Beatson, Coote, and
Rudd 2006), banking (Ganguli and Roy 2011), and e-shopping
(Gounaris, Dimitriadis, and Stathakopoulos 2010).
Tech-satisfaction presents a key challenge for researchers.
Satisfaction with a website may stem from the characteristics
of the website and its associated vendors, products, or ser-
vices. A customer may be loyal to the website itself or to a
vendor operating on the website (Polites et al. 2012).
Regarding travel experiences, TESs are often peripheral
rather than core features, although travelers’ experience with
TESs before, during, and after the trip would contribute to
their overall satisfaction. However, since their loyalty is
more likely to form toward the service provider (e.g., hotel/
airline) than its technological service features, it is necessary
to differentiate satisfaction with technologies from satisfac-
tion with the overall experience.
This study proposed the below model of tourism satisfac-
tion (Figure 1). The model posits:
Hypothesis 1: TES quality is positively related to satisfac-
tion with TESs.
Hypothesis 2: Satisfaction with TESs is positively related
to overall satisfaction.
Hypothesis 3: Overall satisfaction is positively related to
future behavioral intentions.
Moderating Effect of Travelers’ TR
The strength of relationships between constructs in Figure 1
varies under different conditions and research needs to
explore factors that may moderate these relationships
(Anderson and Srinivasan 2003). Travelers have different
levels of tolerance in service evaluation, and travelers’ char-
acteristics affect their evaluation of services and technolo-
gies (Mattila and Mount 2003), suggesting a moderating
effect of travelers’ characteristics. Regarding TESs, travel-
ers’ perceptions of the benefits such services can offer, trav-
elers’ own capabilities, and their orientation to technologies
are significant drivers of behaviors toward technology-
assisted channels (Buell, Campbell, and Frei 2010; Wang
and Sparks 2014; Meuter et al. 2003). In particular, consum-
ers’ individual-level factors such as personality traits moder-
ate the relationship between e-satisfaction and e-loyalty
(Anderson and Srinivasan 2003).
TR is a personality trait, measuring one’s orientation to
technologies. The limited research investigating how TR
affects satisfaction conceptualizes TR as a direct influencer
of satisfaction (Lin and Hsieh 2006, 2007; Mattila and Mount
2003), and occurred in a context where technology plays the
main role in the product offering, such as mobile services
(Chen, Liu, and Lin 2013) and an electronic book reader
(Ferreira, da Rocha, and da Silva 2014). Our study differs
significantly from previous research because TESs are more
peripheral than core product features in a travel experience.
TR is thus unlikely to directly influence a traveler’s overall
satisfaction with the trip. Further, our focus is on satisfac-
tion’s relationships with its key antecedent and outcome
rather than on satisfaction itself. Therefore, TR is conceptu-
alized as a moderator of the relationships between the con-
structs in Figure 1.
TR asserts influence through its impact on the perceived
importance of TESs (Wang, So, and Sparks, 2014). A con-
sumer’s overall TR establishes a frame within which he or
she values travel TESs (Wang and Sparks 2014). High-TR
customers perceive technologies to be more useful
(Walczuch, Lemmink, and Streukens 2007) and regard the
technology-related aspect of travel experience as more
important and weigh these aspects more heavily in evaluat-
ing the experience (Liljander et al. 2006; Wang and Sparks
2014). The perceived importance of a service exerts a mod-
erating effect on the relationships between satisfaction, its
antecedents, and outcomes, and high-importance purchases
Figure 1. Framework of tourism satisfaction.
566 Journal of Travel Research 56(5)
have a stronger relationship between perceived service per-
formance and satisfaction than do low-importance purchases
(Tam 2011). Since low-TR customers do not highly value
technology-related aspects, a positive or negative experience
with technologies does not carry as much weight in their
overall service evaluation. Compared to low-TR customers,
high-TR customers are more comfortable with new technol-
ogies and have more prior experience with technologies, and
consequently are less likely to encounter problems. They are
also less likely to find technical difficulties intimidating and
are more prone to continue to use technologies despite prob-
lems (Zeithaml, Parasuraman, and Malhotra 2002).
Therefore, a traveler’s TR may influence how complex he or
she perceives a TES to be. Further, the psychological process
and underlying dimensions of satisfaction may vary depend-
ing on the complexity of the consumption experience (Oliver
1997), and the level of service task complexity changes the
magnitude of the effect of service process modularization on
customer likelihood to try a new service (Tuunanen and
Cassab 2011).
TR also influences travelers’ beliefs, perceptions and
expectations about technologies, based upon which travelers
evaluate their technology-related experiences (Chung, Han,
and Joun 2015). A meta-review of customer satisfaction lit-
erature concludes that comparison standard may be a poten-
tial moderator of customer satisfaction (Szymanski and
Henard 2001). High-TR customers, because of their greater
knowledge of technologies, are more demanding and have
higher evaluative standards (Zeithaml, Parasuraman, and
Malhotra 2002). TR therefore moderates the relationships
between constructs in Figure 1, with the link likely to be
stronger for high-TR travelers than low-TR travelers.
TR is a multidimensional construct that captures both the
positive (i.e., optimism and innovativeness) and negative
(i.e., discomfort and insecurity) mental readiness for techno-
logical innovations (Parasuraman 2000). Optimism refers to
a positive view of technology and the belief that technology
can offer customers increased control, flexibility, and effi-
ciency in life and work (Parasuraman 2000). This perception
of control plays a significant role in forming satisfaction with
self-service technology (Johnson, Bardhi, and Dunn 2008).
Optimistic people value TESs more (Wang, So, and Sparks,
2014), have higher trust in new technologies, and perceive
the functionality of new technologies more positively (Lu,
Wang, and Hayes 2012; Walczuch, Lemmink, and Streukens
2007). Optimism is positively associated with customers’
perceived ease of use and usefulness of technology-enabled
financial services (Walczuch, Lemmink, and Streukens
2007), which increases customer satisfaction (e.g., Thong,
Hong, and Tam 2006).
Innovativeness represents a customer’s tendency to be a
pioneer and thought leader in adapting to new technologies
(Parasuraman 2000). Innovative customers are curious about
new technologies and perceive themselves as highly compe-
tent in using new technologies and in handling uncertainties
technologies present. They perceive the functionality of a
new technology more positively (Lu, Wang, and Hayes
2012). The more an individual embraces innovative technol-
ogies, the more likely he/she would consider TESs to be use-
ful (Walczuch, Lemmink, and Streukens 2007). Research
also suggests that innovativeness positively relates to
museum visitors’ perceived impact of technology on con-
sumption experience and the subsequent revisiting behavior
through enhancing one’s affinity with technology (Kang and
Gretzel 2012b).
Airlines implement technological innovations to achieve
reduced costs, greater capacity, faster speed, better manage-
ment of security, and product flexibility (International Air
Transport Association 2011; Kim, Park, and Morrison 2008).
These goals are consistent with high-TR travelers’ goals to
be seen as a pioneer in technologies. A stronger relationship
is hence expected between service quality, satisfaction, and
future behavior among optimistic and innovative travelers,
leading to the following hypotheses:
Hypothesis 4: Optimism moderates the proposed set of
relationships in Figure 1.
Hypothesis 5: Innovativeness moderates the proposed set
of relationships in Figure 1.
Discomfort is “a perceived lack of control over technol-
ogy and a feeling of being overwhelmed by it,” while inse-
curity is defined as “distrust of technology and skepticism
about its ability to work properly” (Parasuraman 2000,
311). Psychological discomfort is a key process that medi-
ates the interactive effect of employee rapport behavior
and technology use on service evaluation (Giebelhausen
et al. 2014). Travelers who score high on discomfort and
insecurity perceive operating TESs to be complex, and
tend to be overwhelmed by technologies and feel a strong
lack of control over their ability to handle uncertainties,
resulting in an overestimation of technology’s complexity.
Those who feel insecure about technologies also experi-
ence higher levels of anxiety when using new technologies
and are skeptical about technology’s usefulness (Lu, Wang,
and Hayes 2012).
Discomfort and insecurity can lead to distrust of new
technologies as well as low perceived functionality and
usefulness (Lu, Wang, and Hayes 2012), affecting the rela-
tionships in Figure 1. While trust in technology increases
satisfaction with TESs (Johnson, Bardhi, and Dunn 2008),
some researchers assert that trust is a mediator or modera-
tor rather than a direct predictor of satisfaction (e.g.,
Morgan and Hunt 1994; Polites et al. 2012; Lee and Wu
2011). Similarly, perceived usefulness and trust positively
moderate the relationships between e-service quality, per-
ceived value, and service satisfaction regarding airline
websites (Lee and Wu 2011). Trust also affects the relation-
ship between quality of online banking attributes (e.g., con-
trol, efficiency) and customer satisfaction (Johnson, Bardhi,
Wang et al. 567
and Dunn 2008). In addition, customers who feel anxious
about technologies are less likely to have a positive experi-
ence with technologies even when technologies work well
(Meuter et al. 2003). The following hypotheses were there-
fore proposed:
Hypothesis 6: Discomfort moderates the proposed set of
relationships in Figure 1.
Hypothesis 7: Insecurity moderates the proposed set of
relationships in Figure 1.
Moderating Effect of Country of Residence
Travelers’ cultural background affects their service expecta-
tions (Donthu and Yoo 1998) and technology acceptance
(Meng, Elliott, and Hall 2009). Differences in uncertainty
avoidance, masculinity/femininity, and power distance mod-
erate the relationships in the widely accepted technology
acceptance model (Srite and Karahanna 2006). Cultural dif-
ferences also affect the effectiveness of technology transfer
indirectly through an interaction with the nature of the tech-
nology being transferred (Lin and Berg 2001). A study com-
paring Korean and American customers’ use of technology
finds that culture moderates the relationships between expec-
tancy, behavioral intention, and use behavior with these rela-
tionships being weaker in the Korean sample, which
represents a culture with higher power distance, collectiv-
ism, and uncertainty avoidance and lower masculinity (Im,
Hong, and Kang 2011). Similarly, collectivism and group
orientation reduce the strength of relationships between per-
ceived quality, satisfaction, and intention, because consumers
with these cultural characteristics evaluate their service expe-
rience on the basis of group norms rather than individuals’
own standards (Spreng and Chiou 2002). The following
hypothesis was proposed.
Hypothesis 8: Country of residence moderates the pro-
posed set of relationships in Figure 1.
This study operationalized the testing of country of resi-
dence’s moderating effect through a cross-national study
involving Australian, Chinese, and American consumers.
Australia is where research design was developed, serving as
the initial testing ground for the research instrument. China
and United States were chosen as they differ in terms of
political governance, economic and technological develop-
ment, as well as cultural values such as risk avoidance, group
orientation, and trust (e.g., Hofstede and Hofstede 2001;
Spreng and Chiou 2002). American consumers behave dif-
ferently from their Chinese counterparts in relation to their
use of technologies (Chu and Choi 2011). Chinese are less
optimistic about technologies’ ability to offer greater func-
tionality and control over their life compared to the Americans
(Meng, Elliott, and Hall 2009). Therefore, Chinese may be
less likely to embrace new TESs. Practically, China and the
United States are the world’s top two tourism spenders in
2014 (UNWTO 2015), representing the largest consumer
markets in the East and West, as well as tourism’s largest
traditional and emerging markets. Figure 2 summarizes the
complete conceptual framework and proposed hypotheses.
Methods
This study utilized the airline sector as a case study and
adopted a quantitative approach that included an online sur-
vey administered in Australia, China, and the United States.
Figure 2. The conceptual framework.
568 Journal of Travel Research 56(5)
Survey Instrument and Measures
The instrument was developed based on academic literature
and industry consultation to collect information on respon-
dents’ perceived quality of and satisfaction with airline TESs,
satisfaction with the overall flight experience, future behav-
ioral intentions, and TR as well as social demographics and
trip-related characteristics.
TES quality scale. The service quality scale measures per-
ceived quality of service concerning TES offerings. A list of
TESs, derived from academic literature, industry reports,
travel websites, and blogs, was sent to top managers in the
airline industry in Oceania. Using feedback of top managers
of four major airlines, we revised the list, retaining 35 TES
items.
Participants were instructed to evaluate TESs on the basis
of their most recent flight experience in responding to the
scale. As a traveler is unlikely to have used all 35 TESs, par-
ticipants responded to this section in two steps: (1) partici-
pants indicated which of the TESs they had used, and (2) for
those TESs they had used, they rated the quality of each rela-
tive to their expectation on a 7-point scale (1 = much worse
than expected to 7 = much better than expected).
Satisfaction scale. The survey used two scales, one measuring
satisfaction with TESs and the other measuring satisfaction
with the overall flight experience. Participants were
instructed that the flight experience includes the actual flight
and all associated experiences such as booking, check-in,
and the baggage collection. Following previous studies (e.g.,
Anderson, Fornell, and Mazvancheryl 2004; Lin and Hsieh
2007), the three-item American Customer Satisfaction Index
(ACSI) was used to measure travelers’ satisfaction with air-
line TESs, with the wording modified to reflect the study
context. The three items ask whether the TESs were gener-
ally satisfying, exceeded expectation, and were close to one’s
ideal. Participants indicated their responses on a 7-point
Likert-type scale (1 = strongly disagree to 7 = strongly
agree). Participants’ satisfaction with the overall flight expe-
rience was also measured using the ACSI on a 7-point Lik-
ert-type scale, with modification in wording to reflect the
overall flight experience.
Future behavioral intentions. The three-item instrument mea-
sures participants’ postflight behaviors, including future pur-
chase, word-of-mouth advertising, and willingness to pay a
premium price. These items reflect established important
aspects of customer loyalty and future behavior toward a ser-
vice provider (e.g., Ganguli and Roy 2011; Gounaris, Dimi-
triadis, and Stathakopoulos 2010).
TR scale. This study used the full 36-item TR Index, with per-
mission for academic use from the copyright owners Para-
suraman and Rockbridge Associates, Inc. (see Parasuraman
2000 for full scale). Participants indicated the extent to which
they agreed or disagreed with each of the 36 items on a 7-point
Likert-type scale (1 = strongly disagree and 7 = strongly
agree).
Pretest and Pilot Test
The questionnaire was hosted on a reputable website for
research surveys. It was pretested with a convenience sam-
ple of 73 university faculty members and research students,
and then pilot-tested with 161 participants with the assis-
tance of a marketing list company. These tests identified
potential issues in survey flow, readability, and logistics,
and served as validity checks of construct measures, based
on which the questionnaire was finalized. The question-
naire was translated into simplified Chinese by an accred-
ited translator, then checked by three tourism scholars
whose native language is Mandarin. A pretest with a conve-
nience sample of 30 faculty members and research students
in a Chinese university was also conducted. Based on the
pretest, the research team was satisfied with the compara-
tive nature of the survey.
Survey Procedures and Participants
Access to potential respondents in Australia was obtained
through a reputable marketing research firm, and a sample
was drawn from the company’s privacy-compliant online
consumer panel, a source of a preexisting sampling frame
consisting of more than 500,000 active members, providing
a reasonable representation of the Australian population. A
purposive sampling approach was taken where to be eligi-
ble to participate in this study, individuals must be older
than 18 years and have had taken a flight in the past 12
months. A quota sampling approach was implemented to
obtain a balance across genders, age groups, and the differ-
ent Australian states and territories. Items measuring TR,
service quality, satisfaction, and future behavior were ran-
domized to remove any systematic order effects. Access to
potential participants in the United States was obtained in a
similar manner through a U.S.-based consumer panel
provider.
Owing to a lack of comparable consumer panel services
in China, a different approach was used combing conve-
nience and snowballing sampling strategies. A Chinese
researcher assisted data collection. Postgraduate students
were recruited to distribute the questionnaire online and sent
e-mail invitations to potential participants through popular
social media sites such as Tencent Weibo, Sina Weibo, and
QQ (an instant messaging software service offering a variety
of services including micro blogging) and online communi-
ties of major Chinese airlines (e.g., Air China and China
Southern Airlines) to elicit voluntary participation. Potential
participants were encouraged to forward the survey link to
friends who qualified for the study. Participants were offered
Wang et al. 569
the chance to enter a drawing to win one of 50 telecommuni-
cation cards, each worth approximately AU$20.
Results
A total of 1,407 usable surveys were completed, with 558
from the United States, 509 from China, and 340 from
Australia. Female respondents accounted for 50.8% of the
overall sample. Approximately 33.2% of the respondents
were under 30 years old, 40.1% were between 30 and 50, and
26.6% were older than 50. About 22.9% of the respondents
held a postgraduate degree, 41.6% had university degrees,
13.9% held a certificate or diploma, 6% had trade qualifica-
tions, 11.6% were high-school qualified, 1.9% had com-
pleted elementary school, and 2.1% had other forms of
education. To evaluate nonresponse bias for each sample,
early and late respondents were compared on the demo-
graphic variables and the scale measures (Armstrong and
Overton 1977). The results showed no significant differences
between early (first 10%) and late (last 10%) respondents in
terms of respondent characteristics and the measured items.
Preliminary Analysis
EFA was performed to assess measurement items within
each scale to check uni-dimensionality, factor structure,
and strength of factor loadings (i.e., loadings should exceed
.50) (Gerbing and Anderson 1988). We used reliability
analysis to examine the internal consistency of the scales
via Cronbach’s alpha, with values above .70 deemed to be
appropriate (Nunnally 1978). Under these criteria, several
items were deleted, including one innovativeness item, one
optimism item, three insecurity items, and one discomfort
item. The retained scale items for each of the TR dimen-
sions were used to compute composite variables for the
subsequent test for moderation. Table 1 presents the mean
scores for constructs.
Partial Least Squares Path Modeling
The partial least squares (PLS) approach to structural equa-
tion models, also known as PLS path modeling (PLS-PM) or
PLS structural equation modeling (PLS-SEM), is a compo-
nent-based estimation procedure that differs from the covari-
ance-based LISREL-type approach, which has a primary
goal of theory testing and confirmation (Hair et al. 2013). In
contrast, PLS-PM explains the residual variance of the latent
variables, and therefore its goal is predicting key target con-
structs (Fornell and Bookstein 1982; Hair et al. 2013). Unlike
the covariance-based approach used in AMOS and LISREL,
PLS-PM analysis does not rely on the assumption of data
normality and does not require as large a sample as other
causal modeling techniques (Arnett, Laverie, and Meiers
2003; do Valle and Assaker, 2016).
As this study aims to evaluate a set of predictive relation-
ships and how the dimensions of TR and country affect these
relationships, PLS-PM was the most appropriate analytical
technique to examine the data. The software package
employed was XLSTAT.
Measurement Model
The analysis first assessed the measurement model through
the validity and reliability of the construct measures.
Convergent validity was evaluated through the strength
and significance of the loadings, the average variance
extracted (AVE), and the reliability estimates (Bagozzi and
Heatherton 1994). As Table 2 shows, all loadings were sat-
isfactory (>.70) (Gerbing and Anderson 1988) with one
exception, which was slightly below the acceptable level
of .70. However, the bootstrap critical ratios indicate that
all indicators are statistically significant (p < .001).
Furthermore, all AVEs were greater than .50, exceeding
the suggested threshold (Fornell and Larcker 1981). Taken
together, the results provide strong evidence for the con-
vergent validity.
Discriminant validity across the measured constructs was
assessed by two methods (Hair et al. 2013). First, the item
cross-loadings of the indicators were examined (Hair, Ringle,
and Sarstedt 2011). Results showed that no items cross-
loaded higher on another construct than they did on their
own construct, supporting discriminant validity (Hair et al.
2013). Second, the square root of the AVE of the constructs
was greater than the intercorrelations between constructs in
each case, thus providing evidence of discriminant validity
(Fornell and Larcker 1981; Chin 1998).
Construct reliability was assessed via internal consistency
and indicator reliability (Hair et al. 2013). Internal consis-
tency was evaluated with Dillon-Goldstein’s rho, which does
not assume parallelity of the manifest variables as Cronbach’s
alpha does. All factors achieved satisfactory reliability (>.70)
(Hair et al. 2006; Nunnally and Bernstein 1994), with Dillon-
Goldstein’s rho values ranging from .88 to .93 (see Table 2).
Table 1. Mean Scores for Measured Constructs.
Construct
Mean Score for Each Country Group
United
States China Australia
Optimism 5.25 5.54 4.97
Innovativeness 4.80 5.07 4.55
Insecurity 3.94 4.53 4.10
Discomfort 4.33 4.77 4.53
TESQUAL 4.72 4.44 4.51
STES 4.64 4.12 4.27
OSAT 4.97 4.46 4.65
FBI 5.04 4.52 4.70
Note: TESQUAL = technology-enabled services quality; STES =
satisfaction with technology-enabled services; OSAT = overall
satisfaction;
FBI = future behavioral intentions.
570 Journal of Travel Research 56(5)
The results demonstrate that, overall, the scales were valid
and reliable measures of their respective constructs.
Structural Model
The structural model was evaluated through a systematic
examination of indices including R2, average variance
accounted for (AVA), path coefficients between the exogenous
and endogenous, and bootstrap critical ratios. As the primary
objective of PLS-PM is prediction, the goodness of a theoreti-
cal model is established by the strength of each structural path
and the combined predictiveness (Duarte and Raposo 2010).
Given that the individual R2s are greater than the recommended
level of .10 (Falk and Miller 1992), the paths’ significance
associated with these variables was examined. The analysis
controlled for respondents’ age group, gender, and educational
level, and all these variables were included as categorical con-
trol variables (Hair et al. 2013). The structural model results
based on the overall sample data (n = 1,407) suggest that all
path coefficients were significant as the bootstrap critical ratios
were greater than ±1.96. Thus, hypotheses 1, 2, and 3 were sup-
ported. Furthermore, a model has predictive power if the AVA
is above .10. R2s for satisfaction with TESs, overall satisfac-
tion, and future behavior were .158, .654, and .710, respec-
tively, resulting in an AVA of .507 for this model (exceeding
the
cut-off of .10), thus indicating the predictive power of the indi-
vidual paths and structural model. To show the predictive
power of each endogenous variable included in the model, we
also provide the variance due to path. Table 3 shows the results.
Test for Moderating Effects of TR Dimensions
To examine the moderating effects of TR dimensions, a
widely adopted median split method was used, dividing the
overall sample into subgroups (e.g., high innovativeness vs.
low innovativeness, high optimism vs. low optimism)
(Henseler and Fassott 2010). Differences in the model
parameters between the different data groups are interpreted
as moderating effects. While such an analysis has often been
conducted by examining path differences using a t-test based
on the pooled standard errors obtained via a re-sampling pro-
cedure such as bootstrapping (Vinzi, Trinchera, and Amato
2010), problems can occur if a normal population or similar
sample size is assumed (Chin and Dibbern 2010). The per-
mutation-based procedure provides an alternative distribu-
tion-free approach based on an approximate randomization
test, where a subset of all possible data permutations between
sample groups is made (Vinzi, Trinchera, and Amato 2010).
Having examined measurement invariance, using this
approach, multi-group analyses were conducted to examine
the differences in path coefficients (hypotheses 4–8).
Table 4 shows that the links between satisfaction with TESs
and overall satisfaction (difference = .16, p < .01) and between
overall satisfaction and future behavioral intentions (difference
= .07, p < .01) are significantly stronger for the high-optimism
group than for the low-optimism group. However, the differ-
ence for the relationship between perceived TESs quality and
satisfaction with TESs is not significant. Therefore, the results
provide partial support for hypothesis 4. Similarly, as Table 5
indicates, in the structural model for the high innovativeness
group, the path coefficients from satisfaction with TESs to
overall satisfaction (difference = .14, p < .01) and overall satis-
faction to future behavioral intentions (difference = .07, p <
.01) are significantly stronger than the corresponding path in
the structural model for the low innovativeness group. The
directional relationship between perceived quality of TESs and
satisfaction with TESs is not significantly different between the
two groups. Thus, the results partially support hypothesis 5.
Furthermore, as no significant differences were found in the
three path coefficients between the high-insecurity and low-
insecurity groups and between the high-discomfort and low-
discomfort groups, hypotheses 6 and 7 were not supported.
Test for Moderating Effect of Country of
Residence
To test hypothesis 8, a multigroup analysis was conducted to
examine path differences across the three sampled country
Table 2. Results Summary for Reflective Measurement Models.
Latent
Variable Indicators Loadings
Indicators
Reliability
D.G.
rho AVE
Discriminant
Validity?
STES STES1 .90 .81 .93 .80 Yes
STES2 .90 .81
STES3 .89 .79
OSAT OSAT1 .87 .76 .92 .79 Yes
OSAT2 .90 .81
OSAT3 .90 .81
FBI FBI1 .93 .86 .88 .70 Yes
FBI2 .93 .86
FBI3 .62 .38
Note: D.G. rho = Dillon-Goldstein’s rho; AVE = average
variance extracted; STES = satisfaction with technology-
enabled services; OSAT = overall
satisfaction; FBI = future behavioral intentions.
Wang et al. 571
groups. As Table 6 indicates, the path from satisfaction with
TESs to overall satisfaction (hypothesis 2) is significantly
stronger in the Chinese group than in the U.S. group (differ-
ence = .05, p < .05). While it was noted that the absolute path
difference between China and Australia is greater than that
between China and the U.S. (difference = .06), the latter was
found insignificant in the moderating analysis based on the per-
mutation method owing to the larger standard error of the path
in the Australian sample. In contrast, the path from overall sat-
isfaction to future behavioral intentions (hypothesis 3) is sig-
nificantly stronger in the U.S. group than in the Chinese group
(difference = .08, p < .01). The results partially support hypoth-
esis 8.
Discussion and Conclusions
This study advances understanding of travelers’ experience
with technologies by proposing a conceptual model that
incorporates travelers’ TR into the existing framework of
tourist satisfaction. Key findings include confirmation that
travelers’ perceived quality of airline TESs is positively
associated with their satisfaction with TESs, which affects
Table 3. Significance Testing Results of the Structural Model
Path Coefficients.
Path
Path
Coefficients
Standard
Errors
Critical
Ratios p Values
95% Confidence
Intervals
Variance
Due to Path
TESQUAL→ STES .384 .030 12.62 <.01 .31, .44 .146
STES → OSAT .801 .014 57.90 <.01 .77, .83 .641
OSAT → FBI .834 .011 79.09 <.01 .81, .86 .701
Controlled variables
Age→ STES –.036 .026 –1.365 NS –.09, .02
Gender→ STES –.035 .022 –1.579 NS –.08, .00
Edu→ STES –.088 .025 –3.453 <.01 –.15, –.04
Age → OSAT .094 .018 5.461 <.01 .05, .13
Gender → OSAT .008 .017 .427 NS –.03, .04
Edu → OSAT .004 .017 .106 NS –.04, .04
Age → FBI .069 .017 4.101 <.01 .04, .11
Gender → FBI .004 .014 .253 NS –.03, .03
Edu → FBI .024 .013 1.842 NS –.00, 05
Note: TESQUAL = technology-enabled services quality; STES =
satisfaction with technology-enabled services; OSAT = overall
satisfaction; FBI = future
behavioral intentions; Edu = highest education achieved; NS =
not significant.
Table 4. Results of Moderating Effect of Optimism.
Path
Group 1: Low OPT Group 2: High OPT Group 1 vs. Group 2
Path Coefficient Critical Ratio Path Coefficient Critical Ratio
Path Difference p Value
TESQUAL→ STES .31 7.70*** .40 10.59*** .08 .18
STES → OSAT .69 22.49*** .85 69.94*** .16 <.01
OSAT → FBI .78 31.37*** .85 74.02*** .07 <.01
Note: OPT = optimism; TESQUAL = technology-enabled
services quality; STES = satisfaction with technology-enabled
services; OSAT = overall
satisfaction; FBI = future behavioral intentions; path
differences were generated from permutation.
***p < .01.
Table 5. Results of Moderating Effect of Innovativeness.
Path
Group 1: Low INN Group 2: High INN Group 1 vs. Group 2
Path Coefficient Critical Ratio Path Coefficient Critical Ratio
Path Difference p Value
TESQUAL→ STES .34 7.58*** .40 9.73*** .06 .32
STES → OSAT .71 25.81*** .85 57.04*** .14 <.01
OSAT → FBI .79 38.60*** .86 73.15*** .07 <.01
Note: INN = innovativeness; TESQUAL = technology-enabled
services quality; STES = satisfaction with technology-enabled
services; OSAT = overall
satisfaction; FBI = future behavioral intentions; path
differences were generated from permutation.
***p < .01.
572 Journal of Travel Research 56(5)
their overall satisfaction and postconsumption behavioral
intention toward the airline (hypotheses 1, 2, and 3). Partially
confirming hypotheses 4 and 5, the results suggest that opti-
mism and innovation positively moderate the relationship
between satisfaction with TES and overall satisfaction, as
well as that between overall satisfaction and future behavior,
but not the quality–satisfaction relationship. More optimistic
and innovative travelers weigh TES offerings as more impor-
tant in service consumption than those less optimistic and
innovative about technologies (Wang, So, and Sparks, 2014),
as reflected in air travelers’ evaluation of their overall experi-
ence as well as future behaviors as measured by future pur-
chase intention and WOM behaviors in this study. The two
dimensions’ lack of influence on the effect of TES quality on
satisfaction may suggest that personal orientation to technol-
ogy does not influence how a traveler evaluates technology-
enabled service quality. A poor experience resulting from
technical failure or nonresponse to e-mail inquiry is likely to
result in low satisfaction regardless of travelers’ attitude.
This result may also be related to the utilitarian goals of con-
venience, flexibility, and efficiency that many TESs meet for
both travelers and airlines. As the evaluation of a service
tends to be more objective and based on functional attributes
of the service, it may be less subject to the influences of atti-
tude and emotion.
This study provides no support for a moderating effect of
discomfort and insecurity (hypotheses 6 and 7). Being hospi-
tality service providers, airlines designed TESs in ways that
minimize anxiety and optimize usability (Wang and Sparks
2014). Onsite customer service support is often available at
the airport or onboard, which eases customer anxiety. As
such, discomfort and insecurity may be less relevant to hos-
pitality TESs than they are to pure technological innovations.
Further, customers’ increasing familiarity with e-commerce
environment may have resulted in a belief that major security
issues have been addressed, diminishing the effect of the
inhibitors of TR (Chen, Chen, and Chen 2009).
Our results also suggest a varying strength of relationship
between key constructs in Figure 1 among travelers from the
three countries, partially confirming Hypothesis 8. The rela-
tionship between overall satisfaction and future behavior is
stronger in the U.S. sample than in the Chinese sample, pos-
sibly because of Chinese travelers’ conservative nature and
cautiousness about new technologies. They are less optimis-
tic about technologies ability to offer greater functionality
compared to the Americans (Meng, Elliott, and Hall 2009). A
cross-cultural study of the U.S. and China revealed signifi-
cant differences in eWOM behaviors in terms of opinion-
giving and seeking and information pass-along behavior
(Chu and Choi 2011). The authors attributed these differ-
ences to the varying cultural orientations (i.e., individualism
vs. collectivism) and social relationships (i.e., social capital,
tie strength, trust, and interpersonal influence) in the two
countries (Chu and Choi 2011). Our finding is also consistent
with Im, Hong, and Kang’s (2011) suggestion that the
strength of relationship between performance expectancy
and intention is weaker in Eastern cultures. However, the
relationship strength between satisfaction with TES and
overall satisfaction is stronger in the Chinese sample.
Availability of self-service technologies is generally lower in
China than in the United States (Westjohn et al. 2009), and
research presents evidence that customers of Chinese origin
differ from Western travelers in their preferences and expec-
tations of services (e.g., Donthu and Yoo 1998; Lu, Choi, and
Tseng 2011; So, Liu, et al. 2016). Therefore, Chinese travel-
ers may differ from Americans in the aspects of TESs they
value, resulting in greater weighting of TESs in the evalua-
tion of overall satisfaction and possibly explaining the stron-
ger relationship between satisfaction with TES and overall
satisfaction in the Chinese sample than in the American sam-
ple. Additional research is needed to fully delineate the
underlying causes of the varying strength of relationships
between the constructs in Figure 1.
Theoretical and Practical Contributions
Among the first to place TR in a broader framework of satis-
faction related to technological aspects of tourism services,
this study makes several theoretical contributions. Although
the relationships among satisfaction and its antecedents and
outcomes have previously been established, these relation-
ships are likely to be affected by contextual factors such as
Table 6. PLS Multigroup Analysis for Three Country Groups.
Paths
Group 1: U.S. Group 2: China Group 3: Australia
Group 1 vs.
Group 2
Group 1 vs.
Group 3
Group 2 vs.
Group 3
Path
Coefficients
Critical
Ratios
Path
Coefficients
Critical
Ratios
Path
Coefficients
Critical
Ratios
Path
Difference
p
Value
Path
Difference
p
Value
Path
Difference
p
Value
TESQUAL→
STES
.36 8.34*** .39 7.91*** .35 4.85*** .03 .64 .00 .92 .04 .70
STES → OSAT .79 39.12*** .84 48.59*** .77 21.03*** .05
<.05 .00 .97 .06 .16
OSAT → FBI .86 60.18*** .78 34.10*** .83 35.29*** .08 <.01
.04 .21 .04 .17
Note: TESQUAL = technology-enabled services quality; STES =
satisfaction with technology-enabled services; OSAT = overall
satisfaction; FBI = future behavioral intentions;
path differences were generated from permutation.
**p < .05; ***p < .01.
Wang et al. 573
types of services, consumer characteristics, and business
environment. Using airlines as a case study, this study evalu-
ates the service quality–tourism satisfaction relationship on
technology-assisted service platforms. The study differs
from much of the existing research on TES, which concen-
trates on customers’ attitudes toward technology and their
subsequent adoption behavior (e.g., Elliott, Meng, and Hall
2012; Ferreira, da Rocha, and da Silva 2014). While under-
standing adoption behavior is critical, the long-term sustain-
ability of business requires continuous use of technology
beyond initial adoption (Son and Han 2011). This study con-
tributes to the scarce literature on postadoption behavior
related to TESs.
The study clarifies TR’s role in shaping tourism satisfac-
tion, as little research has examined the impact of TR on con-
sumer behavior (Lin and Hsieh 2007) and postadoption
behavior (Son and Han 2011), adding to the limited body of
literature on personality traits’ influence in technology-
assisted experiences. This study conceptualizes and tests TR
as a moderator of the satisfaction’s relationships with its
antecedents and outcome within tourism consumption. By
focusing on a series steps leading up to satisfaction and the
consequent behavioral outcomes, this study delineates how
satisfaction may be conditioned on TR in different phases of
a consumption experience, providing greater insight into
ways of enhancing travelers’ consumption experience. This
constitutes a high level of theoretical contribution by adding
a new “what” (i.e., a construct) to an existing theory in order
to describe “how” the relationships unfolds and “when,” or
“for whom” the relationships are likely to be manifested
(Whetten 1989). Future research concerning travel technolo-
gies should consider TR as a moderating variable. Further,
this investigation adds to the limited research on cross-coun-
try comparison of tourist experiences in general and with
technology in particular. The study verified the satisfaction
framework across the U.S., Australian, and Chinese samples
and highlighted the need to consider traveler cultural back-
ground in researching travel technologies.
Practically, the findings suggest that across markets, TESs
have become important features of tourism services that sig-
nificantly affect traveler satisfaction with the overall tourism
experience. Ensuring a positive experience for travelers is
thus critically important. To identify strengths and weak-
nesses related to TES offerings, businesses should develop
measures of TES quality and incorporate TES-related satis-
faction indicators into the system monitoring overall cus-
tomer experience. Further, TR is important to consider in
service offering, as it not only influences the adoption of
travel technologies but also shapes travelers’ satisfaction and
post-adoption behavior. Businesses should recognize travel-
ers’ TR as an influential factor in TES-related service design
and implementation. Although TR is not a directly observ-
able customer characteristic, high-TR travelers can be distin-
guished from low-TR travelers by their use of TESs. For
instance, as highly innovative customers are often the first to
adopt a newly offered service, airlines and hotels could
maintain a database recording customers’ interactions with
TESs so as to predict their reactions to new offerings and
tailor marketing materials accordingly. Customer surveys
incorporating TR measures might also be conducted with a
sample drawn from the database to determine the TR of vari-
ous market segments.
In low-TR markets, businesses introducing a new TES
can emphasize orienting travelers toward the TES through
trial, briefing, on-site demonstration, and online video, to
display its benefits. Customer testimony should be high-
lighted to ease anxiety regarding new TESs. Businesses also
need to recognize travelers’ country of residence as an impor-
tant factor in TES-related service promotion. A challenge,
however, is tourism businesses’ international footprint and
market base. For instance, an international flight involves at
least two countries, sometimes of very different levels of
technological development and hence varying consumer ori-
entations and experience with TESs. Therefore, differenti-
ated strategies may be needed for different markets with
respect to TES-related communication and education and in
terms of stimulating WOM behavior.
While delivering quality TESs is a general management
priority for an airline, the stronger relationship between sat-
isfaction with TESs and overall satisfaction in the Chinese
sample highlights the particular importance of this among
Chinese travelers. Airlines should collect information on the
most valued and used TESs by the Chinese and further tailor
services to market needs (e.g., providing instructions in
Chinese language and in-person assistance). However, the
weaker relationship between overall satisfaction and future
behavioral intention among the Chinese requires airlines to
make extra effort to entice Chinese travelers and to encour-
age their favorable behavior. This may be achieved through
proactive customer relationship management and offering
tangible and value-added incentives, such as extra mileage
points and preselection of service features that do not incur
significant costs to airlines.
Conclusions, Limitations, and Future Research
This study clarifies TR’s role in the evaluation of and satis-
faction with travel technologies, and suggests TR and coun-
try of residence as factors tourism businesses must consider
in formulating technology-related strategies. The study has
several limitations. Respondents’ evaluation of TESs relied
on their most recent trip experience. However, frequent trav-
elers may base service evaluation and future behavioral
intention on experiences accumulated over time. Future
research can consider a comparative study between repeat
and new customers. This study reveals differences among
travelers from three countries in the way satisfaction influ-
ences future behaviors—a result this study attributes to the
varying cultural environments within which TES consump-
tion takes place. However, other reasons may explain the
574 Journal of Travel Research 56(5)
varying strength of relationships between constructs in the
conceptual model, which warrants further investigation. In
addition, while this study constrained its scope to the inves-
tigation of TR’s moderating effects on only relationships in
the linear model illustrated in Figure 1, other factors may
also come into play, which would result in alternative mod-
els. For instance, travelers’ adoption and experience regard-
ing TESs may also be shaped by role clarity, motivations,
perceived enjoyment, and familiarity (Kim, Christodoulidou,
and Brewer 2012; Rosenbaum and Wong 2015; Kang and
Gretzel 2012a), which requires further research in order to
fully disclose the role of TR in the broader satisfaction for-
mation process. Another research avenue is to understand
how the proliferation of technologies influences the way
people behave in general and while traveling, as well as how
the behavior differs across generations. Finally, construct
measures, for instance, STES and TR scales, can be further
refined to better capture the essence of the constructs.
Declaration of Conflicting Interests
The author(s) declared no potential conflicts of interest with
respect
to the research, authorship, and/or publication of this article.
Funding
The author(s) disclosed receipt of the following financial
support
for the research, authorship, and/or publication of this article:
This
study is funded under the Griffith University New Researcher
Grants Scheme.
References
Anderson, E. W., C. Fornell, and S. K. Mazvancheryl. 2004.
“Customer Satisfaction and Shareholder Value.” Journal of
Marketing 68 (4): 172–85.
Anderson, R. E., and S. S. Srinivasan. 2003. “E-satisfaction
and E-loyalty: A Contingency Framework.” Psychology &
Marketing 20 (2): 123–38.
Armstrong, J. S., and T. S. Overton. 1977. “Estimating
Nonresponse
Bias in Mail Surveys.” Journal of Marketing Research 14 (3):
396–402.
Arnett, D. B., D. A. Laverie, and A. Meiers. 2003. “Developing
Parsimonious Retailer Equity Indexes Using Partial Least
Squares Analysis: A Method and Applications.” Journal of
Retailing 79 (3): 161–70.
Bagozzi, R. P., and T. F. Heatherton. 1994. “A General
Approach to
Representing Multifaceted Personality Constructs: Application
to
State Self-Esteem.” Structural Equation Modeling 1 (1): 35–67.
Beatson, A., L. V. Coote, and J. M. Rudd. 2006. “Determining
Consumer Satisfaction and Commitment through Self-
Service Technology and Personal Service Usage.” Journal of
Marketing Management 22 (7-8): 853–82.
Bowen, D., and J. Clarke. 2002. “Reflections on Tourist
Satisfaction
Research: Past, Present and Future.” Journal of Vacation
Marketing 8 (4): 297–308.
Buell, R. W., D. Campbell, and F. X. Frei. 2010. “Are Self-
Service
Customers Satisfied or Stuck?” Production and Operations
Management 19 (6): 679–97.
Chea, S., and M. M. Luo. 2008. “Post-Adoption Behaviors of
E-service Customers: The Interplay of Cognition and Emotion.”
International Journal of Electronic Commerce 12 (3): 29–56.
Chen, S.-C., H.-H. Chen, and M.-F. Chen. 2009. “Determinants
of Satisfaction and Continuance Intention towards Self-Service
Technologies.” Industrial Management & Data Systems 109
(9): 1248–63.
Chen, S.-C., M.-L. Liu, and C.-P. Lin. 2013. “Integrating
Technology
Readiness into the Expectation-Confirmation Model: An
Empirical Study of Mobile Services.” Cyberpsychology,
Behavior, and Social Networking 16 (8): 604–12.
Chen, S. C. 2011. “Understanding the Effects of Technology
Readiness, Satisfaction, and Electronic Word of Mouth on
Loyalty in 3C Products.” Australian Journal of Business and
Management Research 1 (3).
Chin, W. W. 1998. “The Partial Least Squares Approach to
Structural Equation Modelling.” In Modern Methods for
Business Research, edited by G. A. Marcoulides, 295–336.
Mahwah, NJ: Lawrence Erlbaum.
Chin, W. W., and J. Dibbern. 2010. “An Introduction to a
Permutation Based Procedure for Multi-Group PLS Analysis:
Results of Tests of Differences on Simulated Data and a Cross
Cultural Analysis of the Sourcing of Information System
Services between Germany and the USA.” In Handbook of
Partial Least Squares, 171–93. Berlin: Springer.
Chu, S.-C., and S. M. Choi. 2011. “Electronic Word-of-Mouth
in
Social Networking Sites: A Cross-Cultural Study of the United
States and China.” Journal of Global Marketing 24 (3): 263–81.
Chung, N., H. Han, and Y. Joun. 2015. “Tourists’ Intention to
Visit a
Destination: The Role of Augmented Reality (AR) Application
for a Heritage Site.” Computers in Human Behavior 50:588–99.
Dabholkar, P. A. 1996. “Consumer Evaluations of New
Technology-
Based Self-Service Options: An Investigation of Alternative
Models of Service Quality.” International Journal of Research
in Marketing 13 (1): 29–51.
de Groot, R. 2015. “The Impact of Technology-Based Self-
Service
on Airline Passengers.” Aeronautica 3 (1): 1–78.
do Valle, P. O., and G. Assaker. 2016. “Using Partial Least
Squares Structural Equation Modeling in Tourism Research:
A Review of Past Research and Recommendations for Future
Applications.” Journal of Travel Research 55 (6): 695–708.
Donthu, N., and B. Yoo. 1998. “Cultural Influences on Service
Quality
Expectations.” Journal of Service Research 1 (2): 178–86.
Duarte, P. A. O., and M. L. B. Raposo. 2010. “A PLS Model to
Study Brand Preference: An Application to the Mobile Phone
Market.” In Handbook of Partial Least Squares, edited by V.
E. Vinzi, W. W. Chin, J. Henseler, and H. Wang, 449–85.
Berlin: Springer.
Elliott, K., G. Meng, and M. Hall. 2012. “The Influence of
Technology
Readiness on the Evaluation of Self-Service Technology
Attributes and Resulting Attitude toward Technology Usage.”
Services Marketing Quarterly 33 (4): 311–29.
Ert, E., and A. Fleischer. 2016. “Mere Position Effect in
Booking
Hotels Online.” Journal of Travel Research 55 (3): 311–321.
Falk, R. F., and N. B. Miller. 1992. A Primer for Soft Modeling.
Akron, OH: University of Akron Press.
Ferreira, J. B., A. da Rocha, and J. F. da Silva. 2014. “Impacts
of
Technology Readiness on Emotions and Cognition in Brazil.”
Journal of Business Research 67 (5): 865–73.
Wang et al. 575
Fornell, C., and F. L. Bookstein. 1982. “Two Structural
Equation
Models: LISREL and PLS Applied to Consumer Exit-Voice
Theory.” Journal of Marketing Research 19 (4): 440–52.
Fornell, C., and D. F. Larcker. 1981. “Evaluating Structural
Equation
Models with Unobservable Variables and Measurement Error.”
Journal of Marketing Research 18 (1): 39–50.
Ganguli, S., and S. K. Roy. 2011. “Generic Technology-Based
Service Quality Dimensions in Banking: Impact on Customer
Satisfaction and Loyalty.” International Journal of Bank
Marketing 29 (2): 168–89.
Gerbing, D. W., and J. C. Anderson. 1988. “An Updated
Paradigm
for Scale Development Incorporating Unidimensionality and
Its Assessment.” Journal of Marketing Research 25 (2):
186–92.
Giebelhausen, M., S. G. Robinson, N. J. Sirianni, and M. K.
Brady.
2014. “Touch versus Tech: When Technology Functions
as a Barrier or a Benefit to Service Encounters.” Journal of
Marketing 78 (4): 113–24.
Gounaris, S., S. Dimitriadis, and V. Stathakopoulos. 2010. “An
Examination of the Effects of Service Quality and Satisfaction
on Customers’ Behavioral Intentions in E-shopping.” Journal
of Services Marketing 24 (2): 142–56.
Gretzel, U., M. Kang, and W. Lee. 2008. “Differences in
Consumer-
Generated Media Adoption and Use: A Cross-National
Perspective.” Journal of Hospitality & Leisure Marketing 17
(1-2): 99–120.
Hair, J. F., W. C. Black, B. J. Babin, R. E. Anderson, and R. L.
Tatham. 2006. Multivariate Data Analysis. Upper Saddle
River, NJ: Pearson Prentice Hall.
Hair, J. F., G. T. M. Hult, C. Ringle, and M. Sarstedt. 2013. A
Primer on Partial Least Squares Structural Equation Modeling
(PLS-SEM). Thousand Oaks, CA: Sage.
Hair, J. F., C. M. Ringle, and M. Sarstedt. 2011. “PLS-SEM:
Indeed
a Silver Bullet.” Journal of Marketing Theory and Practice 19
(2): 139–52.
Henseler, J., and G. Fassott. 2010. “Testing Moderating Effects
in
PLS Path Models: An Illustration of Available Procedures.” In
Handbook of Partial Least Squares, edited by V. E. Vinzi, W.
W. Chin, J. Henseler, and H. Wang, 713–35. Berlin: Springer.
Hofstede, G. H., and G. Hofstede. 2001. Culture’s
Consequences:
Comparing Values, Behaviors, Institutions and Organizations
across Nations. Thousand Oaks, CA: Sage.
Im, I., S. Hong, and M. S. Kang. 2011. “An International
Comparison of Technology Adoption: Testing the Utaut
Model.” Information & Management 48 (1): 1–8.
International Air Transport Association. 2011. Vision 2050.
Singapore: International Air Transport Association.
Johnson, D. S., F. Bardhi, and D. T. Dunn. 2008.
“Understanding
How Technology Paradoxes Affect Customer Satisfaction with
Self-Service Technology: The Role of Performance Ambiguity
and Trust in Technology.” Psychology & Marketing 25 (5):
416–43.
Kang, M., and U. Gretzel. 2012a. “Effects of Podcast Tours on
Tourist Experiences in a National Park.” Tourism Management
33 (2): 440–55.
Kang, M., and U. Gretzel. 2012b. “Perceptions of Museum
Podcast
Tours: Effects of Consumer Innovativeness, Internet Familiarity
and Podcasting Affinity on Performance Expectancies.”
Tourism Management Perspectives 4:155–63.
Kim, D. Y., J. Park, and A. M. Morrison. 2008. “A Model of
Traveller Acceptance of Mobile Technology.” International
Journal of Tourism Research 10 (5): 393–407.
Kim, J. S., N. Christodoulidou, and P. Brewer. 2012. “Impact
of Individual Differences and Consumers’ Readiness on
Likelihood of Using Self-Service Technologies at Hospitality
Settings.” Journal of Hospitality & Tourism Research 36 (1):
85–114.
Lamsfus, C., D. Wang, A. Alzua-Sorzabal, and Z. Xiang. 2015.
“Going Mobile: Defining Context for on-the-Go Travelers.”
Journal of Travel Research 54 (6): 691–701.
Lassar, W. M., C. Manolis, and S. S. Lassar. 2005. “The
Relationship between Consumer Innovativeness, Personal
Characteristics, and Online Banking Adoption.” International
Journal of Bank Marketing 23 (2): 176–99.
Lee, F.-H., and W.-Y. Wu. 2011. “Moderating Effects of
Technology
Acceptance Perspectives on E-service Quality Formation:
Evidence from Airline Websites in Taiwan.” Expert Systems
with Applications 38 (6): 7766–73.
Lee, W., C. Castellanos, and H. Choi. 2012. “The Effect of
Technology Readiness on Customers’ Attitudes toward Self-
Service Technology and Its Adoption; The Empirical Study of
US Airline Self-Service Check-in Kiosks.” Journal of Travel
& Tourism Marketing 29 (8): 731–43.
Liljander, V., F. Gillberg, J. Gummerus, and A. van Riel. 2006.
“Technology Readiness and the Evaluation and Adoption
of Self-Service Technologies.” Journal of Retailing and
Consumer Services 13 (3): 177–91.
Lin, B.-W., and D. Berg. 2001. “Effects of Cultural Difference
on Technology Transfer Projects: An Empirical Study of
Taiwanese Manufacturing Companies.” International Journal
of Project Management 19 (5): 287–93.
Lin, J.-S. C., and P.-L. Hsieh. 2006. “The Role of Technology
Readiness in Customers’ Perception and Adoption of Self-
Service Technologies.” International Journal of Service
Industry Management 17 (5): 497–517.
Lin, J.-S. C., and P.-L. Hsieh. 2007. “The Influence of
Technology
Readiness on Satisfaction and Behavioral Intentions toward
Self-Service Technologies.” Computers in Human Behavior
23 (3): 1597–1615.
Lu, J.-L., J. K. Choi, and W.-C. Tseng. 2011. “Determinants
of Passengers’ Choice of Airline Check-in Services: A Case
Study of American, Australian, Korean, and Taiwanese
Passengers.” Journal of Air Transport Management 17 (4):
249–22.
Lu, J., L. Wang, and L. A. Hayes. 2012. “How Do Technology
Readiness, Platform Functionality and Trust Influence C2C
User Satisfaction?” Journal of Electronic Commerce Research
13 (1): 50–69.
Makarem, S. C., S. M. Mudambi, and J. S. Podoshen. 2009.
“Satisfaction in Technology-Enabled Service Encounters.”
Journal of Services Marketing 23 (3): 134–44.
Mattila, A. S., and D. J. Mount. 2003. “The Impact of Selected
Customer Characteristics and Response Time on E-complaint
Satisfaction and Return Intent.” International Journal of
Hospitality Management 22 (2): 135–45.
Meng, J., K. M. Elliott, and M. C. Hall. 2009. “Technology
Readiness Index (TRI): Assessing Cross-Cultural Validity.”
Journal of International Consumer Marketing 22 (1): 19–31.
576 Journal of Travel Research 56(5)
Meuter, M. L., A. L. Ostrom, M. J. Bitner, and R. Roundtree.
2003.
“The Influence of Technology Anxiety on Consumer Use
and Experiences with Self-Service Technologies.” Journal of
Business Research 56 (11): 899–906.
Morgan, R. M., and S. D. Hunt. 1994. “The Commitment-Trust
Theory of Relationship Marketing.” Journal of Marketing 58
(3): 20–38.
Nunnally, J. C. 1978. Psychometric Theory. New York:
McCraw-
Hill.
Nunnally, J. C., and I. H. Bernstein. 1994. Psychometric
Theory.
New York: McCraw-Hill.
Oliver, R. L. 1997. Satisfaction: A Behavioral Perspective on
the
Consumer. New York: McGraw-Hill.
Parasuraman, A. 2000. “Technology Readiness Index (TRI): A
Multiple-Item Scale to Measure Readiness to Embrace New
Technologies.” Journal of Service Research 2 (4): 307–20.
Parasuraman, A., V. A. Zeithaml, and A. Malhotra. 2005.
“ES-QUAL: A Multiple-Item Scale for Assessing Electronic
Service Quality.” Journal of Service Research 7 (3): 213–33.
Polites, G. L., C. K. Williams, E. Karahanna, and L. Seligman.
2012. “A Theoretical Framework for Consumer E-satisfaction
and Site Stickiness: An Evaluation in the Context of Online
Hotel Reservations.” Journal of Organizational Computing
and Electronic Commerce 22 (1): 1–37.
Rosenbaum, M. S., and I. A. Wong. 2015. “If You Install It,
Will
They Use It? Understanding Why Hospitality Customers Take
“Technological Pauses” from Self-Service Technology.”
Journal of Business Research 68 (9): 1862–68.
So, K. K. F., C. King, and B. Sparks. 2014. “Customer
Engagement
with Tourism Brands: Scale Development and Validation.”
Journal of Hospitality & Tourism Research 38 (3): 304–29.
So, K. K. F., C. King, B. A. Sparks, and Y. Wang. 2016. “The
Role of Customer Engagement in Building Consumer Loyalty
to Tourism Brands.” Journal of Travel Research 55 (1): 64–78.
So, K. K. F., W. Liu, Y. Wang, and B. Sparks. 2016. “Service
Expectations of Chinese Outbound Tourists.” In Chinese
Outbound Tourism 2.0, edited by X. R. Li, 185–98. Oakville,
Canada: CRC Press.
Son, M., and K. Han. 2011. “Beyond the Technology Adoption:
Technology Readiness Effects on Post-adoption Behavior.”
Journal of Business Research 64 (11): 1178–82.
Spreng, R. A., and J.-S. Chiou. 2002. “A Cross-Cultural
Assessment
of the Satisfaction Formation Process.” European Journal of
Marketing 36 (7/8): 829–39.
Srite, M., and E. Karahanna. 2006. “The Role of Espoused
National
Cultural Values in Technology Acceptance.” MIS Quarterly 30
(3): 679–704.
Szymanski, D. M., and D. H. Henard. 2001. “Customer
Satisfaction:
A Meta-analysis of the Empirical Evidence.” Journal of the
Academy of Marketing Science 29 (1): 16–35.
Tam, J. L. M. 2011. “The Moderating Effects of Purchase
Importance
in Customer Satisfaction Process: An Empirical Investigation.”
Journal of Consumer Behaviour 10 (4): 205–15.
Tellis, G. J., E. Yin, and S. Bell. 2009. “Global Consumer
Innovativeness: Cross-Country Differences and Demographic
Commonalities.” Journal of International Marketing 17 (2):
1–22.
Thong, J. Y., S.-J. Hong, and K. Y. Tam. 2006. “The Effects of
Post-adoption Beliefs on the Expectation-Confirmation Model
for Information Technology Continuance.” International
Journal of Human-Computer Studies 64 (9): 799–810.
Truong, Y. 2013. “A Cross-Country Study of Consumer
Innovativeness and Technological Service Innovation.”
Journal of Retailing and Consumer Services 20 (1): 130–37.
Tsang, N. K. F., M. T. Lai, and R. Law. 2010. “Measuring E-
service
Quality for Online Travel Agencies.” Journal of Travel &
Tourism Marketing 27 (3): 306–23.
Tussyadiah, I. P., and D. Wang. 2016. “Tourists’ Attitudes
toward
Proactive Smartphone Systems.” Journal of Travel Research
55 (4): 493–508.
Tussyadiah, I. P., and F. J. Zach. 2012. “The Role of Geo-Based
Technology in Place Experiences.” Annals of Tourism
Research 39 (2): 780–800.
Tuunanen, T., and H. Cassab. 2011. “Service Process
Modularization:
Reuse versus Variation in Service Extensions.” Journal of
Service Research 14 (3): 340–54.
UNWTO. 2015. UNWTO Tourism Highlights, 2015 ed. Madrid,
Spain: UNWTO.
Vinzi, V. E., L. Trinchera, and S. Amato. 2010. “PLS Path
Modeling: From Foundations to Recent Developments and
Open Issues for Model Assessment and Improvement.” In
Handbook of Partial Least Squares, edited by V. E. Vinzi, W.
W. Chin, J. Henseler, and H. Wang, 47–82. Berlin: Springer.
Walczuch, R., J. Lemmink, and S. Streukens. 2007. “The Effect
of Service Employees’ Technology Readiness on Technology
Acceptance.” Information & Management 44 (2): 206–15.
Wang, D., S. Park, and D. R. Fesenmaier. 2012. “The Role of
Smartphones in Mediating the Touristic Experience.” Journal
of Travel Research 51 (4): 371–87.
Wang, D., Z. Xiang, and D. R. Fesenmaier. 2016. “Smartphone
Use
in Everyday Life and Travel.” Journal of Travel Research 55
(1): 52–63.
Wang, Y., K. K. F. So, and B. A. Sparks. 2014. “What
Technology-
Enabled Services Do Air Travelers Value? Investigating the
Role of Technology Readiness.” Journal of Hospitality &
Tourism Research 1–26. doi:10.1177/1096348014538050.
Wang, Y., and B. Sparks. 2014. “Technology-Enabled Services:
Importance and Role of Technology Readiness.” Tourism
Analysis 19 (1): 19–33.
Westjohn, S. A., M. J. Arnold, P. Magnusson, S. Zdravkovic,
and J.
X. Zhou. 2009. “Technology Readiness and Usage: A Global-
Identity Perspective.” Journal of the Academy of Marketing
Science 37 (3): 250–65.
Whetten, David A. 1989. “What Constitutes a Theoretical
Contribution?.” Academy of Management Review 14 (4): 490-
495.
Xiang, Z., V. P. Magnini, and D. R. Fesenmaier. 2015.
“Information
Technology and Consumer Behavior in Travel and Tourism:
Insights from Travel Planning Using the Internet.” Journal of
Retailing and Consumer Services 22:244–49.
Xiang, Z., D. Wang, J. T. O’Leary, and D. R. Fesenmaier. 2015.
“Adapting to the Internet: Trends in Travelers’ Use of the Web
for Trip Planning.” Journal of Travel Research 54 (4): 511–27.
Yoo, K.-H., and U. Gretzel. 2011. “Influence of Personality
on Travel-Related Consumer-Generated Media Creation.”
Computers in Human Behavior 27 (2): 609–21.
Zeithaml, V. A., A. Parasuraman, and A. Malhotra. 2002.
“Service
Quality Delivery through Web Sites: A Critical Review of
Wang et al. 577
Extant Knowledge.” Journal of the Academy of Marketing
Science 30 (4): 362–75.
Author Biographies
Ying Wang is a senior lecturer with the Department of Tourism,
Sport and Hotel Management at Griffith University. Her
research
interests lie in destination management and marketing,
particularly
topics of Chinese tourism, consumer experience with
technolgies
and responses to marketing stimulus.
Kevin Kam Fung So, PhD, is an assistant professor in the
School
of Hotel, Restaurant and Tourism Management and a Research
Associate in the SmartState Center of Economic Excellence in
Tourism and Economic Development at the University of South
Carolina. His research interests focus on services marketing and
service management, with a special emphasis on customer
engage-
ment and interactions in social media, service branding,
electronic
word of mouth, and internal branding in the tourism and
hospitality
industry.
Beverley A. Sparks is a professor with the Department of
Tourism,
Sport and Hotel Management at Griffith University, Australia.
She
is an active researcher, with a strong track record of grants and
jour-
nal publications. Her research interests lie in customer
experience,
electronic word of mouth and service failure/recovery in the
tour-
ism and hospitality industry.
PowerPoint presentation and a one page Word documentYou should .docx

More Related Content

Similar to PowerPoint presentation and a one page Word documentYou should .docx

Assessing The Usability Of University Websites An Empirical Study On Namik K...
Assessing The Usability Of University Websites  An Empirical Study On Namik K...Assessing The Usability Of University Websites  An Empirical Study On Namik K...
Assessing The Usability Of University Websites An Empirical Study On Namik K...Brandi Gonzales
 
Assessment 3 EssayLength1500 wordsWeighting45This la.docx
Assessment 3 EssayLength1500 wordsWeighting45This la.docxAssessment 3 EssayLength1500 wordsWeighting45This la.docx
Assessment 3 EssayLength1500 wordsWeighting45This la.docxfestockton
 
An Evaluation Of Educational Web-Sites From The Perspective Of Perception-Ori...
An Evaluation Of Educational Web-Sites From The Perspective Of Perception-Ori...An Evaluation Of Educational Web-Sites From The Perspective Of Perception-Ori...
An Evaluation Of Educational Web-Sites From The Perspective Of Perception-Ori...Lisa Muthukumar
 
Best Honeymoon Destinations-Goa Tour Packages |Nation Travel Agency
Best Honeymoon Destinations-Goa Tour Packages |Nation Travel AgencyBest Honeymoon Destinations-Goa Tour Packages |Nation Travel Agency
Best Honeymoon Destinations-Goa Tour Packages |Nation Travel Agencyshabinss
 
CH 2 – Global InterdependenceThis chapter of the book goes deepe.docx
CH 2 – Global InterdependenceThis chapter of the book goes deepe.docxCH 2 – Global InterdependenceThis chapter of the book goes deepe.docx
CH 2 – Global InterdependenceThis chapter of the book goes deepe.docxsleeperharwell
 
Impacts of online word-of-mouth and personalities on intention to choose a de...
Impacts of online word-of-mouth and personalities on intention to choose a de...Impacts of online word-of-mouth and personalities on intention to choose a de...
Impacts of online word-of-mouth and personalities on intention to choose a de...Nghiên Cứu Định Lượng
 
E-learning: emerging uses,empirical results and future directions.
E-learning: emerging uses,empirical results and future directions. E-learning: emerging uses,empirical results and future directions.
E-learning: emerging uses,empirical results and future directions. eraser Juan José Calderón
 
THE USE OF CLOUD COMPUTING SYSTEMS IN HIGHER EDUCATION; The Lived Experien...
THE USE OF CLOUD COMPUTING SYSTEMS IN HIGHER EDUCATION;  The Lived Experien...THE USE OF CLOUD COMPUTING SYSTEMS IN HIGHER EDUCATION;  The Lived Experien...
THE USE OF CLOUD COMPUTING SYSTEMS IN HIGHER EDUCATION; The Lived Experien...African Virtual University
 
A Review Of Hospitality Website Design Frameworks
A Review Of Hospitality Website Design FrameworksA Review Of Hospitality Website Design Frameworks
A Review Of Hospitality Website Design FrameworksKristen Flores
 
e- Research As Intervention (5 April 2010) J Unit
e- Research As Intervention (5 April 2010) J Unite- Research As Intervention (5 April 2010) J Unit
e- Research As Intervention (5 April 2010) J UnitWebometrics Class
 
Feedback, Agency and Analytics in Virtual Learning Environments – Creating a ...
Feedback, Agency and Analytics in Virtual Learning Environments – Creating a ...Feedback, Agency and Analytics in Virtual Learning Environments – Creating a ...
Feedback, Agency and Analytics in Virtual Learning Environments – Creating a ...Diogo Casanova
 
Running Head ANNOTATED BIBLIOGRAPHY1ANNOTATED BIBLIOGRAPHY .docx
Running Head ANNOTATED BIBLIOGRAPHY1ANNOTATED BIBLIOGRAPHY .docxRunning Head ANNOTATED BIBLIOGRAPHY1ANNOTATED BIBLIOGRAPHY .docx
Running Head ANNOTATED BIBLIOGRAPHY1ANNOTATED BIBLIOGRAPHY .docxSUBHI7
 
Development of the_wheelchair_interface_questionna
Development of the_wheelchair_interface_questionnaDevelopment of the_wheelchair_interface_questionna
Development of the_wheelchair_interface_questionnazelalemdessalegn3
 
Establishing Requirements for a Mobile Learning System H
Establishing Requirements for a Mobile Learning System HEstablishing Requirements for a Mobile Learning System H
Establishing Requirements for a Mobile Learning System HBetseyCalderon89
 
A Mixed-Method Study Of User Behavior And Usability On An Online Travel Agency
A Mixed-Method Study Of User Behavior And Usability On An Online Travel AgencyA Mixed-Method Study Of User Behavior And Usability On An Online Travel Agency
A Mixed-Method Study Of User Behavior And Usability On An Online Travel AgencyAaron Anyaakuu
 
Getting Successful Universal Ehr Is Not Just Technology...
Getting Successful Universal Ehr Is Not Just Technology...Getting Successful Universal Ehr Is Not Just Technology...
Getting Successful Universal Ehr Is Not Just Technology...Jessica Tanner
 
BRM Project by Reeba and Rida .docx
BRM Project by Reeba and Rida .docxBRM Project by Reeba and Rida .docx
BRM Project by Reeba and Rida .docxreeba20
 

Similar to PowerPoint presentation and a one page Word documentYou should .docx (20)

Assessing The Usability Of University Websites An Empirical Study On Namik K...
Assessing The Usability Of University Websites  An Empirical Study On Namik K...Assessing The Usability Of University Websites  An Empirical Study On Namik K...
Assessing The Usability Of University Websites An Empirical Study On Namik K...
 
Assessment 3 EssayLength1500 wordsWeighting45This la.docx
Assessment 3 EssayLength1500 wordsWeighting45This la.docxAssessment 3 EssayLength1500 wordsWeighting45This la.docx
Assessment 3 EssayLength1500 wordsWeighting45This la.docx
 
An Evaluation Of Educational Web-Sites From The Perspective Of Perception-Ori...
An Evaluation Of Educational Web-Sites From The Perspective Of Perception-Ori...An Evaluation Of Educational Web-Sites From The Perspective Of Perception-Ori...
An Evaluation Of Educational Web-Sites From The Perspective Of Perception-Ori...
 
Best Honeymoon Destinations-Goa Tour Packages |Nation Travel Agency
Best Honeymoon Destinations-Goa Tour Packages |Nation Travel AgencyBest Honeymoon Destinations-Goa Tour Packages |Nation Travel Agency
Best Honeymoon Destinations-Goa Tour Packages |Nation Travel Agency
 
CH 2 – Global InterdependenceThis chapter of the book goes deepe.docx
CH 2 – Global InterdependenceThis chapter of the book goes deepe.docxCH 2 – Global InterdependenceThis chapter of the book goes deepe.docx
CH 2 – Global InterdependenceThis chapter of the book goes deepe.docx
 
Impacts of online word-of-mouth and personalities on intention to choose a de...
Impacts of online word-of-mouth and personalities on intention to choose a de...Impacts of online word-of-mouth and personalities on intention to choose a de...
Impacts of online word-of-mouth and personalities on intention to choose a de...
 
Chinese Adoption of Travel Information on Social Media: Moderating Effects of...
Chinese Adoption of Travel Information on Social Media: Moderating Effects of...Chinese Adoption of Travel Information on Social Media: Moderating Effects of...
Chinese Adoption of Travel Information on Social Media: Moderating Effects of...
 
E-learning: emerging uses,empirical results and future directions.
E-learning: emerging uses,empirical results and future directions. E-learning: emerging uses,empirical results and future directions.
E-learning: emerging uses,empirical results and future directions.
 
THE USE OF CLOUD COMPUTING SYSTEMS IN HIGHER EDUCATION; The Lived Experien...
THE USE OF CLOUD COMPUTING SYSTEMS IN HIGHER EDUCATION;  The Lived Experien...THE USE OF CLOUD COMPUTING SYSTEMS IN HIGHER EDUCATION;  The Lived Experien...
THE USE OF CLOUD COMPUTING SYSTEMS IN HIGHER EDUCATION; The Lived Experien...
 
A Review Of Hospitality Website Design Frameworks
A Review Of Hospitality Website Design FrameworksA Review Of Hospitality Website Design Frameworks
A Review Of Hospitality Website Design Frameworks
 
e- Research As Intervention (5 April 2010) J Unit
e- Research As Intervention (5 April 2010) J Unite- Research As Intervention (5 April 2010) J Unit
e- Research As Intervention (5 April 2010) J Unit
 
Feedback, Agency and Analytics in Virtual Learning Environments – Creating a ...
Feedback, Agency and Analytics in Virtual Learning Environments – Creating a ...Feedback, Agency and Analytics in Virtual Learning Environments – Creating a ...
Feedback, Agency and Analytics in Virtual Learning Environments – Creating a ...
 
Running Head ANNOTATED BIBLIOGRAPHY1ANNOTATED BIBLIOGRAPHY .docx
Running Head ANNOTATED BIBLIOGRAPHY1ANNOTATED BIBLIOGRAPHY .docxRunning Head ANNOTATED BIBLIOGRAPHY1ANNOTATED BIBLIOGRAPHY .docx
Running Head ANNOTATED BIBLIOGRAPHY1ANNOTATED BIBLIOGRAPHY .docx
 
Most Cited Articles in Academia
Most Cited Articles in AcademiaMost Cited Articles in Academia
Most Cited Articles in Academia
 
Development of the_wheelchair_interface_questionna
Development of the_wheelchair_interface_questionnaDevelopment of the_wheelchair_interface_questionna
Development of the_wheelchair_interface_questionna
 
Establishing Requirements for a Mobile Learning System H
Establishing Requirements for a Mobile Learning System HEstablishing Requirements for a Mobile Learning System H
Establishing Requirements for a Mobile Learning System H
 
A Mixed-Method Study Of User Behavior And Usability On An Online Travel Agency
A Mixed-Method Study Of User Behavior And Usability On An Online Travel AgencyA Mixed-Method Study Of User Behavior And Usability On An Online Travel Agency
A Mixed-Method Study Of User Behavior And Usability On An Online Travel Agency
 
Getting Successful Universal Ehr Is Not Just Technology...
Getting Successful Universal Ehr Is Not Just Technology...Getting Successful Universal Ehr Is Not Just Technology...
Getting Successful Universal Ehr Is Not Just Technology...
 
Ijsrdv8 i10398
Ijsrdv8 i10398Ijsrdv8 i10398
Ijsrdv8 i10398
 
BRM Project by Reeba and Rida .docx
BRM Project by Reeba and Rida .docxBRM Project by Reeba and Rida .docx
BRM Project by Reeba and Rida .docx
 

More from stilliegeorgiana

1. The Incident Command System (ICS) is a tool forA. Co.docx
1. The Incident Command System (ICS) is a tool forA. Co.docx1. The Incident Command System (ICS) is a tool forA. Co.docx
1. The Incident Command System (ICS) is a tool forA. Co.docxstilliegeorgiana
 
1. The Thirteenth Amendment effectively brought an end to slaver.docx
1. The Thirteenth Amendment effectively brought an end to slaver.docx1. The Thirteenth Amendment effectively brought an end to slaver.docx
1. The Thirteenth Amendment effectively brought an end to slaver.docxstilliegeorgiana
 
1. The Thirteenth Amendment effectively brought an end to slavery in.docx
1. The Thirteenth Amendment effectively brought an end to slavery in.docx1. The Thirteenth Amendment effectively brought an end to slavery in.docx
1. The Thirteenth Amendment effectively brought an end to slavery in.docxstilliegeorgiana
 
1. The Fight for a True Democracyhttpswww.nytimes.com201.docx
1. The Fight for a True Democracyhttpswww.nytimes.com201.docx1. The Fight for a True Democracyhttpswww.nytimes.com201.docx
1. The Fight for a True Democracyhttpswww.nytimes.com201.docxstilliegeorgiana
 
1. The article for week 8 described hip hop as a weapon. This weeks.docx
1. The article for week 8 described hip hop as a weapon. This weeks.docx1. The article for week 8 described hip hop as a weapon. This weeks.docx
1. The article for week 8 described hip hop as a weapon. This weeks.docxstilliegeorgiana
 
1. The Hatch Act defines prohibited activities of public employees. .docx
1. The Hatch Act defines prohibited activities of public employees. .docx1. The Hatch Act defines prohibited activities of public employees. .docx
1. The Hatch Act defines prohibited activities of public employees. .docxstilliegeorgiana
 
1. The Case for Reparations” by Ta-Nehisi Coates (604-19) in Rere.docx
1. The Case for Reparations” by Ta-Nehisi Coates (604-19) in Rere.docx1. The Case for Reparations” by Ta-Nehisi Coates (604-19) in Rere.docx
1. The Case for Reparations” by Ta-Nehisi Coates (604-19) in Rere.docxstilliegeorgiana
 
1. Some people say that chatbots are inferior for chatting.Others di.docx
1. Some people say that chatbots are inferior for chatting.Others di.docx1. Some people say that chatbots are inferior for chatting.Others di.docx
1. Some people say that chatbots are inferior for chatting.Others di.docxstilliegeorgiana
 
1. Some people say that chatbots are inferior for chatting.Other.docx
1. Some people say that chatbots are inferior for chatting.Other.docx1. Some people say that chatbots are inferior for chatting.Other.docx
1. Some people say that chatbots are inferior for chatting.Other.docxstilliegeorgiana
 
1. Some people say that chatbots are inferior for chatting. Others d.docx
1. Some people say that chatbots are inferior for chatting. Others d.docx1. Some people say that chatbots are inferior for chatting. Others d.docx
1. Some people say that chatbots are inferior for chatting. Others d.docxstilliegeorgiana
 
1. Tell us about yourself and your personal journey that has to .docx
1. Tell us about yourself and your personal journey that has to .docx1. Tell us about yourself and your personal journey that has to .docx
1. Tell us about yourself and your personal journey that has to .docxstilliegeorgiana
 
1. Tell us what characteristics of Loma Linda University are particu.docx
1. Tell us what characteristics of Loma Linda University are particu.docx1. Tell us what characteristics of Loma Linda University are particu.docx
1. Tell us what characteristics of Loma Linda University are particu.docxstilliegeorgiana
 
1. Tell us about yourself and your personal journey that has lea.docx
1. Tell us about yourself and your personal journey that has lea.docx1. Tell us about yourself and your personal journey that has lea.docx
1. Tell us about yourself and your personal journey that has lea.docxstilliegeorgiana
 
1. The Research paper will come in five parts. The instructions are.docx
1. The Research paper will come in five parts. The instructions are.docx1. The Research paper will come in five parts. The instructions are.docx
1. The Research paper will come in five parts. The instructions are.docxstilliegeorgiana
 
1. The minutiae points located on a fingerprint will help determine .docx
1. The minutiae points located on a fingerprint will help determine .docx1. The minutiae points located on a fingerprint will help determine .docx
1. The minutiae points located on a fingerprint will help determine .docxstilliegeorgiana
 
1. The initial post is to be posted first and have 300-500 words.docx
1. The initial post is to be posted first and have 300-500 words.docx1. The initial post is to be posted first and have 300-500 words.docx
1. The initial post is to be posted first and have 300-500 words.docxstilliegeorgiana
 
1. The key elements of supplier measurement are quality, delivery, a.docx
1. The key elements of supplier measurement are quality, delivery, a.docx1. The key elements of supplier measurement are quality, delivery, a.docx
1. The key elements of supplier measurement are quality, delivery, a.docxstilliegeorgiana
 
1. Search the Internet and locate an article that relates to the top.docx
1. Search the Internet and locate an article that relates to the top.docx1. Search the Internet and locate an article that relates to the top.docx
1. Search the Internet and locate an article that relates to the top.docxstilliegeorgiana
 
1. Text mining – Text mining or text data mining is a process to e.docx
1. Text mining – Text mining or text data mining is a process to e.docx1. Text mining – Text mining or text data mining is a process to e.docx
1. Text mining – Text mining or text data mining is a process to e.docxstilliegeorgiana
 
1. Students need to review 3 different social media platforms that a.docx
1. Students need to review 3 different social media platforms that a.docx1. Students need to review 3 different social media platforms that a.docx
1. Students need to review 3 different social media platforms that a.docxstilliegeorgiana
 

More from stilliegeorgiana (20)

1. The Incident Command System (ICS) is a tool forA. Co.docx
1. The Incident Command System (ICS) is a tool forA. Co.docx1. The Incident Command System (ICS) is a tool forA. Co.docx
1. The Incident Command System (ICS) is a tool forA. Co.docx
 
1. The Thirteenth Amendment effectively brought an end to slaver.docx
1. The Thirteenth Amendment effectively brought an end to slaver.docx1. The Thirteenth Amendment effectively brought an end to slaver.docx
1. The Thirteenth Amendment effectively brought an end to slaver.docx
 
1. The Thirteenth Amendment effectively brought an end to slavery in.docx
1. The Thirteenth Amendment effectively brought an end to slavery in.docx1. The Thirteenth Amendment effectively brought an end to slavery in.docx
1. The Thirteenth Amendment effectively brought an end to slavery in.docx
 
1. The Fight for a True Democracyhttpswww.nytimes.com201.docx
1. The Fight for a True Democracyhttpswww.nytimes.com201.docx1. The Fight for a True Democracyhttpswww.nytimes.com201.docx
1. The Fight for a True Democracyhttpswww.nytimes.com201.docx
 
1. The article for week 8 described hip hop as a weapon. This weeks.docx
1. The article for week 8 described hip hop as a weapon. This weeks.docx1. The article for week 8 described hip hop as a weapon. This weeks.docx
1. The article for week 8 described hip hop as a weapon. This weeks.docx
 
1. The Hatch Act defines prohibited activities of public employees. .docx
1. The Hatch Act defines prohibited activities of public employees. .docx1. The Hatch Act defines prohibited activities of public employees. .docx
1. The Hatch Act defines prohibited activities of public employees. .docx
 
1. The Case for Reparations” by Ta-Nehisi Coates (604-19) in Rere.docx
1. The Case for Reparations” by Ta-Nehisi Coates (604-19) in Rere.docx1. The Case for Reparations” by Ta-Nehisi Coates (604-19) in Rere.docx
1. The Case for Reparations” by Ta-Nehisi Coates (604-19) in Rere.docx
 
1. Some people say that chatbots are inferior for chatting.Others di.docx
1. Some people say that chatbots are inferior for chatting.Others di.docx1. Some people say that chatbots are inferior for chatting.Others di.docx
1. Some people say that chatbots are inferior for chatting.Others di.docx
 
1. Some people say that chatbots are inferior for chatting.Other.docx
1. Some people say that chatbots are inferior for chatting.Other.docx1. Some people say that chatbots are inferior for chatting.Other.docx
1. Some people say that chatbots are inferior for chatting.Other.docx
 
1. Some people say that chatbots are inferior for chatting. Others d.docx
1. Some people say that chatbots are inferior for chatting. Others d.docx1. Some people say that chatbots are inferior for chatting. Others d.docx
1. Some people say that chatbots are inferior for chatting. Others d.docx
 
1. Tell us about yourself and your personal journey that has to .docx
1. Tell us about yourself and your personal journey that has to .docx1. Tell us about yourself and your personal journey that has to .docx
1. Tell us about yourself and your personal journey that has to .docx
 
1. Tell us what characteristics of Loma Linda University are particu.docx
1. Tell us what characteristics of Loma Linda University are particu.docx1. Tell us what characteristics of Loma Linda University are particu.docx
1. Tell us what characteristics of Loma Linda University are particu.docx
 
1. Tell us about yourself and your personal journey that has lea.docx
1. Tell us about yourself and your personal journey that has lea.docx1. Tell us about yourself and your personal journey that has lea.docx
1. Tell us about yourself and your personal journey that has lea.docx
 
1. The Research paper will come in five parts. The instructions are.docx
1. The Research paper will come in five parts. The instructions are.docx1. The Research paper will come in five parts. The instructions are.docx
1. The Research paper will come in five parts. The instructions are.docx
 
1. The minutiae points located on a fingerprint will help determine .docx
1. The minutiae points located on a fingerprint will help determine .docx1. The minutiae points located on a fingerprint will help determine .docx
1. The minutiae points located on a fingerprint will help determine .docx
 
1. The initial post is to be posted first and have 300-500 words.docx
1. The initial post is to be posted first and have 300-500 words.docx1. The initial post is to be posted first and have 300-500 words.docx
1. The initial post is to be posted first and have 300-500 words.docx
 
1. The key elements of supplier measurement are quality, delivery, a.docx
1. The key elements of supplier measurement are quality, delivery, a.docx1. The key elements of supplier measurement are quality, delivery, a.docx
1. The key elements of supplier measurement are quality, delivery, a.docx
 
1. Search the Internet and locate an article that relates to the top.docx
1. Search the Internet and locate an article that relates to the top.docx1. Search the Internet and locate an article that relates to the top.docx
1. Search the Internet and locate an article that relates to the top.docx
 
1. Text mining – Text mining or text data mining is a process to e.docx
1. Text mining – Text mining or text data mining is a process to e.docx1. Text mining – Text mining or text data mining is a process to e.docx
1. Text mining – Text mining or text data mining is a process to e.docx
 
1. Students need to review 3 different social media platforms that a.docx
1. Students need to review 3 different social media platforms that a.docx1. Students need to review 3 different social media platforms that a.docx
1. Students need to review 3 different social media platforms that a.docx
 

Recently uploaded

Advanced Views - Calendar View in Odoo 17
Advanced Views - Calendar View in Odoo 17Advanced Views - Calendar View in Odoo 17
Advanced Views - Calendar View in Odoo 17Celine George
 
microwave assisted reaction. General introduction
microwave assisted reaction. General introductionmicrowave assisted reaction. General introduction
microwave assisted reaction. General introductionMaksud Ahmed
 
Student login on Anyboli platform.helpin
Student login on Anyboli platform.helpinStudent login on Anyboli platform.helpin
Student login on Anyboli platform.helpinRaunakKeshri1
 
Nutritional Needs Presentation - HLTH 104
Nutritional Needs Presentation - HLTH 104Nutritional Needs Presentation - HLTH 104
Nutritional Needs Presentation - HLTH 104misteraugie
 
Sports & Fitness Value Added Course FY..
Sports & Fitness Value Added Course FY..Sports & Fitness Value Added Course FY..
Sports & Fitness Value Added Course FY..Disha Kariya
 
Accessible design: Minimum effort, maximum impact
Accessible design: Minimum effort, maximum impactAccessible design: Minimum effort, maximum impact
Accessible design: Minimum effort, maximum impactdawncurless
 
BAG TECHNIQUE Bag technique-a tool making use of public health bag through wh...
BAG TECHNIQUE Bag technique-a tool making use of public health bag through wh...BAG TECHNIQUE Bag technique-a tool making use of public health bag through wh...
BAG TECHNIQUE Bag technique-a tool making use of public health bag through wh...Sapna Thakur
 
Introduction to Nonprofit Accounting: The Basics
Introduction to Nonprofit Accounting: The BasicsIntroduction to Nonprofit Accounting: The Basics
Introduction to Nonprofit Accounting: The BasicsTechSoup
 
Measures of Dispersion and Variability: Range, QD, AD and SD
Measures of Dispersion and Variability: Range, QD, AD and SDMeasures of Dispersion and Variability: Range, QD, AD and SD
Measures of Dispersion and Variability: Range, QD, AD and SDThiyagu K
 
BASLIQ CURRENT LOOKBOOK LOOKBOOK(1) (1).pdf
BASLIQ CURRENT LOOKBOOK  LOOKBOOK(1) (1).pdfBASLIQ CURRENT LOOKBOOK  LOOKBOOK(1) (1).pdf
BASLIQ CURRENT LOOKBOOK LOOKBOOK(1) (1).pdfSoniaTolstoy
 
Web & Social Media Analytics Previous Year Question Paper.pdf
Web & Social Media Analytics Previous Year Question Paper.pdfWeb & Social Media Analytics Previous Year Question Paper.pdf
Web & Social Media Analytics Previous Year Question Paper.pdfJayanti Pande
 
9548086042 for call girls in Indira Nagar with room service
9548086042  for call girls in Indira Nagar  with room service9548086042  for call girls in Indira Nagar  with room service
9548086042 for call girls in Indira Nagar with room servicediscovermytutordmt
 
Paris 2024 Olympic Geographies - an activity
Paris 2024 Olympic Geographies - an activityParis 2024 Olympic Geographies - an activity
Paris 2024 Olympic Geographies - an activityGeoBlogs
 
social pharmacy d-pharm 1st year by Pragati K. Mahajan
social pharmacy d-pharm 1st year by Pragati K. Mahajansocial pharmacy d-pharm 1st year by Pragati K. Mahajan
social pharmacy d-pharm 1st year by Pragati K. Mahajanpragatimahajan3
 
POINT- BIOCHEMISTRY SEM 2 ENZYMES UNIT 5.pptx
POINT- BIOCHEMISTRY SEM 2 ENZYMES UNIT 5.pptxPOINT- BIOCHEMISTRY SEM 2 ENZYMES UNIT 5.pptx
POINT- BIOCHEMISTRY SEM 2 ENZYMES UNIT 5.pptxSayali Powar
 
Disha NEET Physics Guide for classes 11 and 12.pdf
Disha NEET Physics Guide for classes 11 and 12.pdfDisha NEET Physics Guide for classes 11 and 12.pdf
Disha NEET Physics Guide for classes 11 and 12.pdfchloefrazer622
 
Z Score,T Score, Percential Rank and Box Plot Graph
Z Score,T Score, Percential Rank and Box Plot GraphZ Score,T Score, Percential Rank and Box Plot Graph
Z Score,T Score, Percential Rank and Box Plot GraphThiyagu K
 
Beyond the EU: DORA and NIS 2 Directive's Global Impact
Beyond the EU: DORA and NIS 2 Directive's Global ImpactBeyond the EU: DORA and NIS 2 Directive's Global Impact
Beyond the EU: DORA and NIS 2 Directive's Global ImpactPECB
 

Recently uploaded (20)

Advanced Views - Calendar View in Odoo 17
Advanced Views - Calendar View in Odoo 17Advanced Views - Calendar View in Odoo 17
Advanced Views - Calendar View in Odoo 17
 
microwave assisted reaction. General introduction
microwave assisted reaction. General introductionmicrowave assisted reaction. General introduction
microwave assisted reaction. General introduction
 
Student login on Anyboli platform.helpin
Student login on Anyboli platform.helpinStudent login on Anyboli platform.helpin
Student login on Anyboli platform.helpin
 
Nutritional Needs Presentation - HLTH 104
Nutritional Needs Presentation - HLTH 104Nutritional Needs Presentation - HLTH 104
Nutritional Needs Presentation - HLTH 104
 
Sports & Fitness Value Added Course FY..
Sports & Fitness Value Added Course FY..Sports & Fitness Value Added Course FY..
Sports & Fitness Value Added Course FY..
 
Accessible design: Minimum effort, maximum impact
Accessible design: Minimum effort, maximum impactAccessible design: Minimum effort, maximum impact
Accessible design: Minimum effort, maximum impact
 
BAG TECHNIQUE Bag technique-a tool making use of public health bag through wh...
BAG TECHNIQUE Bag technique-a tool making use of public health bag through wh...BAG TECHNIQUE Bag technique-a tool making use of public health bag through wh...
BAG TECHNIQUE Bag technique-a tool making use of public health bag through wh...
 
Introduction to Nonprofit Accounting: The Basics
Introduction to Nonprofit Accounting: The BasicsIntroduction to Nonprofit Accounting: The Basics
Introduction to Nonprofit Accounting: The Basics
 
Measures of Dispersion and Variability: Range, QD, AD and SD
Measures of Dispersion and Variability: Range, QD, AD and SDMeasures of Dispersion and Variability: Range, QD, AD and SD
Measures of Dispersion and Variability: Range, QD, AD and SD
 
BASLIQ CURRENT LOOKBOOK LOOKBOOK(1) (1).pdf
BASLIQ CURRENT LOOKBOOK  LOOKBOOK(1) (1).pdfBASLIQ CURRENT LOOKBOOK  LOOKBOOK(1) (1).pdf
BASLIQ CURRENT LOOKBOOK LOOKBOOK(1) (1).pdf
 
Web & Social Media Analytics Previous Year Question Paper.pdf
Web & Social Media Analytics Previous Year Question Paper.pdfWeb & Social Media Analytics Previous Year Question Paper.pdf
Web & Social Media Analytics Previous Year Question Paper.pdf
 
9548086042 for call girls in Indira Nagar with room service
9548086042  for call girls in Indira Nagar  with room service9548086042  for call girls in Indira Nagar  with room service
9548086042 for call girls in Indira Nagar with room service
 
Paris 2024 Olympic Geographies - an activity
Paris 2024 Olympic Geographies - an activityParis 2024 Olympic Geographies - an activity
Paris 2024 Olympic Geographies - an activity
 
Mattingly "AI & Prompt Design: The Basics of Prompt Design"
Mattingly "AI & Prompt Design: The Basics of Prompt Design"Mattingly "AI & Prompt Design: The Basics of Prompt Design"
Mattingly "AI & Prompt Design: The Basics of Prompt Design"
 
Advance Mobile Application Development class 07
Advance Mobile Application Development class 07Advance Mobile Application Development class 07
Advance Mobile Application Development class 07
 
social pharmacy d-pharm 1st year by Pragati K. Mahajan
social pharmacy d-pharm 1st year by Pragati K. Mahajansocial pharmacy d-pharm 1st year by Pragati K. Mahajan
social pharmacy d-pharm 1st year by Pragati K. Mahajan
 
POINT- BIOCHEMISTRY SEM 2 ENZYMES UNIT 5.pptx
POINT- BIOCHEMISTRY SEM 2 ENZYMES UNIT 5.pptxPOINT- BIOCHEMISTRY SEM 2 ENZYMES UNIT 5.pptx
POINT- BIOCHEMISTRY SEM 2 ENZYMES UNIT 5.pptx
 
Disha NEET Physics Guide for classes 11 and 12.pdf
Disha NEET Physics Guide for classes 11 and 12.pdfDisha NEET Physics Guide for classes 11 and 12.pdf
Disha NEET Physics Guide for classes 11 and 12.pdf
 
Z Score,T Score, Percential Rank and Box Plot Graph
Z Score,T Score, Percential Rank and Box Plot GraphZ Score,T Score, Percential Rank and Box Plot Graph
Z Score,T Score, Percential Rank and Box Plot Graph
 
Beyond the EU: DORA and NIS 2 Directive's Global Impact
Beyond the EU: DORA and NIS 2 Directive's Global ImpactBeyond the EU: DORA and NIS 2 Directive's Global Impact
Beyond the EU: DORA and NIS 2 Directive's Global Impact
 

PowerPoint presentation and a one page Word documentYou should .docx

  • 1. PowerPoint presentation and a one page Word document: You should focus on the following: 1: What is the issue/topic? 2: Why is it important? Who cares? 3: What did the authors find in their research? 4: What did you like about the research? What were potential flaws/shortcomings of the research? 5: Propose your research that improves/expands upon what the authors did in this study. Discussion 1 (Emerging Threats and Counter Measures) 400 Words Wikis for Learning and Collaboration A wiki is a collaborative web site that collects and organizes content, created and revised by its users. The most well-known example is Wikipedia. Wikis are a way to grow a knowledge base around a particular content area, be it best practices in a particular field or how to use a specific piece of hardware/software. A hallmark of Web 2.0 is that it improves as more people use it and this approach underlies wiki-based learning. It is based on the idea that within any enterprise, a great deal of knowledge exists among the members. Sharing this knowledge and information can raise the organization’s intelligence level, be it a university, an association, a corporation or club. How basic discretion steps can help in countermeasures? Conduct your own research and post a short relevant summary of your findings. ( Post current information, not older than five years ). Use not more than three (3) references. TextBook: Amoroso, E. G. (2012). Cyber-attacks: protecting national infrastructure. Elsevier.
  • 2. Discussion 2 (InfoTech in a Global Economy) – 400 words Do you feel that countries and companies need explicit strategies for technology development, given the tremendous amount of largely spontaneous creativity that occurs today, often in areas where new technologies are not expected to exert a great influence. Why or why not? Please make your initial post and two response posts substantive. A substantive post will do at least TWO of the following: · Ask an interesting, thoughtful question pertaining to the topic · Answer a question (in detail) posted by another student or the instructor · Provide extensive additional information on the topic · Explain, define, or analyze the topic in detail · Share an applicable personal experience · Provide an outside source (for example, an article from the UC Library) that applies to the topic, along with additional information about the topic or the source (please cite properly in APA) · Make an argument concerning the topic. At least one scholarly source should be used in the initial discussion thread. Be sure to use information from your readings and other sources from the UC Library. Use proper citations and references in your post. TextBook: Bashir, I. (2017). Mastering Blockchain. Birmingham, UK: Packt Publishing. (UC Library) • Kressel, H., & Lento, T. V. (2012). Entrepreneurship in the Global Economy : Engine for Economic Growth. Cambridge, UK: Cambridge University Press. (Included through library subscription) • Medina, C. (2016). Federal Cybersecurity : Strategy and Implementation for Research and Development. New York: Nova Science Publishers, Inc. (Included through library subscription)
  • 3. • Olsen, S., & National Academy of Engineering (U.S.). (2011). Global Technology : Changes and Implications: Summary of a Forum. Washington, D.C.: National Academies Press. (UC Library) Journal of Travel Research 2017, Vol. 56(5) 563 –577 © The Author(s) 2016 Reprints and permissions: sagepub.com/journalsPermissions.nav DOI: 10.1177/0047287516657891 journals.sagepub.com/home/jtr Research Article Introduction Technologies, such as the Internet and mobile technologies, are particularly prominent in the travel industry (Giebelhausen et al. 2014) and have become a major channel for travel com- merce (Ert and Fleischer, 2016; Tussyadiah and Wang, 2016). Hotels, airlines, and attractions are augmenting traditional face-to-face service strategies with technology-enabled ser- vice (TES) interactions. Businesses implement technologies (e.g., online booking and review sites) to aid travelers’ deci- sion marking and trip planning (Xiang et al. 2015). On-site, technologies (e.g., podcast and smartphone) enable effective problem solving for travelers and can offer effective means of interpretations, significantly enhancing learning outcomes, enjoyment, and experience (Kang and Gretzel 2012a, 2012b;
  • 4. Wang, Xiang, and Fesenmaier 2016). Technologies also assist with better engaging the new and existing (So, King, et al. 2016; So, King, and Sparks 2014) and technology-savvy gen- eration of travelers (Kang and Gretzel 2012a, 2012b), as well as offer customers efficiency, convenience, and greater con- trol (Buell, Campbell, and Frei 2010). However, research has highlighted the paradoxical nature of travelers’ technology- related experiences, which not only provide benefits but can also create feelings of frustration, anxiety, stress, isolation, and chaos, resulting in dissatisfaction and leading to various coping strategies such as avoidance (Johnson, Bardhi, and Dunn 2008). Tourist behavioral models recognize the critical influence of personal/trip characteristics (e.g., attitude and personality) and environment (i.e., physical and social entities of contact) (Lamsfus et al. 2015). Travelers’ use of and satisfaction with technologies hinges on their technology readiness (TR), a personality trait defined as “ the propensity to embrace and use new technologies for accomplishing goals” (Parasuraman 2000, 308). TR is an important determinant or moderator of consumer attitudes toward and adoption of technologies (e.g., Chen, Chen, and Chen 2009; Walczuch, Lemmink, and Streukens 2007). The context within which technologies are experienced is critical as it sets the basis for understanding travel behavior (Lamsfus et al. 2015). Given that the travel environment is increasingly digitized with tourists literally traveling in physical and virtual IT-supported networks (Lamsfus et al. 2015), the TR construct has never been more relevant to tourism research than it is now. This study is a 657891 JTRXXX10.1177/0047287516657891Journal of Travel ResearchWang et al. research-article2016 1Department of Tourism, Sport and Hotel Management, Gold
  • 5. Coast campus, Griffith University, Queensland, Australia 2School of Hotel, Restaurant and Tourism Management, Center of Economic Excellence in Tourism and Economic Development, University of South Carolina, Columbia, SC, USA Corresponding Author: Ying Wang, Department of Tourism, Sport and Hotel Management, Gold Coast campus, Griffith University, Queensland 4222, Australia. Email: [email protected] Technology Readiness and Customer Satisfaction with Travel Technologies: A Cross-Country Investigation Ying Wang1, Kevin Kam Fung So2, and Beverley A. Sparks1 Abstract Technologies have dramatically transformed tourist experience. However, research has largely focused on traveler attitudes and technology adoption rather than their experience with travel technologies. Taking a cross-country perspective, this study examines the role of technology readiness (TR) as a personality trait in shaping travelers’ satisfaction with travel technologies, using airlines as a case study. Results of an online survey of travelers in Australia, China, and the United States revealed the moderating effects of the TR dimensions of optimism and innovativeness as well as country of residence on the relationships between perceived quality of technology-enabled services (TESs), satisfaction with TESs, overall satisfaction, and future behavior. These relationships were stronger among travelers with higher TR and varied across countries. The results suggest that tourism and hospitality service providers should
  • 6. incorporate measures of traveler TR and TESs’ performance into their customer-experience monitoring system. Keywords travel technologies, technology readiness, customer satisfaction, airlines, cross-country comparison 564 Journal of Travel Research 56(5) cross-country investigation of traveler experience with TESs in the tourism consumption process. It uses consumer experi- ence with airline TESs as a case study to evaluate a frame- work for understanding satisfaction with TESs, which includes the evaluation of TES quality, leading to satisfac- tion with TESs and the overall trip experience, and future behavioral intentions. The study’s major contributions are (1) to conceptualize and examine the moderating role of trav- elers' TR in shaping customer satisfaction and (2) to consider TR’s role in the framework of satisfaction in a cross-country sample including Australian, American, and Chinese travel- ers. The airline sector is chosen because of its particularly advanced TES offerings, ranging from self-check-in facili- ties to onboard services such as entertainment systems and Wi-Fi access (Wang and Sparks 2014; Wang, So, and Sparks, 2014). Research also posits that service provision in many industries is affected by the introduction of Self-Service Technology, none more so than in the airline industry, and these services significantly impact the majority of airline passengers (de Groot 2015), making TR a highly relevant concept. The study addresses significant literature gaps related to TESs, satisfaction with TESs (Meuter et al. 2003; Makarem,
  • 7. Mudambi, and Podoshen 2009), and the subsequent postser- vice behaviors (Buell, Campbell, and Frei 2010). To date, TES-related research has concentrated largely on customer acceptance and adoption of these services (e.g., Lassar, Manolis, and Lassar 2005; Walczuch, Lemmink, and Streukens 2007) and the ways in which technologies shape aspects of tourist behaviors and experiences (e.g., Kang and Gretzel 2012a; Lamsfus et al. 2015; Kang and Gretzel 2012b; Tussyadiah and Zach 2012; Wang, Park, and Fesenmaier 2012; Wang, Xiang, and Fesenmaier 2016; Xiang, Magnini, and Fesenmaier 2015; Xiang et al. 2015). While an enhanced understanding of these aspects of TESs is critical, further insights into whether and why travelers feel satisfied with TES offerings is equally, if not more, important. The primary justification for focusing on satisfaction lies in its positive association with key consumer outcomes such as customer retention and loyalty, both online and offline (e.g., Lu, Wang, and Hayes 2012). Nevertheless, adequate service quality online is often lacking, calling for a better understanding of consumers’ e-satisfaction and tech-satisfaction (Parasuraman, Zeithaml, and Malhotra 2005; Zeithaml, Parasuraman, and Malhotra 2002). This study also responds to the need to incorporate per- sonal characteristics beyond demographic factors in under- standing travelers’ technology-assisted experience (Kang and Gretzel 2012b). Personality research provides useful insights as personality is particularly influential in predicting behavior over time and across situations in relation to a wide range of human behaviors (Yoo and Gretzel 2011). Previous TR stud- ies reside largely within the research adopting Technology Adoption Model (TAM) and related models; they are often in the context of information and communication technologies (e.g., Chen, Chen, and Chen 2009; Lin and Hsieh 2007). Limited TR research in tourism investigates customers’ atti-
  • 8. tude toward rather than experience of TESs (e.g., Wang and Sparks 2014; Wang, So, and Sparks, 2014) and considers only some aspects of TR (e.g., Kang and Gretzel 2012b), with little focus on TR’s role in shaping tourist satisfaction. Investigators outside the tourism field proposes a direct impact of TR on satisfaction as a consumption outcome without considering the antecedents and outcomes of satisfaction (Chen 2011; Lin and Hsieh 2006, 2007). This study departs from previous research by empirically verifying TR’s moderating role in the framework of tourism satisfaction. Researchers question the assumption of uniform influ- ence of personality traits across countries (Truong 2013; Tellis, Yin, and Bell 2009) and highlight the danger of over- generalization of findings based on general technology acceptance and adoption models (Truong 2013). Contextual factors that shape technology related behavior vary from one country to another (Gretzel, Kang, and Lee 2008), highlight- ing the need for comparative studies of TR across countries and cultures (Parasuraman 2000). Limited TR research into the tourism domain (e.g., Lee, Castellanos, and Choi 2012; Wang, So, and Sparks, 2014; Wang and Sparks 2014) lacks the cross-country perspective and often examines data from a developed country (e.g., Australia). The generalizability of the findings remains unknown. This study collected data in Australia, China, and the United States, providing a cross- country sample, enabling exploration of the model’s applica- bility across tourists of varying cultural background, economic condition, and technological environment. Theoretically, cross-country studies inform the subject of technology adoption, diffusion, and evaluation across mar- kets. Practically, such studies are particularly meaningful for tourism businesses because of their global footprints and international consumer bases, assisting service providers and marketers who are facing the challenge of adapting to the specific needs of segments within the markets (Gretzel,
  • 9. Kang, and Lee 2008). Literature Review Service Quality, Tourist Satisfaction, and Posttrip Behaviors Service quality and satisfaction are separate constructs. Evaluation of service quality is largely cognitive, emphasiz- ing effectiveness and efficiency. Studies on the quality of e-services and self-service technologies assess attributes such as speed of delivery, ease of use, reliability, security, and control (Dabholkar 1996; Elliott, Meng, and Hall 2012; Zeithaml, Parasuraman, and Malhotra 2002). In contrast, sat- isfaction is the overall cognitive or affective response to product use (Oliver 1997). Superordinate to quality, it is a more emotional response to service encounters (Bowen and Clarke 2002). Researchers generally agree that cognitive Wang et al. 565 evaluations of service quality precede emotional responses and that service quality is a strong predictor of satisfaction in TESs. Studies of hotel websites (Polites et al. 2012), online travel agencies (Tsang, Lai, and Law 2010), and e-service use (Chea and Luo 2008) validate this service quality–satis- faction link. Satisfaction leads to favorable consumer outcomes of posi- tive word of mouth and repurchase intention (Szymanski and Henard 2001) as satisfied consumers tell their relatives and friends, providing free advertisement and promotion. User sat- isfaction predicts e-loyalty (Anderson and Srinivasan 2003), continued IT use intention (Son and Han 2011; Thong, Hong,
  • 10. and Tam 2006), website revisit, WOM, repeat purchase (Gounaris, Dimitriadis, and Stathakopoulos 2010), and recom- mendation with regard to various e-services (Chea and Luo 2008). A study of hotel websites finds that e-satisfaction not only significantly affects e-loyalty but also mediates the influ- ence of positive website experience on e-loyalty (Polites et al. 2012). Evidence shows that satisfaction is formed on the basis of evaluation of service quality against expectation, which leads to future intentions, and this sequence of events applies to various service sectors such as hotels (Beatson, Coote, and Rudd 2006), banking (Ganguli and Roy 2011), and e-shopping (Gounaris, Dimitriadis, and Stathakopoulos 2010). Tech-satisfaction presents a key challenge for researchers. Satisfaction with a website may stem from the characteristics of the website and its associated vendors, products, or ser- vices. A customer may be loyal to the website itself or to a vendor operating on the website (Polites et al. 2012). Regarding travel experiences, TESs are often peripheral rather than core features, although travelers’ experience with TESs before, during, and after the trip would contribute to their overall satisfaction. However, since their loyalty is more likely to form toward the service provider (e.g., hotel/ airline) than its technological service features, it is necessary to differentiate satisfaction with technologies from satisfac- tion with the overall experience. This study proposed the below model of tourism satisfac- tion (Figure 1). The model posits: Hypothesis 1: TES quality is positively related to satisfac- tion with TESs. Hypothesis 2: Satisfaction with TESs is positively related to overall satisfaction. Hypothesis 3: Overall satisfaction is positively related to future behavioral intentions.
  • 11. Moderating Effect of Travelers’ TR The strength of relationships between constructs in Figure 1 varies under different conditions and research needs to explore factors that may moderate these relationships (Anderson and Srinivasan 2003). Travelers have different levels of tolerance in service evaluation, and travelers’ char- acteristics affect their evaluation of services and technolo- gies (Mattila and Mount 2003), suggesting a moderating effect of travelers’ characteristics. Regarding TESs, travel- ers’ perceptions of the benefits such services can offer, trav- elers’ own capabilities, and their orientation to technologies are significant drivers of behaviors toward technology- assisted channels (Buell, Campbell, and Frei 2010; Wang and Sparks 2014; Meuter et al. 2003). In particular, consum- ers’ individual-level factors such as personality traits moder- ate the relationship between e-satisfaction and e-loyalty (Anderson and Srinivasan 2003). TR is a personality trait, measuring one’s orientation to technologies. The limited research investigating how TR affects satisfaction conceptualizes TR as a direct influencer of satisfaction (Lin and Hsieh 2006, 2007; Mattila and Mount 2003), and occurred in a context where technology plays the main role in the product offering, such as mobile services (Chen, Liu, and Lin 2013) and an electronic book reader (Ferreira, da Rocha, and da Silva 2014). Our study differs significantly from previous research because TESs are more peripheral than core product features in a travel experience. TR is thus unlikely to directly influence a traveler’s overall satisfaction with the trip. Further, our focus is on satisfac- tion’s relationships with its key antecedent and outcome rather than on satisfaction itself. Therefore, TR is conceptu- alized as a moderator of the relationships between the con- structs in Figure 1.
  • 12. TR asserts influence through its impact on the perceived importance of TESs (Wang, So, and Sparks, 2014). A con- sumer’s overall TR establishes a frame within which he or she values travel TESs (Wang and Sparks 2014). High-TR customers perceive technologies to be more useful (Walczuch, Lemmink, and Streukens 2007) and regard the technology-related aspect of travel experience as more important and weigh these aspects more heavily in evaluat- ing the experience (Liljander et al. 2006; Wang and Sparks 2014). The perceived importance of a service exerts a mod- erating effect on the relationships between satisfaction, its antecedents, and outcomes, and high-importance purchases Figure 1. Framework of tourism satisfaction. 566 Journal of Travel Research 56(5) have a stronger relationship between perceived service per- formance and satisfaction than do low-importance purchases (Tam 2011). Since low-TR customers do not highly value technology-related aspects, a positive or negative experience with technologies does not carry as much weight in their overall service evaluation. Compared to low-TR customers, high-TR customers are more comfortable with new technol- ogies and have more prior experience with technologies, and consequently are less likely to encounter problems. They are also less likely to find technical difficulties intimidating and are more prone to continue to use technologies despite prob- lems (Zeithaml, Parasuraman, and Malhotra 2002). Therefore, a traveler’s TR may influence how complex he or she perceives a TES to be. Further, the psychological process and underlying dimensions of satisfaction may vary depend- ing on the complexity of the consumption experience (Oliver
  • 13. 1997), and the level of service task complexity changes the magnitude of the effect of service process modularization on customer likelihood to try a new service (Tuunanen and Cassab 2011). TR also influences travelers’ beliefs, perceptions and expectations about technologies, based upon which travelers evaluate their technology-related experiences (Chung, Han, and Joun 2015). A meta-review of customer satisfaction lit- erature concludes that comparison standard may be a poten- tial moderator of customer satisfaction (Szymanski and Henard 2001). High-TR customers, because of their greater knowledge of technologies, are more demanding and have higher evaluative standards (Zeithaml, Parasuraman, and Malhotra 2002). TR therefore moderates the relationships between constructs in Figure 1, with the link likely to be stronger for high-TR travelers than low-TR travelers. TR is a multidimensional construct that captures both the positive (i.e., optimism and innovativeness) and negative (i.e., discomfort and insecurity) mental readiness for techno- logical innovations (Parasuraman 2000). Optimism refers to a positive view of technology and the belief that technology can offer customers increased control, flexibility, and effi- ciency in life and work (Parasuraman 2000). This perception of control plays a significant role in forming satisfaction with self-service technology (Johnson, Bardhi, and Dunn 2008). Optimistic people value TESs more (Wang, So, and Sparks, 2014), have higher trust in new technologies, and perceive the functionality of new technologies more positively (Lu, Wang, and Hayes 2012; Walczuch, Lemmink, and Streukens 2007). Optimism is positively associated with customers’ perceived ease of use and usefulness of technology-enabled financial services (Walczuch, Lemmink, and Streukens 2007), which increases customer satisfaction (e.g., Thong, Hong, and Tam 2006).
  • 14. Innovativeness represents a customer’s tendency to be a pioneer and thought leader in adapting to new technologies (Parasuraman 2000). Innovative customers are curious about new technologies and perceive themselves as highly compe- tent in using new technologies and in handling uncertainties technologies present. They perceive the functionality of a new technology more positively (Lu, Wang, and Hayes 2012). The more an individual embraces innovative technol- ogies, the more likely he/she would consider TESs to be use- ful (Walczuch, Lemmink, and Streukens 2007). Research also suggests that innovativeness positively relates to museum visitors’ perceived impact of technology on con- sumption experience and the subsequent revisiting behavior through enhancing one’s affinity with technology (Kang and Gretzel 2012b). Airlines implement technological innovations to achieve reduced costs, greater capacity, faster speed, better manage- ment of security, and product flexibility (International Air Transport Association 2011; Kim, Park, and Morrison 2008). These goals are consistent with high-TR travelers’ goals to be seen as a pioneer in technologies. A stronger relationship is hence expected between service quality, satisfaction, and future behavior among optimistic and innovative travelers, leading to the following hypotheses: Hypothesis 4: Optimism moderates the proposed set of relationships in Figure 1. Hypothesis 5: Innovativeness moderates the proposed set of relationships in Figure 1. Discomfort is “a perceived lack of control over technol- ogy and a feeling of being overwhelmed by it,” while inse- curity is defined as “distrust of technology and skepticism
  • 15. about its ability to work properly” (Parasuraman 2000, 311). Psychological discomfort is a key process that medi- ates the interactive effect of employee rapport behavior and technology use on service evaluation (Giebelhausen et al. 2014). Travelers who score high on discomfort and insecurity perceive operating TESs to be complex, and tend to be overwhelmed by technologies and feel a strong lack of control over their ability to handle uncertainties, resulting in an overestimation of technology’s complexity. Those who feel insecure about technologies also experi- ence higher levels of anxiety when using new technologies and are skeptical about technology’s usefulness (Lu, Wang, and Hayes 2012). Discomfort and insecurity can lead to distrust of new technologies as well as low perceived functionality and usefulness (Lu, Wang, and Hayes 2012), affecting the rela- tionships in Figure 1. While trust in technology increases satisfaction with TESs (Johnson, Bardhi, and Dunn 2008), some researchers assert that trust is a mediator or modera- tor rather than a direct predictor of satisfaction (e.g., Morgan and Hunt 1994; Polites et al. 2012; Lee and Wu 2011). Similarly, perceived usefulness and trust positively moderate the relationships between e-service quality, per- ceived value, and service satisfaction regarding airline websites (Lee and Wu 2011). Trust also affects the relation- ship between quality of online banking attributes (e.g., con- trol, efficiency) and customer satisfaction (Johnson, Bardhi, Wang et al. 567 and Dunn 2008). In addition, customers who feel anxious about technologies are less likely to have a positive experi- ence with technologies even when technologies work well
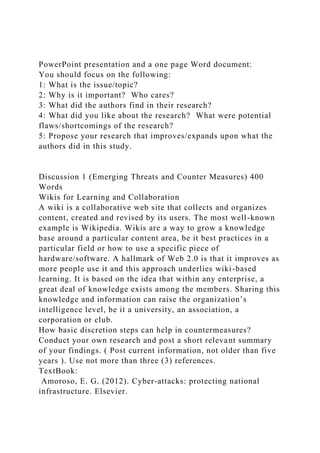
  • 16. (Meuter et al. 2003). The following hypotheses were there- fore proposed: Hypothesis 6: Discomfort moderates the proposed set of relationships in Figure 1. Hypothesis 7: Insecurity moderates the proposed set of relationships in Figure 1. Moderating Effect of Country of Residence Travelers’ cultural background affects their service expecta- tions (Donthu and Yoo 1998) and technology acceptance (Meng, Elliott, and Hall 2009). Differences in uncertainty avoidance, masculinity/femininity, and power distance mod- erate the relationships in the widely accepted technology acceptance model (Srite and Karahanna 2006). Cultural dif- ferences also affect the effectiveness of technology transfer indirectly through an interaction with the nature of the tech- nology being transferred (Lin and Berg 2001). A study com- paring Korean and American customers’ use of technology finds that culture moderates the relationships between expec- tancy, behavioral intention, and use behavior with these rela- tionships being weaker in the Korean sample, which represents a culture with higher power distance, collectiv- ism, and uncertainty avoidance and lower masculinity (Im, Hong, and Kang 2011). Similarly, collectivism and group orientation reduce the strength of relationships between per- ceived quality, satisfaction, and intention, because consumers with these cultural characteristics evaluate their service expe- rience on the basis of group norms rather than individuals’ own standards (Spreng and Chiou 2002). The following hypothesis was proposed. Hypothesis 8: Country of residence moderates the pro- posed set of relationships in Figure 1.
  • 17. This study operationalized the testing of country of resi- dence’s moderating effect through a cross-national study involving Australian, Chinese, and American consumers. Australia is where research design was developed, serving as the initial testing ground for the research instrument. China and United States were chosen as they differ in terms of political governance, economic and technological develop- ment, as well as cultural values such as risk avoidance, group orientation, and trust (e.g., Hofstede and Hofstede 2001; Spreng and Chiou 2002). American consumers behave dif- ferently from their Chinese counterparts in relation to their use of technologies (Chu and Choi 2011). Chinese are less optimistic about technologies’ ability to offer greater func- tionality and control over their life compared to the Americans (Meng, Elliott, and Hall 2009). Therefore, Chinese may be less likely to embrace new TESs. Practically, China and the United States are the world’s top two tourism spenders in 2014 (UNWTO 2015), representing the largest consumer markets in the East and West, as well as tourism’s largest traditional and emerging markets. Figure 2 summarizes the complete conceptual framework and proposed hypotheses. Methods This study utilized the airline sector as a case study and adopted a quantitative approach that included an online sur- vey administered in Australia, China, and the United States. Figure 2. The conceptual framework. 568 Journal of Travel Research 56(5) Survey Instrument and Measures
  • 18. The instrument was developed based on academic literature and industry consultation to collect information on respon- dents’ perceived quality of and satisfaction with airline TESs, satisfaction with the overall flight experience, future behav- ioral intentions, and TR as well as social demographics and trip-related characteristics. TES quality scale. The service quality scale measures per- ceived quality of service concerning TES offerings. A list of TESs, derived from academic literature, industry reports, travel websites, and blogs, was sent to top managers in the airline industry in Oceania. Using feedback of top managers of four major airlines, we revised the list, retaining 35 TES items. Participants were instructed to evaluate TESs on the basis of their most recent flight experience in responding to the scale. As a traveler is unlikely to have used all 35 TESs, par- ticipants responded to this section in two steps: (1) partici- pants indicated which of the TESs they had used, and (2) for those TESs they had used, they rated the quality of each rela- tive to their expectation on a 7-point scale (1 = much worse than expected to 7 = much better than expected). Satisfaction scale. The survey used two scales, one measuring satisfaction with TESs and the other measuring satisfaction with the overall flight experience. Participants were instructed that the flight experience includes the actual flight and all associated experiences such as booking, check-in, and the baggage collection. Following previous studies (e.g., Anderson, Fornell, and Mazvancheryl 2004; Lin and Hsieh 2007), the three-item American Customer Satisfaction Index (ACSI) was used to measure travelers’ satisfaction with air- line TESs, with the wording modified to reflect the study context. The three items ask whether the TESs were gener-
  • 19. ally satisfying, exceeded expectation, and were close to one’s ideal. Participants indicated their responses on a 7-point Likert-type scale (1 = strongly disagree to 7 = strongly agree). Participants’ satisfaction with the overall flight expe- rience was also measured using the ACSI on a 7-point Lik- ert-type scale, with modification in wording to reflect the overall flight experience. Future behavioral intentions. The three-item instrument mea- sures participants’ postflight behaviors, including future pur- chase, word-of-mouth advertising, and willingness to pay a premium price. These items reflect established important aspects of customer loyalty and future behavior toward a ser- vice provider (e.g., Ganguli and Roy 2011; Gounaris, Dimi- triadis, and Stathakopoulos 2010). TR scale. This study used the full 36-item TR Index, with per- mission for academic use from the copyright owners Para- suraman and Rockbridge Associates, Inc. (see Parasuraman 2000 for full scale). Participants indicated the extent to which they agreed or disagreed with each of the 36 items on a 7-point Likert-type scale (1 = strongly disagree and 7 = strongly agree). Pretest and Pilot Test The questionnaire was hosted on a reputable website for research surveys. It was pretested with a convenience sam- ple of 73 university faculty members and research students, and then pilot-tested with 161 participants with the assis- tance of a marketing list company. These tests identified potential issues in survey flow, readability, and logistics, and served as validity checks of construct measures, based on which the questionnaire was finalized. The question- naire was translated into simplified Chinese by an accred-
  • 20. ited translator, then checked by three tourism scholars whose native language is Mandarin. A pretest with a conve- nience sample of 30 faculty members and research students in a Chinese university was also conducted. Based on the pretest, the research team was satisfied with the compara- tive nature of the survey. Survey Procedures and Participants Access to potential respondents in Australia was obtained through a reputable marketing research firm, and a sample was drawn from the company’s privacy-compliant online consumer panel, a source of a preexisting sampling frame consisting of more than 500,000 active members, providing a reasonable representation of the Australian population. A purposive sampling approach was taken where to be eligi- ble to participate in this study, individuals must be older than 18 years and have had taken a flight in the past 12 months. A quota sampling approach was implemented to obtain a balance across genders, age groups, and the differ- ent Australian states and territories. Items measuring TR, service quality, satisfaction, and future behavior were ran- domized to remove any systematic order effects. Access to potential participants in the United States was obtained in a similar manner through a U.S.-based consumer panel provider. Owing to a lack of comparable consumer panel services in China, a different approach was used combing conve- nience and snowballing sampling strategies. A Chinese researcher assisted data collection. Postgraduate students were recruited to distribute the questionnaire online and sent e-mail invitations to potential participants through popular social media sites such as Tencent Weibo, Sina Weibo, and QQ (an instant messaging software service offering a variety of services including micro blogging) and online communi-
  • 21. ties of major Chinese airlines (e.g., Air China and China Southern Airlines) to elicit voluntary participation. Potential participants were encouraged to forward the survey link to friends who qualified for the study. Participants were offered Wang et al. 569 the chance to enter a drawing to win one of 50 telecommuni- cation cards, each worth approximately AU$20. Results A total of 1,407 usable surveys were completed, with 558 from the United States, 509 from China, and 340 from Australia. Female respondents accounted for 50.8% of the overall sample. Approximately 33.2% of the respondents were under 30 years old, 40.1% were between 30 and 50, and 26.6% were older than 50. About 22.9% of the respondents held a postgraduate degree, 41.6% had university degrees, 13.9% held a certificate or diploma, 6% had trade qualifica- tions, 11.6% were high-school qualified, 1.9% had com- pleted elementary school, and 2.1% had other forms of education. To evaluate nonresponse bias for each sample, early and late respondents were compared on the demo- graphic variables and the scale measures (Armstrong and Overton 1977). The results showed no significant differences between early (first 10%) and late (last 10%) respondents in terms of respondent characteristics and the measured items. Preliminary Analysis EFA was performed to assess measurement items within each scale to check uni-dimensionality, factor structure, and strength of factor loadings (i.e., loadings should exceed
  • 22. .50) (Gerbing and Anderson 1988). We used reliability analysis to examine the internal consistency of the scales via Cronbach’s alpha, with values above .70 deemed to be appropriate (Nunnally 1978). Under these criteria, several items were deleted, including one innovativeness item, one optimism item, three insecurity items, and one discomfort item. The retained scale items for each of the TR dimen- sions were used to compute composite variables for the subsequent test for moderation. Table 1 presents the mean scores for constructs. Partial Least Squares Path Modeling The partial least squares (PLS) approach to structural equa- tion models, also known as PLS path modeling (PLS-PM) or PLS structural equation modeling (PLS-SEM), is a compo- nent-based estimation procedure that differs from the covari- ance-based LISREL-type approach, which has a primary goal of theory testing and confirmation (Hair et al. 2013). In contrast, PLS-PM explains the residual variance of the latent variables, and therefore its goal is predicting key target con- structs (Fornell and Bookstein 1982; Hair et al. 2013). Unlike the covariance-based approach used in AMOS and LISREL, PLS-PM analysis does not rely on the assumption of data normality and does not require as large a sample as other causal modeling techniques (Arnett, Laverie, and Meiers 2003; do Valle and Assaker, 2016). As this study aims to evaluate a set of predictive relation- ships and how the dimensions of TR and country affect these relationships, PLS-PM was the most appropriate analytical technique to examine the data. The software package employed was XLSTAT. Measurement Model
  • 23. The analysis first assessed the measurement model through the validity and reliability of the construct measures. Convergent validity was evaluated through the strength and significance of the loadings, the average variance extracted (AVE), and the reliability estimates (Bagozzi and Heatherton 1994). As Table 2 shows, all loadings were sat- isfactory (>.70) (Gerbing and Anderson 1988) with one exception, which was slightly below the acceptable level of .70. However, the bootstrap critical ratios indicate that all indicators are statistically significant (p < .001). Furthermore, all AVEs were greater than .50, exceeding the suggested threshold (Fornell and Larcker 1981). Taken together, the results provide strong evidence for the con- vergent validity. Discriminant validity across the measured constructs was assessed by two methods (Hair et al. 2013). First, the item cross-loadings of the indicators were examined (Hair, Ringle, and Sarstedt 2011). Results showed that no items cross- loaded higher on another construct than they did on their own construct, supporting discriminant validity (Hair et al. 2013). Second, the square root of the AVE of the constructs was greater than the intercorrelations between constructs in each case, thus providing evidence of discriminant validity (Fornell and Larcker 1981; Chin 1998). Construct reliability was assessed via internal consistency and indicator reliability (Hair et al. 2013). Internal consis- tency was evaluated with Dillon-Goldstein’s rho, which does not assume parallelity of the manifest variables as Cronbach’s alpha does. All factors achieved satisfactory reliability (>.70) (Hair et al. 2006; Nunnally and Bernstein 1994), with Dillon- Goldstein’s rho values ranging from .88 to .93 (see Table 2). Table 1. Mean Scores for Measured Constructs.
  • 24. Construct Mean Score for Each Country Group United States China Australia Optimism 5.25 5.54 4.97 Innovativeness 4.80 5.07 4.55 Insecurity 3.94 4.53 4.10 Discomfort 4.33 4.77 4.53 TESQUAL 4.72 4.44 4.51 STES 4.64 4.12 4.27 OSAT 4.97 4.46 4.65 FBI 5.04 4.52 4.70 Note: TESQUAL = technology-enabled services quality; STES = satisfaction with technology-enabled services; OSAT = overall satisfaction; FBI = future behavioral intentions. 570 Journal of Travel Research 56(5) The results demonstrate that, overall, the scales were valid and reliable measures of their respective constructs. Structural Model The structural model was evaluated through a systematic examination of indices including R2, average variance accounted for (AVA), path coefficients between the exogenous and endogenous, and bootstrap critical ratios. As the primary objective of PLS-PM is prediction, the goodness of a theoreti- cal model is established by the strength of each structural path
  • 25. and the combined predictiveness (Duarte and Raposo 2010). Given that the individual R2s are greater than the recommended level of .10 (Falk and Miller 1992), the paths’ significance associated with these variables was examined. The analysis controlled for respondents’ age group, gender, and educational level, and all these variables were included as categorical con- trol variables (Hair et al. 2013). The structural model results based on the overall sample data (n = 1,407) suggest that all path coefficients were significant as the bootstrap critical ratios were greater than ±1.96. Thus, hypotheses 1, 2, and 3 were sup- ported. Furthermore, a model has predictive power if the AVA is above .10. R2s for satisfaction with TESs, overall satisfac- tion, and future behavior were .158, .654, and .710, respec- tively, resulting in an AVA of .507 for this model (exceeding the cut-off of .10), thus indicating the predictive power of the indi- vidual paths and structural model. To show the predictive power of each endogenous variable included in the model, we also provide the variance due to path. Table 3 shows the results. Test for Moderating Effects of TR Dimensions To examine the moderating effects of TR dimensions, a widely adopted median split method was used, dividing the overall sample into subgroups (e.g., high innovativeness vs. low innovativeness, high optimism vs. low optimism) (Henseler and Fassott 2010). Differences in the model parameters between the different data groups are interpreted as moderating effects. While such an analysis has often been conducted by examining path differences using a t-test based on the pooled standard errors obtained via a re-sampling pro- cedure such as bootstrapping (Vinzi, Trinchera, and Amato 2010), problems can occur if a normal population or similar sample size is assumed (Chin and Dibbern 2010). The per- mutation-based procedure provides an alternative distribu-
  • 26. tion-free approach based on an approximate randomization test, where a subset of all possible data permutations between sample groups is made (Vinzi, Trinchera, and Amato 2010). Having examined measurement invariance, using this approach, multi-group analyses were conducted to examine the differences in path coefficients (hypotheses 4–8). Table 4 shows that the links between satisfaction with TESs and overall satisfaction (difference = .16, p < .01) and between overall satisfaction and future behavioral intentions (difference = .07, p < .01) are significantly stronger for the high-optimism group than for the low-optimism group. However, the differ- ence for the relationship between perceived TESs quality and satisfaction with TESs is not significant. Therefore, the results provide partial support for hypothesis 4. Similarly, as Table 5 indicates, in the structural model for the high innovativeness group, the path coefficients from satisfaction with TESs to overall satisfaction (difference = .14, p < .01) and overall satis- faction to future behavioral intentions (difference = .07, p < .01) are significantly stronger than the corresponding path in the structural model for the low innovativeness group. The directional relationship between perceived quality of TESs and satisfaction with TESs is not significantly different between the two groups. Thus, the results partially support hypothesis 5. Furthermore, as no significant differences were found in the three path coefficients between the high-insecurity and low- insecurity groups and between the high-discomfort and low- discomfort groups, hypotheses 6 and 7 were not supported. Test for Moderating Effect of Country of Residence To test hypothesis 8, a multigroup analysis was conducted to examine path differences across the three sampled country Table 2. Results Summary for Reflective Measurement Models.
  • 27. Latent Variable Indicators Loadings Indicators Reliability D.G. rho AVE Discriminant Validity? STES STES1 .90 .81 .93 .80 Yes STES2 .90 .81 STES3 .89 .79 OSAT OSAT1 .87 .76 .92 .79 Yes OSAT2 .90 .81 OSAT3 .90 .81 FBI FBI1 .93 .86 .88 .70 Yes FBI2 .93 .86 FBI3 .62 .38 Note: D.G. rho = Dillon-Goldstein’s rho; AVE = average variance extracted; STES = satisfaction with technology- enabled services; OSAT = overall satisfaction; FBI = future behavioral intentions. Wang et al. 571 groups. As Table 6 indicates, the path from satisfaction with TESs to overall satisfaction (hypothesis 2) is significantly
  • 28. stronger in the Chinese group than in the U.S. group (differ- ence = .05, p < .05). While it was noted that the absolute path difference between China and Australia is greater than that between China and the U.S. (difference = .06), the latter was found insignificant in the moderating analysis based on the per- mutation method owing to the larger standard error of the path in the Australian sample. In contrast, the path from overall sat- isfaction to future behavioral intentions (hypothesis 3) is sig- nificantly stronger in the U.S. group than in the Chinese group (difference = .08, p < .01). The results partially support hypoth- esis 8. Discussion and Conclusions This study advances understanding of travelers’ experience with technologies by proposing a conceptual model that incorporates travelers’ TR into the existing framework of tourist satisfaction. Key findings include confirmation that travelers’ perceived quality of airline TESs is positively associated with their satisfaction with TESs, which affects Table 3. Significance Testing Results of the Structural Model Path Coefficients. Path Path Coefficients Standard Errors Critical Ratios p Values 95% Confidence
  • 29. Intervals Variance Due to Path TESQUAL→ STES .384 .030 12.62 <.01 .31, .44 .146 STES → OSAT .801 .014 57.90 <.01 .77, .83 .641 OSAT → FBI .834 .011 79.09 <.01 .81, .86 .701 Controlled variables Age→ STES –.036 .026 –1.365 NS –.09, .02 Gender→ STES –.035 .022 –1.579 NS –.08, .00 Edu→ STES –.088 .025 –3.453 <.01 –.15, –.04 Age → OSAT .094 .018 5.461 <.01 .05, .13 Gender → OSAT .008 .017 .427 NS –.03, .04 Edu → OSAT .004 .017 .106 NS –.04, .04 Age → FBI .069 .017 4.101 <.01 .04, .11 Gender → FBI .004 .014 .253 NS –.03, .03 Edu → FBI .024 .013 1.842 NS –.00, 05 Note: TESQUAL = technology-enabled services quality; STES = satisfaction with technology-enabled services; OSAT = overall satisfaction; FBI = future behavioral intentions; Edu = highest education achieved; NS = not significant. Table 4. Results of Moderating Effect of Optimism. Path Group 1: Low OPT Group 2: High OPT Group 1 vs. Group 2 Path Coefficient Critical Ratio Path Coefficient Critical Ratio Path Difference p Value TESQUAL→ STES .31 7.70*** .40 10.59*** .08 .18 STES → OSAT .69 22.49*** .85 69.94*** .16 <.01
  • 30. OSAT → FBI .78 31.37*** .85 74.02*** .07 <.01 Note: OPT = optimism; TESQUAL = technology-enabled services quality; STES = satisfaction with technology-enabled services; OSAT = overall satisfaction; FBI = future behavioral intentions; path differences were generated from permutation. ***p < .01. Table 5. Results of Moderating Effect of Innovativeness. Path Group 1: Low INN Group 2: High INN Group 1 vs. Group 2 Path Coefficient Critical Ratio Path Coefficient Critical Ratio Path Difference p Value TESQUAL→ STES .34 7.58*** .40 9.73*** .06 .32 STES → OSAT .71 25.81*** .85 57.04*** .14 <.01 OSAT → FBI .79 38.60*** .86 73.15*** .07 <.01 Note: INN = innovativeness; TESQUAL = technology-enabled services quality; STES = satisfaction with technology-enabled services; OSAT = overall satisfaction; FBI = future behavioral intentions; path differences were generated from permutation. ***p < .01. 572 Journal of Travel Research 56(5) their overall satisfaction and postconsumption behavioral intention toward the airline (hypotheses 1, 2, and 3). Partially confirming hypotheses 4 and 5, the results suggest that opti-
  • 31. mism and innovation positively moderate the relationship between satisfaction with TES and overall satisfaction, as well as that between overall satisfaction and future behavior, but not the quality–satisfaction relationship. More optimistic and innovative travelers weigh TES offerings as more impor- tant in service consumption than those less optimistic and innovative about technologies (Wang, So, and Sparks, 2014), as reflected in air travelers’ evaluation of their overall experi- ence as well as future behaviors as measured by future pur- chase intention and WOM behaviors in this study. The two dimensions’ lack of influence on the effect of TES quality on satisfaction may suggest that personal orientation to technol- ogy does not influence how a traveler evaluates technology- enabled service quality. A poor experience resulting from technical failure or nonresponse to e-mail inquiry is likely to result in low satisfaction regardless of travelers’ attitude. This result may also be related to the utilitarian goals of con- venience, flexibility, and efficiency that many TESs meet for both travelers and airlines. As the evaluation of a service tends to be more objective and based on functional attributes of the service, it may be less subject to the influences of atti- tude and emotion. This study provides no support for a moderating effect of discomfort and insecurity (hypotheses 6 and 7). Being hospi- tality service providers, airlines designed TESs in ways that minimize anxiety and optimize usability (Wang and Sparks 2014). Onsite customer service support is often available at the airport or onboard, which eases customer anxiety. As such, discomfort and insecurity may be less relevant to hos- pitality TESs than they are to pure technological innovations. Further, customers’ increasing familiarity with e-commerce environment may have resulted in a belief that major security issues have been addressed, diminishing the effect of the inhibitors of TR (Chen, Chen, and Chen 2009).
  • 32. Our results also suggest a varying strength of relationship between key constructs in Figure 1 among travelers from the three countries, partially confirming Hypothesis 8. The rela- tionship between overall satisfaction and future behavior is stronger in the U.S. sample than in the Chinese sample, pos- sibly because of Chinese travelers’ conservative nature and cautiousness about new technologies. They are less optimis- tic about technologies ability to offer greater functionality compared to the Americans (Meng, Elliott, and Hall 2009). A cross-cultural study of the U.S. and China revealed signifi- cant differences in eWOM behaviors in terms of opinion- giving and seeking and information pass-along behavior (Chu and Choi 2011). The authors attributed these differ- ences to the varying cultural orientations (i.e., individualism vs. collectivism) and social relationships (i.e., social capital, tie strength, trust, and interpersonal influence) in the two countries (Chu and Choi 2011). Our finding is also consistent with Im, Hong, and Kang’s (2011) suggestion that the strength of relationship between performance expectancy and intention is weaker in Eastern cultures. However, the relationship strength between satisfaction with TES and overall satisfaction is stronger in the Chinese sample. Availability of self-service technologies is generally lower in China than in the United States (Westjohn et al. 2009), and research presents evidence that customers of Chinese origin differ from Western travelers in their preferences and expec- tations of services (e.g., Donthu and Yoo 1998; Lu, Choi, and Tseng 2011; So, Liu, et al. 2016). Therefore, Chinese travel- ers may differ from Americans in the aspects of TESs they value, resulting in greater weighting of TESs in the evalua- tion of overall satisfaction and possibly explaining the stron- ger relationship between satisfaction with TES and overall satisfaction in the Chinese sample than in the American sam- ple. Additional research is needed to fully delineate the underlying causes of the varying strength of relationships
  • 33. between the constructs in Figure 1. Theoretical and Practical Contributions Among the first to place TR in a broader framework of satis- faction related to technological aspects of tourism services, this study makes several theoretical contributions. Although the relationships among satisfaction and its antecedents and outcomes have previously been established, these relation- ships are likely to be affected by contextual factors such as Table 6. PLS Multigroup Analysis for Three Country Groups. Paths Group 1: U.S. Group 2: China Group 3: Australia Group 1 vs. Group 2 Group 1 vs. Group 3 Group 2 vs. Group 3 Path Coefficients Critical Ratios Path Coefficients Critical
  • 34. Ratios Path Coefficients Critical Ratios Path Difference p Value Path Difference p Value Path Difference p Value TESQUAL→ STES .36 8.34*** .39 7.91*** .35 4.85*** .03 .64 .00 .92 .04 .70 STES → OSAT .79 39.12*** .84 48.59*** .77 21.03*** .05 <.05 .00 .97 .06 .16 OSAT → FBI .86 60.18*** .78 34.10*** .83 35.29*** .08 <.01 .04 .21 .04 .17
  • 35. Note: TESQUAL = technology-enabled services quality; STES = satisfaction with technology-enabled services; OSAT = overall satisfaction; FBI = future behavioral intentions; path differences were generated from permutation. **p < .05; ***p < .01. Wang et al. 573 types of services, consumer characteristics, and business environment. Using airlines as a case study, this study evalu- ates the service quality–tourism satisfaction relationship on technology-assisted service platforms. The study differs from much of the existing research on TES, which concen- trates on customers’ attitudes toward technology and their subsequent adoption behavior (e.g., Elliott, Meng, and Hall 2012; Ferreira, da Rocha, and da Silva 2014). While under- standing adoption behavior is critical, the long-term sustain- ability of business requires continuous use of technology beyond initial adoption (Son and Han 2011). This study con- tributes to the scarce literature on postadoption behavior related to TESs. The study clarifies TR’s role in shaping tourism satisfac- tion, as little research has examined the impact of TR on con- sumer behavior (Lin and Hsieh 2007) and postadoption behavior (Son and Han 2011), adding to the limited body of literature on personality traits’ influence in technology- assisted experiences. This study conceptualizes and tests TR as a moderator of the satisfaction’s relationships with its antecedents and outcome within tourism consumption. By focusing on a series steps leading up to satisfaction and the consequent behavioral outcomes, this study delineates how satisfaction may be conditioned on TR in different phases of a consumption experience, providing greater insight into
  • 36. ways of enhancing travelers’ consumption experience. This constitutes a high level of theoretical contribution by adding a new “what” (i.e., a construct) to an existing theory in order to describe “how” the relationships unfolds and “when,” or “for whom” the relationships are likely to be manifested (Whetten 1989). Future research concerning travel technolo- gies should consider TR as a moderating variable. Further, this investigation adds to the limited research on cross-coun- try comparison of tourist experiences in general and with technology in particular. The study verified the satisfaction framework across the U.S., Australian, and Chinese samples and highlighted the need to consider traveler cultural back- ground in researching travel technologies. Practically, the findings suggest that across markets, TESs have become important features of tourism services that sig- nificantly affect traveler satisfaction with the overall tourism experience. Ensuring a positive experience for travelers is thus critically important. To identify strengths and weak- nesses related to TES offerings, businesses should develop measures of TES quality and incorporate TES-related satis- faction indicators into the system monitoring overall cus- tomer experience. Further, TR is important to consider in service offering, as it not only influences the adoption of travel technologies but also shapes travelers’ satisfaction and post-adoption behavior. Businesses should recognize travel- ers’ TR as an influential factor in TES-related service design and implementation. Although TR is not a directly observ- able customer characteristic, high-TR travelers can be distin- guished from low-TR travelers by their use of TESs. For instance, as highly innovative customers are often the first to adopt a newly offered service, airlines and hotels could maintain a database recording customers’ interactions with TESs so as to predict their reactions to new offerings and tailor marketing materials accordingly. Customer surveys
  • 37. incorporating TR measures might also be conducted with a sample drawn from the database to determine the TR of vari- ous market segments. In low-TR markets, businesses introducing a new TES can emphasize orienting travelers toward the TES through trial, briefing, on-site demonstration, and online video, to display its benefits. Customer testimony should be high- lighted to ease anxiety regarding new TESs. Businesses also need to recognize travelers’ country of residence as an impor- tant factor in TES-related service promotion. A challenge, however, is tourism businesses’ international footprint and market base. For instance, an international flight involves at least two countries, sometimes of very different levels of technological development and hence varying consumer ori- entations and experience with TESs. Therefore, differenti- ated strategies may be needed for different markets with respect to TES-related communication and education and in terms of stimulating WOM behavior. While delivering quality TESs is a general management priority for an airline, the stronger relationship between sat- isfaction with TESs and overall satisfaction in the Chinese sample highlights the particular importance of this among Chinese travelers. Airlines should collect information on the most valued and used TESs by the Chinese and further tailor services to market needs (e.g., providing instructions in Chinese language and in-person assistance). However, the weaker relationship between overall satisfaction and future behavioral intention among the Chinese requires airlines to make extra effort to entice Chinese travelers and to encour- age their favorable behavior. This may be achieved through proactive customer relationship management and offering tangible and value-added incentives, such as extra mileage points and preselection of service features that do not incur significant costs to airlines.
  • 38. Conclusions, Limitations, and Future Research This study clarifies TR’s role in the evaluation of and satis- faction with travel technologies, and suggests TR and coun- try of residence as factors tourism businesses must consider in formulating technology-related strategies. The study has several limitations. Respondents’ evaluation of TESs relied on their most recent trip experience. However, frequent trav- elers may base service evaluation and future behavioral intention on experiences accumulated over time. Future research can consider a comparative study between repeat and new customers. This study reveals differences among travelers from three countries in the way satisfaction influ- ences future behaviors—a result this study attributes to the varying cultural environments within which TES consump- tion takes place. However, other reasons may explain the 574 Journal of Travel Research 56(5) varying strength of relationships between constructs in the conceptual model, which warrants further investigation. In addition, while this study constrained its scope to the inves- tigation of TR’s moderating effects on only relationships in the linear model illustrated in Figure 1, other factors may also come into play, which would result in alternative mod- els. For instance, travelers’ adoption and experience regard- ing TESs may also be shaped by role clarity, motivations, perceived enjoyment, and familiarity (Kim, Christodoulidou, and Brewer 2012; Rosenbaum and Wong 2015; Kang and Gretzel 2012a), which requires further research in order to fully disclose the role of TR in the broader satisfaction for- mation process. Another research avenue is to understand how the proliferation of technologies influences the way
  • 39. people behave in general and while traveling, as well as how the behavior differs across generations. Finally, construct measures, for instance, STES and TR scales, can be further refined to better capture the essence of the constructs. Declaration of Conflicting Interests The author(s) declared no potential conflicts of interest with respect to the research, authorship, and/or publication of this article. Funding The author(s) disclosed receipt of the following financial support for the research, authorship, and/or publication of this article: This study is funded under the Griffith University New Researcher Grants Scheme. References Anderson, E. W., C. Fornell, and S. K. Mazvancheryl. 2004. “Customer Satisfaction and Shareholder Value.” Journal of Marketing 68 (4): 172–85. Anderson, R. E., and S. S. Srinivasan. 2003. “E-satisfaction and E-loyalty: A Contingency Framework.” Psychology & Marketing 20 (2): 123–38. Armstrong, J. S., and T. S. Overton. 1977. “Estimating Nonresponse Bias in Mail Surveys.” Journal of Marketing Research 14 (3): 396–402. Arnett, D. B., D. A. Laverie, and A. Meiers. 2003. “Developing
  • 40. Parsimonious Retailer Equity Indexes Using Partial Least Squares Analysis: A Method and Applications.” Journal of Retailing 79 (3): 161–70. Bagozzi, R. P., and T. F. Heatherton. 1994. “A General Approach to Representing Multifaceted Personality Constructs: Application to State Self-Esteem.” Structural Equation Modeling 1 (1): 35–67. Beatson, A., L. V. Coote, and J. M. Rudd. 2006. “Determining Consumer Satisfaction and Commitment through Self- Service Technology and Personal Service Usage.” Journal of Marketing Management 22 (7-8): 853–82. Bowen, D., and J. Clarke. 2002. “Reflections on Tourist Satisfaction Research: Past, Present and Future.” Journal of Vacation Marketing 8 (4): 297–308. Buell, R. W., D. Campbell, and F. X. Frei. 2010. “Are Self- Service Customers Satisfied or Stuck?” Production and Operations Management 19 (6): 679–97. Chea, S., and M. M. Luo. 2008. “Post-Adoption Behaviors of E-service Customers: The Interplay of Cognition and Emotion.” International Journal of Electronic Commerce 12 (3): 29–56. Chen, S.-C., H.-H. Chen, and M.-F. Chen. 2009. “Determinants of Satisfaction and Continuance Intention towards Self-Service Technologies.” Industrial Management & Data Systems 109 (9): 1248–63. Chen, S.-C., M.-L. Liu, and C.-P. Lin. 2013. “Integrating Technology
  • 41. Readiness into the Expectation-Confirmation Model: An Empirical Study of Mobile Services.” Cyberpsychology, Behavior, and Social Networking 16 (8): 604–12. Chen, S. C. 2011. “Understanding the Effects of Technology Readiness, Satisfaction, and Electronic Word of Mouth on Loyalty in 3C Products.” Australian Journal of Business and Management Research 1 (3). Chin, W. W. 1998. “The Partial Least Squares Approach to Structural Equation Modelling.” In Modern Methods for Business Research, edited by G. A. Marcoulides, 295–336. Mahwah, NJ: Lawrence Erlbaum. Chin, W. W., and J. Dibbern. 2010. “An Introduction to a Permutation Based Procedure for Multi-Group PLS Analysis: Results of Tests of Differences on Simulated Data and a Cross Cultural Analysis of the Sourcing of Information System Services between Germany and the USA.” In Handbook of Partial Least Squares, 171–93. Berlin: Springer. Chu, S.-C., and S. M. Choi. 2011. “Electronic Word-of-Mouth in Social Networking Sites: A Cross-Cultural Study of the United States and China.” Journal of Global Marketing 24 (3): 263–81. Chung, N., H. Han, and Y. Joun. 2015. “Tourists’ Intention to Visit a Destination: The Role of Augmented Reality (AR) Application for a Heritage Site.” Computers in Human Behavior 50:588–99. Dabholkar, P. A. 1996. “Consumer Evaluations of New Technology- Based Self-Service Options: An Investigation of Alternative Models of Service Quality.” International Journal of Research in Marketing 13 (1): 29–51.
  • 42. de Groot, R. 2015. “The Impact of Technology-Based Self- Service on Airline Passengers.” Aeronautica 3 (1): 1–78. do Valle, P. O., and G. Assaker. 2016. “Using Partial Least Squares Structural Equation Modeling in Tourism Research: A Review of Past Research and Recommendations for Future Applications.” Journal of Travel Research 55 (6): 695–708. Donthu, N., and B. Yoo. 1998. “Cultural Influences on Service Quality Expectations.” Journal of Service Research 1 (2): 178–86. Duarte, P. A. O., and M. L. B. Raposo. 2010. “A PLS Model to Study Brand Preference: An Application to the Mobile Phone Market.” In Handbook of Partial Least Squares, edited by V. E. Vinzi, W. W. Chin, J. Henseler, and H. Wang, 449–85. Berlin: Springer. Elliott, K., G. Meng, and M. Hall. 2012. “The Influence of Technology Readiness on the Evaluation of Self-Service Technology Attributes and Resulting Attitude toward Technology Usage.” Services Marketing Quarterly 33 (4): 311–29. Ert, E., and A. Fleischer. 2016. “Mere Position Effect in Booking Hotels Online.” Journal of Travel Research 55 (3): 311–321. Falk, R. F., and N. B. Miller. 1992. A Primer for Soft Modeling. Akron, OH: University of Akron Press. Ferreira, J. B., A. da Rocha, and J. F. da Silva. 2014. “Impacts of Technology Readiness on Emotions and Cognition in Brazil.”
  • 43. Journal of Business Research 67 (5): 865–73. Wang et al. 575 Fornell, C., and F. L. Bookstein. 1982. “Two Structural Equation Models: LISREL and PLS Applied to Consumer Exit-Voice Theory.” Journal of Marketing Research 19 (4): 440–52. Fornell, C., and D. F. Larcker. 1981. “Evaluating Structural Equation Models with Unobservable Variables and Measurement Error.” Journal of Marketing Research 18 (1): 39–50. Ganguli, S., and S. K. Roy. 2011. “Generic Technology-Based Service Quality Dimensions in Banking: Impact on Customer Satisfaction and Loyalty.” International Journal of Bank Marketing 29 (2): 168–89. Gerbing, D. W., and J. C. Anderson. 1988. “An Updated Paradigm for Scale Development Incorporating Unidimensionality and Its Assessment.” Journal of Marketing Research 25 (2): 186–92. Giebelhausen, M., S. G. Robinson, N. J. Sirianni, and M. K. Brady. 2014. “Touch versus Tech: When Technology Functions as a Barrier or a Benefit to Service Encounters.” Journal of Marketing 78 (4): 113–24. Gounaris, S., S. Dimitriadis, and V. Stathakopoulos. 2010. “An Examination of the Effects of Service Quality and Satisfaction on Customers’ Behavioral Intentions in E-shopping.” Journal
  • 44. of Services Marketing 24 (2): 142–56. Gretzel, U., M. Kang, and W. Lee. 2008. “Differences in Consumer- Generated Media Adoption and Use: A Cross-National Perspective.” Journal of Hospitality & Leisure Marketing 17 (1-2): 99–120. Hair, J. F., W. C. Black, B. J. Babin, R. E. Anderson, and R. L. Tatham. 2006. Multivariate Data Analysis. Upper Saddle River, NJ: Pearson Prentice Hall. Hair, J. F., G. T. M. Hult, C. Ringle, and M. Sarstedt. 2013. A Primer on Partial Least Squares Structural Equation Modeling (PLS-SEM). Thousand Oaks, CA: Sage. Hair, J. F., C. M. Ringle, and M. Sarstedt. 2011. “PLS-SEM: Indeed a Silver Bullet.” Journal of Marketing Theory and Practice 19 (2): 139–52. Henseler, J., and G. Fassott. 2010. “Testing Moderating Effects in PLS Path Models: An Illustration of Available Procedures.” In Handbook of Partial Least Squares, edited by V. E. Vinzi, W. W. Chin, J. Henseler, and H. Wang, 713–35. Berlin: Springer. Hofstede, G. H., and G. Hofstede. 2001. Culture’s Consequences: Comparing Values, Behaviors, Institutions and Organizations across Nations. Thousand Oaks, CA: Sage. Im, I., S. Hong, and M. S. Kang. 2011. “An International Comparison of Technology Adoption: Testing the Utaut Model.” Information & Management 48 (1): 1–8.
  • 45. International Air Transport Association. 2011. Vision 2050. Singapore: International Air Transport Association. Johnson, D. S., F. Bardhi, and D. T. Dunn. 2008. “Understanding How Technology Paradoxes Affect Customer Satisfaction with Self-Service Technology: The Role of Performance Ambiguity and Trust in Technology.” Psychology & Marketing 25 (5): 416–43. Kang, M., and U. Gretzel. 2012a. “Effects of Podcast Tours on Tourist Experiences in a National Park.” Tourism Management 33 (2): 440–55. Kang, M., and U. Gretzel. 2012b. “Perceptions of Museum Podcast Tours: Effects of Consumer Innovativeness, Internet Familiarity and Podcasting Affinity on Performance Expectancies.” Tourism Management Perspectives 4:155–63. Kim, D. Y., J. Park, and A. M. Morrison. 2008. “A Model of Traveller Acceptance of Mobile Technology.” International Journal of Tourism Research 10 (5): 393–407. Kim, J. S., N. Christodoulidou, and P. Brewer. 2012. “Impact of Individual Differences and Consumers’ Readiness on Likelihood of Using Self-Service Technologies at Hospitality Settings.” Journal of Hospitality & Tourism Research 36 (1): 85–114. Lamsfus, C., D. Wang, A. Alzua-Sorzabal, and Z. Xiang. 2015. “Going Mobile: Defining Context for on-the-Go Travelers.” Journal of Travel Research 54 (6): 691–701. Lassar, W. M., C. Manolis, and S. S. Lassar. 2005. “The Relationship between Consumer Innovativeness, Personal
  • 46. Characteristics, and Online Banking Adoption.” International Journal of Bank Marketing 23 (2): 176–99. Lee, F.-H., and W.-Y. Wu. 2011. “Moderating Effects of Technology Acceptance Perspectives on E-service Quality Formation: Evidence from Airline Websites in Taiwan.” Expert Systems with Applications 38 (6): 7766–73. Lee, W., C. Castellanos, and H. Choi. 2012. “The Effect of Technology Readiness on Customers’ Attitudes toward Self- Service Technology and Its Adoption; The Empirical Study of US Airline Self-Service Check-in Kiosks.” Journal of Travel & Tourism Marketing 29 (8): 731–43. Liljander, V., F. Gillberg, J. Gummerus, and A. van Riel. 2006. “Technology Readiness and the Evaluation and Adoption of Self-Service Technologies.” Journal of Retailing and Consumer Services 13 (3): 177–91. Lin, B.-W., and D. Berg. 2001. “Effects of Cultural Difference on Technology Transfer Projects: An Empirical Study of Taiwanese Manufacturing Companies.” International Journal of Project Management 19 (5): 287–93. Lin, J.-S. C., and P.-L. Hsieh. 2006. “The Role of Technology Readiness in Customers’ Perception and Adoption of Self- Service Technologies.” International Journal of Service Industry Management 17 (5): 497–517. Lin, J.-S. C., and P.-L. Hsieh. 2007. “The Influence of Technology Readiness on Satisfaction and Behavioral Intentions toward Self-Service Technologies.” Computers in Human Behavior 23 (3): 1597–1615.
  • 47. Lu, J.-L., J. K. Choi, and W.-C. Tseng. 2011. “Determinants of Passengers’ Choice of Airline Check-in Services: A Case Study of American, Australian, Korean, and Taiwanese Passengers.” Journal of Air Transport Management 17 (4): 249–22. Lu, J., L. Wang, and L. A. Hayes. 2012. “How Do Technology Readiness, Platform Functionality and Trust Influence C2C User Satisfaction?” Journal of Electronic Commerce Research 13 (1): 50–69. Makarem, S. C., S. M. Mudambi, and J. S. Podoshen. 2009. “Satisfaction in Technology-Enabled Service Encounters.” Journal of Services Marketing 23 (3): 134–44. Mattila, A. S., and D. J. Mount. 2003. “The Impact of Selected Customer Characteristics and Response Time on E-complaint Satisfaction and Return Intent.” International Journal of Hospitality Management 22 (2): 135–45. Meng, J., K. M. Elliott, and M. C. Hall. 2009. “Technology Readiness Index (TRI): Assessing Cross-Cultural Validity.” Journal of International Consumer Marketing 22 (1): 19–31. 576 Journal of Travel Research 56(5) Meuter, M. L., A. L. Ostrom, M. J. Bitner, and R. Roundtree. 2003. “The Influence of Technology Anxiety on Consumer Use and Experiences with Self-Service Technologies.” Journal of Business Research 56 (11): 899–906. Morgan, R. M., and S. D. Hunt. 1994. “The Commitment-Trust Theory of Relationship Marketing.” Journal of Marketing 58
  • 48. (3): 20–38. Nunnally, J. C. 1978. Psychometric Theory. New York: McCraw- Hill. Nunnally, J. C., and I. H. Bernstein. 1994. Psychometric Theory. New York: McCraw-Hill. Oliver, R. L. 1997. Satisfaction: A Behavioral Perspective on the Consumer. New York: McGraw-Hill. Parasuraman, A. 2000. “Technology Readiness Index (TRI): A Multiple-Item Scale to Measure Readiness to Embrace New Technologies.” Journal of Service Research 2 (4): 307–20. Parasuraman, A., V. A. Zeithaml, and A. Malhotra. 2005. “ES-QUAL: A Multiple-Item Scale for Assessing Electronic Service Quality.” Journal of Service Research 7 (3): 213–33. Polites, G. L., C. K. Williams, E. Karahanna, and L. Seligman. 2012. “A Theoretical Framework for Consumer E-satisfaction and Site Stickiness: An Evaluation in the Context of Online Hotel Reservations.” Journal of Organizational Computing and Electronic Commerce 22 (1): 1–37. Rosenbaum, M. S., and I. A. Wong. 2015. “If You Install It, Will They Use It? Understanding Why Hospitality Customers Take “Technological Pauses” from Self-Service Technology.” Journal of Business Research 68 (9): 1862–68. So, K. K. F., C. King, and B. Sparks. 2014. “Customer Engagement
  • 49. with Tourism Brands: Scale Development and Validation.” Journal of Hospitality & Tourism Research 38 (3): 304–29. So, K. K. F., C. King, B. A. Sparks, and Y. Wang. 2016. “The Role of Customer Engagement in Building Consumer Loyalty to Tourism Brands.” Journal of Travel Research 55 (1): 64–78. So, K. K. F., W. Liu, Y. Wang, and B. Sparks. 2016. “Service Expectations of Chinese Outbound Tourists.” In Chinese Outbound Tourism 2.0, edited by X. R. Li, 185–98. Oakville, Canada: CRC Press. Son, M., and K. Han. 2011. “Beyond the Technology Adoption: Technology Readiness Effects on Post-adoption Behavior.” Journal of Business Research 64 (11): 1178–82. Spreng, R. A., and J.-S. Chiou. 2002. “A Cross-Cultural Assessment of the Satisfaction Formation Process.” European Journal of Marketing 36 (7/8): 829–39. Srite, M., and E. Karahanna. 2006. “The Role of Espoused National Cultural Values in Technology Acceptance.” MIS Quarterly 30 (3): 679–704. Szymanski, D. M., and D. H. Henard. 2001. “Customer Satisfaction: A Meta-analysis of the Empirical Evidence.” Journal of the Academy of Marketing Science 29 (1): 16–35. Tam, J. L. M. 2011. “The Moderating Effects of Purchase Importance in Customer Satisfaction Process: An Empirical Investigation.” Journal of Consumer Behaviour 10 (4): 205–15.
  • 50. Tellis, G. J., E. Yin, and S. Bell. 2009. “Global Consumer Innovativeness: Cross-Country Differences and Demographic Commonalities.” Journal of International Marketing 17 (2): 1–22. Thong, J. Y., S.-J. Hong, and K. Y. Tam. 2006. “The Effects of Post-adoption Beliefs on the Expectation-Confirmation Model for Information Technology Continuance.” International Journal of Human-Computer Studies 64 (9): 799–810. Truong, Y. 2013. “A Cross-Country Study of Consumer Innovativeness and Technological Service Innovation.” Journal of Retailing and Consumer Services 20 (1): 130–37. Tsang, N. K. F., M. T. Lai, and R. Law. 2010. “Measuring E- service Quality for Online Travel Agencies.” Journal of Travel & Tourism Marketing 27 (3): 306–23. Tussyadiah, I. P., and D. Wang. 2016. “Tourists’ Attitudes toward Proactive Smartphone Systems.” Journal of Travel Research 55 (4): 493–508. Tussyadiah, I. P., and F. J. Zach. 2012. “The Role of Geo-Based Technology in Place Experiences.” Annals of Tourism Research 39 (2): 780–800. Tuunanen, T., and H. Cassab. 2011. “Service Process Modularization: Reuse versus Variation in Service Extensions.” Journal of Service Research 14 (3): 340–54. UNWTO. 2015. UNWTO Tourism Highlights, 2015 ed. Madrid, Spain: UNWTO.
  • 51. Vinzi, V. E., L. Trinchera, and S. Amato. 2010. “PLS Path Modeling: From Foundations to Recent Developments and Open Issues for Model Assessment and Improvement.” In Handbook of Partial Least Squares, edited by V. E. Vinzi, W. W. Chin, J. Henseler, and H. Wang, 47–82. Berlin: Springer. Walczuch, R., J. Lemmink, and S. Streukens. 2007. “The Effect of Service Employees’ Technology Readiness on Technology Acceptance.” Information & Management 44 (2): 206–15. Wang, D., S. Park, and D. R. Fesenmaier. 2012. “The Role of Smartphones in Mediating the Touristic Experience.” Journal of Travel Research 51 (4): 371–87. Wang, D., Z. Xiang, and D. R. Fesenmaier. 2016. “Smartphone Use in Everyday Life and Travel.” Journal of Travel Research 55 (1): 52–63. Wang, Y., K. K. F. So, and B. A. Sparks. 2014. “What Technology- Enabled Services Do Air Travelers Value? Investigating the Role of Technology Readiness.” Journal of Hospitality & Tourism Research 1–26. doi:10.1177/1096348014538050. Wang, Y., and B. Sparks. 2014. “Technology-Enabled Services: Importance and Role of Technology Readiness.” Tourism Analysis 19 (1): 19–33. Westjohn, S. A., M. J. Arnold, P. Magnusson, S. Zdravkovic, and J. X. Zhou. 2009. “Technology Readiness and Usage: A Global- Identity Perspective.” Journal of the Academy of Marketing Science 37 (3): 250–65.
  • 52. Whetten, David A. 1989. “What Constitutes a Theoretical Contribution?.” Academy of Management Review 14 (4): 490- 495. Xiang, Z., V. P. Magnini, and D. R. Fesenmaier. 2015. “Information Technology and Consumer Behavior in Travel and Tourism: Insights from Travel Planning Using the Internet.” Journal of Retailing and Consumer Services 22:244–49. Xiang, Z., D. Wang, J. T. O’Leary, and D. R. Fesenmaier. 2015. “Adapting to the Internet: Trends in Travelers’ Use of the Web for Trip Planning.” Journal of Travel Research 54 (4): 511–27. Yoo, K.-H., and U. Gretzel. 2011. “Influence of Personality on Travel-Related Consumer-Generated Media Creation.” Computers in Human Behavior 27 (2): 609–21. Zeithaml, V. A., A. Parasuraman, and A. Malhotra. 2002. “Service Quality Delivery through Web Sites: A Critical Review of Wang et al. 577 Extant Knowledge.” Journal of the Academy of Marketing Science 30 (4): 362–75. Author Biographies Ying Wang is a senior lecturer with the Department of Tourism, Sport and Hotel Management at Griffith University. Her research interests lie in destination management and marketing, particularly
  • 53. topics of Chinese tourism, consumer experience with technolgies and responses to marketing stimulus. Kevin Kam Fung So, PhD, is an assistant professor in the School of Hotel, Restaurant and Tourism Management and a Research Associate in the SmartState Center of Economic Excellence in Tourism and Economic Development at the University of South Carolina. His research interests focus on services marketing and service management, with a special emphasis on customer engage- ment and interactions in social media, service branding, electronic word of mouth, and internal branding in the tourism and hospitality industry. Beverley A. Sparks is a professor with the Department of Tourism, Sport and Hotel Management at Griffith University, Australia. She is an active researcher, with a strong track record of grants and jour- nal publications. Her research interests lie in customer experience, electronic word of mouth and service failure/recovery in the tour- ism and hospitality industry.