📊 Conquer Your Stats Homework with These Top 10 Tips! 🚀
•Download as PPTX, PDF•
0 likes•3 views

Struggling with stats homework? Say no more! 📚 Our experts at StatisticsHomeworkHelper.com have curated the "Best 10 Tips to Solve Statistics Homework" just for you. 🔥 From probability hiccups to data dilemmas, our tips will guide you through. 🎯 No more stressing, just A+ grades and confidence to spare. 📌 What's in Store: ✅ Expert Techniques: Learn from the pros. ✅ 24/7 Availability: We match your schedule. ✅ Step-by-Step: Clear, concise problem-solving. ✅ Boosted Performance: Watch your grades rise. 🔗 Visit StatisticsHomeworkHelper.com and breeze through your stats assignments! 🌟

Recommended
Recommended
More Related Content
Similar to 📊 Conquer Your Stats Homework with These Top 10 Tips! 🚀
Similar to 📊 Conquer Your Stats Homework with These Top 10 Tips! 🚀 (20)
More from Statistics Homework Helper
More from Statistics Homework Helper (20)
Recently uploaded
Recently uploaded (20)
📊 Conquer Your Stats Homework with These Top 10 Tips! 🚀
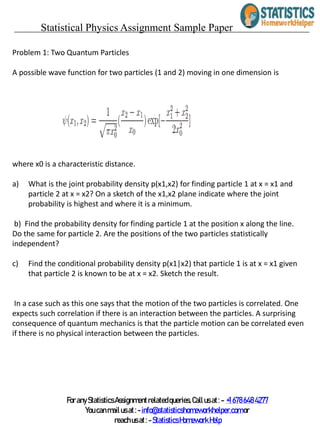
- 1. Problem 1: Two Quantum Particles A possible wave function for two particles (1 and 2) moving in one dimension is where x0 is a characteristic distance. a) What is the joint probability density p(x1,x2) for finding particle 1 at x = x1 and particle 2 at x = x2? On a sketch of the x1,x2 plane indicate where the joint probability is highest and where it is a minimum. b) Find the probability density for finding particle 1 at the position x along the line. Do the same for particle 2. Are the positions of the two particles statistically independent? c) Find the conditional probability density p(x1|x2) that particle 1 is at x = x1 given that particle 2 is known to be at x = x2. Sketch the result. In a case such as this one says that the motion of the two particles is correlated. One expects such correlation if there is an interaction between the particles. A surprising consequence of quantum mechanics is that the particle motion can be correlated even if there is no physical interaction between the particles. Statistical Physics Assignment Sample Paper ForanyStatisticsAssignmentrelatedqueries,Callusat: - +16786484277 Youcanmailusat:-info@statisticshomeworkhelper.comor reachusat: -StatisticsHomeworkHelp
- 2. Solution 1: Two Quantum Particles a) The figure on the left shows in a simple way the location of the maxima and minima of this probability density. On the right is a plot generated by a computer application, in this case Mathematica. ForanyStatisticsAssignmentrelatedqueries,Callusat: - +16786484277 Youcanmailusat:-info@statisticshomeworkhelper.comor reachusat: -StatisticsHomeworkHelp
- 3. (b) By symmetry, the result for p(x2) has the same functional form. By inspection of these two results one sees that p(x1; x2) = p(x1)p(x2), therefore x1 and x2 are not statistically independent . ForanyStatisticsAssignmentrelatedqueries,Callusat: - +16786484277 Youcanmailusat:-info@statisticshomeworkhelper.comor reachusat: -StatisticsHomeworkHelp
- 4. It appears that these particles are anti-social: they avoid each other. For those who have had some quantum mechanics, the (x1; x2) given here corresponds to two non-interacting spinless1 Fermi particles (particles which obey Fermi-Dirac statistics) in a harmonic oscillator potential. The ground and rst excited single particle states are used to construct the two-particle wavefunction. The wavefunction is antisymmetric in that it changes sign when the two particles are exchanged: (x2; x1) = (x1; x2). Note that this antisymmetric property precludes putting both particles in the same single particle state, for example both in the single particle ground state. For spinless particles obeying Bose-Einstein statistics (Bosons) the wavefunction must be symmetric under interchange of the two particles: (x2; x1) = (x1; x2). We can make such a wavefunction by replacing the term x1 x2 in the current wavefunction by x1 +x2. Under these circumstances p(x1jx2) could be substantial near x1 = x2. ForanyStatisticsAssignmentrelatedqueries,Callusat: - +16786484277 Youcanmailusat:-info@statisticshomeworkhelper.comor reachusat: -StatisticsHomeworkHelp
- 5. Problem 2: Pyramidal Density The joint probability density p(x, y) for two random variables x and y is given below. a) Find the probability density p(x) for the random variable x alone. Sketch the result. b) Find the conditional probability density p(y|x). Sketch the result. ForanyStatisticsAssignmentrelatedqueries,Callusat: - +16786484277 Youcanmailusat:-info@statisticshomeworkhelper.comor reachusat: -StatisticsHomeworkHelp
- 6. Solution 2: Pyramidal Density a) The tricky part here is getting correct limits on the integral that must be done to eliminate y from the probability density. It is clear that the integral must start at y = 0, but one must also be careful to get the correct upper limit. A simple sketch such as that at the right is helpful. (b) ForanyStatisticsAssignmentrelatedqueries,Callusat: - +16786484277 Youcanmailusat:-info@statisticshomeworkhelper.comor reachusat: -StatisticsHomeworkHelp
- 7. Note that this is simply a linear function of y. ForanyStatisticsAssignmentrelatedqueries,Callusat: - +16786484277 Youcanmailusat:-info@statisticshomeworkhelper.comor reachusat: -StatisticsHomeworkHelp
- 8. Problem 3: Stars a) Assume that the stars in a certain region of the galaxy are distributed at random with a mean density ρ stars per (light year)3. Find the probability density p(r) that a given star’s nearest neighbor occurs at a radial distance r away. [Hint: This is the exact analogue of the waiting time problem for radioactive decay, except that the space is 3 dimensional rather than 1 dimensional.] b) The acceleration aa of a given star due to the gravitational attraction of its neighbors is where ari is the vector position of the ith neighbor relative to the star in question and Mi is its mass. The terms in the sum fall off rapidly with increasing distance. For some purposes the entire sum can be approximated by its first term, that due to the nearest neighbor. In this approximation where r is the radial distance to the nearest neighbor and M is its mass. b) Find an expression which relates p(a) to p(r). In what region of p(a) would you expect the greatest error due to the neglect of distant neighbors? ForanyStatisticsAssignmentrelatedqueries,Callusat: - +16786484277 Youcanmailusat:-info@statisticshomeworkhelper.comor reachusat: -StatisticsHomeworkHelp
- 9. c) Next assume that the stars are distributed at random in space with a uniform density ρ. Use the results of a) to find p(a). In astrophysics, this is known as the Holtsmark Distribution. It is known that the assumption of uniformly distributed stars breaks down at short distances due to the occurrence of gravitationally bound complexes (binary stars, etc.). In which region of p(a) would you expect to see deviations from your calculated result due to this effect? d) What other probabilistic aspect of the problem (i.e. what other random variable) would have to be taken into account before our p(a) could be compared with experimental observations? ForanyStatisticsAssignmentrelatedqueries,Callusat: - +16786484277 Youcanmailusat:-info@statisticshomeworkhelper.comor reachusat: -StatisticsHomeworkHelp
- 10. Solution 3:Stars a)First consider the quantity p(no stars in a sphere of radius r). Since the stars are distributed at random with a mean density one can treat the problem as a Poisson process in three dimensions with the mean number of stars in the volume V given by <n>=V=4r3. Thus Next consider the quantity p(at least one star in a shell between r and r+dr). When the differential volume element involved is so small that the expected number of stars within it is much less than one, this quantity can be replaced by p(exactly one star in a shell between r and r+dr).Now the volume element is that of the shell and <n>=V=4r2dr. Thus Now p(r) is defined as the probability density for the event “the first star occurs between r and r+dr". Since the positions of the stars are (in this model) statistically independent, this can be written as the product of the two separate probabilities found above. ForanyStatisticsAssignmentrelatedqueries,Callusat: - +16786484277 Youcanmailusat:-info@statisticshomeworkhelper.comor reachusat: -StatisticsHomeworkHelp
- 11. Dividing out the differential dr and being careful about the range of applicability leaves us with ForanyStatisticsAssignmentrelatedqueries,Callusat: - +16786484277 Youcanmailusat:-info@statisticshomeworkhelper.comor reachusat: -StatisticsHomeworkHelp
- 12. b) Now we want to find the probability density function for the acceleration random variable a when a = GM=r2, where r is the distance to a nearest neighbor star of mass M. Distant neighbors will produce small forces and accelerations, so their eect on p(a) will be greatest when a is small. [For a dierent approach, see the notes on the last page of this solution set.] c) We use the pr(r) found in a): to calculate ForanyStatisticsAssignmentrelatedqueries,Callusat: - +16786484277 Youcanmailusat:-info@statisticshomeworkhelper.comor reachusat: -StatisticsHomeworkHelp
- 13. If there are binary stars and other complex units at close distances, these will have the greatest eect when r is small or when a is large. d) The model considered here assumes all neighbor stars have the same mass M. To improve the model, one should consider a distribution of M values. One could even include the binary stars and other complex units, from part (b), with a suitable distribution. ForanyStatisticsAssignmentrelatedqueries,Callusat: - +16786484277 Youcanmailusat:-info@statisticshomeworkhelper.comor reachusat: -StatisticsHomeworkHelp
- 14. Problem 4: Kinetic Energies in Ideal Gasses For an ideal gas of classical non-interacting atoms in thermal equilibrium the cartesian components of the velocity are statistically independent. In three dimensions where σ2 = kT/m. The energy of a given atom is E = 1m|av|2. a) Find the probability density for the energy of an atom in the three dimensional gas, p(E). Is it Gaussian? It is possible to create an ideal two dimensional gas. For example, noble gas atoms might be physically adsorbed on a microscopically smooth substrate; they would be bound in the perpendicular direction but free to move parallel to the surface. b) Find p(E) for the two dimensional gas. Is it Gaussian? Solution 4: Kinetic Energies in an Ideal Gasses In this problem the kinetic energy E is a function of three random variables (vx; vy; vz) in three dimensions, two random variables (vx; vy) in two dimensions, and just one random variable, vx, in one dimension. a) In three dimensions ForanyStatisticsAssignmentrelatedqueries,Callusat: - +16786484277 Youcanmailusat:-info@statisticshomeworkhelper.comor reachusat: -StatisticsHomeworkHelp
- 15. and the probability density for the three velocity random variables is Following our general procedure, we want first to calculate the cumulative probability function P(E), which is the probability that the kinetic energy will have a value which is less than or equal to E. To nd P(E) we need to integrate p(vx; vy; vz) over all regions of (vx; vy; vz) that correspond to 1 (v2 + v2 + v2 2 x y z ) E. That region in (vx; vy; vz) space is just a sphere of radius 2E=m centered at the origin. The integral is most easily done in spherical polar coordinates where This gives ForanyStatisticsAssignmentrelatedqueries,Callusat: - +16786484277 Youcanmailusat:-info@statisticshomeworkhelper.comor reachusat: -StatisticsHomeworkHelp
- 16. Thus (substituting m2 = kT) You can use this to calculate < E >= 32kT. [For a dierent approach, see the notes on the last page of this solution set.] b) In two dimensions and the probability density for the two velocity random variables is To find P(E) we need to integrate p(vx; vy) over all regions of (vx; vy) that correspond to 12 (v2x+ v2y) E. That region in (vx; vy) space is just a circle of radius p2E=m centered at the origin. ForanyStatisticsAssignmentrelatedqueries,Callusat: - +16786484277 Youcanmailusat:-info@statisticshomeworkhelper.comor reachusat: -StatisticsHomeworkHelp
- 17. The integral is most easily done in polar coordinates where This gives Thus (substituting m2 = kT) You can use this to calculate < E >= kT. ForanyStatisticsAssignmentrelatedqueries,Callusat: - +16786484277 Youcanmailusat:-info@statisticshomeworkhelper.comor reachusat: -StatisticsHomeworkHelp
- 18. c) In one dimension (not required) and the probability density for the single velocity random variable is To nd P(E) we need to integrate p(vx) overall regions of v that correspond to 12v2 x x E. That region in vx space is just a line from 2E=m to 2E=m Thus (substituting m2 = kT) You can use this to calculate < E >= 12kT. ForanyStatisticsAssignmentrelatedqueries,Callusat: - +16786484277 Youcanmailusat:-info@statisticshomeworkhelper.comor reachusat: -StatisticsHomeworkHelp
- 19. Problem 5: Measuring an Atomic Velocity Profile Atoms emerge from a source in a well collimated beam with velocities av = vxˆx directed horizontally. They have fallen a distance s under the influence of gravity by the time they hit a vertical target located a distance d from the source. where A = 21gd2 is a constant. An empirical fit to measurements at the target give the following probability density px(ζ) for an atom striking the target at position s. ForanyStatisticsAssignmentrelatedqueries,Callusat: - +16786484277 Youcanmailusat:-info@statisticshomeworkhelper.comor reachusat: -StatisticsHomeworkHelp
- 20. Find the probability density p vx(η) for the velocity at the source. Sketch the result. Solution 5: Atomic Velocity Profile ForanyStatisticsAssignmentrelatedqueries,Callusat: - +16786484277 Youcanmailusat:-info@statisticshomeworkhelper.comor reachusat: -StatisticsHomeworkHelp
- 21. In this problem we have two random variables related by s = A=v2x. We are given ps() and are to nd p(vx). To nd the probability P(v) that vx v we must calculate the probability that s A=v2. This is (the only possible values of vx are 0) ForanyStatisticsAssignmentrelatedqueries,Callusat: - +16786484277 Youcanmailusat:-info@statisticshomeworkhelper.comor reachusat: -StatisticsHomeworkHelp
- 22. Problem 6: Planetary Nebulae During stellar evolution, a low mass star in the “red supergiant” phase (when fusion has nearly run its course) may blow off a sizable fraction of its mass in the form of an expanding spherical shell of hot gas. The shell continues to be excited by radiation from the hot star at the center. This glowing shell is referred to by astronomers as a planetary nebula (a historical misnomer) and often appears as a bright ring. We will investigate how a shell becomes a ring. One could equally ask “What is the shadow cast by a semitransparent balloon?” A photograph of a planetary nebula records the amount of matter having a given radial distance r⊥ from the line of sight joining the central star and the observer. Assume that the gas atoms are uniformly distributed over a spherical shell of radius R centered on the parent star. What is the probability density p(r⊥) that a given atom will be located a perpendicular distance r⊥ from the line of sight? [Hint: If one uses a spherical coordinate system (r, θ, φ) where θ = 0 indicates the line of sight, then r⊥ = r sin θ. P(r⊥) corresponds to that fraction of the sphere with Rsin θ<r⊥. Note: not all planetary nebula are as well behaved as the two shown above. Visit the Astronomy Picture of the Day and search under planetary nebula to see the unruly but beautiful evolution of most planetary nebulae. ForanyStatisticsAssignmentrelatedqueries,Callusat: - +16786484277 Youcanmailusat:-info@statisticshomeworkhelper.comor reachusat: -StatisticsHomeworkHelp
- 23. Solution 6: Planetary Nebulae In this problem we are looking at matter distributed with equal probability over a spherical shell of radius R. When we look at it from a distance it appears as a ring because we are looking edgewise through the shell (and see much more matter) near the outer edge of the shell. If we choose coordpinates so that the z axis points from the shell to us as observers on the earth, then r? = x2 + y2 = R sin will be the radius of the ring that we observe. The task for this problem is to nd a probability distribution function p(r?) for the amount of matter that seems to us to be in a ring of radius r?. This is a function of the two random variables and , which are the angular coordinates locating a point on the shell of the planetary nebula. Since the nebulae are spherically symmetric shells, we know that We want rst to nd P(r), the probability that the perpendicular distance from the line ?of sight is less than or equal to r. Since r= R sin , that is equal to the probability that ?? sin r=R as indicated in the gure above. This corresponds to the two polar patches on ?the nebula: 0 sin1(r =R) in the top" hemisphere and sin1(r =R) ? ? in the bottom" hemisphere. ForanyStatisticsAssignmentrelatedqueries,Callusat: - +16786484277 Youcanmailusat:-info@statisticshomeworkhelper.comor reachusat: -StatisticsHomeworkHelp
- 24. Here, we have found the probability density with respect to the variable a(r)=GMr2 by first considering the cumulative probability, Where the integration region is over all values of r satisfying the inequality, and then taking the derivative to get the density: ForanyStatisticsAssignmentrelatedqueries,Callusat: - +16786484277 Youcanmailusat:-info@statisticshomeworkhelper.comor reachusat: -StatisticsHomeworkHelp
- 25. If one is comfortable with conside ring densities with respect to different variables, it is quicker to relate the densities directly using this last formula: the delta function just picks out the density with respect to a whenever GM=r2a. Here, the relation is monotonic, and so relating the densities is straight-forward, as the delta just picks out a single value. Recalling we have The two densities are just related by the Jacobian, as we would expect. The method can be used more generally, when the relationships between variables can be one to many, and when we consider probability distributions with more than one random variable. ForanyStatisticsAssignmentrelatedqueries,Callusat: - +16786484277 Youcanmailusat:-info@statisticshomeworkhelper.comor reachusat: -StatisticsHomeworkHelp
- 26. Again, using the formula derived earlier relating the densities with respect to different variables, we can directly write The delta function now picks out the two solutions of the equality, and we find immediately ForanyStatisticsAssignmentrelatedqueries,Callusat: - +16786484277 Youcanmailusat:-info@statisticshomeworkhelper.comor reachusat: -StatisticsHomeworkHelp